Performance Analysis and Optimization of Central Receiver Solar Thermal Power Plants for Utility Scale Power Generation


Abstract
1. Introduction
2. Literature Review
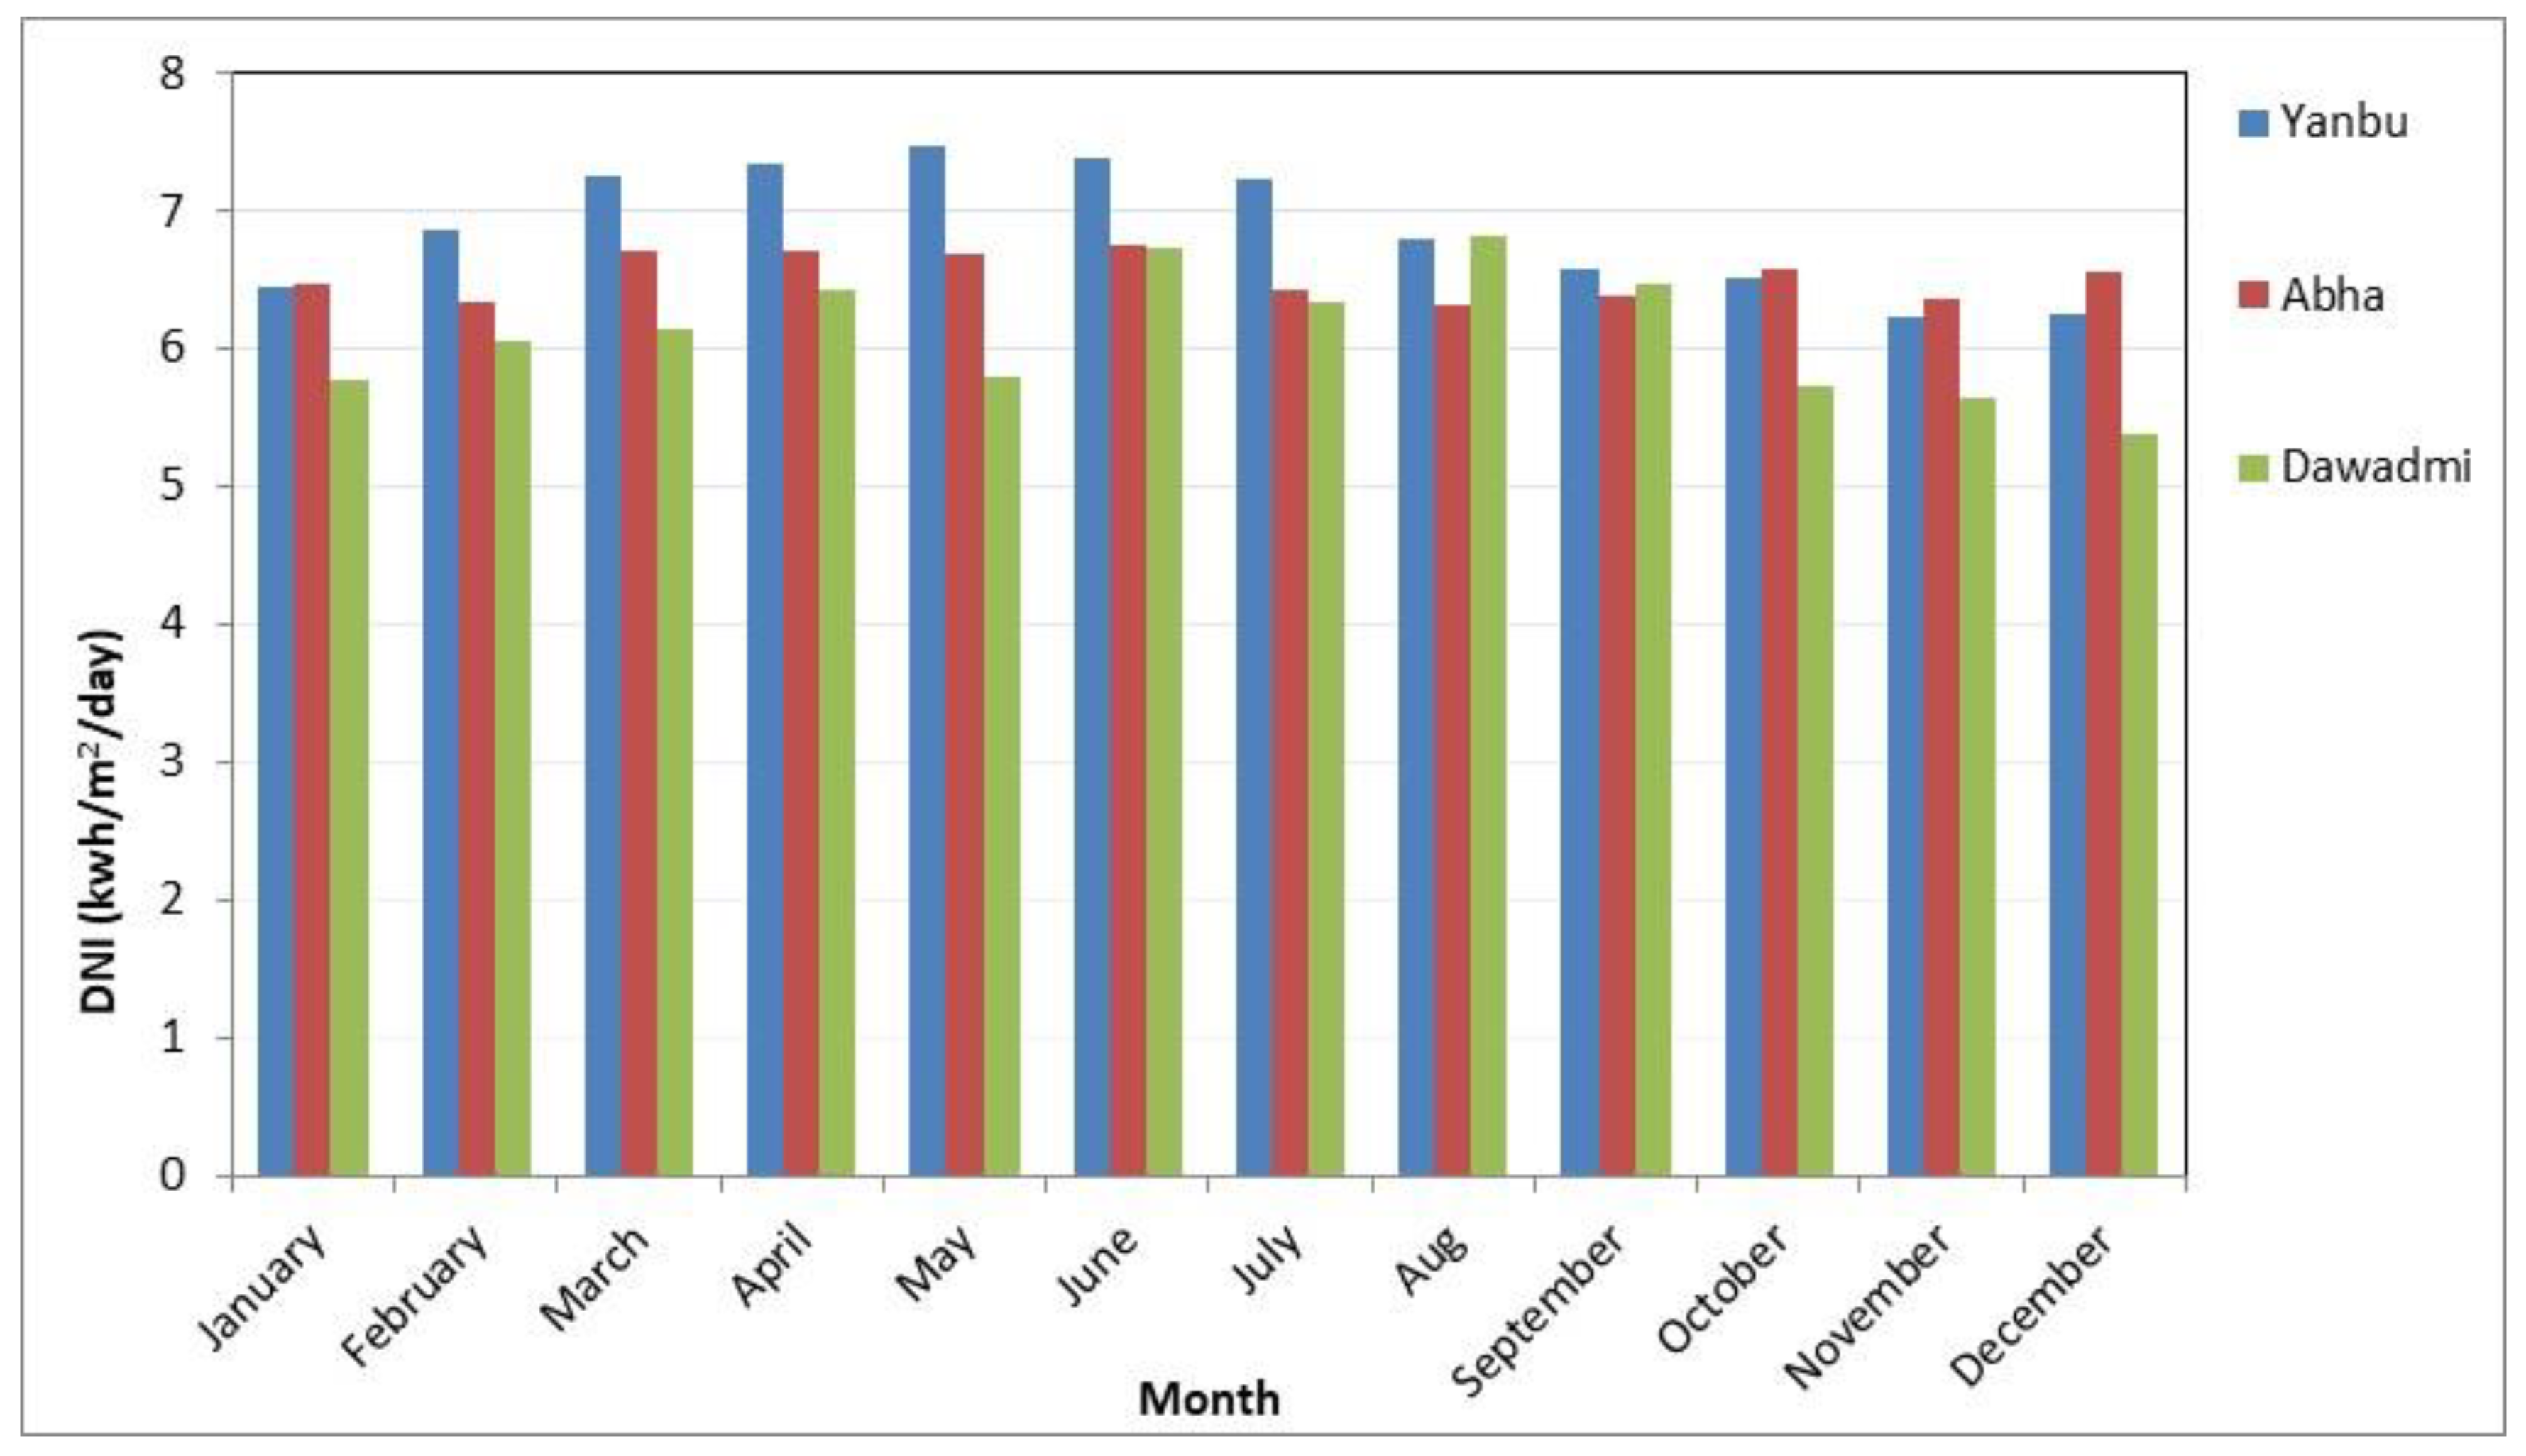
3. Selecting the Site and Assessing the Solar Resource
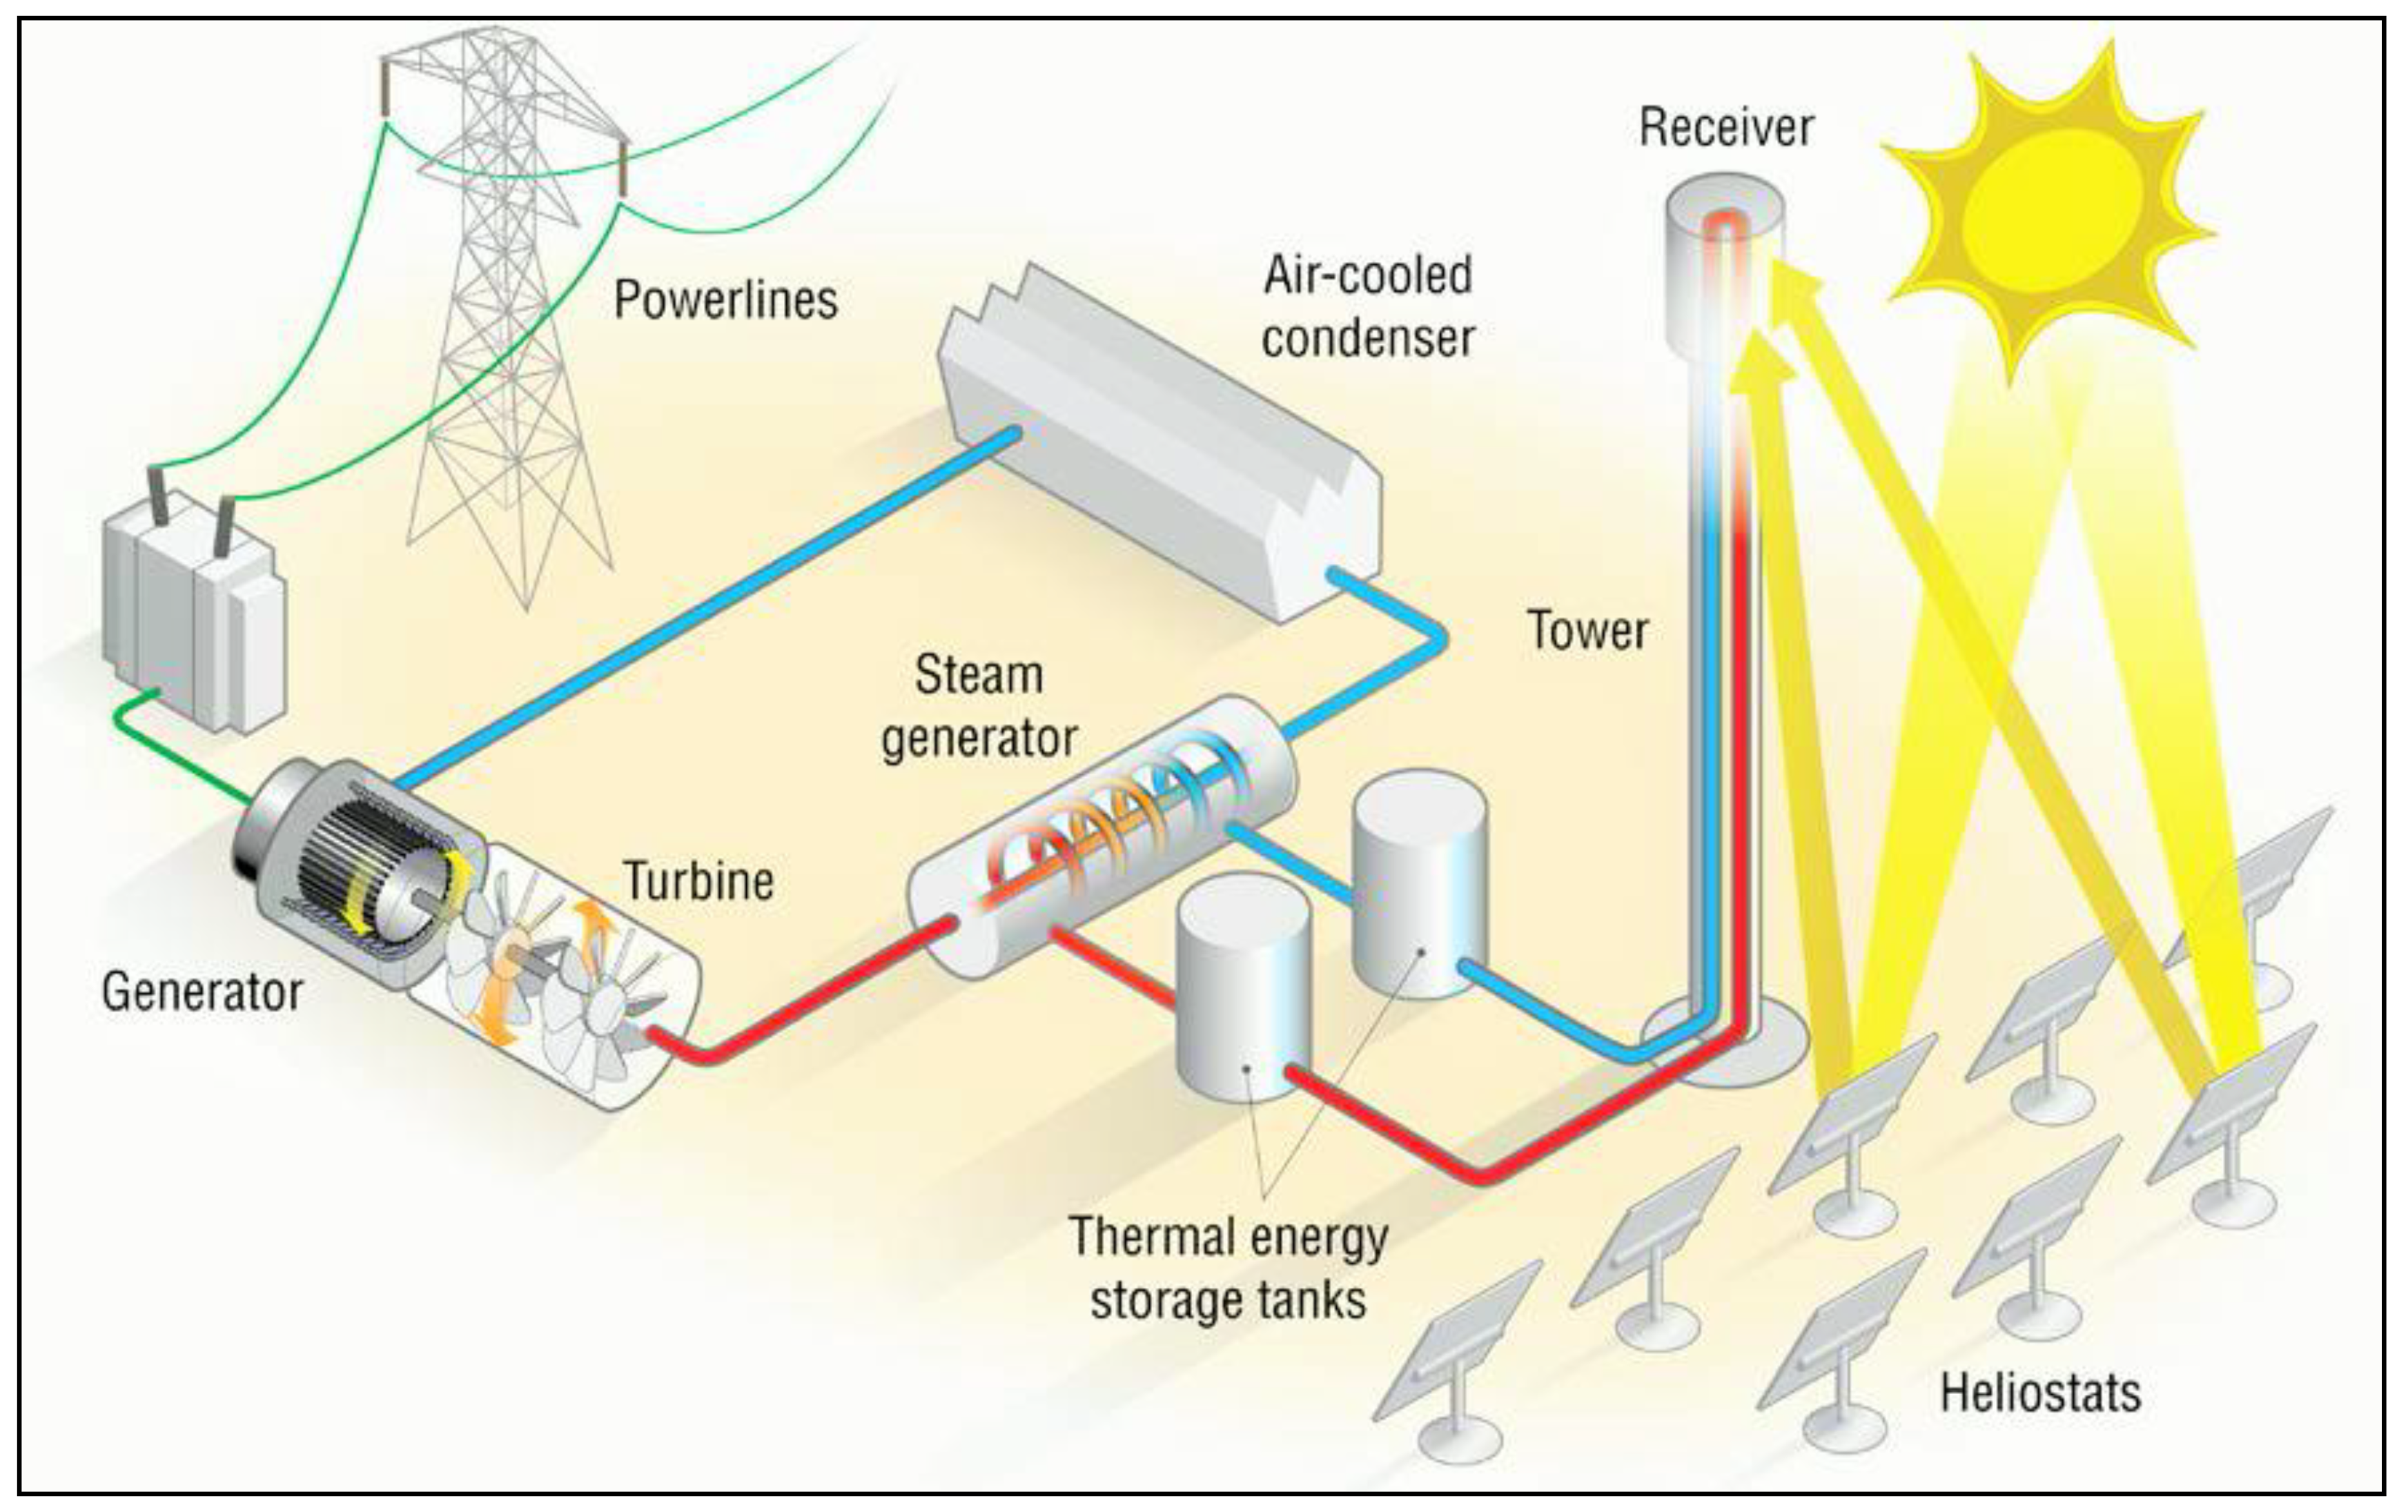
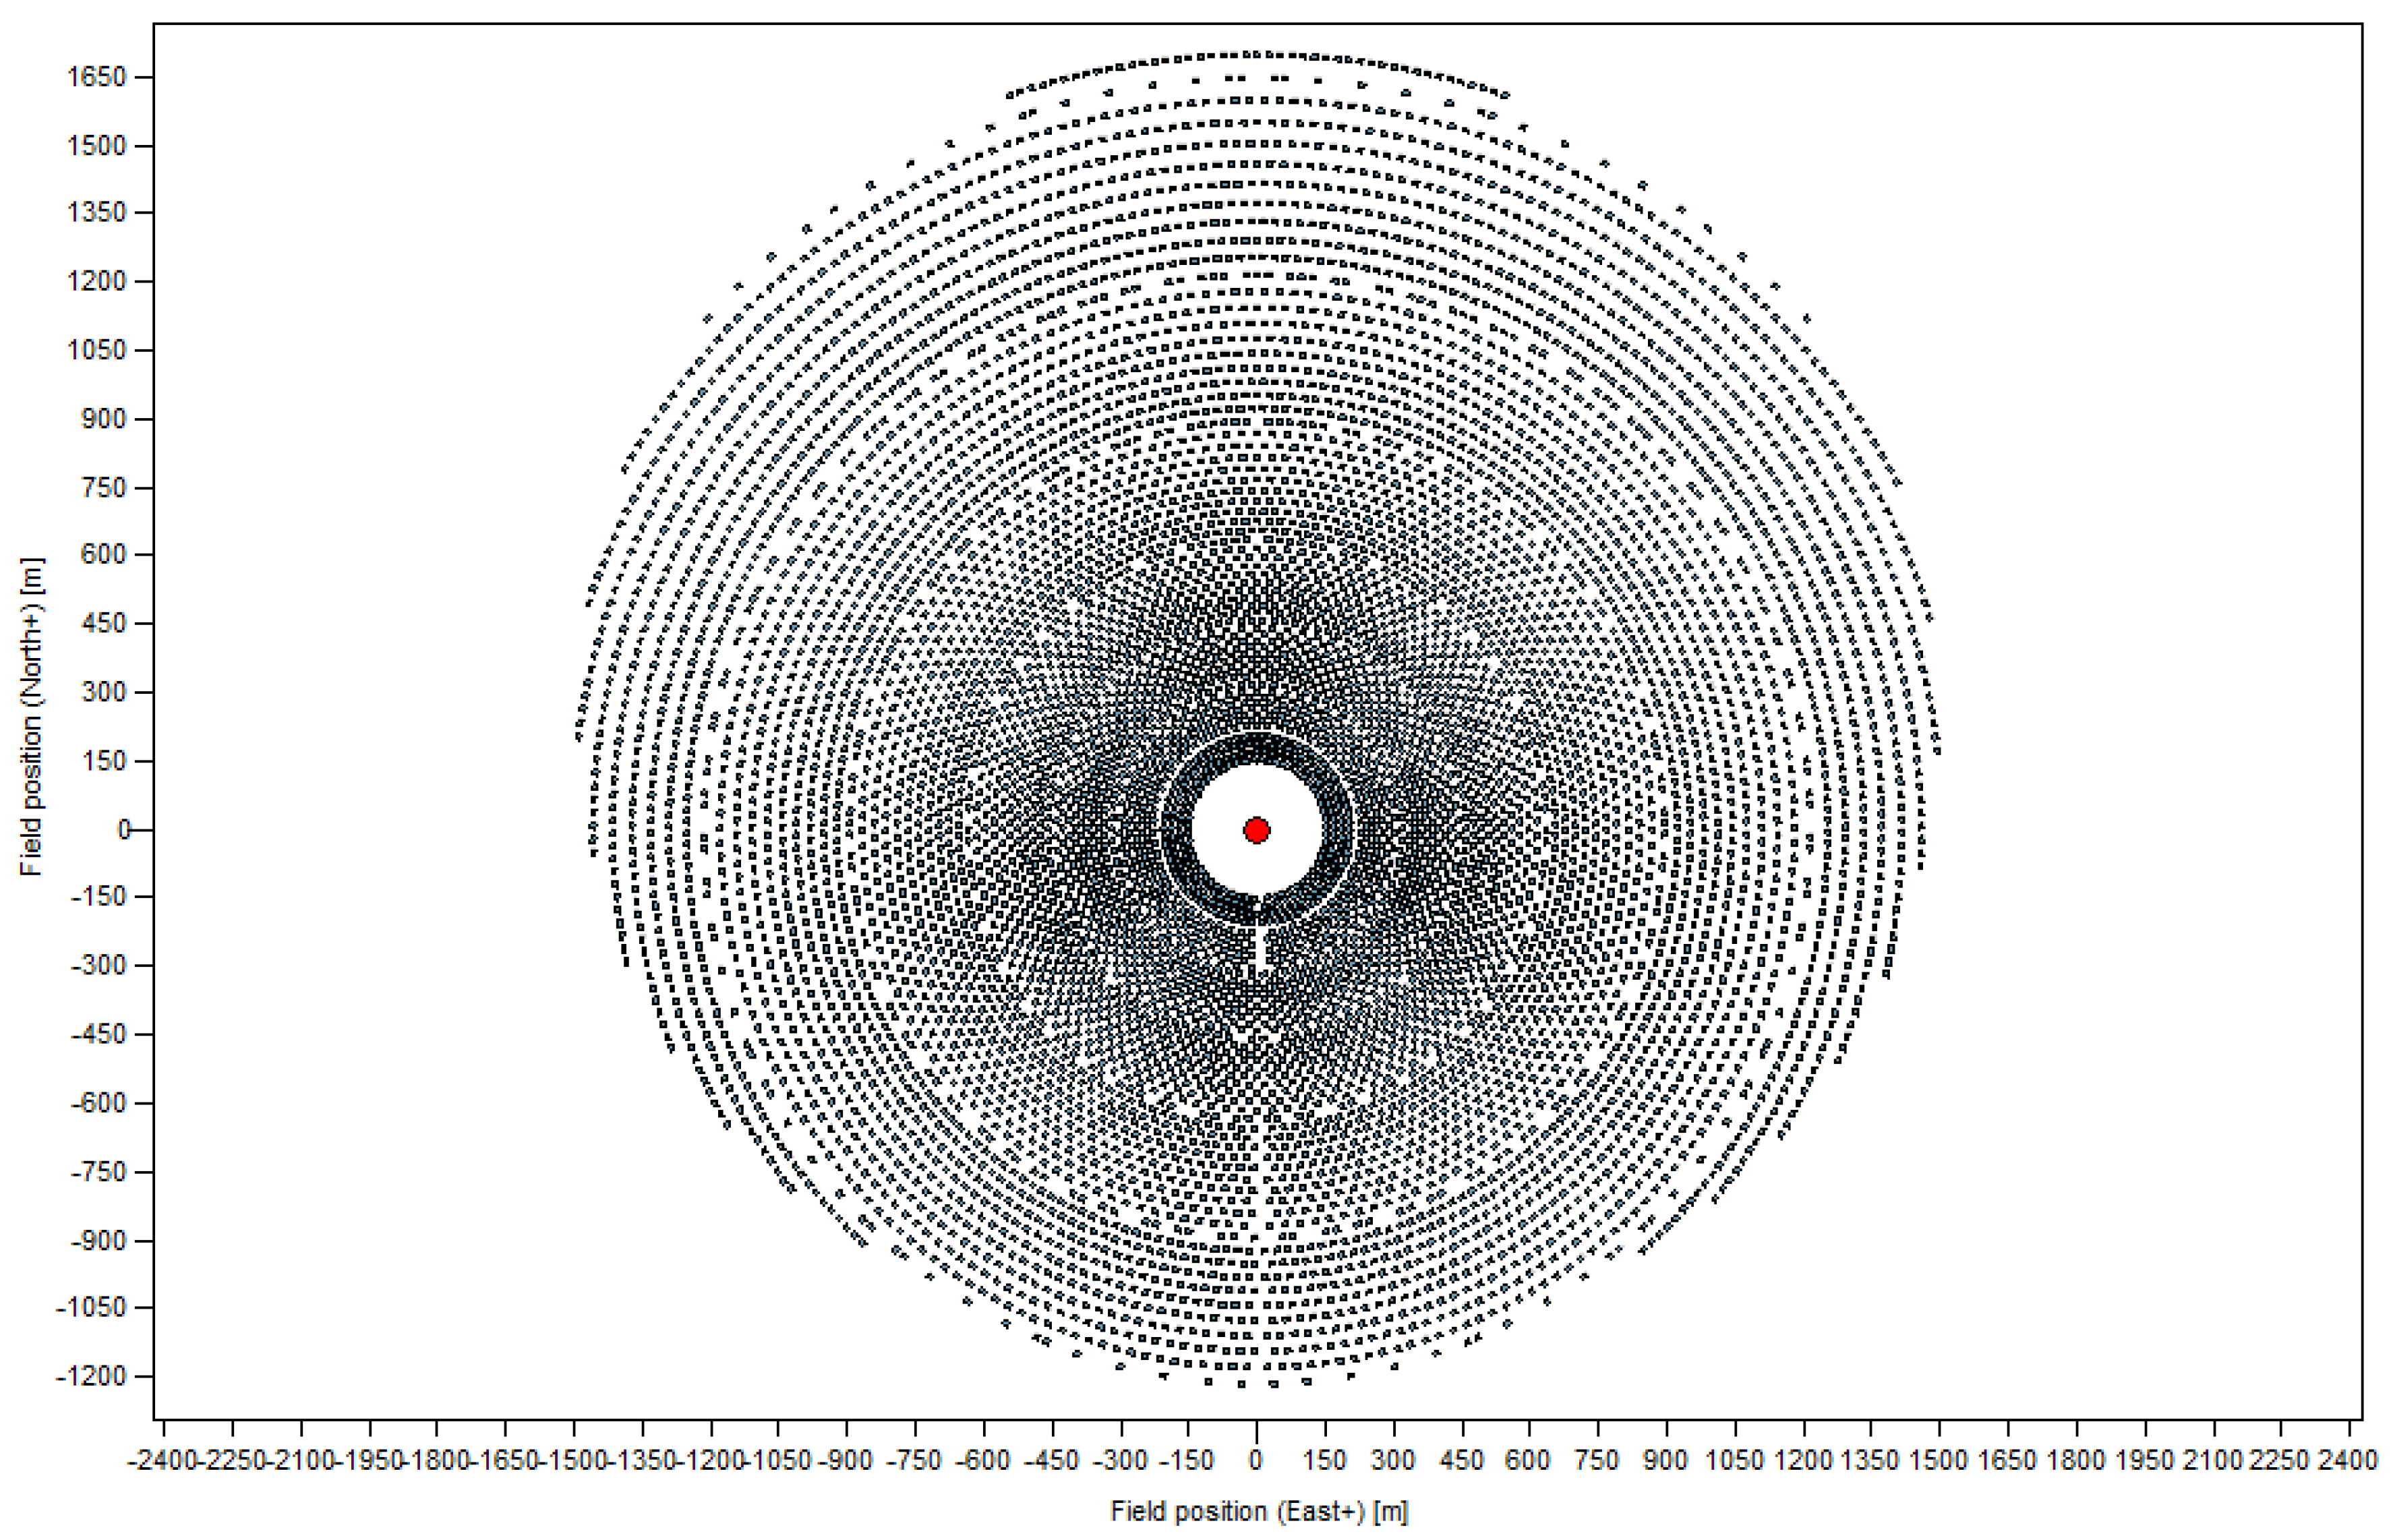
4. Design of the 100MW Central Receiver Solar Thermal Power Plant
Characteristics of the Proposed CSP Plant Design
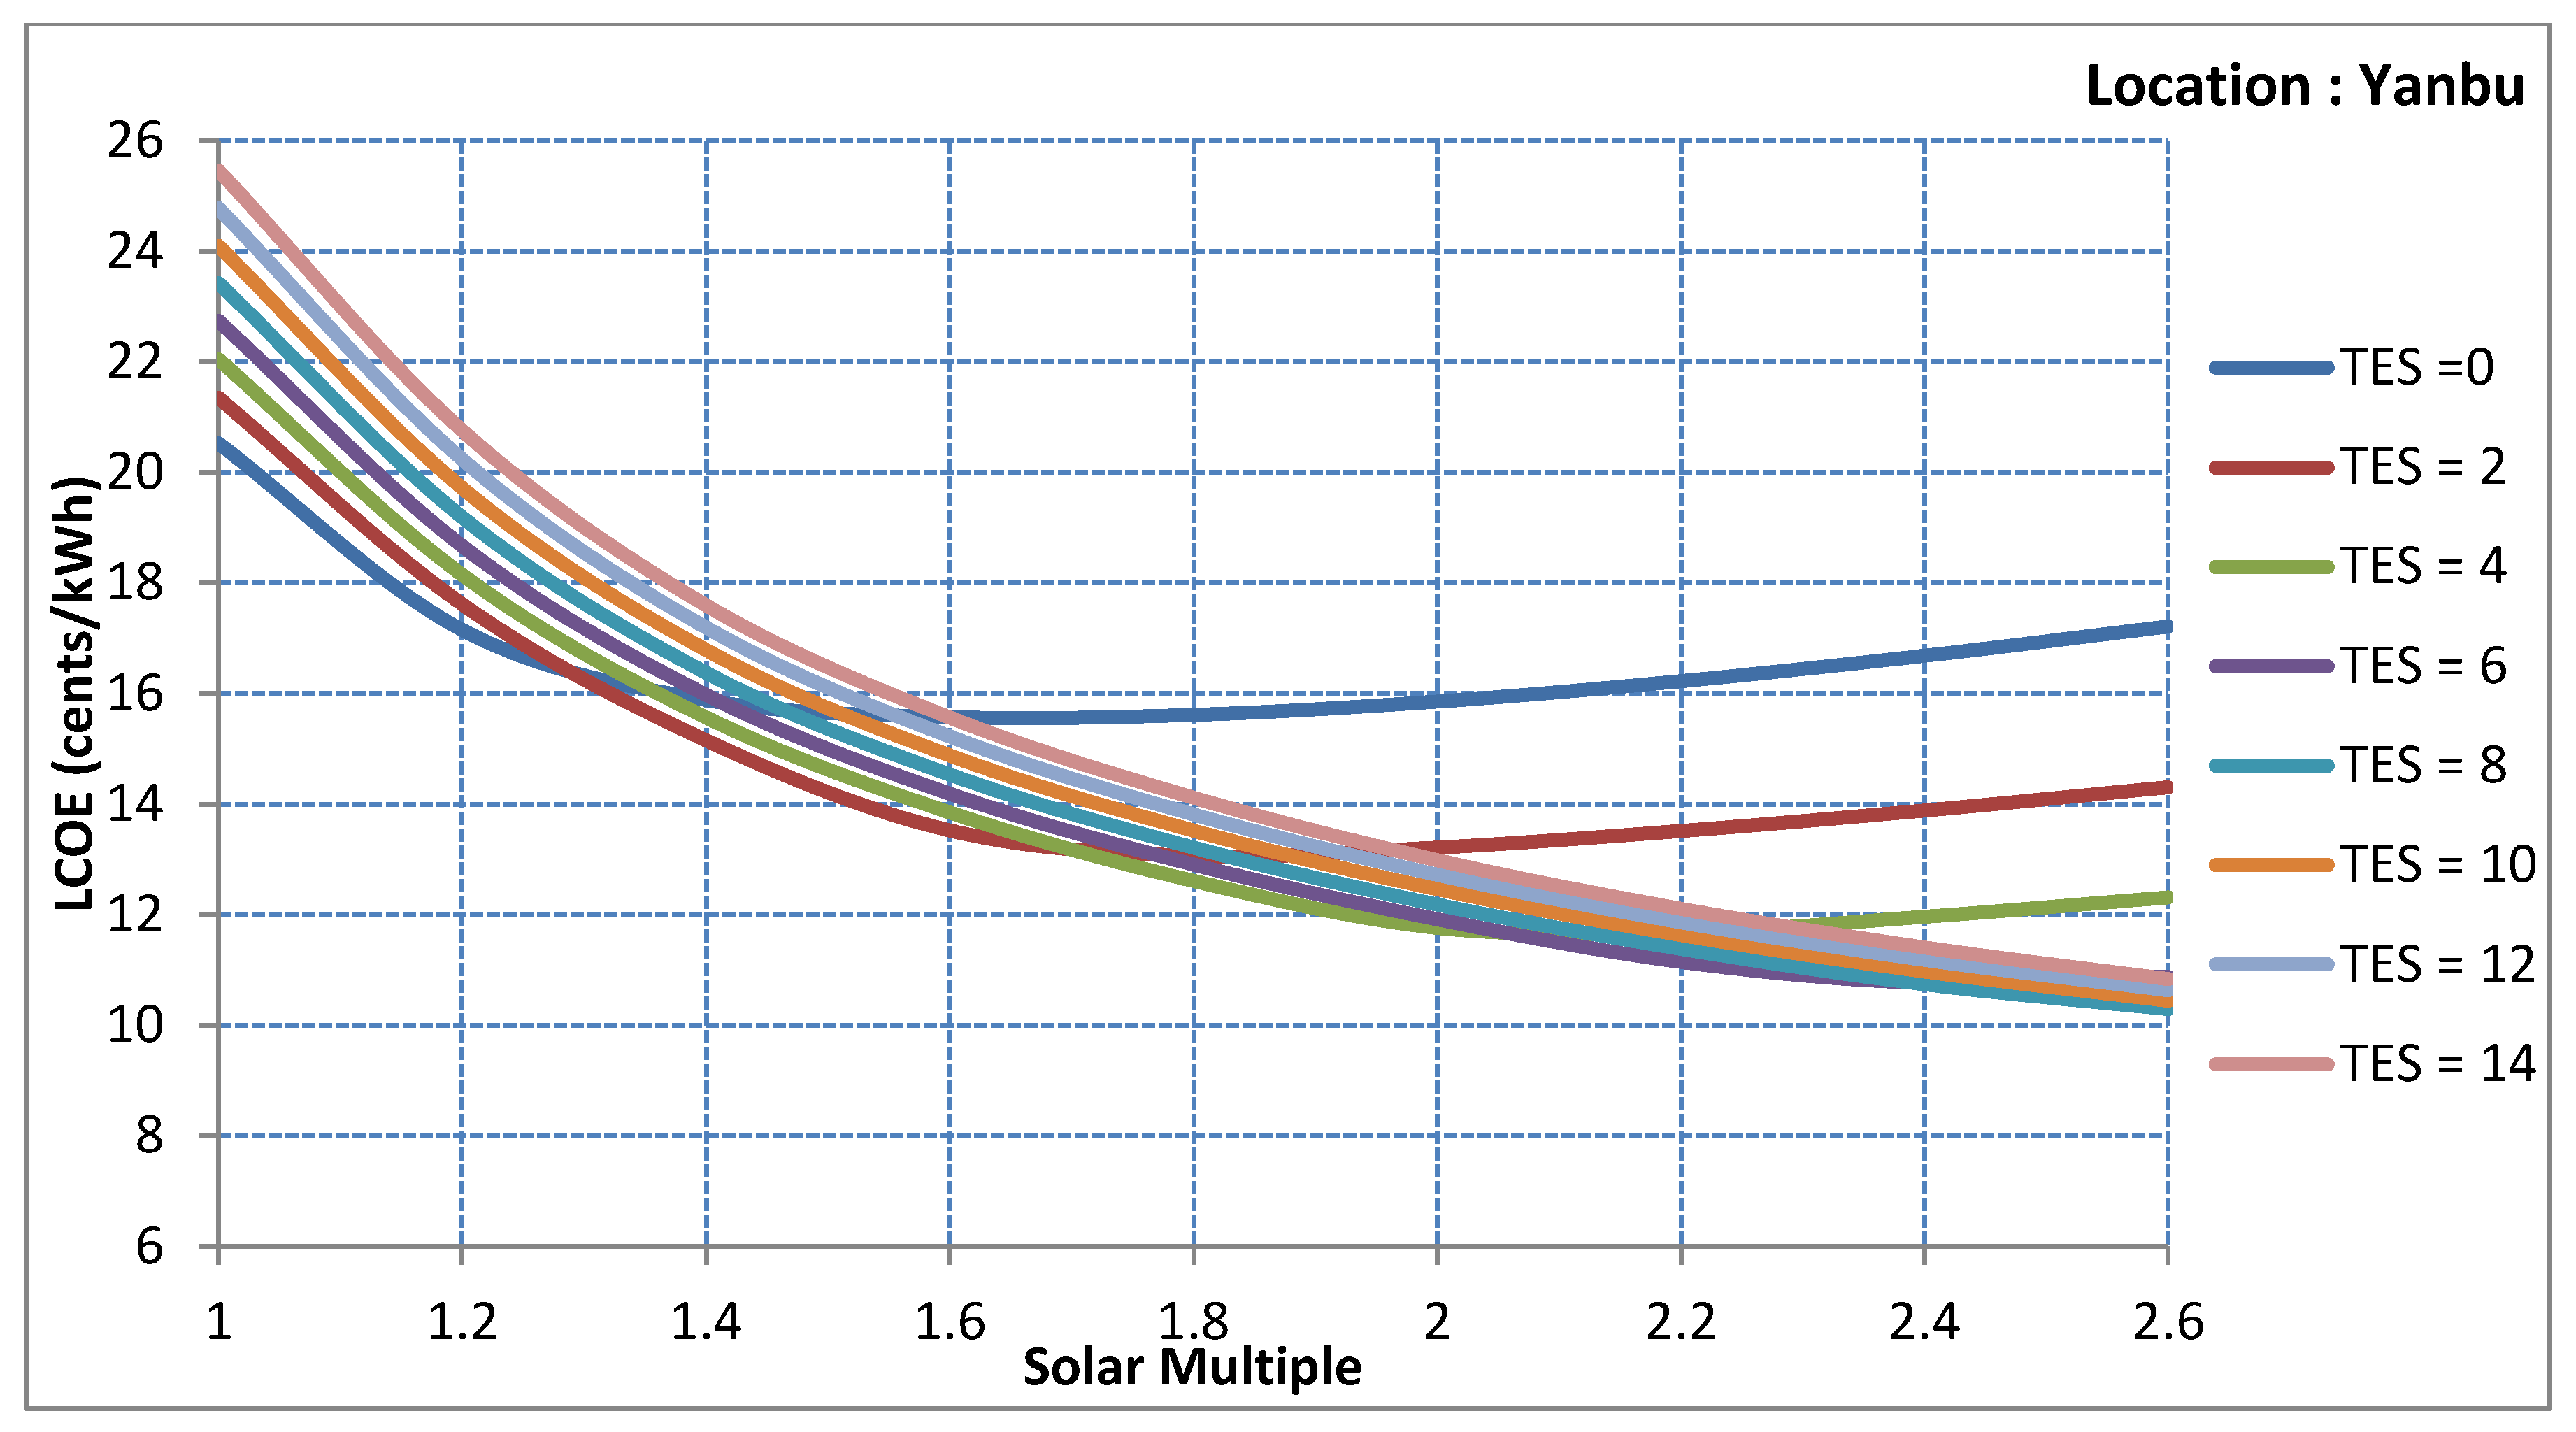
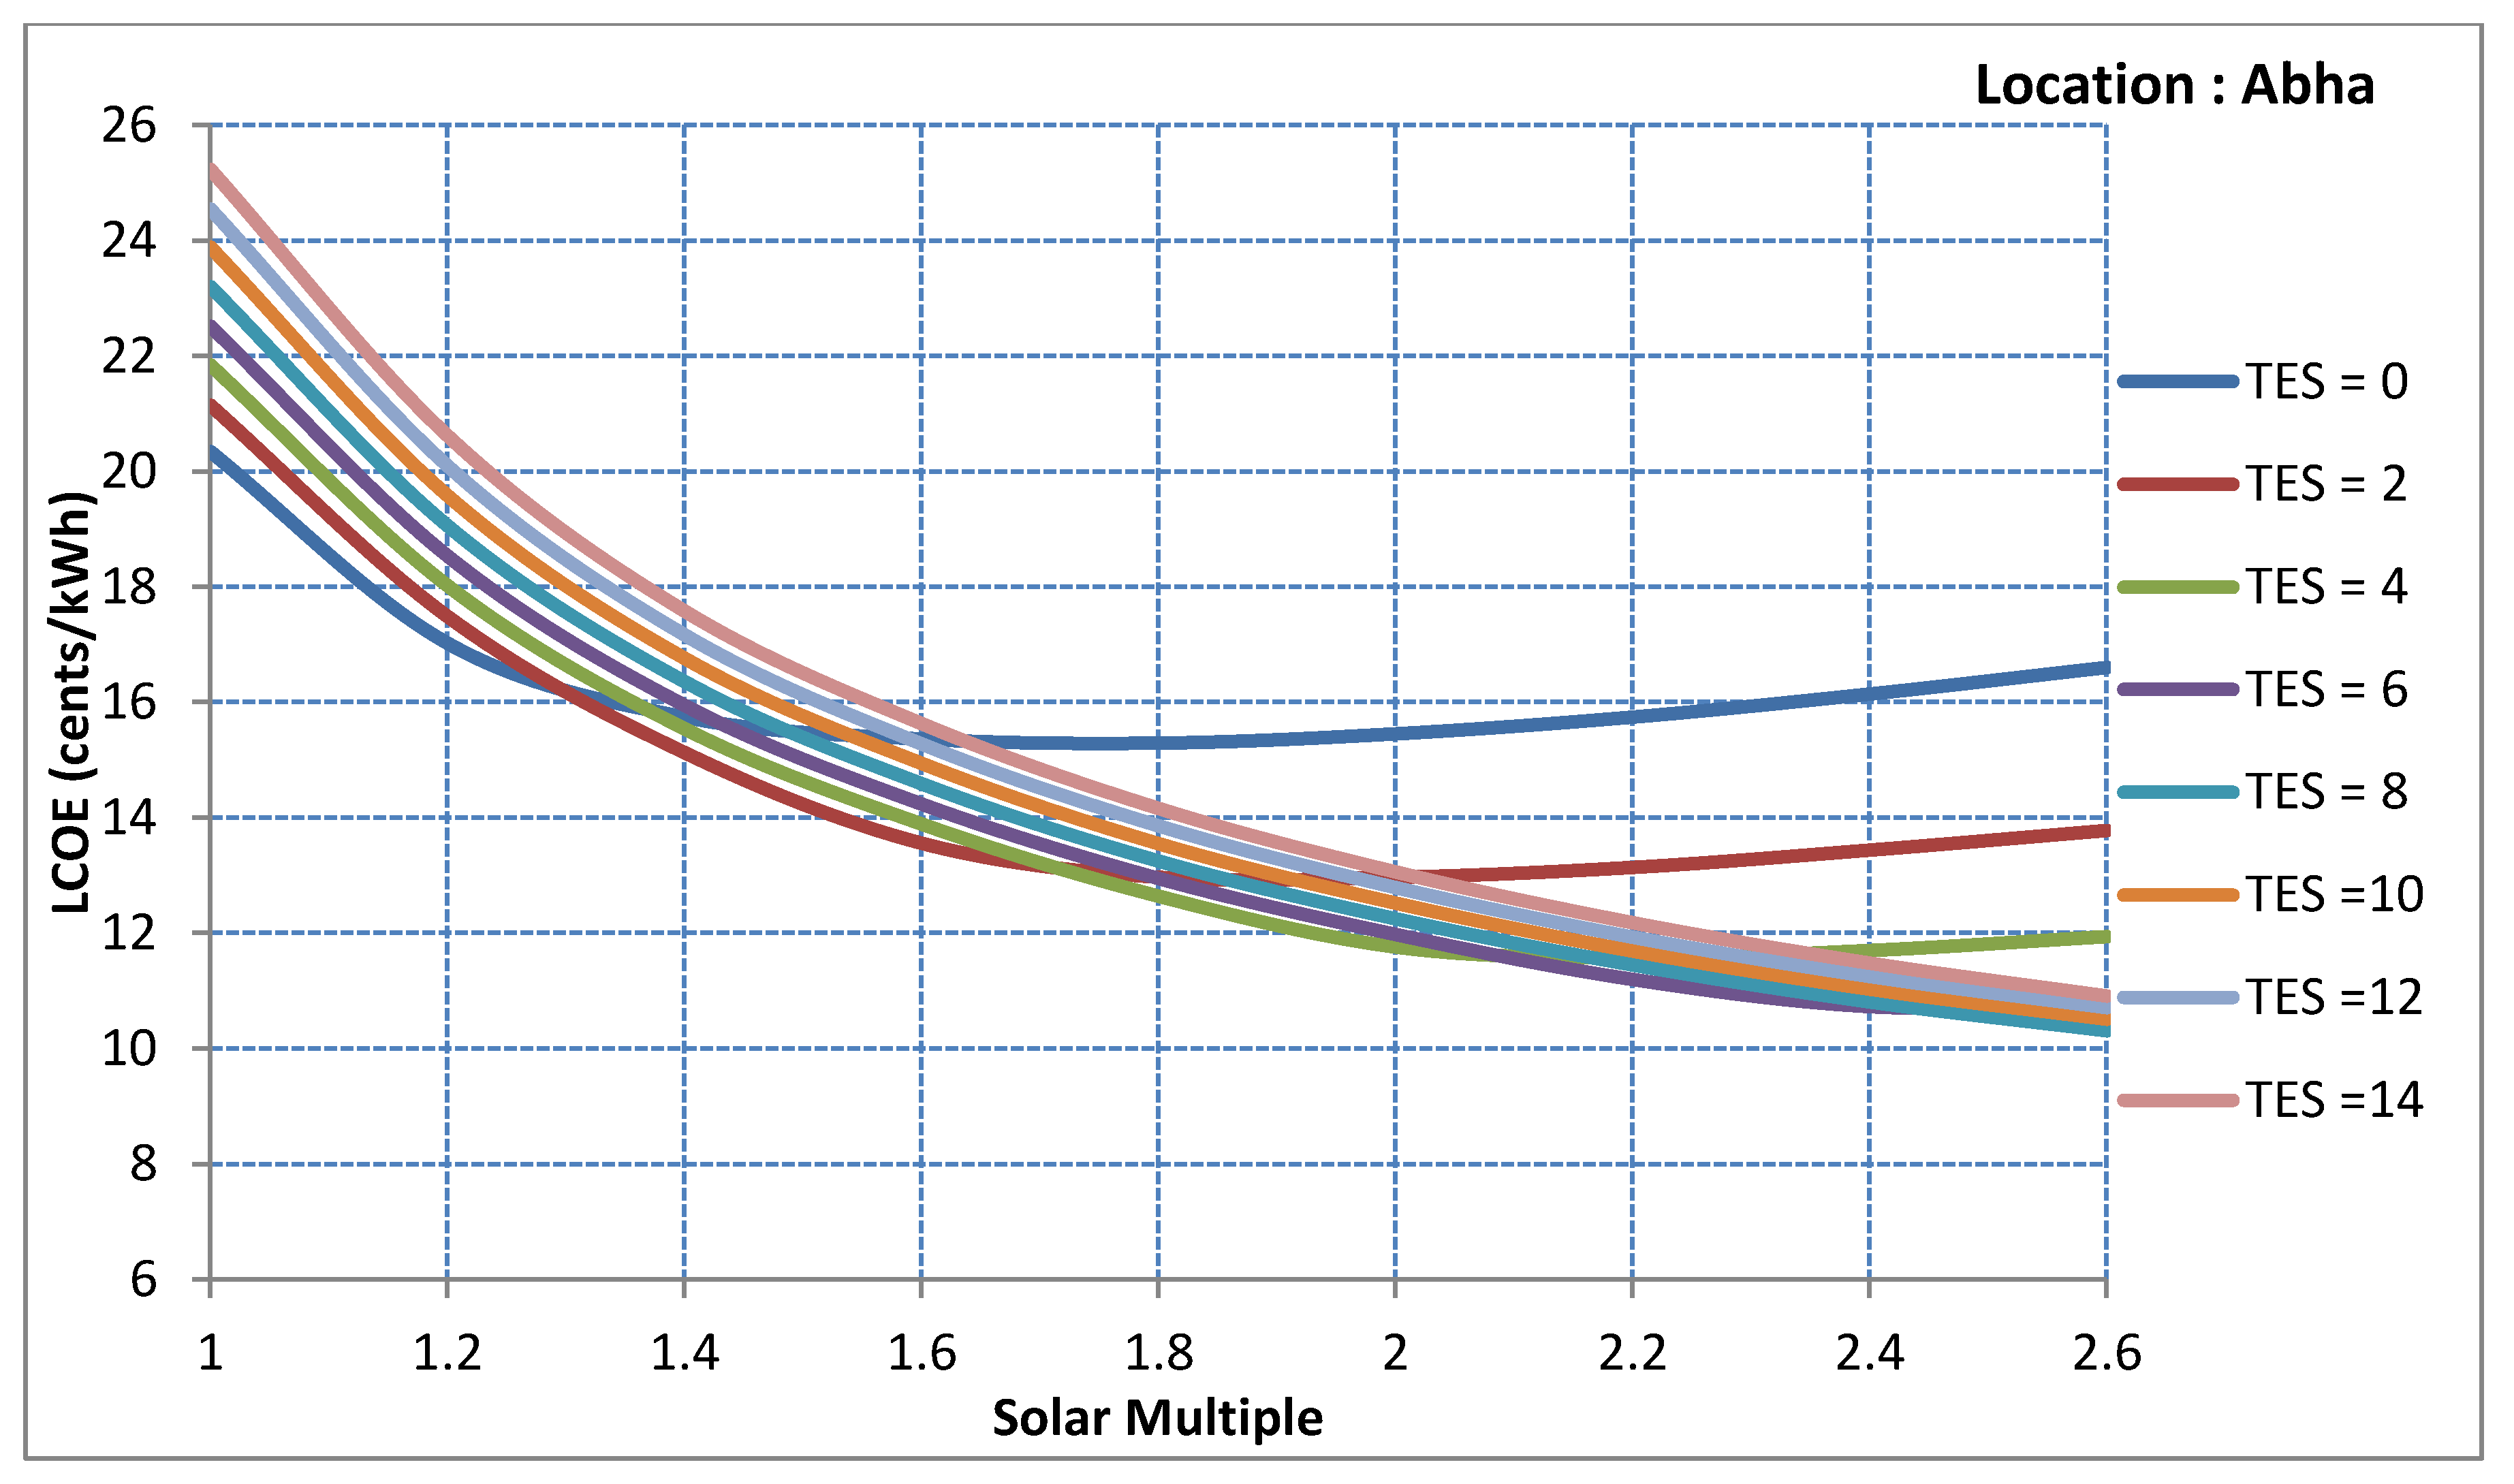
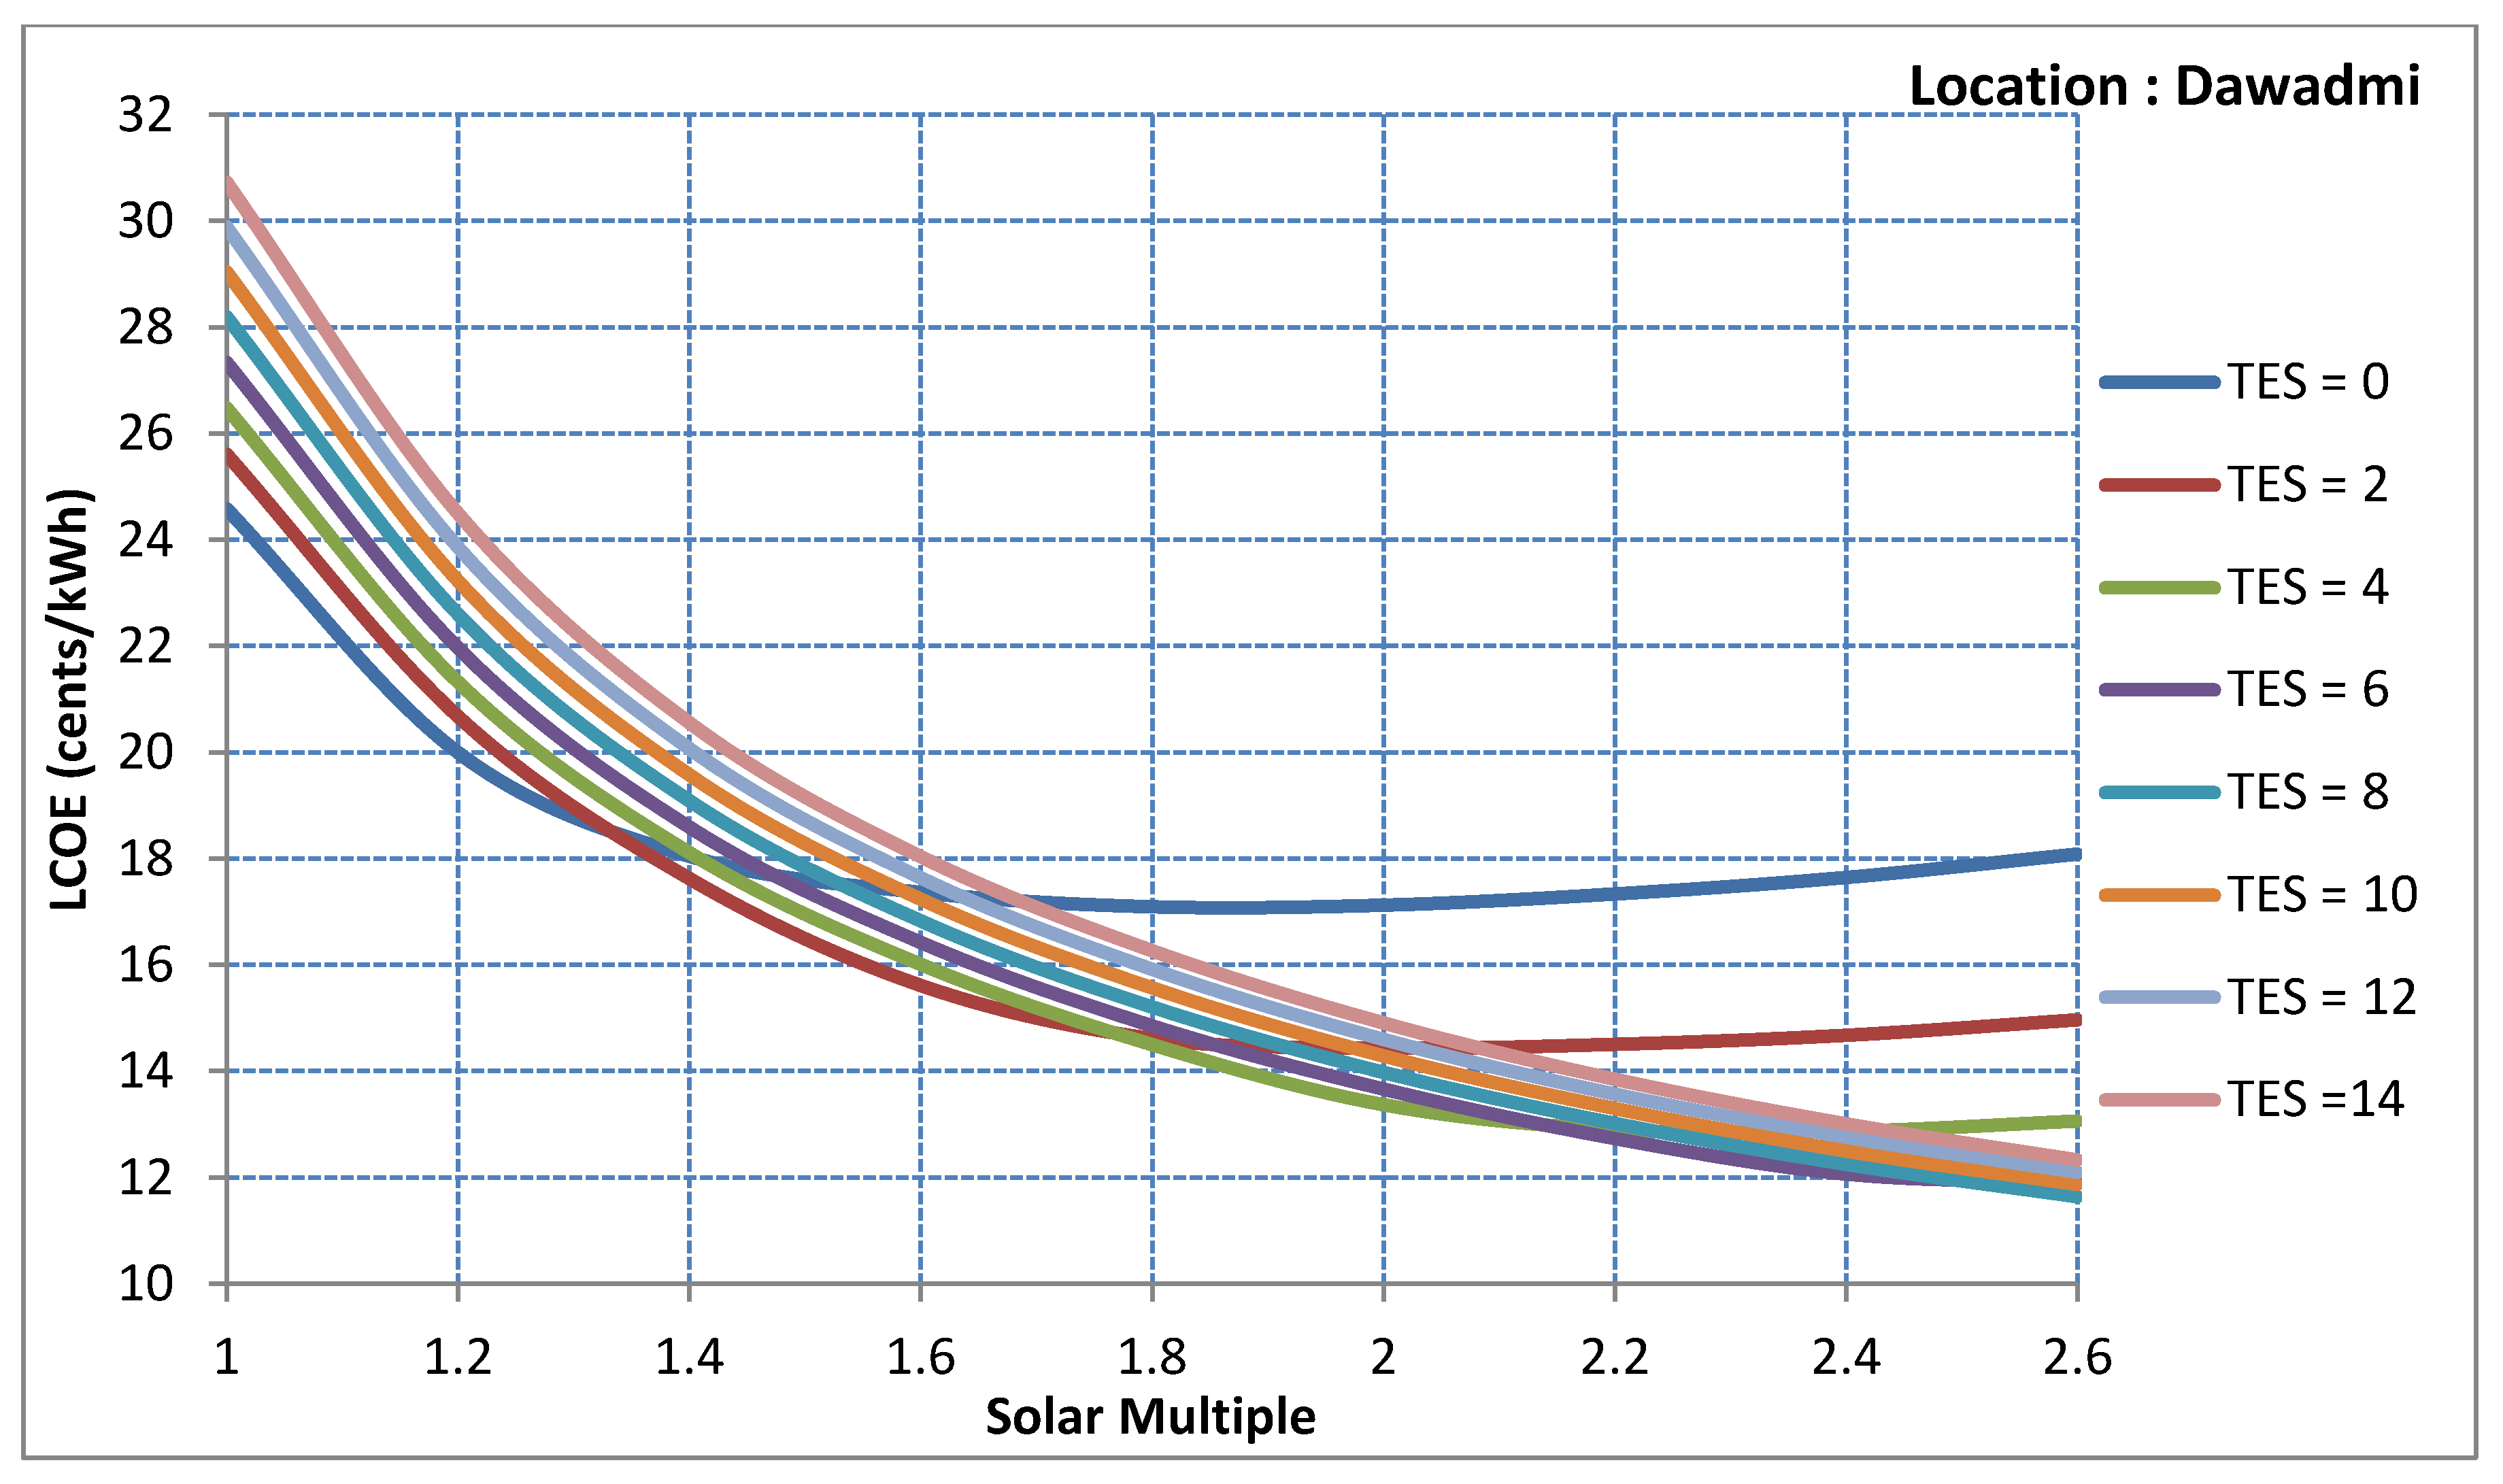
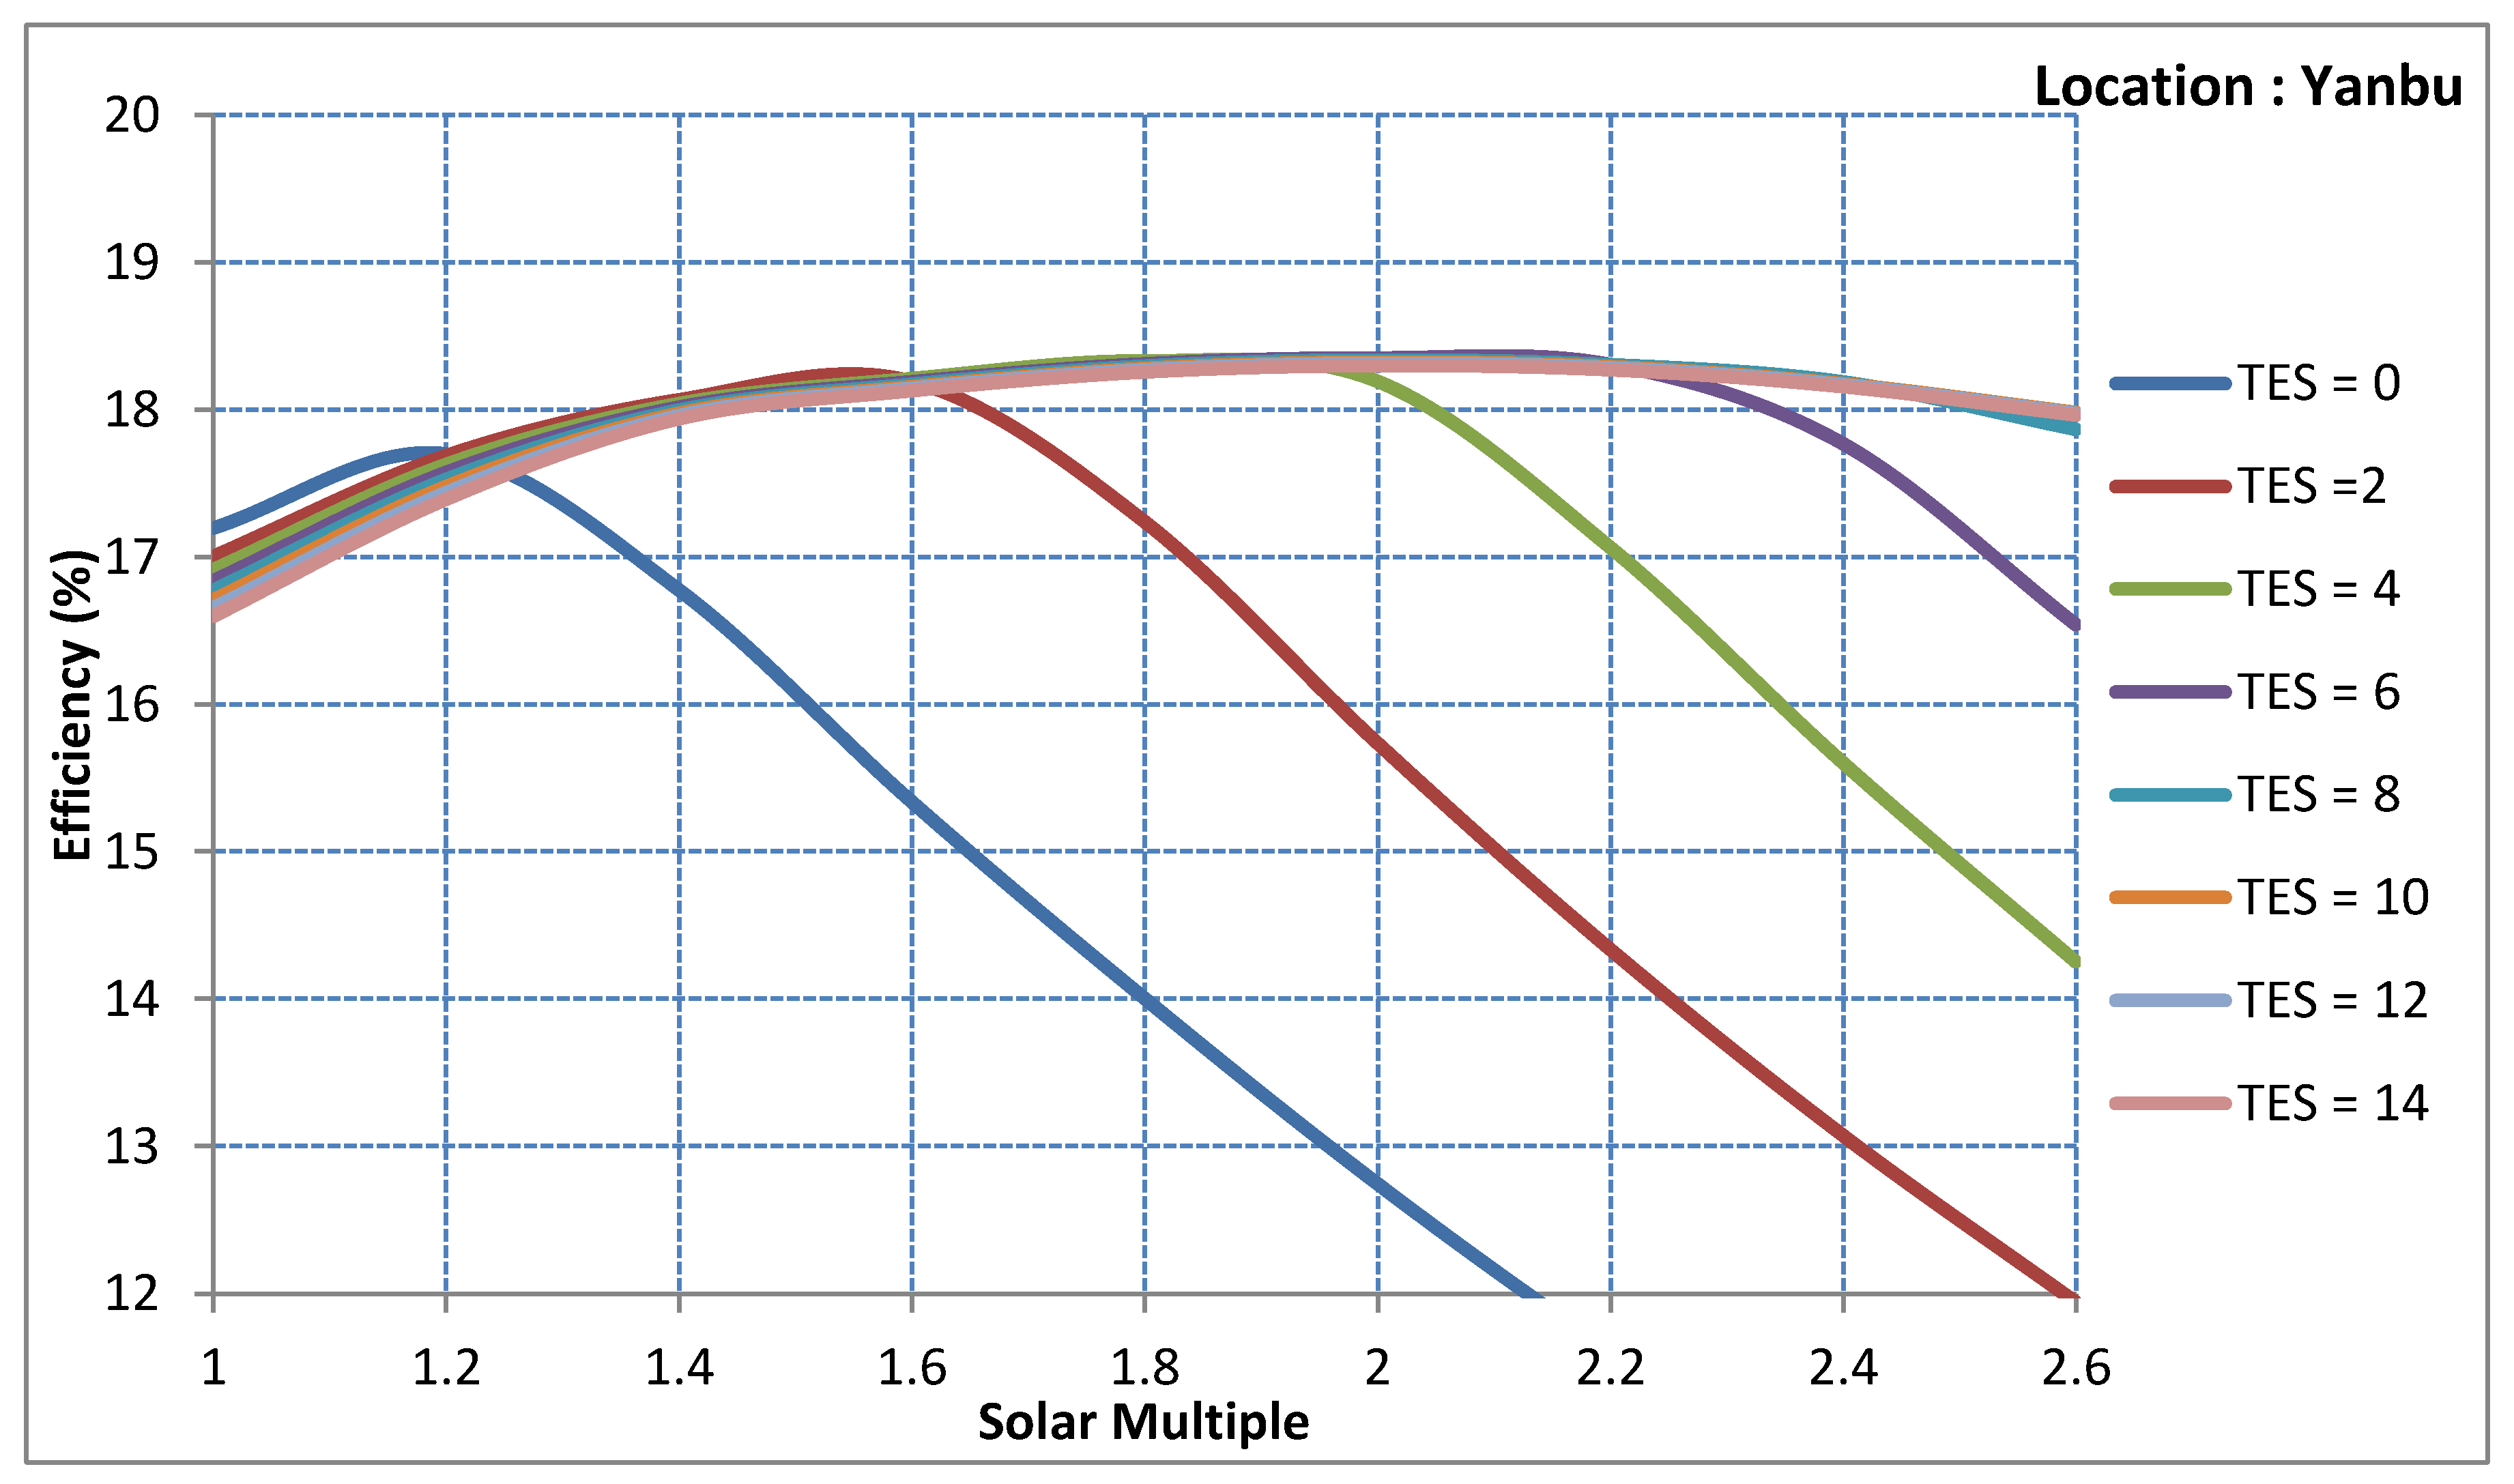
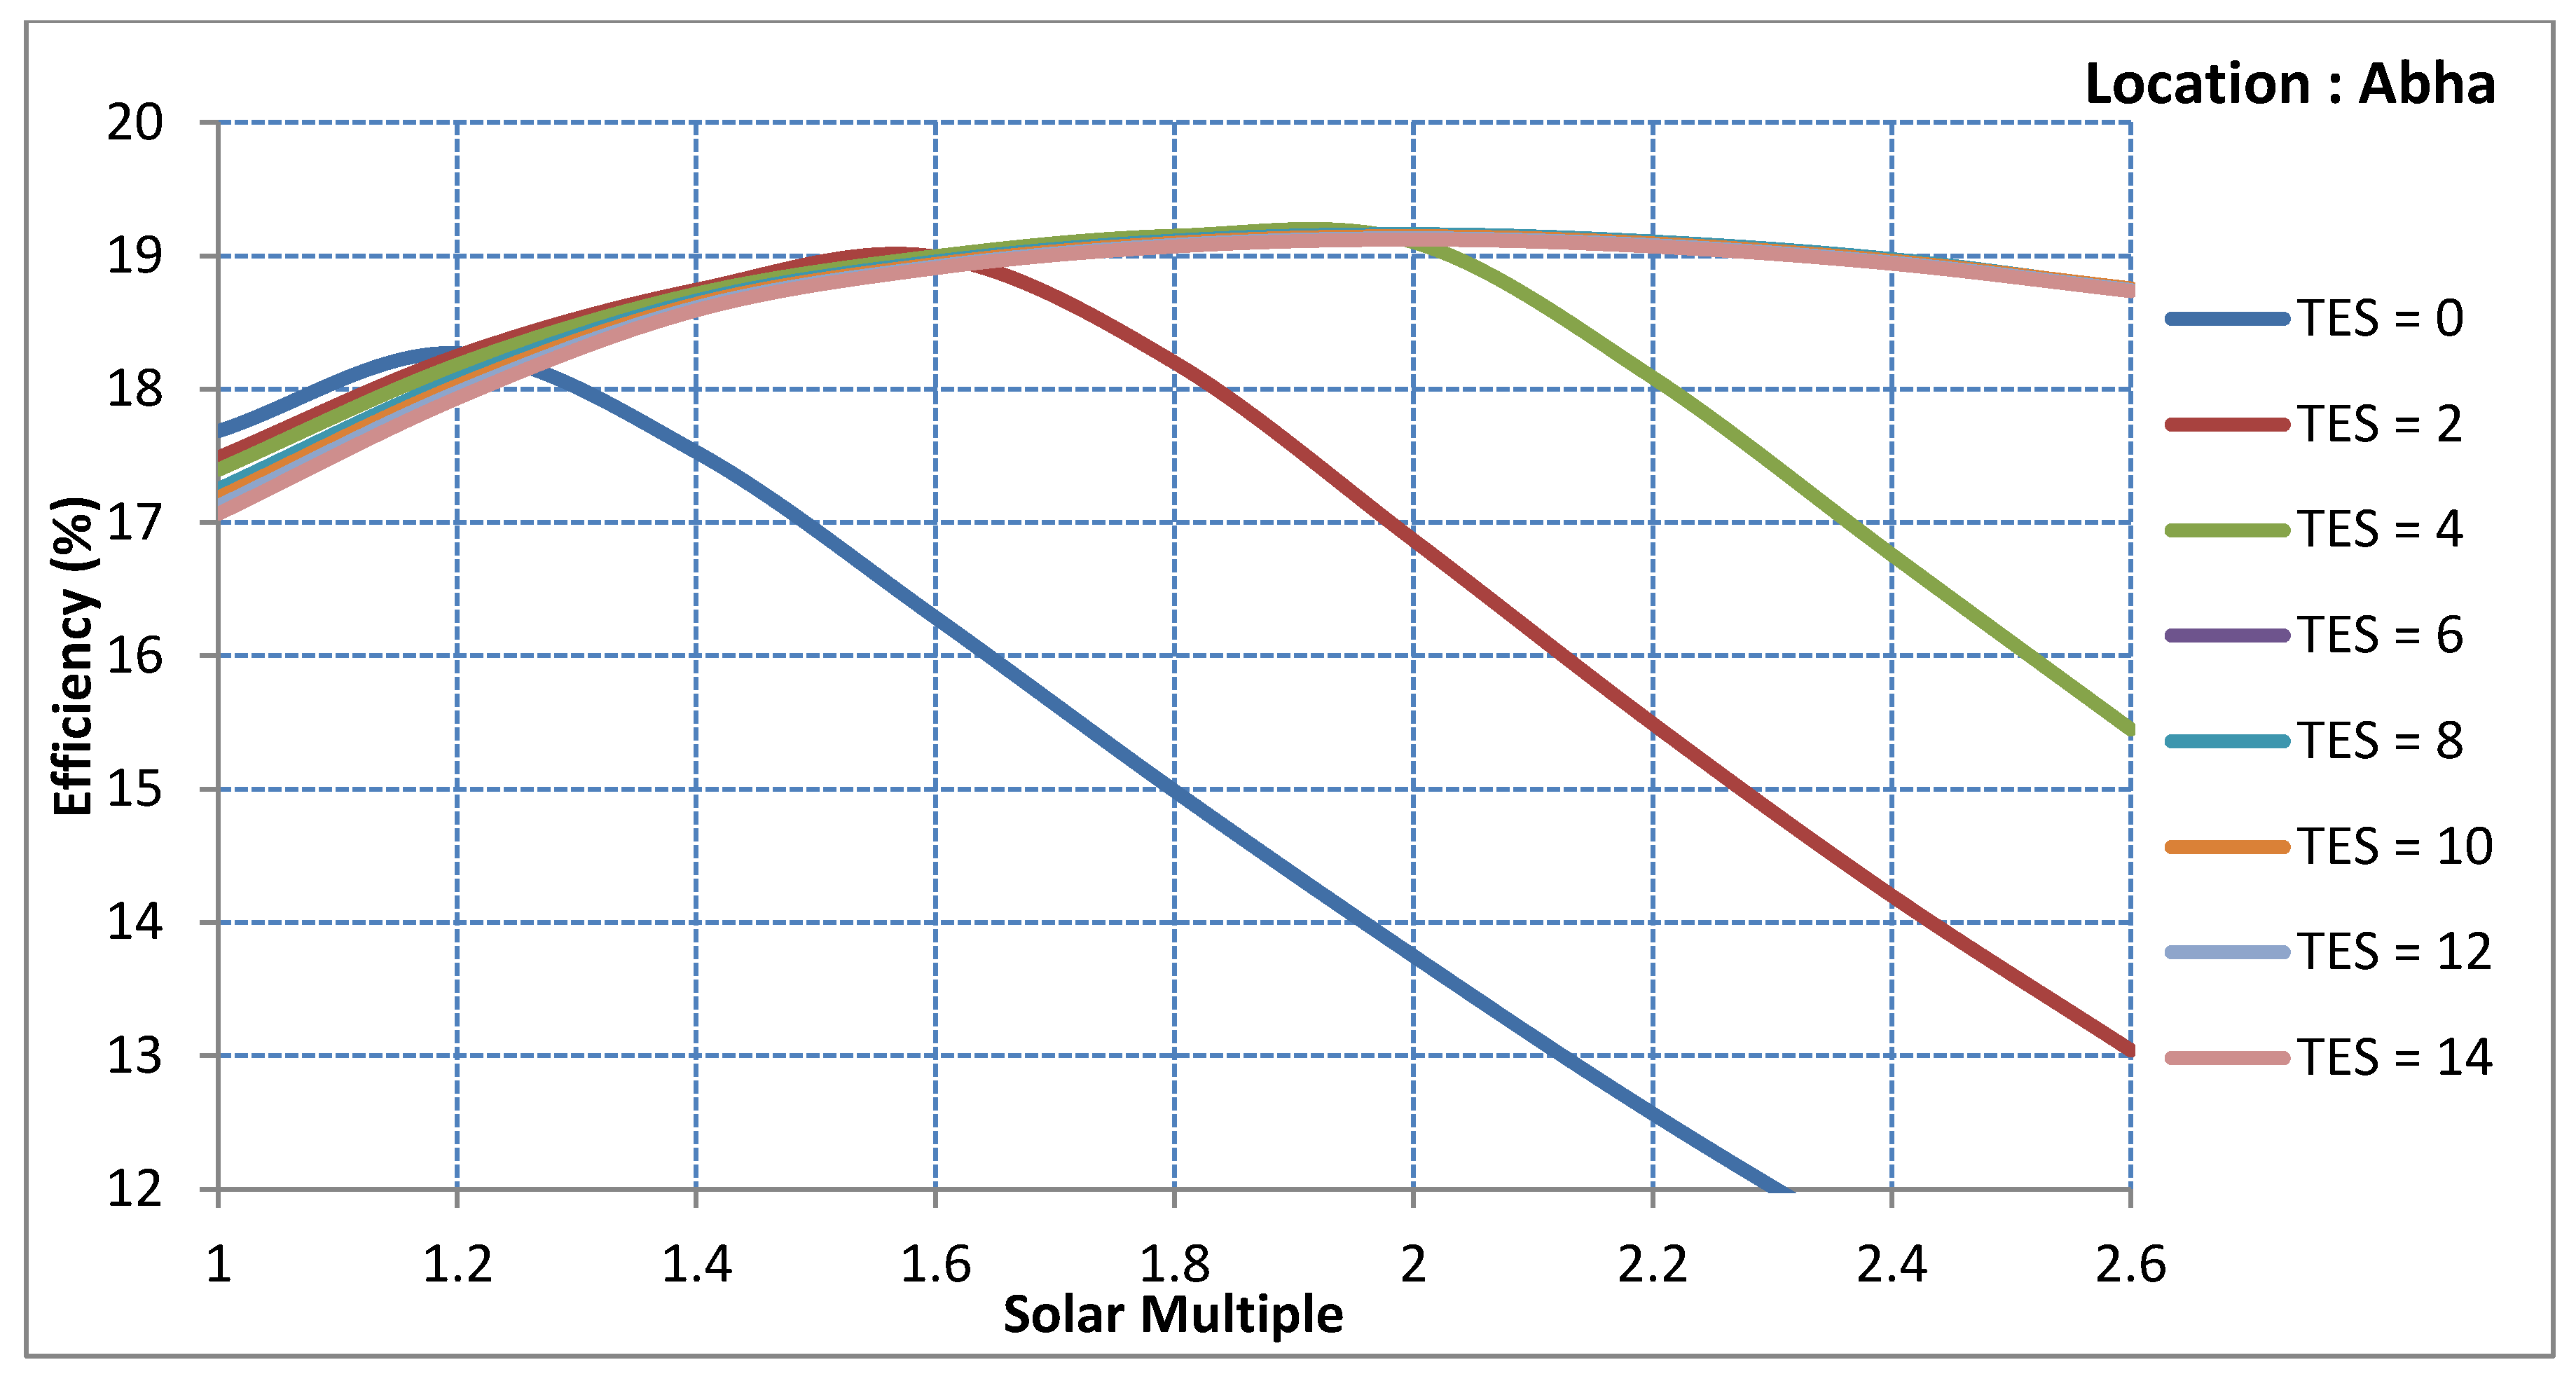
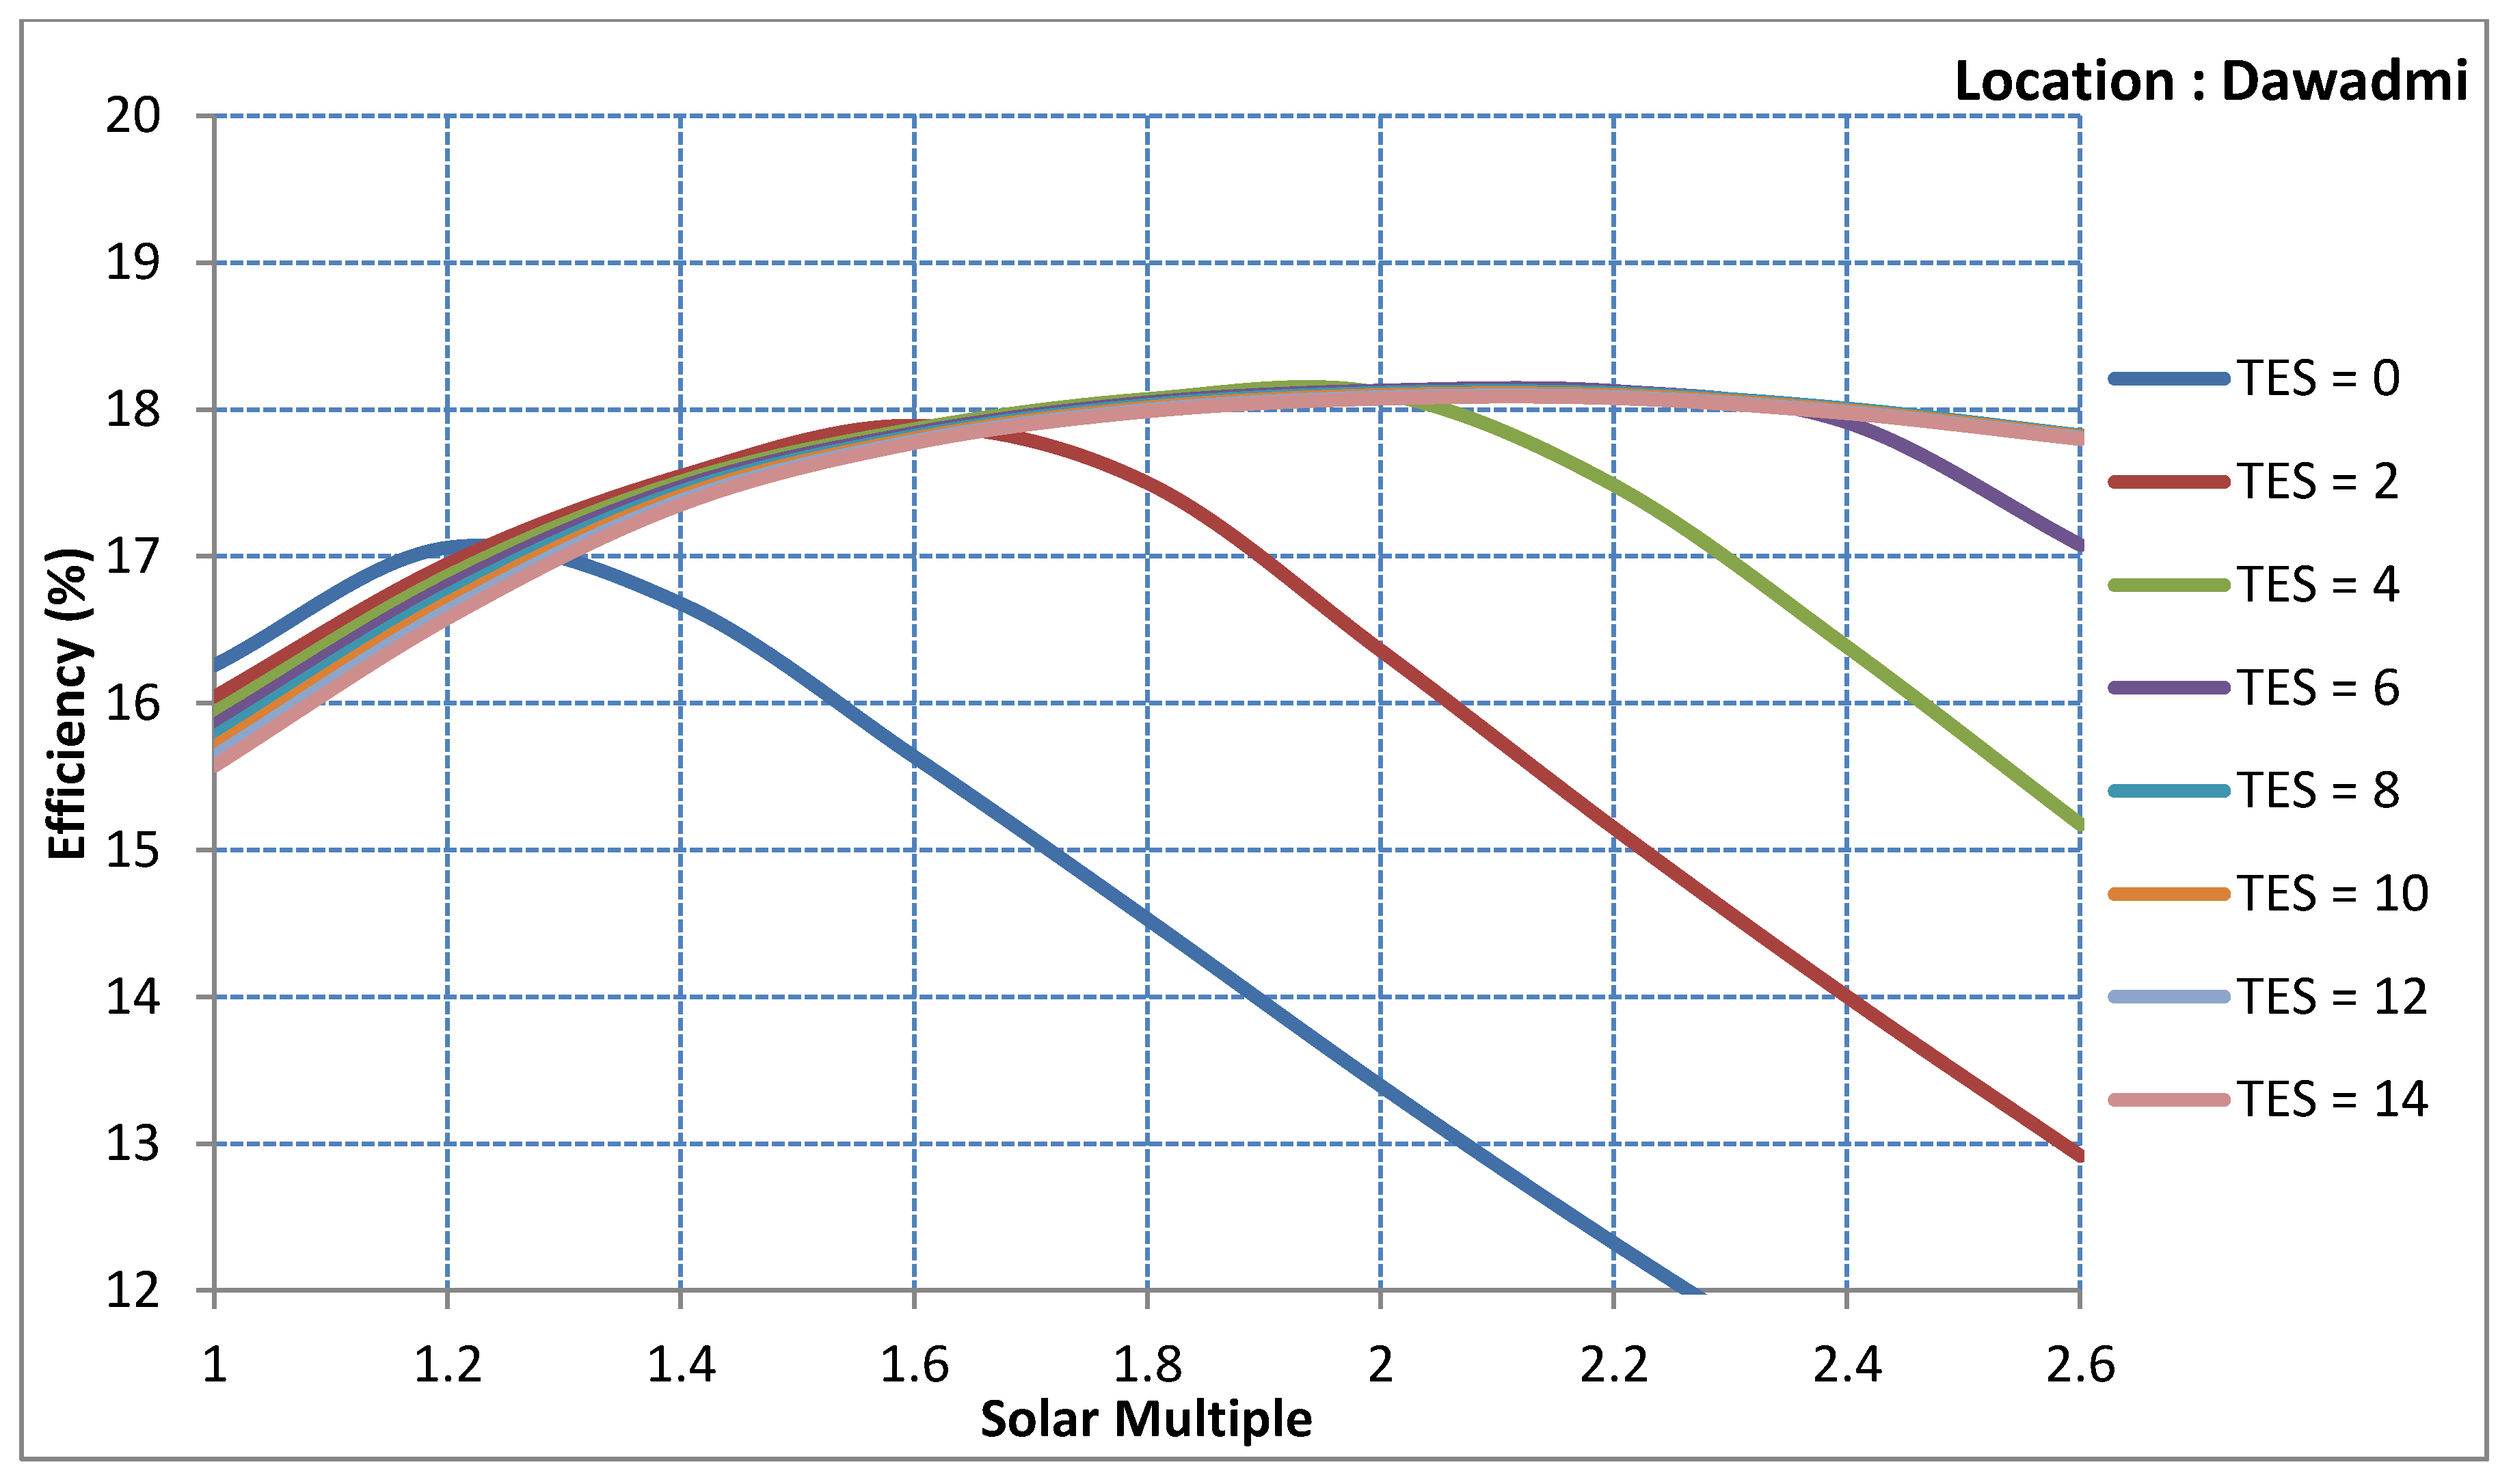
5. Results and Discussion
6. Conclusions
Funding
Acknowledgments
Conflicts of Interest
Nomenclature
| Angle of incidence at point p for ith hour (degree) | |
| Total Annual Solar Energy (Wh/m2) | |
| Packing Density at point p of heliostat field | |
| Design Electrical Capacity of the plant (MW) | |
| Power Block Efficiency | |
| Receiver Efficiency | |
| Maximum thermal energy storage capacity (Wh) | |
| Direct normal irradiance at the location for ith hour (W/m2) | |
| Actual Annual reflected Energy per unit land area (Wh/m2) | |
| Thermal power of HTF required for design electric power (W) | |
| Design point thermal power to be collected from field (W) | |
| Heat exchanger efficiency | |
| Storage heat exchanger efficiency | |
| Number of hours of storage |
Abbreviations
| PTC | Parabolic Trough Collector |
| HTF | Heat Transfer Fluid |
| CSP | Concentrated solar power |
| ISD | Integrated Surface Database |
| DNI | Direct normal irradiance |
| SAM | Solar Advisor model |
| CF | Capacity Factor |
References
- International Energy Agency (IEA). Technology Roadmap: Wind Energy; OECD publishing: Paris, France, 2013; Available online: https://www.iea.org (accessed on 14 March 2018).
- International Renewable Energy Agency (IRENA). Renewable Capacity Statistics; IRENA: Abu Dhabi, UAE, 2019; Available online: https://www.irena.org (accessed on 22 July 2018).
- Zell, E.; Gasim, S.; Wilcox, S.; Katamoura, S.; Stoffel, T.; Shibli, H.; Engel-Cox, J.; Al Subie, M. Assessment of solar radiation resources in Saudi Arabia. Sol. Energy 2015, 119, 422–438. [Google Scholar] [CrossRef]
- Ho, C.K. Advances in Central Receivers for concentrating solar applications. Sol. Energy 2017, 152, 38–56. [Google Scholar] [CrossRef]
- Ramli, M.A.M.; Twaha, S.; Al-hamouz, Z. Analyzing the potential and progress of distributed generation applications in Saudi Arabia: The case of solar and wind resources. Renew. Sustain. Energy Rev. 2017, 70, 287–297. [Google Scholar] [CrossRef]
- Jafrancesco, D.; Cardoso, J.P.; Mutuberria, A.; Leonardi, E.; Les, I.; Sansoni, P.; Francini, F.; Fontani, D. Optical simulation of a Central Receiver system: Comparison of different software tools. Renew. Sustain. Energy Rev. 2018, 94, 792–803. [Google Scholar] [CrossRef]
- Avila-marin, A.L.; Fernandez-reche, J.; Tellez, F.M. Evaluation of the potential of Central Receiver solar power plants: Configuration, optimization and trends. Appl. Energy 2013, 112, 274–288. [Google Scholar] [CrossRef]
- Eddhibi, F.; Amara, M.B.; Balghouthi, M. Design and analysis of a heliostat field layout with reduced shading effect in southern Tunisia. Int. J. Hydrogen Energy 2017, 42, 28973–28996. [Google Scholar] [CrossRef]
- Benammar, S.; Khellaf, A.; Mohammedi, K. Contribution to the modeling and simulation of solar Power Tower plants using energy analysis. Energy Convers. Manag. 2014, 78, 923–930. [Google Scholar] [CrossRef]
- Carrizosa, E.; Domínguez-bravo, C.; Fernández-cara, E.; Quero, M. A heuristic method for simultaneous Tower and pattern-free fi eld optimization on solar power systems. Comput. Oper. Res. 2015, 57, 109–122. [Google Scholar] [CrossRef]
- Yu, Q.; Wang, Z.; Xu, E.; Li, X.; Guo, M. Modeling and dynamic simulation of the collector and Receiver system of 1 MWe DAHAN solar thermal Power Tower plant. Renew. Energy 2012, 43, 18–29. [Google Scholar] [CrossRef]
- Amadei, C.A.; Allesina, G.; Tartarini, P.; Yuting, W. Simulation of GEMASOLAR-based Solar Tower plants for the Chinese energy market: In fluence of plant downsizing and location change. Renew. Energy 2013, 55, 366–373. [Google Scholar] [CrossRef]
- Hanrieder, N.; Wilbert, S.; Mancera-Guevara, D.; Buck, R.; Giuliano, S.; Pitz-Paal, R. Atmospheric extinction in solar tower plants—A review. Sol. Energy 2017, 152, 193–207. [Google Scholar] [CrossRef]
- Casati, E.; Casella, F.; Colonna, P. ScienceDirect Design of CSP plants with optimally operated thermal storage. Sol. Energy 2015, 116, 371–387. [Google Scholar] [CrossRef]
- System Advisor Model Version 2017.9.5 (SAM 2017.9.5); National Renewable Energy Laboratory: Golden, CO, USA. Available online: https://sam.nrel.gov/content/downloads (accessed on 12 October 2019).
- Zhang, H.L.; Baeyens, H.L.; Degreve, J.; Caceres, G. Concentrated solar power plants: Review and design methodology. Renew. Sustain. Energy Rev. 2013, 22, 466–481. [Google Scholar] [CrossRef]
- Stine, W.B.; Harrigan, R.W. Solar Energy Systems Design; John Wiley and Sons, Inc: New York, NY, USA, 1986. [Google Scholar]
- Wagner, M.J.; Wendelin, T. Solar Pilot: A Power Tower Solar field layout and characterization tool. Sol. Energy 2018, 171, 185–196. [Google Scholar] [CrossRef]
- National Renewable Energy Laboratory (NREL). Power Tower Projects. Available online: www.nrel.gov/csp/solarpaces/power_Tower.cfm (accessed on 9 November 2017).
- Boretti, A.; Castelletto, S.; Al-zubaidy, S. Concentrating solar Power Tower technology: Present status and outlook. Nonlinear Eng. 2019, 8, 10–31. [Google Scholar] [CrossRef]


| Location | Latitude and Longitude | Annual DNI (kWh/m2/day) | Average Temperature (°C) | Elevation (m) | Data Source |
|---|---|---|---|---|---|
| Yanbu (K.S.A) | 24.1440 N, 38.0630 E | 6.86 | 28.7 | 7.9 | ISD |
| Abha (K.S.A) | 18.240 N, 42.6570 E | 6.52 | 19.0 | 2090.3 | ISD |
| Dawadmi (K.S.A) | 24.450 N, 44.1210 E | 6.11 | 22.3 | 922.3 | ISD |
| Parameter | Value |
|---|---|
| Name Plate Capacity | 100 MWe |
| Design Point DNI | 950 W/m2 |
| Heliostat width | 12.2 m |
| Heliostat height | 12.2 m |
| Receiver type | Cylindrical |
| Receiver Diameter | 17.61 m |
| Receiver Height | 20.41 m |
| HTF Type | Hitec molten salt |
| Storage Type | Two Tank |
| Tower Height | 203 m |
| Solar Multiple | Number of Heliostats | ||
|---|---|---|---|
| Yanbu | Abha | Dawadmi | |
| 1 | 3444 | 3465 | 3432 |
| 1.2 | 4098 | 4119 | 4084 |
| 1.4 | 4770 | 4785 | 4754 |
| 1.6 | 5465 | 5463 | 5446 |
| 1.8 | 6166 | 6175 | 6146 |
| 2 | 6903 | 6897 | 6881 |
| 2.2 | 7656 | 7658 | 7632 |
| 2.4 | 8456 | 8459 | 8429 |
| 2.6 | 9305 | 9293 | 9273 |
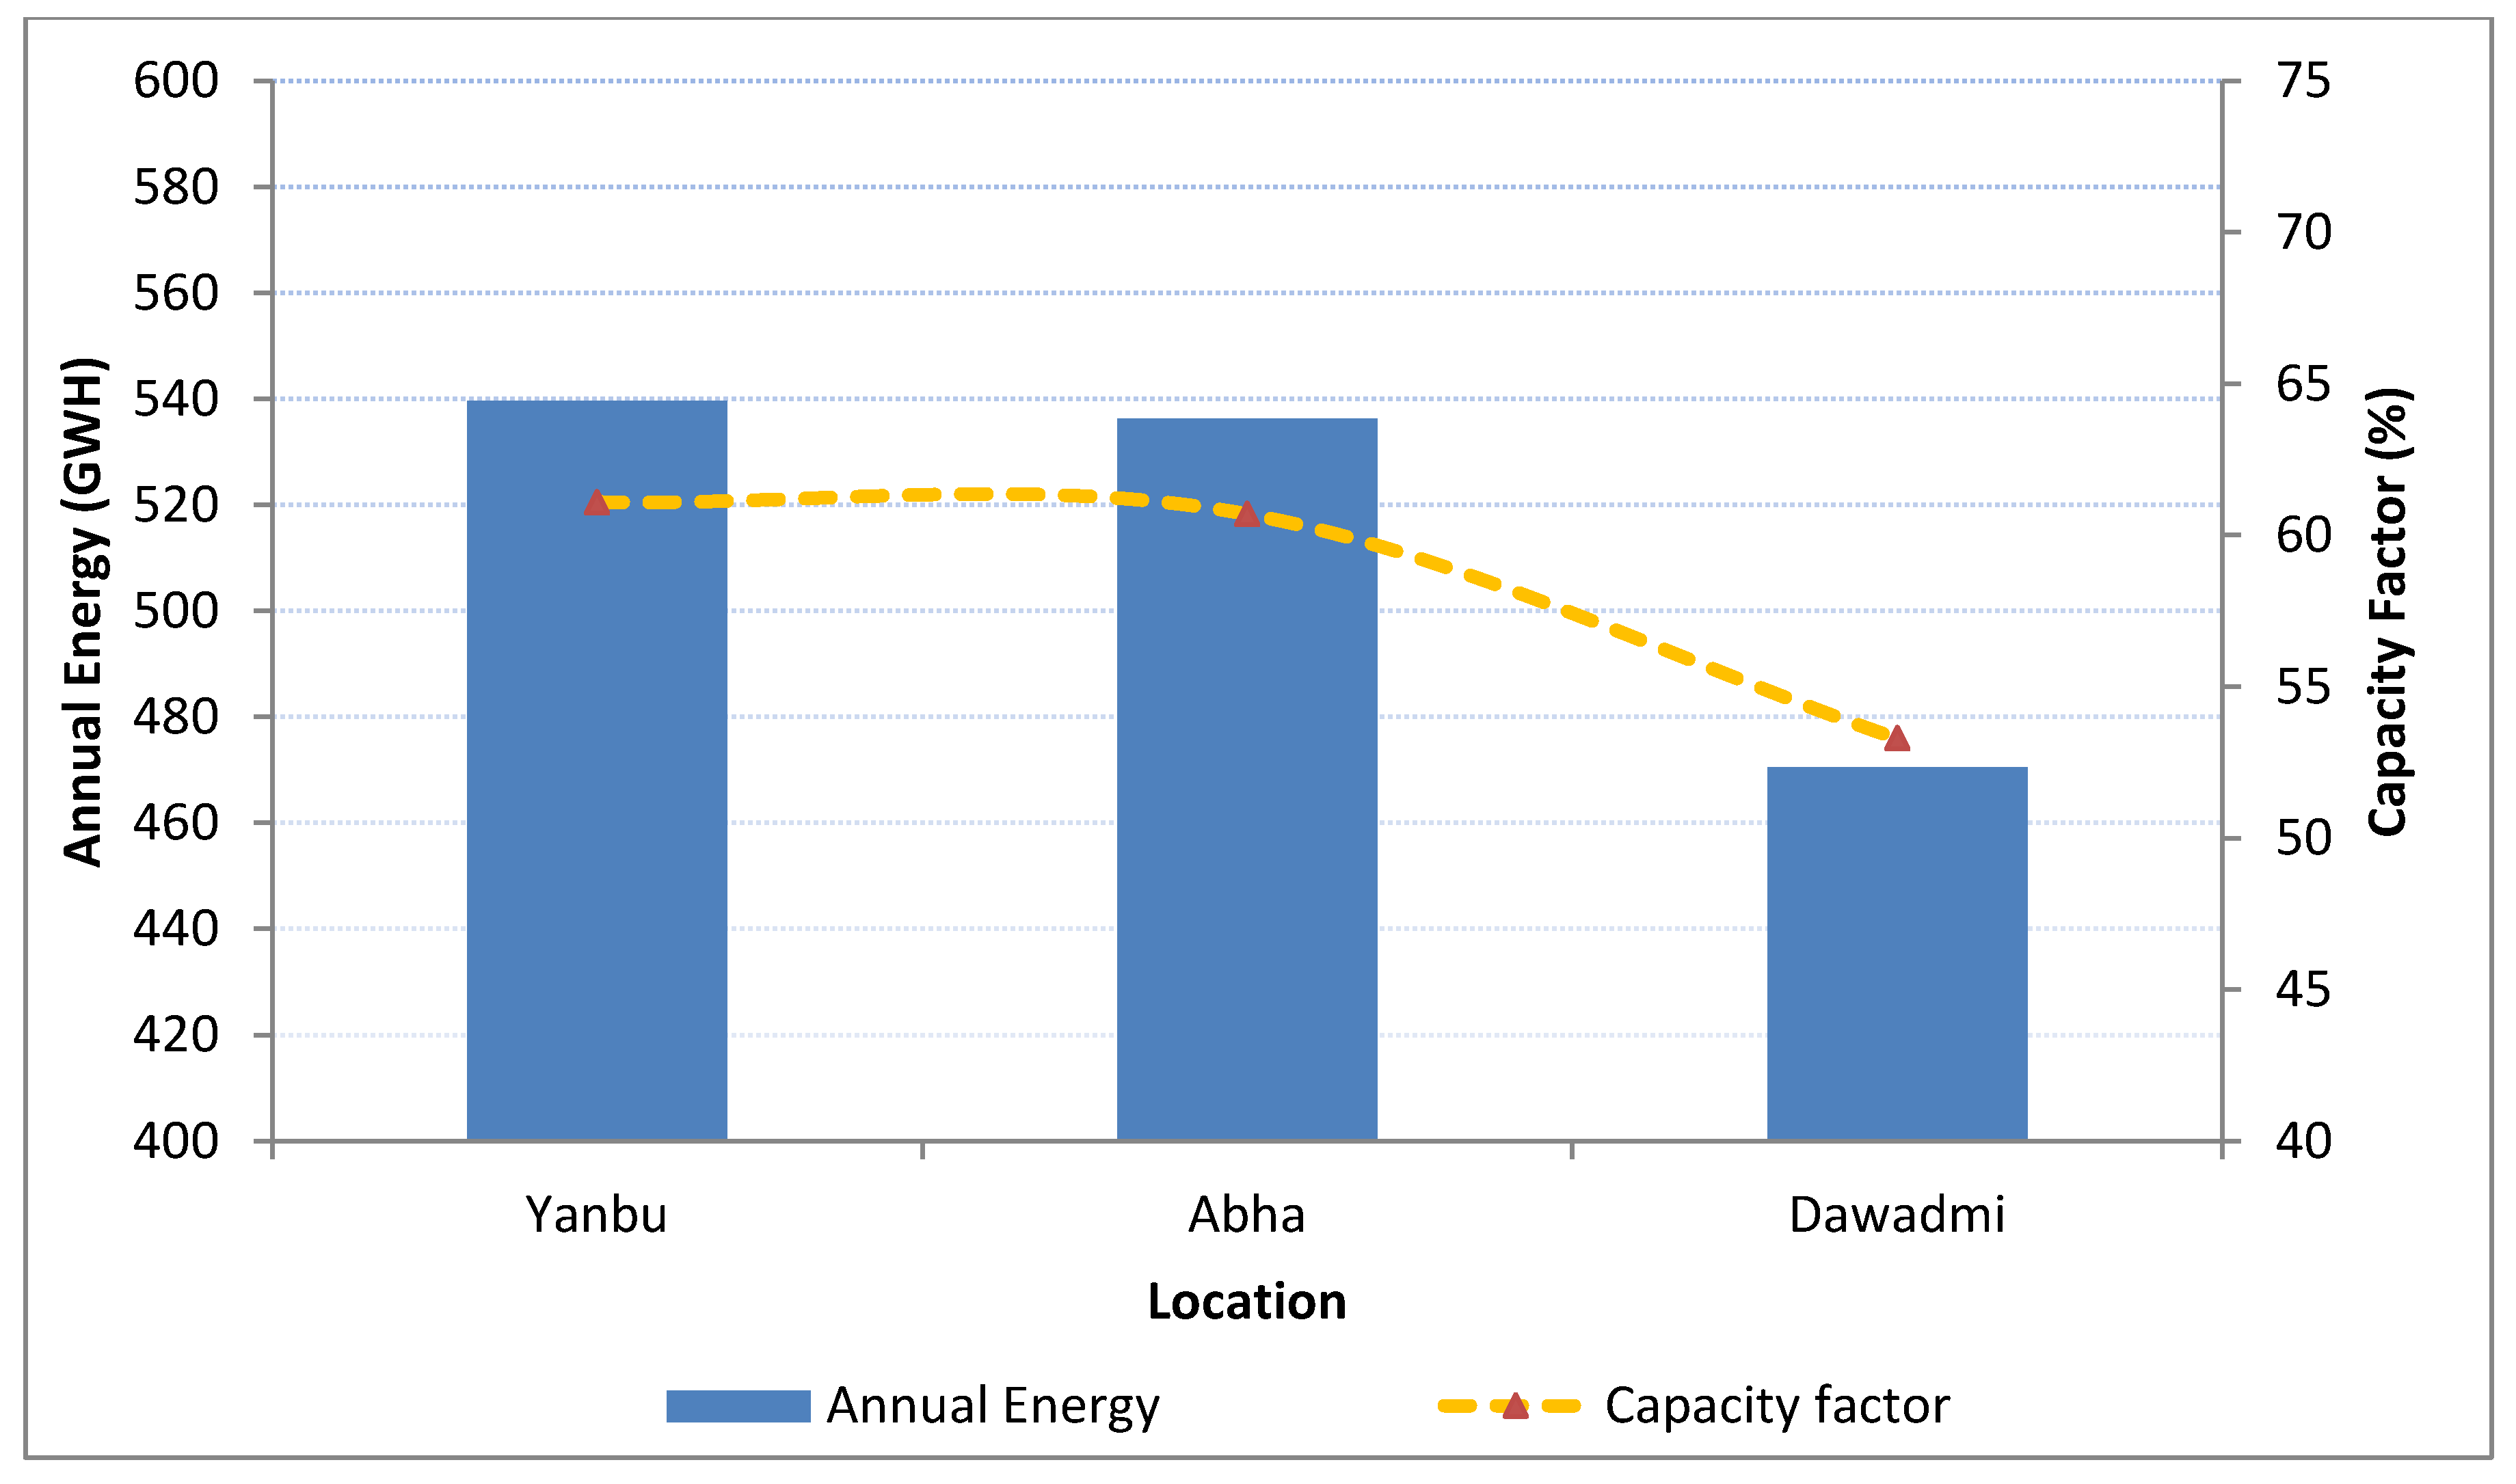
| Parameter | Yanbu | Abha | Dawadmi |
|---|---|---|---|
| Annual Energy Generated (GWh) | 539.61 | 536.31 | 470.5 |
| Solar Multiple | 2.4 | 2.4 | 2.4 |
| Full load hours of TES | 8 | 8 | 8 |
| Capacity Factor (%) | 61.1 | 60.7 | 53.3 |
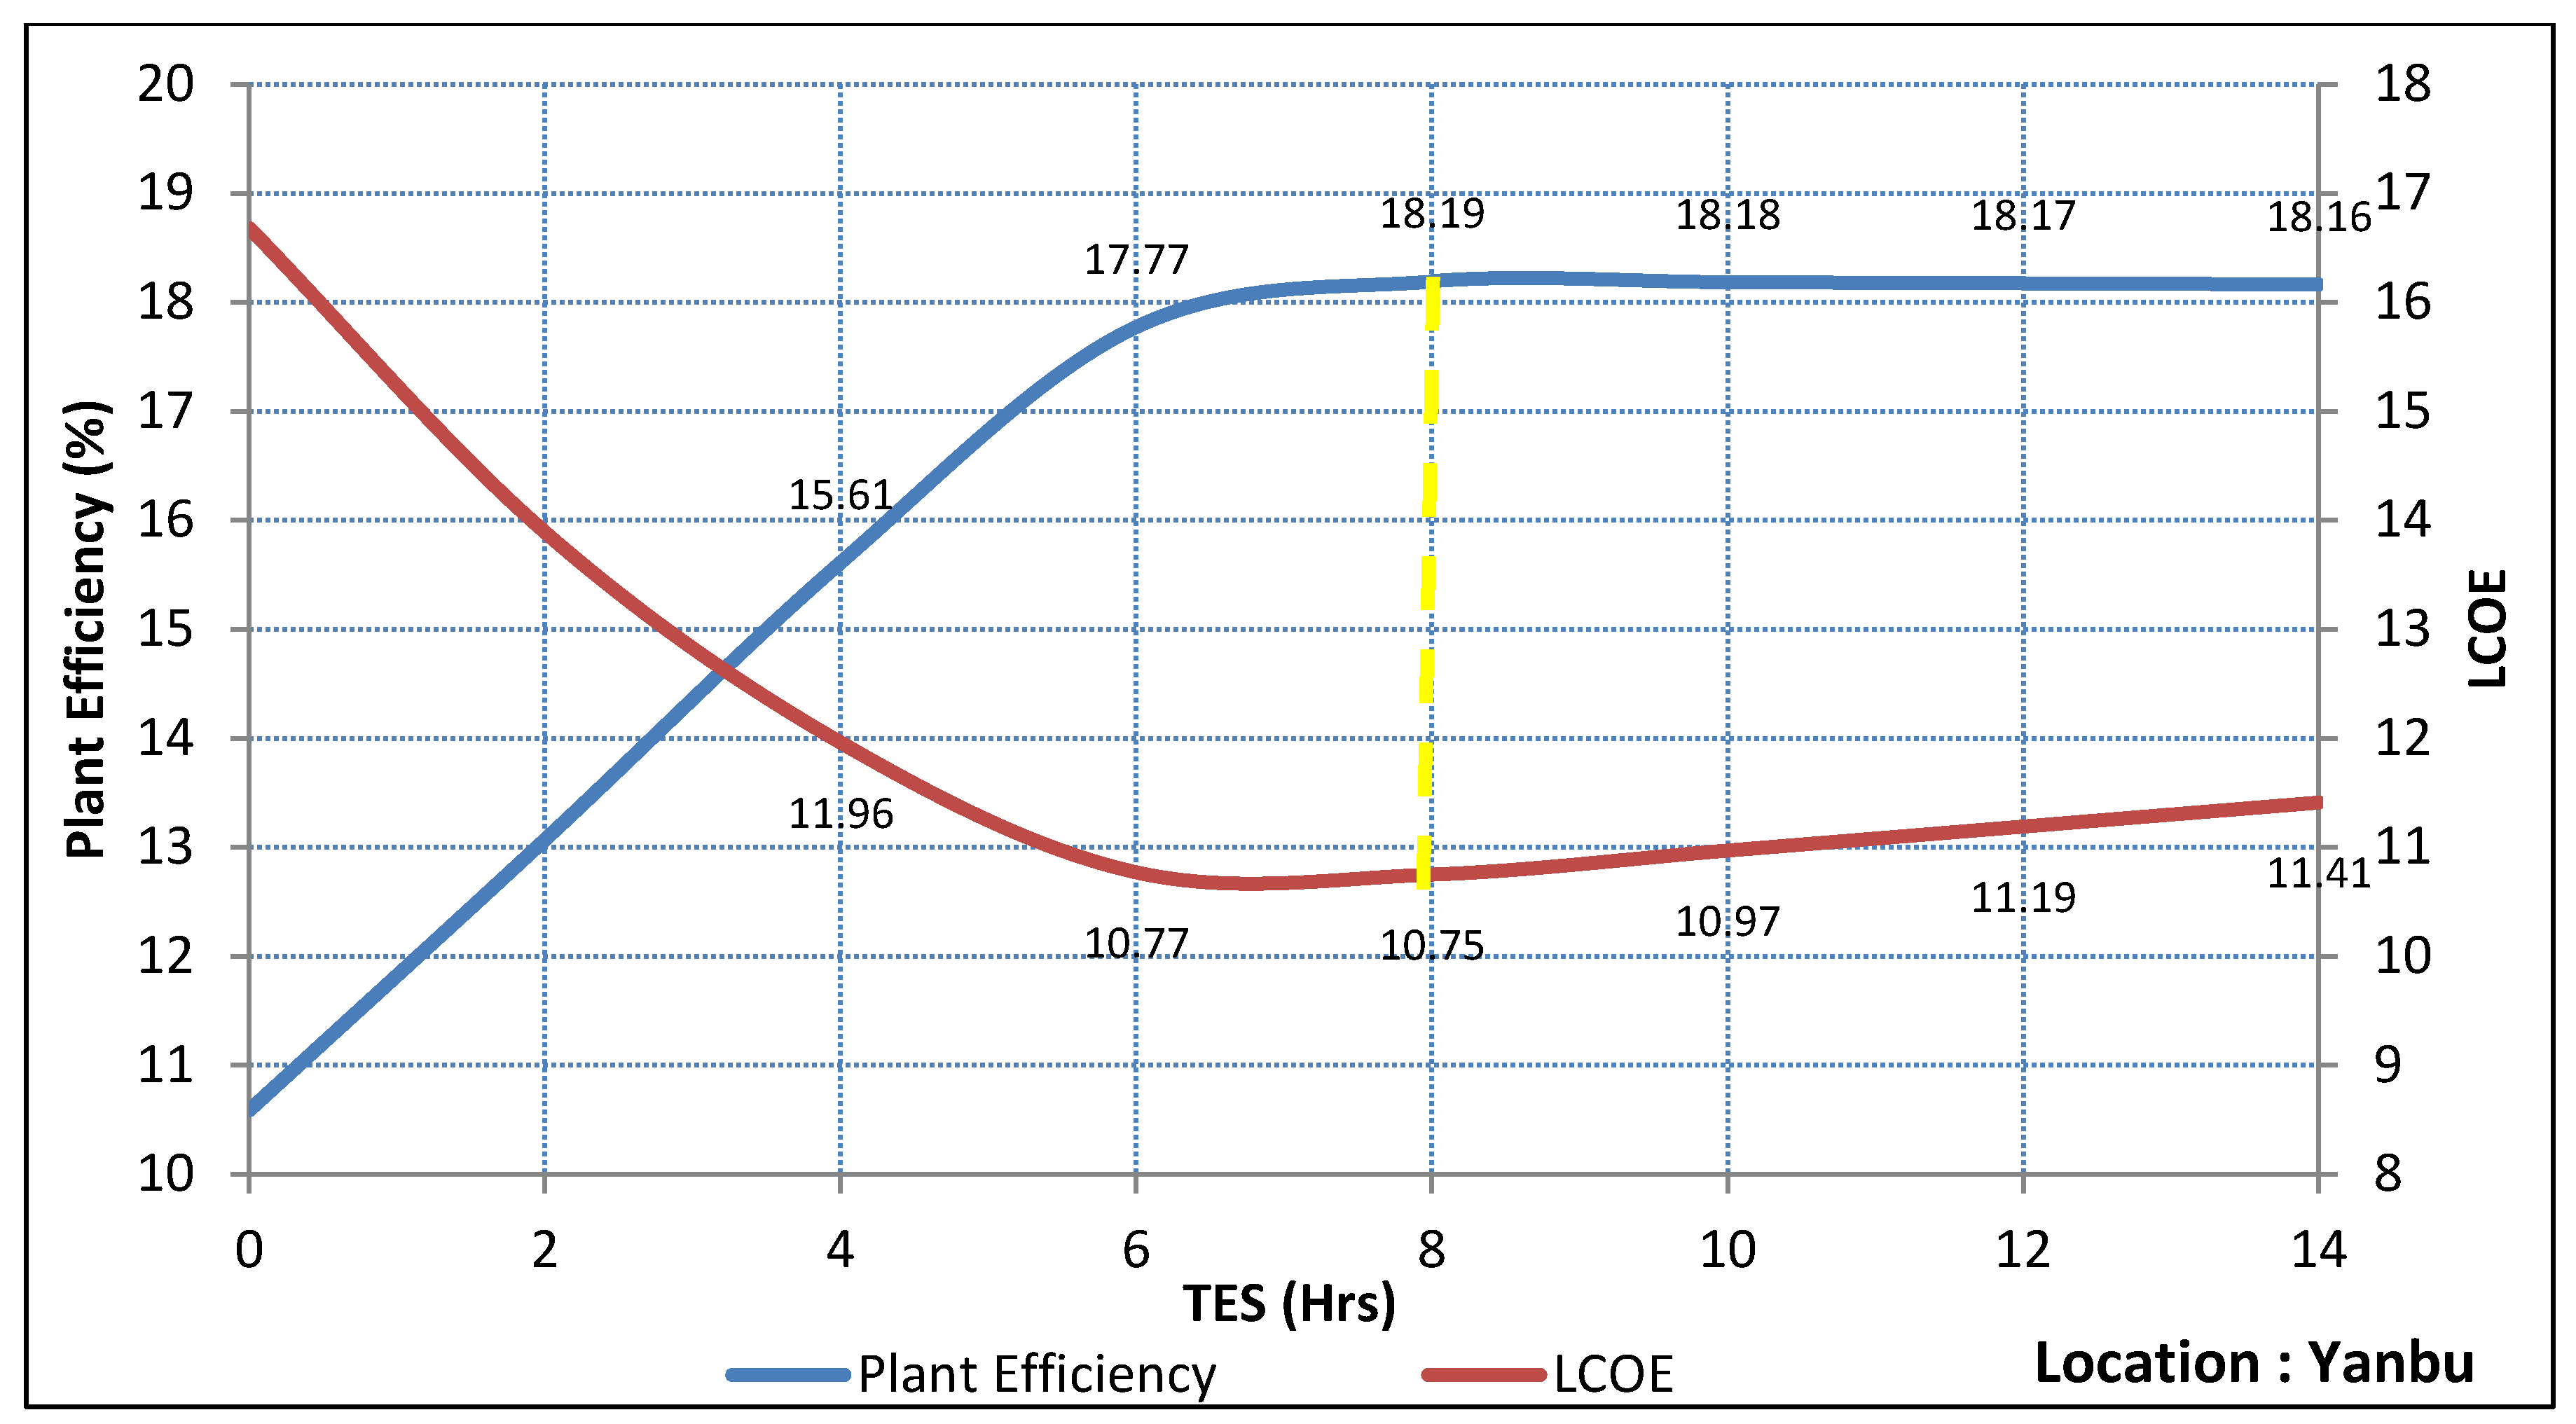
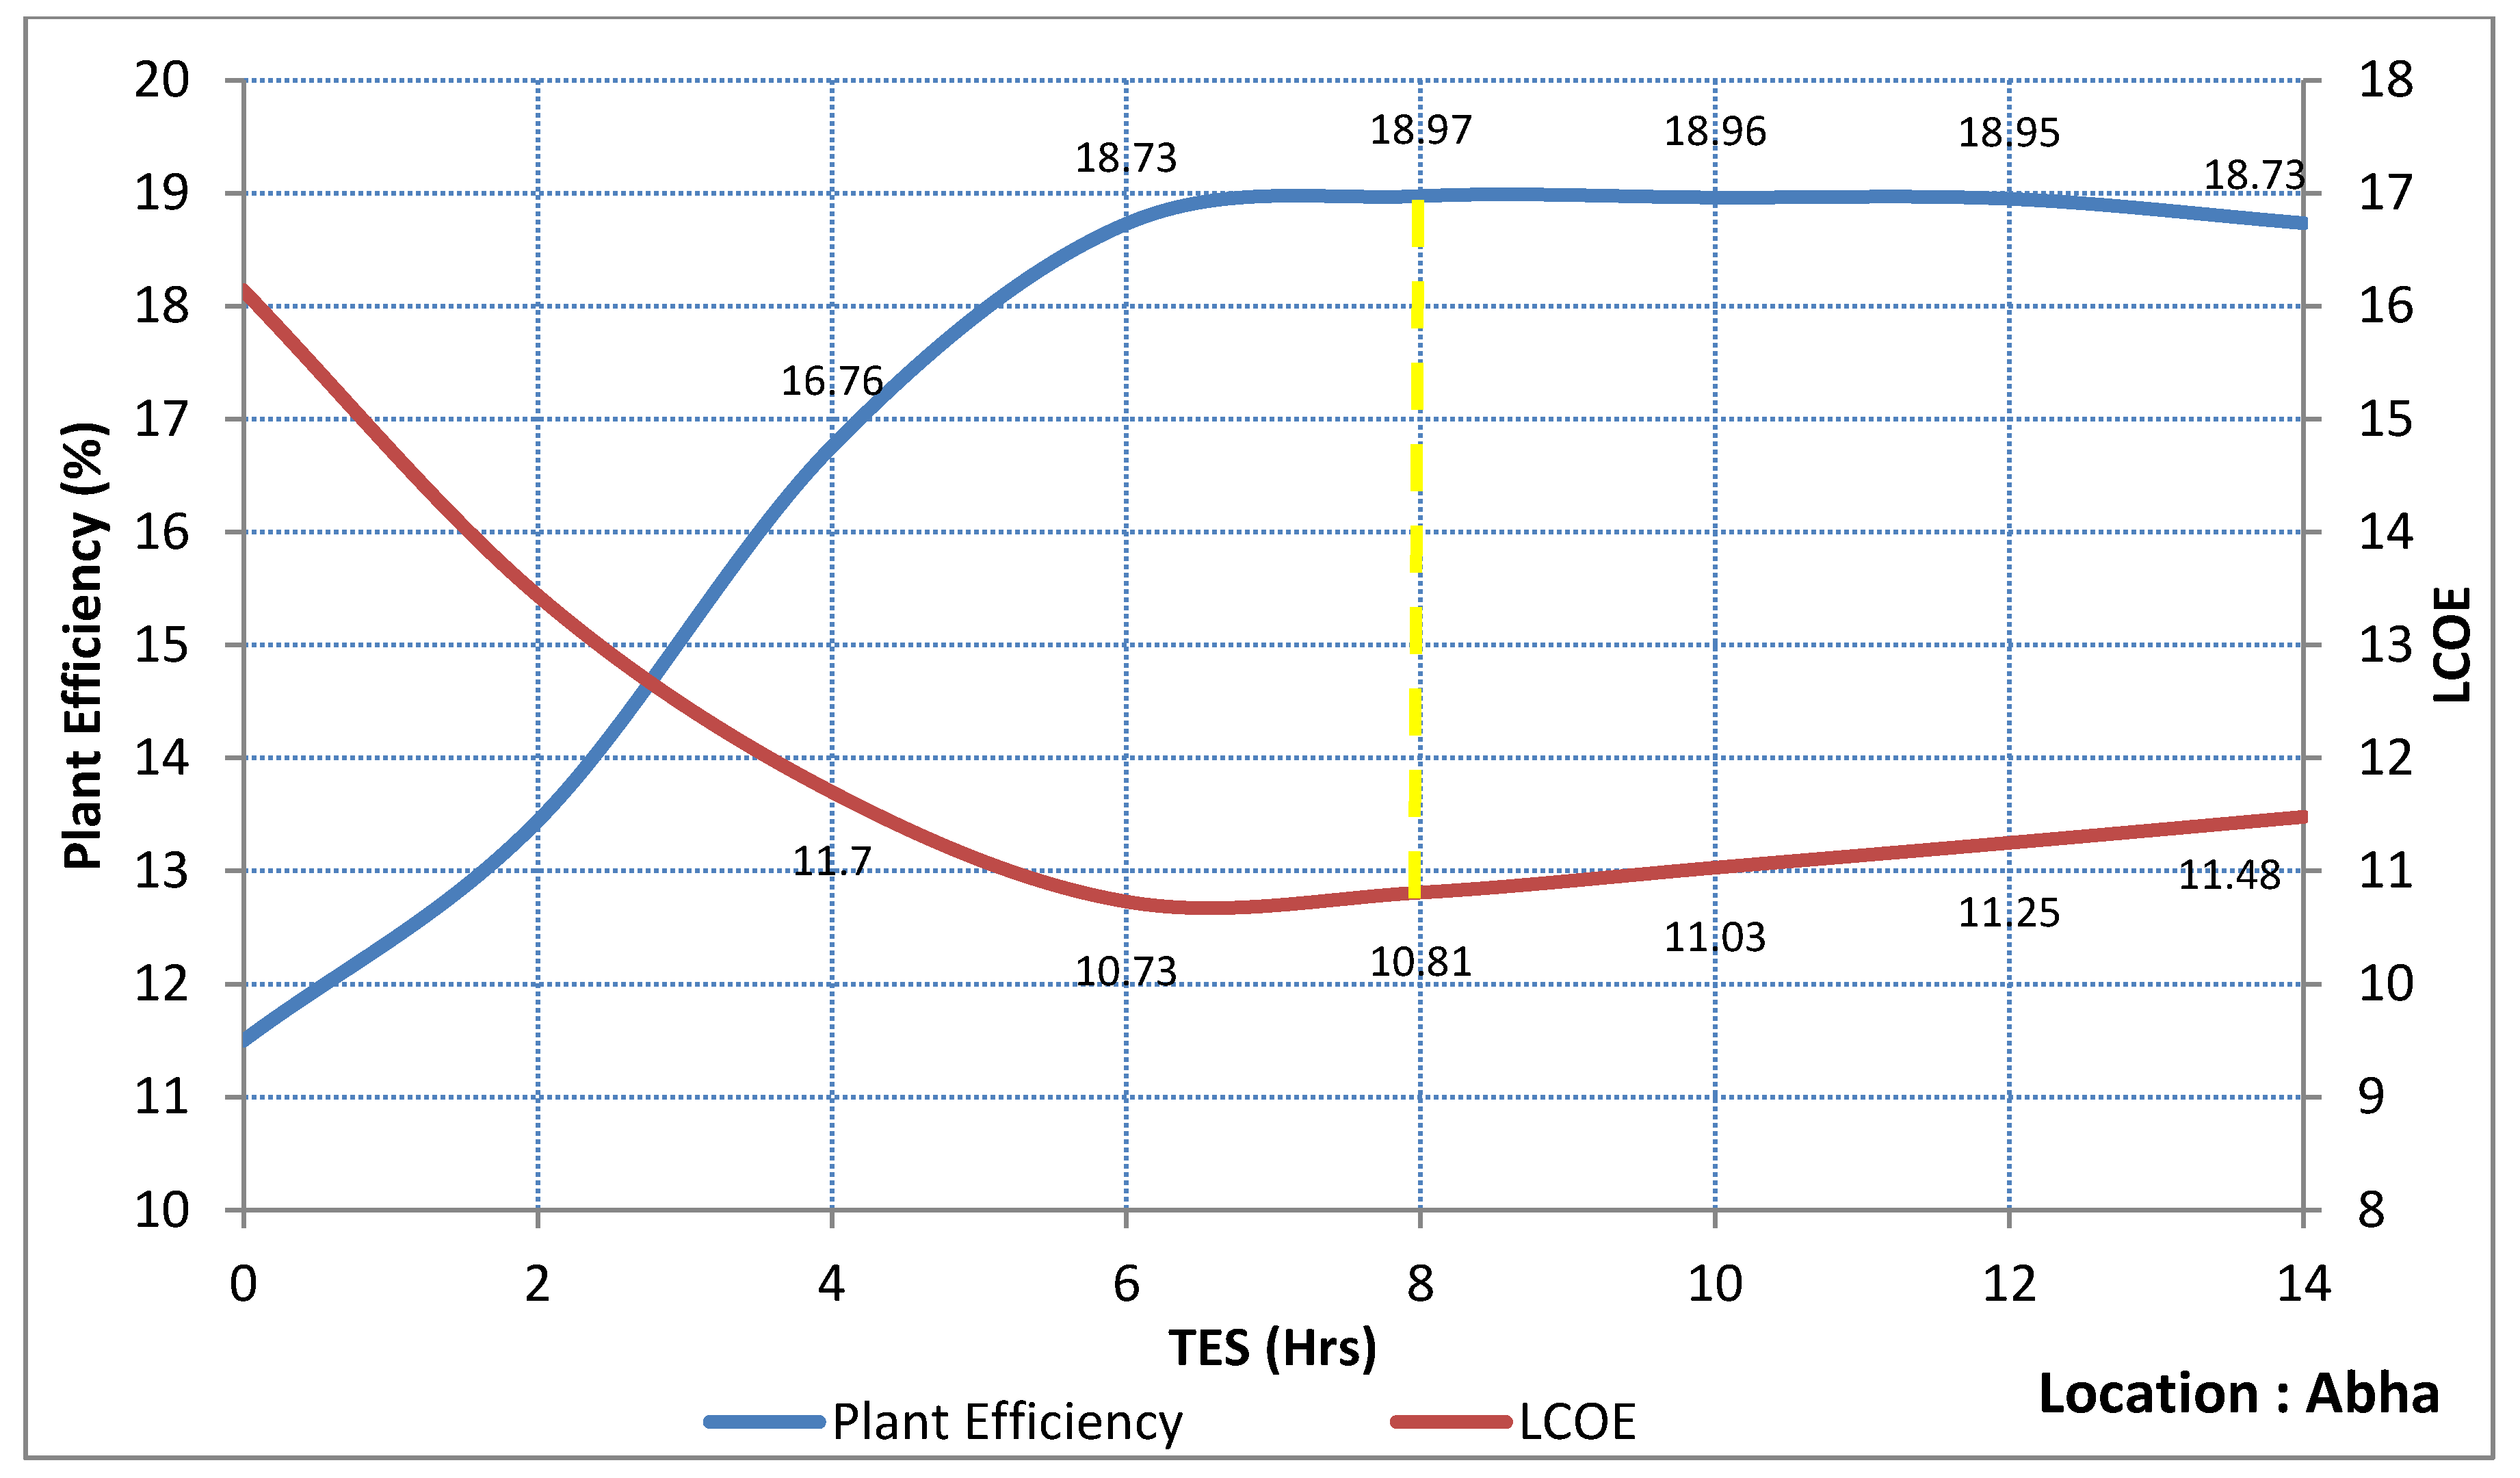
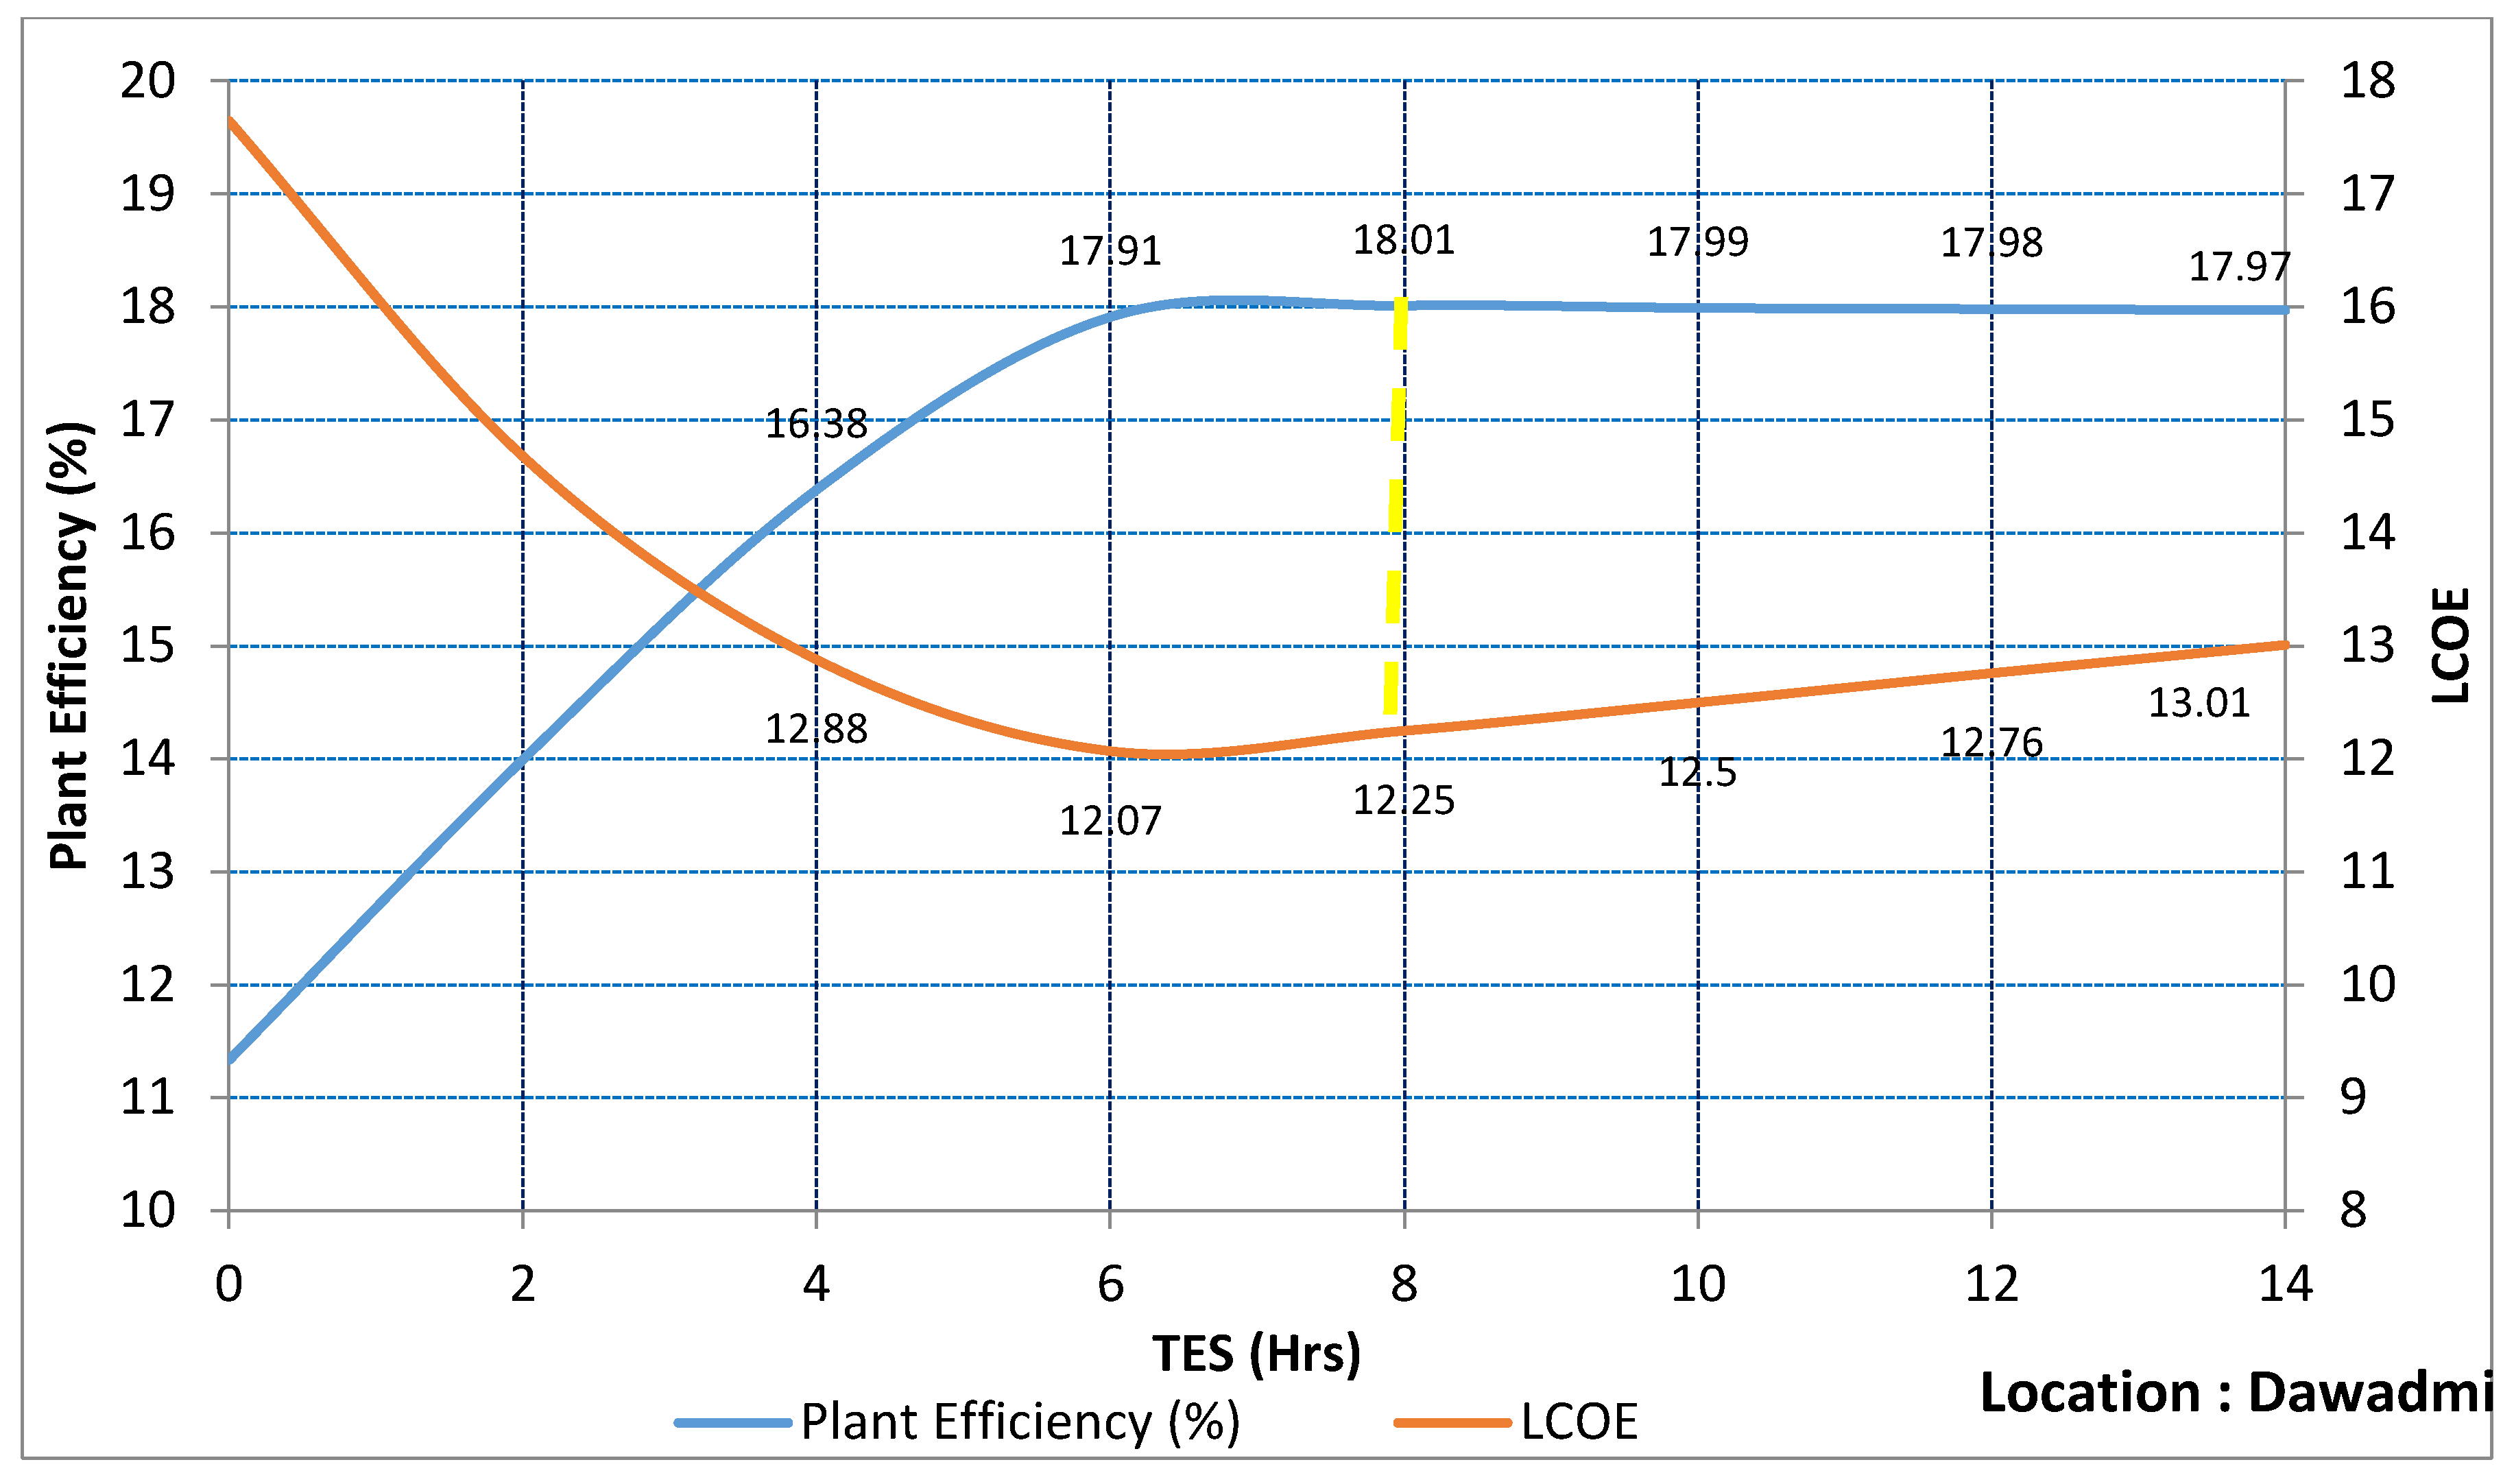
| LCOE (cents/kWh) | 10.75 | 10.81 | 12.25 |
| Plant Efficiency (%) | 18.19 | 18.97 | 18 |
| Parameter | Crescent Dunes [19,20] | Yanbu | Abha | Dawadmi |
|---|---|---|---|---|
| Plant Capacity | 110 MWe | 100 MWe | 100 MWe | 100 MWe |
| TES capacity (Hours) | 10 | 8 | 8 | 8 |
| Expected Annual Energy Generated (GWh) | 500 | 539.61 | 536.31 | 470.5 |
| Capacity Factor (%) | 51.89 | 61.1 | 60.7 | 53.3 |
| Plant Efficiency (%) | 16.86 | 18.19 | 18.97 | 18 |
© 2019 by the author. Licensee MDPI, Basel, Switzerland. This article is an open access article distributed under the terms and conditions of the Creative Commons Attribution (CC BY) license (http://creativecommons.org/licenses/by/4.0/).
Share and Cite
R. P., P. Performance Analysis and Optimization of Central Receiver Solar Thermal Power Plants for Utility Scale Power Generation. Sustainability 2020, 12, 127. https://doi.org/10.3390/su12010127
R. P. P. Performance Analysis and Optimization of Central Receiver Solar Thermal Power Plants for Utility Scale Power Generation. Sustainability. 2020; 12(1):127. https://doi.org/10.3390/su12010127
Chicago/Turabian StyleR. P., Praveen. 2020. "Performance Analysis and Optimization of Central Receiver Solar Thermal Power Plants for Utility Scale Power Generation" Sustainability 12, no. 1: 127. https://doi.org/10.3390/su12010127
APA StyleR. P., P. (2020). Performance Analysis and Optimization of Central Receiver Solar Thermal Power Plants for Utility Scale Power Generation. Sustainability, 12(1), 127. https://doi.org/10.3390/su12010127