Article

Assessment of Mechanical Property Variation of As-Processed Bast Fibers

1
Division of Engineering Programs, State University of New York at New Paltz, New Paltz, NY 12561, USA
2
Sunstrand LLC, Louisville, KY 40206, USA
3
Department of Biology, State University of New York at New Paltz, New Paltz, NY 12561, USA
*
Author to whom correspondence should be addressed.
Sustainability 2019, 11(9), 2655; https://doi.org/10.3390/su11092655
Submission received: 30 March 2019 / Revised: 3 May 2019 / Accepted: 7 May 2019 / Published: 9 May 2019
(This article belongs to the Special Issue Sustainable Biobased Composite Materials)

Abstract

:
Hemp, flax, and kenaf are bast fibers with promising material characteristics to sustainably displace synthetic fibers used in composites; however, their use in composite applications is hindered by high material property variability. More widespread adoption and application, as well as improved quality methods, of fibers is contingent on the reduction of this variability. Efforts made herein to assess variability in as-processed fibers and methods were found to identify key sources of variability by investigating four areas: cross-sectional area approximation, physical defects, color and stem diameter, and fiber composition. Using fiber gage lengths closer to those found in composites, different geometric approximations of cross-sectional areas resulted in mean elliptical approximation showing the lowest variability across all fiber types. Next, by removing fibers exhibiting physical defects, maximum variation in tested flax fibers was reduced from 66% to 49% for ultimate tensile strength and 74% to 36% for elastic modulus. Additionally, fibers of darker color were found to have lower mechanical property variation than lighter or spotted fibers, and those coming from smaller stem diameters were found to be stronger than fibers from large stem diameters. Finally, contrary to previous findings with other lignocellulosics, clear trends between the lignin content in a fiber and its mechanical properties were not readily evident. Overall, these factors combined to significantly reduce mechanical property variation, while identifying the underlying contributing parameters.

1. Introduction

Bast fibers, a subset of natural fibers, have the potential to sustainably displace synthetic fibers in polymer matrix composites [1,2,3,4]. Growth of natural fiber use in plastic is forecast at 15–20% annually, while in other areas, such as automotive applications and construction applications, this is forecast to increase by 15–20% and 50%, respectively [5]. Demand for natural fibers is driven by their competitive specific mechanical properties and low production cost [6,7]. A variety of additional factors, such as low energy consumption during production and sound absorbing efficiency, add additional momentum to the natural fiber demand [5]. However, product design for composite applications typically require material properties to be benchmarked values with a small, concretely defined variance. More importantly, industrial-scale manufacturing at rates of tons of fiber per hour requires identification of key parameters of variation to ensure that quality practices may be established, as current methodologies (e.g., single fiber testing) are not feasible at such high throughputs. Thus, overcoming such practical impediments are critical in achieving widespread adoption as a fiber reinforcement for use in structural or semistructural engineered composite applications.
Various properties of natural fibers processed using a variety of methods have been studied previously [5,8,9]. However, and notably, the values of the generalized mechanical properties range widely, by as much as a factor of 3 for the strength of flax and kenaf [8]. When considering individual test groups, reported values vary for both tensile strength and elastic modulus [10,11,12,13,14,15,16,17,18,19,20,21]. A specific study of flax [22] resulted in more consistent mean strength values of 718–874 MPa; however, the standard deviation for these same cases ranged from 232 to 290 MPa. It is commonly noted that the most important variables are the structure, chemical composition, microfibrillar angle, and cell defects [5,23]; however, these do not entirely account for the variations noted. As such, there appear to be three main factors which account for the variability of all-natural fibers: agronomic factors, physical factors, and processing factors [5,24].
Agronomic factors refer to the natural fiber’s variety, growing conditions, and position within the stem of the selected fiber. Charlet et al. showed that flax fibers from the middle region of the stem exhibit higher mechanical properties than those extracted from the bottom or top of the plant [25]. Additional variation is shown to result between varieties of flax fiber [26]. Growth conditions such as plant age at harvest, soil quality, weather, and use of fertilizer have been shown to affect the mechanical properties and composition of various natural fibers [27,28].
Physical factors include the fiber’s composition, microfibrillar angle, and diameter. Most bast fibers are composed of an outer wall of pectin surrounding cellulose and hemicellulose strands, held together by lignin [8]. In flax fibers, the percent weight breakdown is roughly 71% cellulose, 2.2% lignin, 18.6–20.6% hemicellulose, 2.3% pectin, 10% moisture, and 1.2% wax [5,29,30,31,32,33,34,35,36]. The microfibrillar angle, or angle observed between the axis along the fiber length and the fibrils of the fiber, also impacts the mechanical properties. As this fibril angle decreases, the mechanical properties increase [37]. Strong dependence of mechanical properties on stem diameter has also been established: fiber from a low stem diameter leads to higher Young’s modulus and ultimate tensile strength [25,38]. Physical defects within a fiber also contribute to the mechanical properties.
Lastly, processing factors consist of chemical and physical treatments intended to alter the initial fiber conditions. They often aim to prepare fibers for usage within a specific application. For example, fibers used within textiles may be chemically treated with bleach or acidic compounds to condition their physical softness and color. Alternatively, natural fibers intended for use in composites are chemically surface treated to improve adhesion [39,40,41,42]. Such treatment is necessitated by the hydrophilic nature of natural fibers and hydrophobic nature of most composites. This creates difficulties when forming the composite matrix [7,28,43,44]. As the degree of polymerization of cellulose increases, the mechanical properties will also increase. The degree of polymerization (DP) of natural fibers varies depending on the species of the fiber; for example, the cellulose of flax averages around 8000 DP [28].
Detailed studies on the effects of pretreatments on the composition of non-bast natural fibers have been performed through the use of fluorescence confocal microscopy. Coletta et al. utilized this confocal microscopy to investigate the effect of alkali and acid pretreatments on the delignification of sugarcane bagasse [45]. Other non-bast natural fibers, such as agave plant fibers and wood tracheids, have also been investigated through fluorescence confocal microscopy [44,46,47]. The methods utilized by Hilda et al. were replicated in this study and applied to bast fibers in order to characterize the lignin content in commercially available fibers and investigate its relationship to material properties and their variation [46].
As noted, fiber variability results in wide-ranging reports of material properties for natural fibers, leading designers to oftentimes overdesign end-products by adding extra material or choosing simpler (i.e., more consistent), albeit less environmentally friendly, synthetic materials. This is particularly true with engineered fiber-reinforced plastics, which commonly require very small variations between fibers to reliably estimate their performance. Significant work has been performed to establish natural fiber performance, including investigating the accuracy of cross-sectional area [47,48]. Methods utilized back-calculated constituent properties from composite testing and developed a correction factor to address for inconsistent fiber cross-sectional area. While this novel approach is successful for the material system analyzed, the review by Shah et al. identified that back-calculating fiber properties leads to significantly different values than fiber testing [12].
While it is recognized that work is being performed in these areas, fundamental to all is the identification of the key parameters affecting the variation of mechanical properties for large-scale as-processed fibers. Establishing a top-down knowledge base that further identifies and understands these key parameters will lead to characterization of the effect of variations due to plant variety, growing conditions, retting, harvesting, and decorticating for specific uses. Understanding the performance of these material systems for use in composite applications will create the foundation for new design paradigms as well as new manufacturing and quality approaches. Further, this will enable improvement and expansion of optimized, engineered properties for the use of natural fibers, increasing commercial viability. Thus, the work herein contributes to the identification and understanding of key parameters affecting fiber performance.
Building upon the works noted above, the aim of this study is to identify and analyze the key parameters toward characterizing bast fibers for use in long (>20 mm) fiber-reinforced composites. Further, this work utilizes as-manufactured fibers taken directly from current commercially available flax, hemp, and kenaf fibers, which are investigated simultaneously. Contributing factors to the variation were then considered using individual fiber types in order to characterize their effect on variation. The materials and methods utilized to conduct each of the processes in the analysis are commonly accepted for investigating bast and other natural fibers. The results and discussion of four main areas are investigated: formulation for the approximation of cross-sectional area of a fiber; exploration of the relationship between physical defects and mechanical property variation; investigation of relationships between fiber diameter, fiber color, and ultimate tensile strength; and exploration into microstructure and the resulting mechanical properties. Findings in each of these areas of investigation are then summarized.

2. Materials and Methods

2.1. Materials and Equipment

This work utilized natural fibers as provided by Sunstrand LLC, located in Louisville, Kentucky, to investigate the variability of their fibers’ mechanical properties [49,50]. Technical fiber strands of greater than 25 micrometers in diameter were attached to plastic mounting tabs [51] using Loctite 3972 UV light curing adhesive (Henkel Corporation, Westlake, OH, USA). The diameters were measured using a Fiber Dimensional Analysis System and the supplied mounting tab system [51]. Common tweezers were utilized to aid the mounting process. Tensile testing was performed using these same mounted samples [51]. Confocal microscopy was performed using a Leica TCS SPE spectral confocal microscope (Leica Microsystems Inc., Buffalo Grove, IL, USA). Fibers were wetted for view on the confocal microscope using a standard micropipet.

2.2. Fiber Treatment

The provided hemp, flax, and kenaf fibers were processed by Sunstrand before being supplied for testing. In all cases, fibers were grown and field-retted to their specification. Sunstrand’s large-scale proprietary processes of mechanically opening, cleaning, decorticating, and separating were utilized in all cases, producing fibers intended for use in long fiber composite materials (100–200 mm). This dry processing was complemented with chemical processing in the cases noted and bleached using a proprietary wet process to remove color and degum the fiber. All materials tested are commercially available from Sunstrand.
Sunstrand’s proprietary process for the materials provided to this study follows a general three-step mechanical process, with an optional fourth cutting operation to reduce length, after field retting and before optional chemical processing. These steps start with bale opening, where stalks are mechanically unpacked and cut below 600 mm. After bale opening, decortication, where the majority of core is removed from the fiber via the use of beater drums and separation screens, is performed. The third step is referred to as refining and is where the remaining core is removed; fiber bundles are opened via pinned cylinders which act as combs, pulling and tearing the fibers from one another.
Bleached fibers move onward from primary mechanical processing to a two-step chemical processing ending with fiber dewatering, drying, and a final pinned cylinder to open bundles formed as a result of hydrogen bonding. The initial chemical step is scouring through the use of sodium hydroxide that removes waxes, oils, and pectin, aiding the next process, the second chemical step, where bleaching is conducted through hydrogen peroxide, changing the color to varying degrees depending on the requirements of the product.

2.3. Fiber Characterization

2.3.1. Preselection and Selection
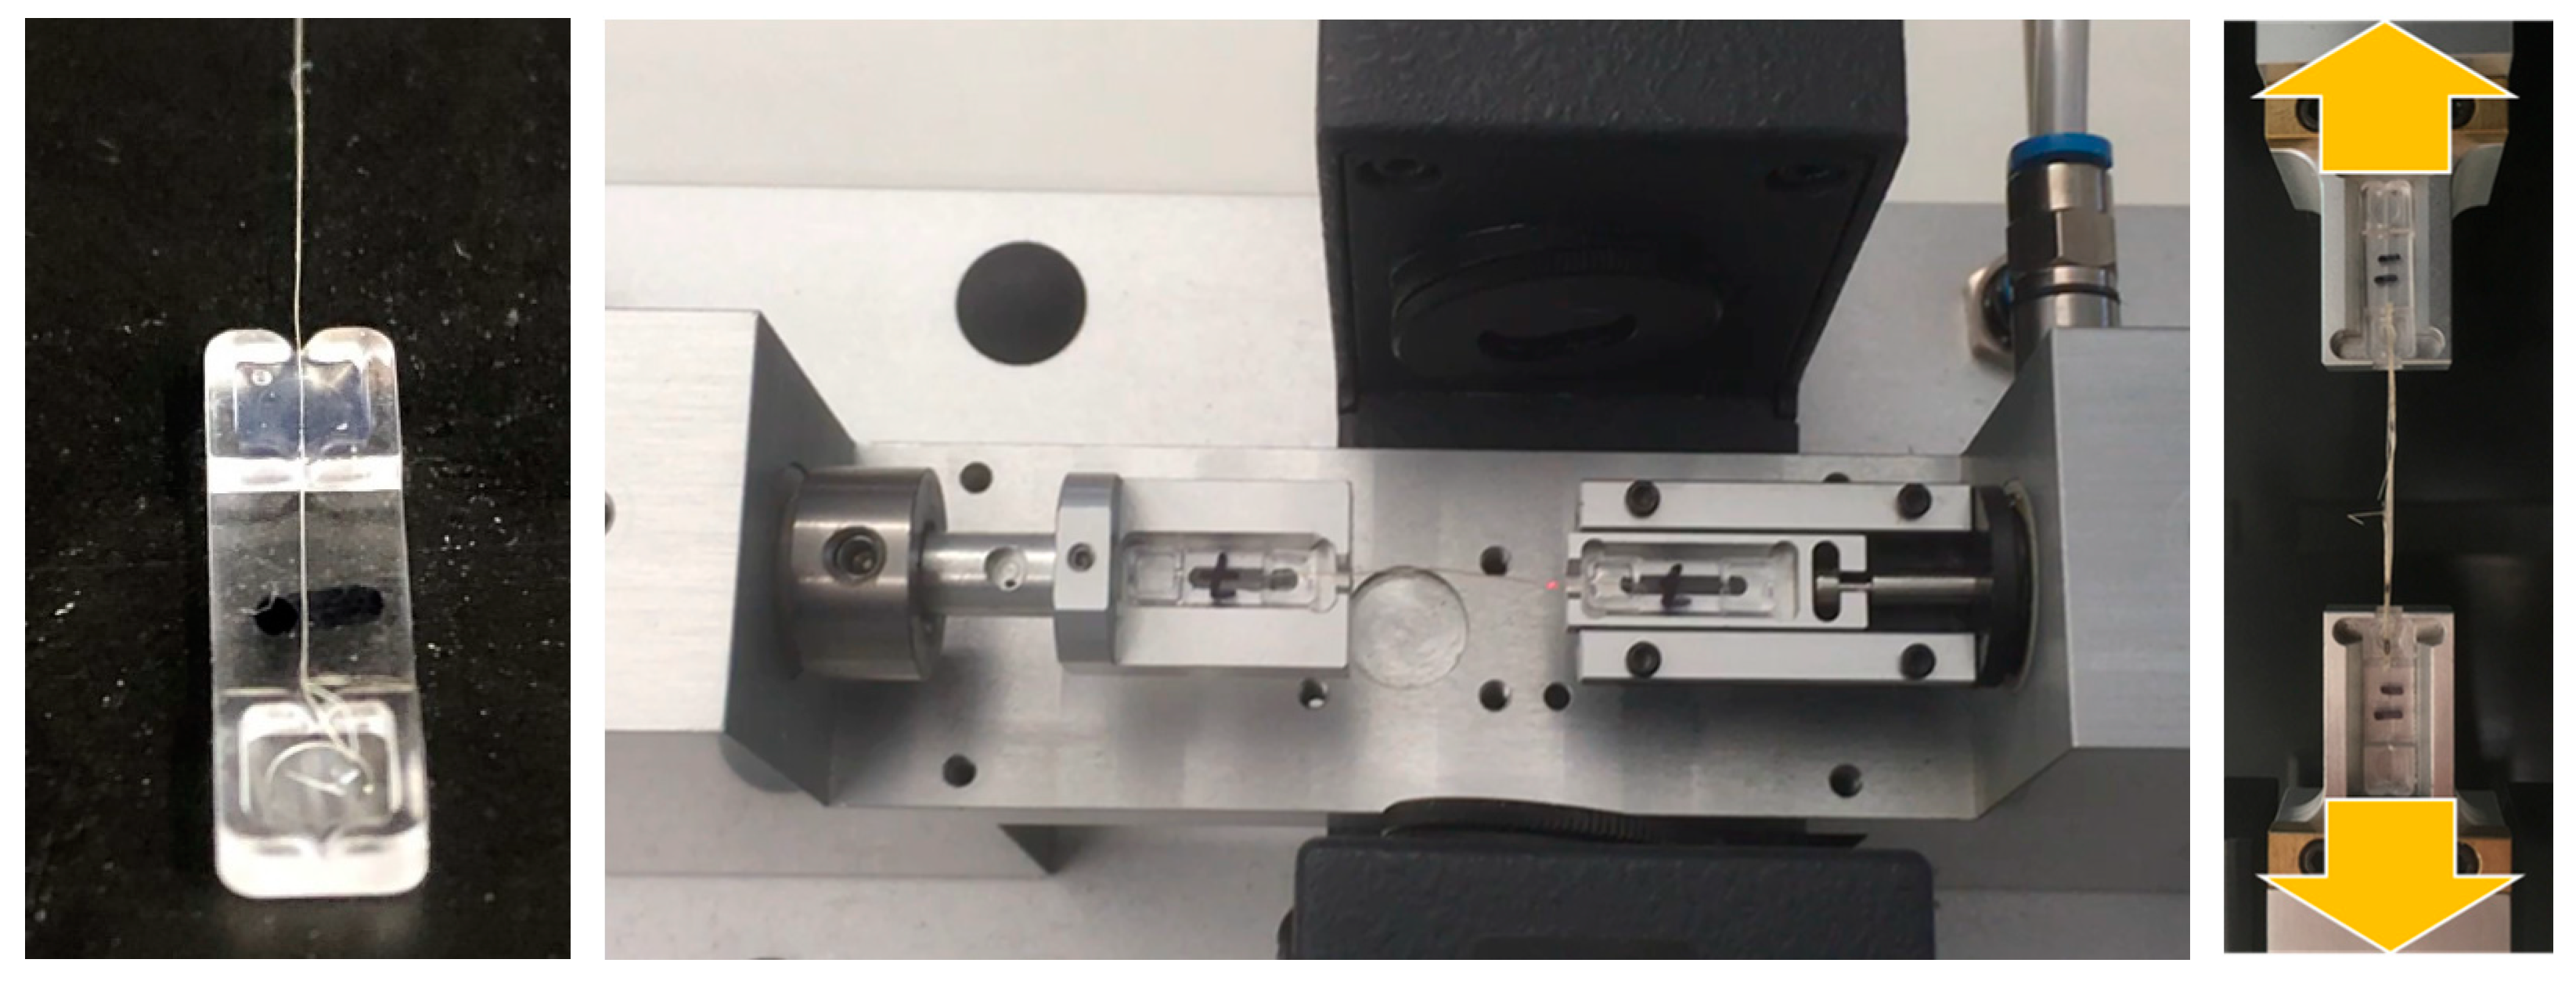
Single technical fibers were pulled from a processed bundle of loosely accumulated fibers according to a standardized and documented internal lab procedure before observing the morphology along the length of the specimen. Minimal additional separation took place at this point, and gage sections were chosen to be clear of unwanted strands and elemental fibers. A subset of fibers viewed under a digital binocular compound microscope at 5× to 20× magnification. The consistency of the fiber’s shape was observed along its gage length and images were captured with the use of the white light microscope. Fiber characteristics such as fraying, kinks, or inconsistencies, as defined in Table 1, were recorded. While the majority of fibers with these characteristics were tested, in groups with a white light microscopy selection process, fibers exhibiting these characteristics were discarded prior to testing.

2.3.2. Mounting

Once observed, each fiber was mounted using a UV curable resin onto disposable plastic tabs with a V-shaped groove, as seen in Figure 1. The mounting board ensured a gage length of 20 mm to be used for tensile testing. While others have notably tested fibers using a shorter length (4–10 mm) to reduce variation, this longer length was chosen as it represents a length more common to the composites industry [12]. Given the intent of the investigation, it was deemed important to assess the fiber as close to the intended use state as possible. After mounting, the excess fiber length was cut and saved for additional analysis, such as confocal microscopy.

2.3.3. Fiber Dimensional Analysis

Dimensional data on the cross sections of the fibers were collected using a Fiber Dimensional Analysis System (FDAS7200) [51]. Typically, the diameter of the fiber was the mean of at least three measurements along the length of the fiber [11,25,52]. In this case, the diameters at five positions along the gage length were recorded with a laser micrometer. At each position the fiber was rotated, allowing the varying diameter of each position to be recorded. The cross-sectional areas at each position along the length were averaged and then used to determine stress. Several different approximations of the cross-sectional area based on diameter measurements were compared: minor circle, major circle, rectangular, and mean-elliptical. Similar work in this area has included approximations such as convex-hull and super-ellipse [48]. Convex hull measurement was not feasible utilizing the FDAS7200, also making the super-ellipse approximation infeasible.
Dimensions taken by the FDAS measured diametrical components along the fibers’ gage length. Approximations of the cross-sectional area consisted of three geometrical shapes based on these diameters: circular, rectangular, and elliptical (Figure 2). The minor and major circular approximations used the minimum and maximum diameters, respectively. The rectangular used the average of all diameters measured for an individual fiber, while the elliptical used both the minimum and maximum diameters for the minor and major axis lengths, respectively. An image of a representative bast fiber can be seen in Figure 2, with an estimated pentagonal fiber shape shown below it. Each of the fiber area approximations are then shown, visualizing the associated error of each method.

2.3.4. Fiber Tensile Testing

Once the geometry of a fiber had been characterized, the fiber was tested to failure on a Linear Extensometer (LEX820) tensile frame [51]. Using the equipment noted, test methods were derived from ASTM C1557 [53]. During tensile testing, the break-force detection was set to 2 gmf for flax and 5 gmf for hemp and kenaf, as flax was noted to fail more progressively, whereas hemp and kenaf were more rapid. This load data was then used with the appropriate cross-sectional area to calculate axial stress and determine mechanical properties, specifically elastic modulus and tensile strength. Broken samples were kept for further analysis such as confocal microscopy. Fibers were generally tested in groups of 20, with total valid tests counts identified in Table 2. When an invalid test occurred (e.g., grip or adhesive failures), the fiber was discarded and replaced unless otherwise noted.

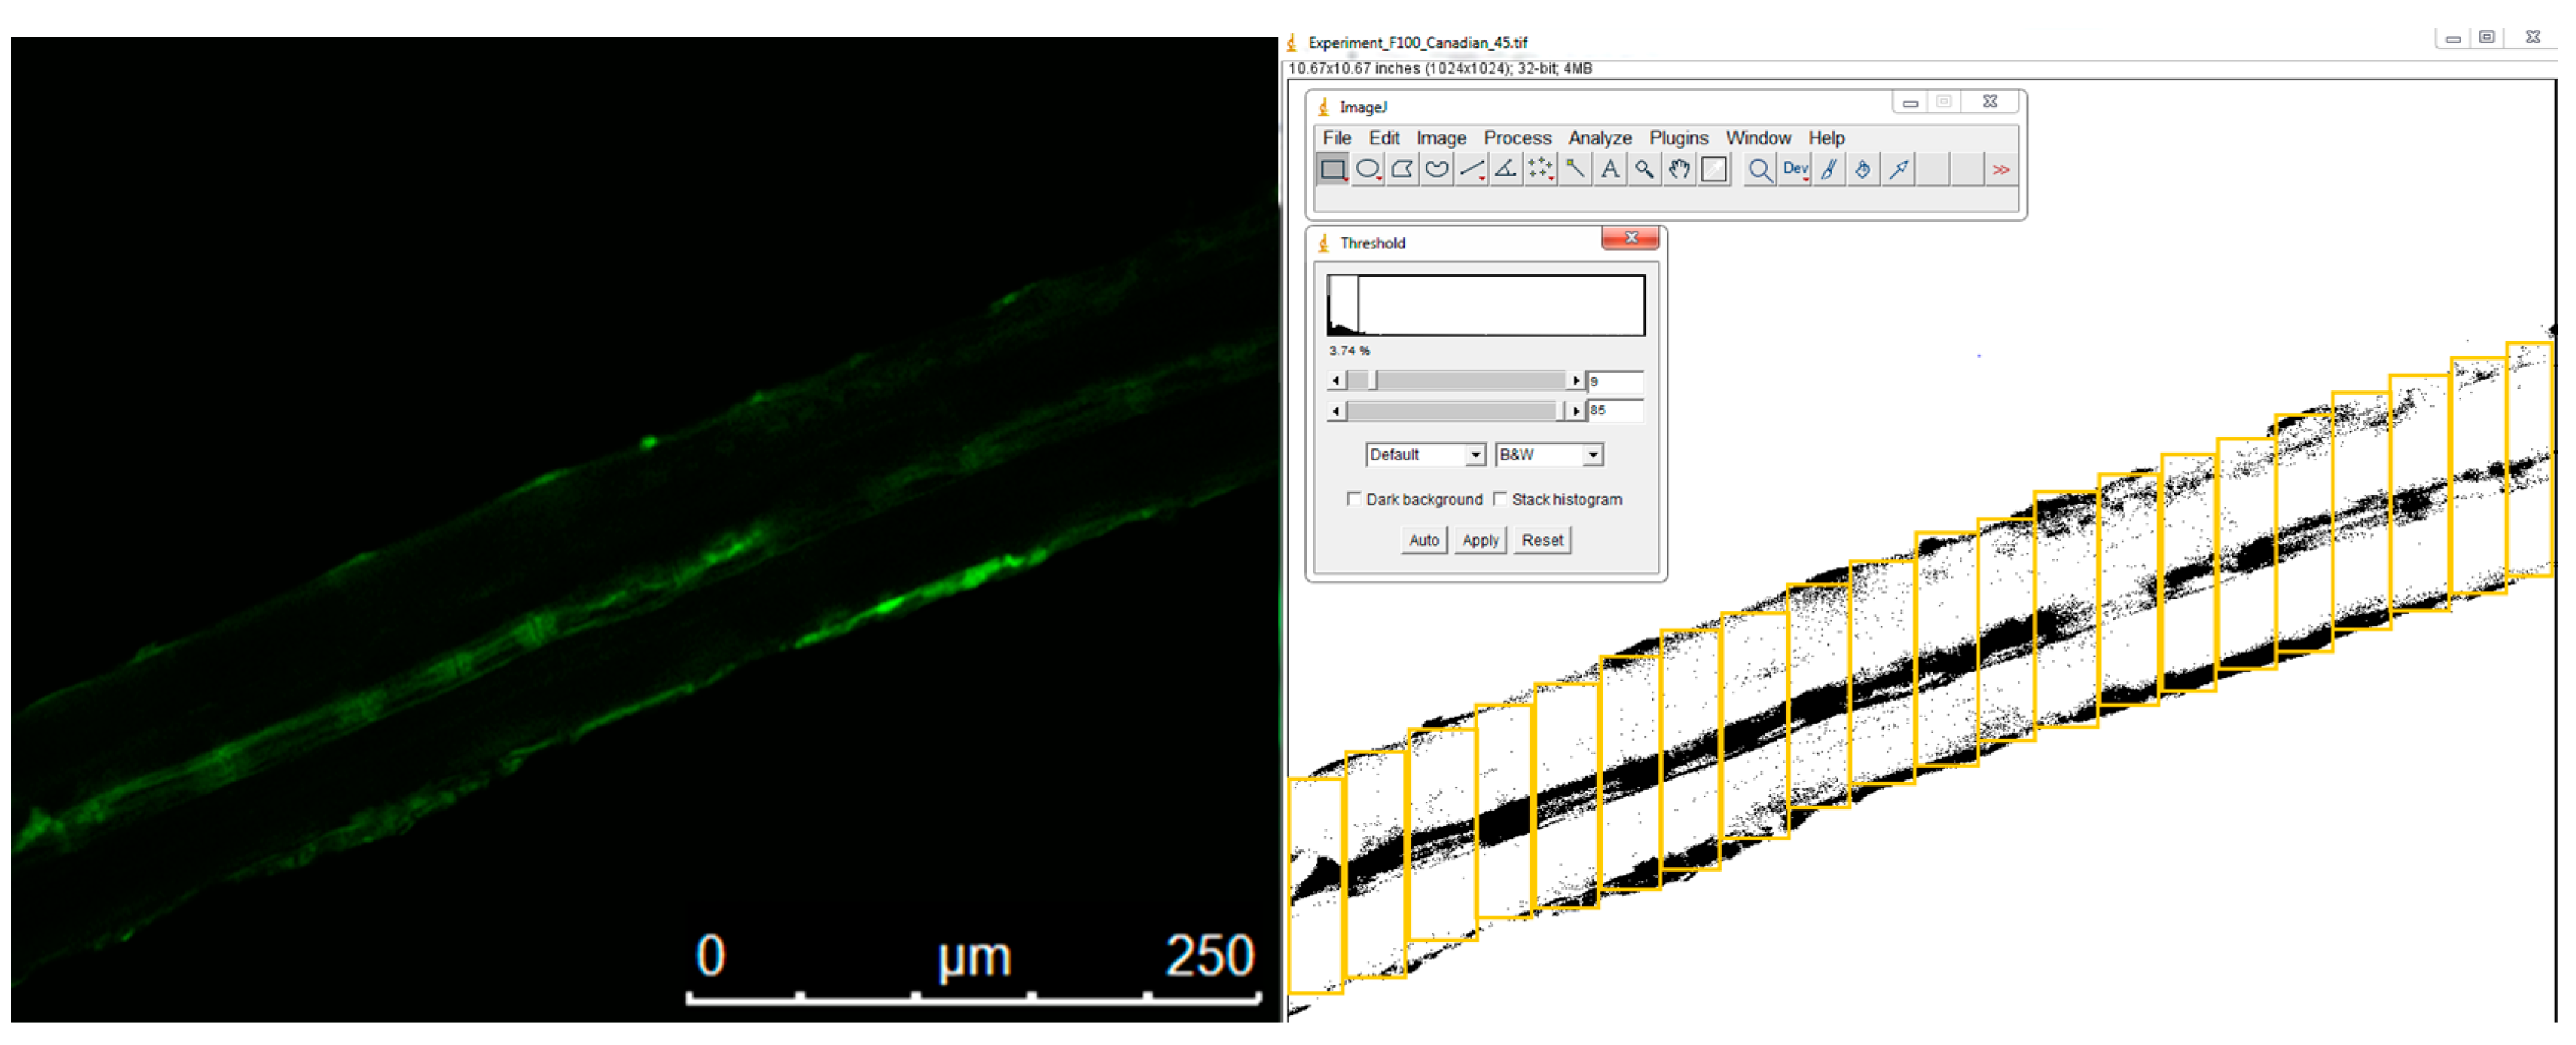
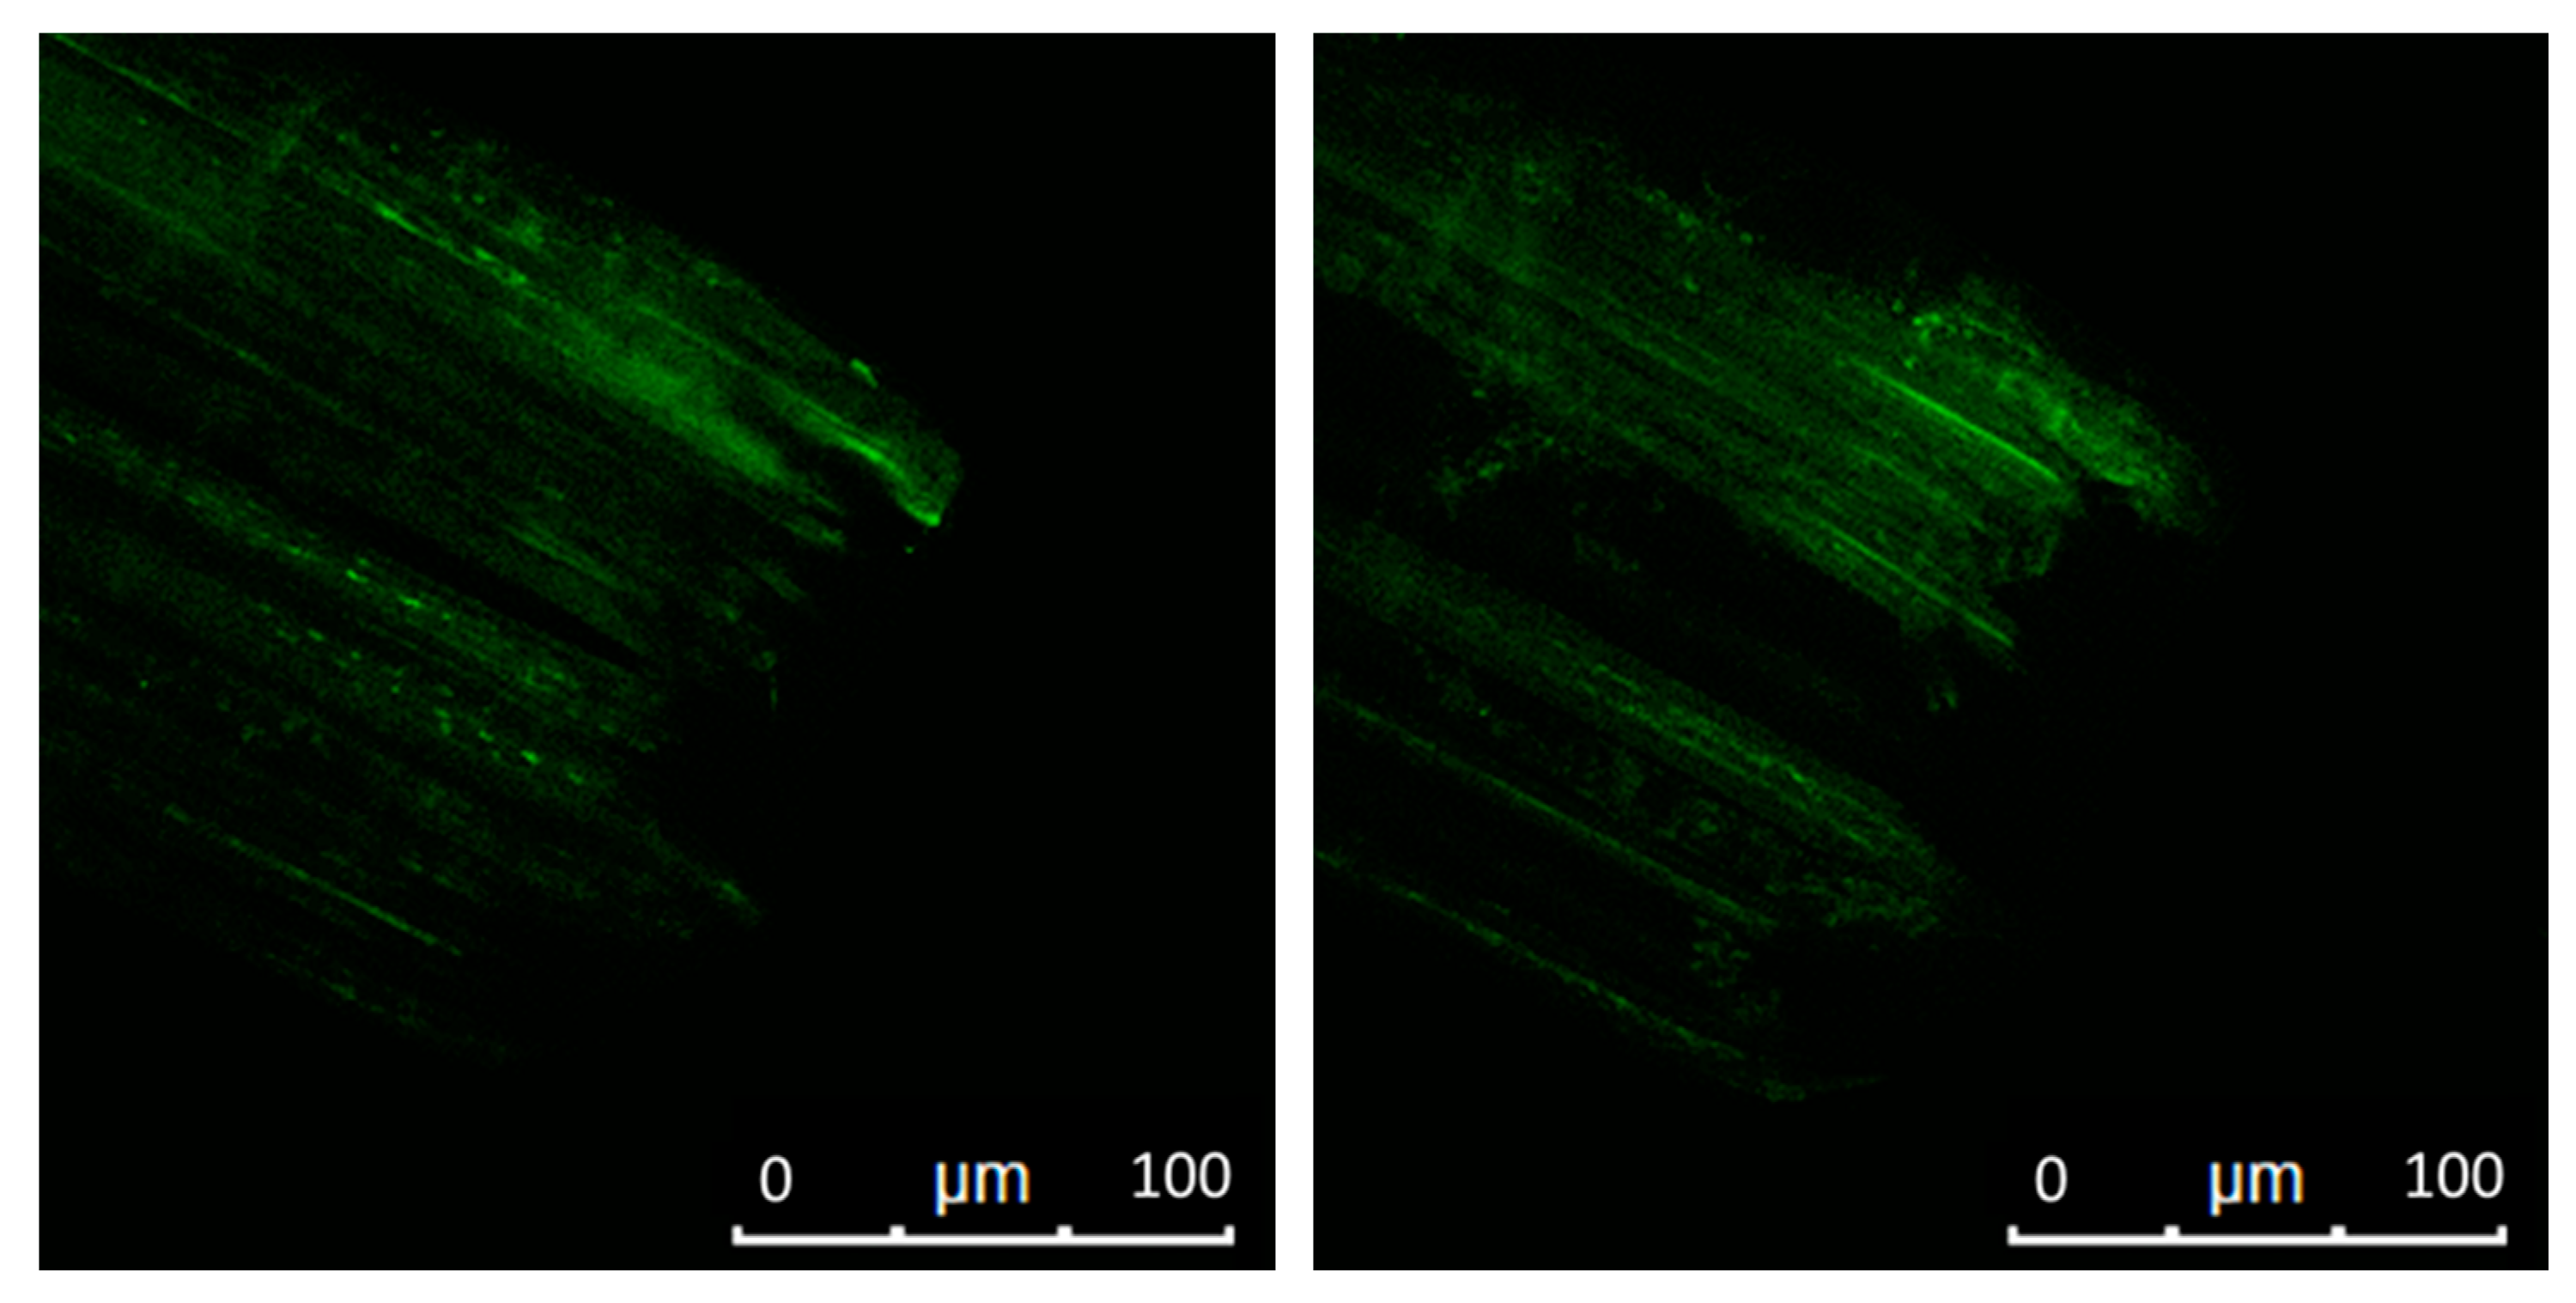
2.3.5. Confocal Microscopy and Image Processing

Following the methods identified by Hilda et al., confocal microscopy was performed in order to determine a fiber’s lignin content and distribution [46]. Excess fiber length samples were wetted with 8 µL of water in order to activate the autofluorescent lignin. A Leica TCS SPE spectral confocal fluorescence microscope using the LAS X software package was used to image the fibers’ morphology. Excitation of the autofluorescent components was performed using an argon laser emitting at 488 nm with an intensity of 61.7 and detection range of 525–610 nm, with the gain set to 992. These laser settings result in the excitation of lignin, which then emits within the above green light spectrum and can be detected. Single images of the fiber along its length and at each breakpoint were taken at the mid-plane using a frame averaging value of 6 to eliminate nonspecific signal, and then exported from the software in .tiff format.
ImageJ was utilized to post-process the imaged fibers [54]. The image was imported as a .tiff file, adjusted to 32-bit, and set to a minimum threshold of 9, with no maximum threshold. This adjusted the image from the black and green image seen on the left of Figure 3 to the black and white image on the right. The rectangle tool was then used to outline the fiber area in small segments. Figure 3 (right) also shows how the rectangles were overlaid on a typical fiber after adjusting the type and threshold of the image. The measure feature then counted the pixels of highlighted (lignin) to nonhighlighted (cellulosic) pixels for each rectangle and calculated the percent area of lignin. Excel was utilized to combine the lignin and cellulosic pixel count of each individual rectangular portion into a total, and then calculate an overall percent area of lignin.

3. Results and Discussion

Investigating the causes of high variation in natural fibers consisted of several hypothesis-driven experiments. To begin, various cross-sectional area approximations were hypothesized to affect the standard deviation with respect to the mean (variation). A cross-sectional area approximation which minimized variation was sought. Next, the presence of physical defects such as kinks, fraying, and inconsistent thicknesses believed to cause variation in natural fiber properties were investigated. Additionally, variations in color in unbleached fibers were studied to relate color to the strength of the fiber. Finally, confocal microscopy was utilized to determine if lignin content consistently indicates a fiber’s material properties.

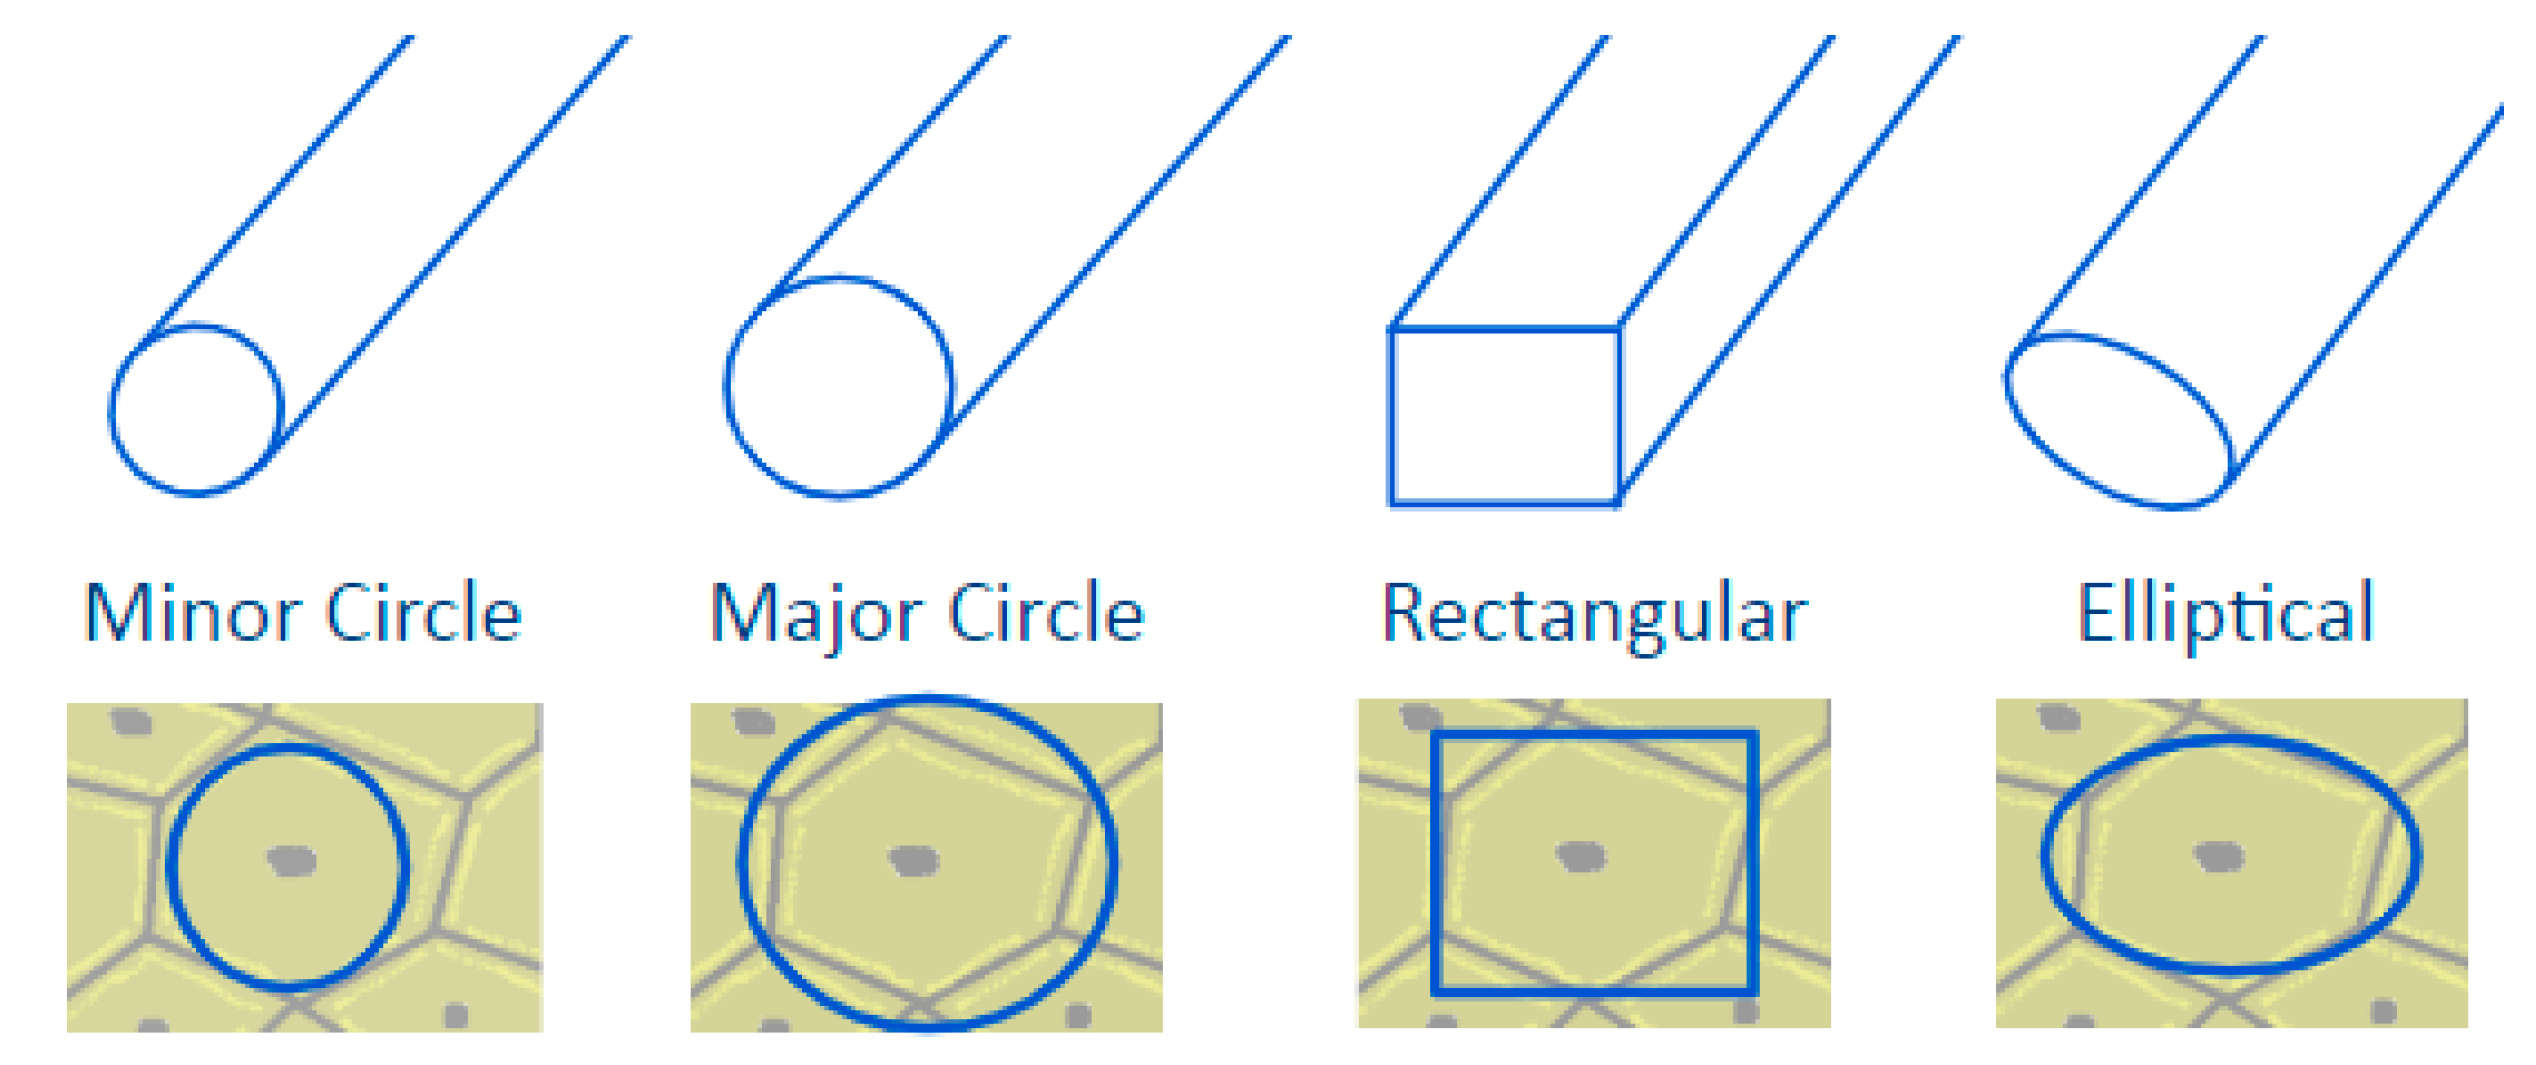
3.1. Cross-Sectional Approximation

Using diametral and tensile data of the fibers tested, elastic modulus and tensile strength values were calculated for each of the cross-sectional area shapes considered along with their standard deviation. Results for both modulus and tensile strength for hemp, flax, and kenaf fibers are shown in Table 2 for each cross-sectional area approximation.
Approximating the area as a circle using the minimum and maximum diameter of the fiber led to the largest and smallest material property values, respectively. Rectangular and elliptical approximations resulted in mid-range modulus and tensile strengths. These results reflect the expected effects on calculated stress. Effects on the standard deviation as a percent of mean (variation) did not mirror the changes in material property values. Variation in both maximum and minimum diameter approximations approached 100%, while rectangular and elliptical approximations were lower. The lowest approximation across all fiber types was the elliptical approximation. In particular, hemp had the lowest variation of the fiber types tested. The remaining high variability indicated the need for further investigation; however, the elliptical cross-sectional area was hereafter established as the default for calculating mechanical properties. This finding reflects conclusions made by Virk et al., holding elliptical approximation as the best estimation given the impracticalities of convex-hull estimation [48].
To better understand the remaining causes of the variation of the tensile strength values observed for each fiber, microscopy of post-failure fibers was performed to identify the breakage types. Two representative fibers are shown in Figure 4, with respective tensile strengths of 153 MPa and 41.8 MPa. Imaging of the stronger fiber reveals what is actually a fiber bundle breaking into multiple strands (left). Alternatively, imaging of the lower tensile strength fiber shows a clear breakage of what appeared to be a single strand (right). While normalization in calculating stress should account for load variations, it is apparent that there are additional effects impacting fiber strength. It was posited that the high numerical variability in the obtained data was the result of physical differences in the individual defects and fiber morphology of each fiber. Thus, a larger bundle will achieve higher strengths as load redistribution may occur through the surrounding fibers. In this vein, more detailed explorations into the effects of physical defects and fiber morphology were conducted.

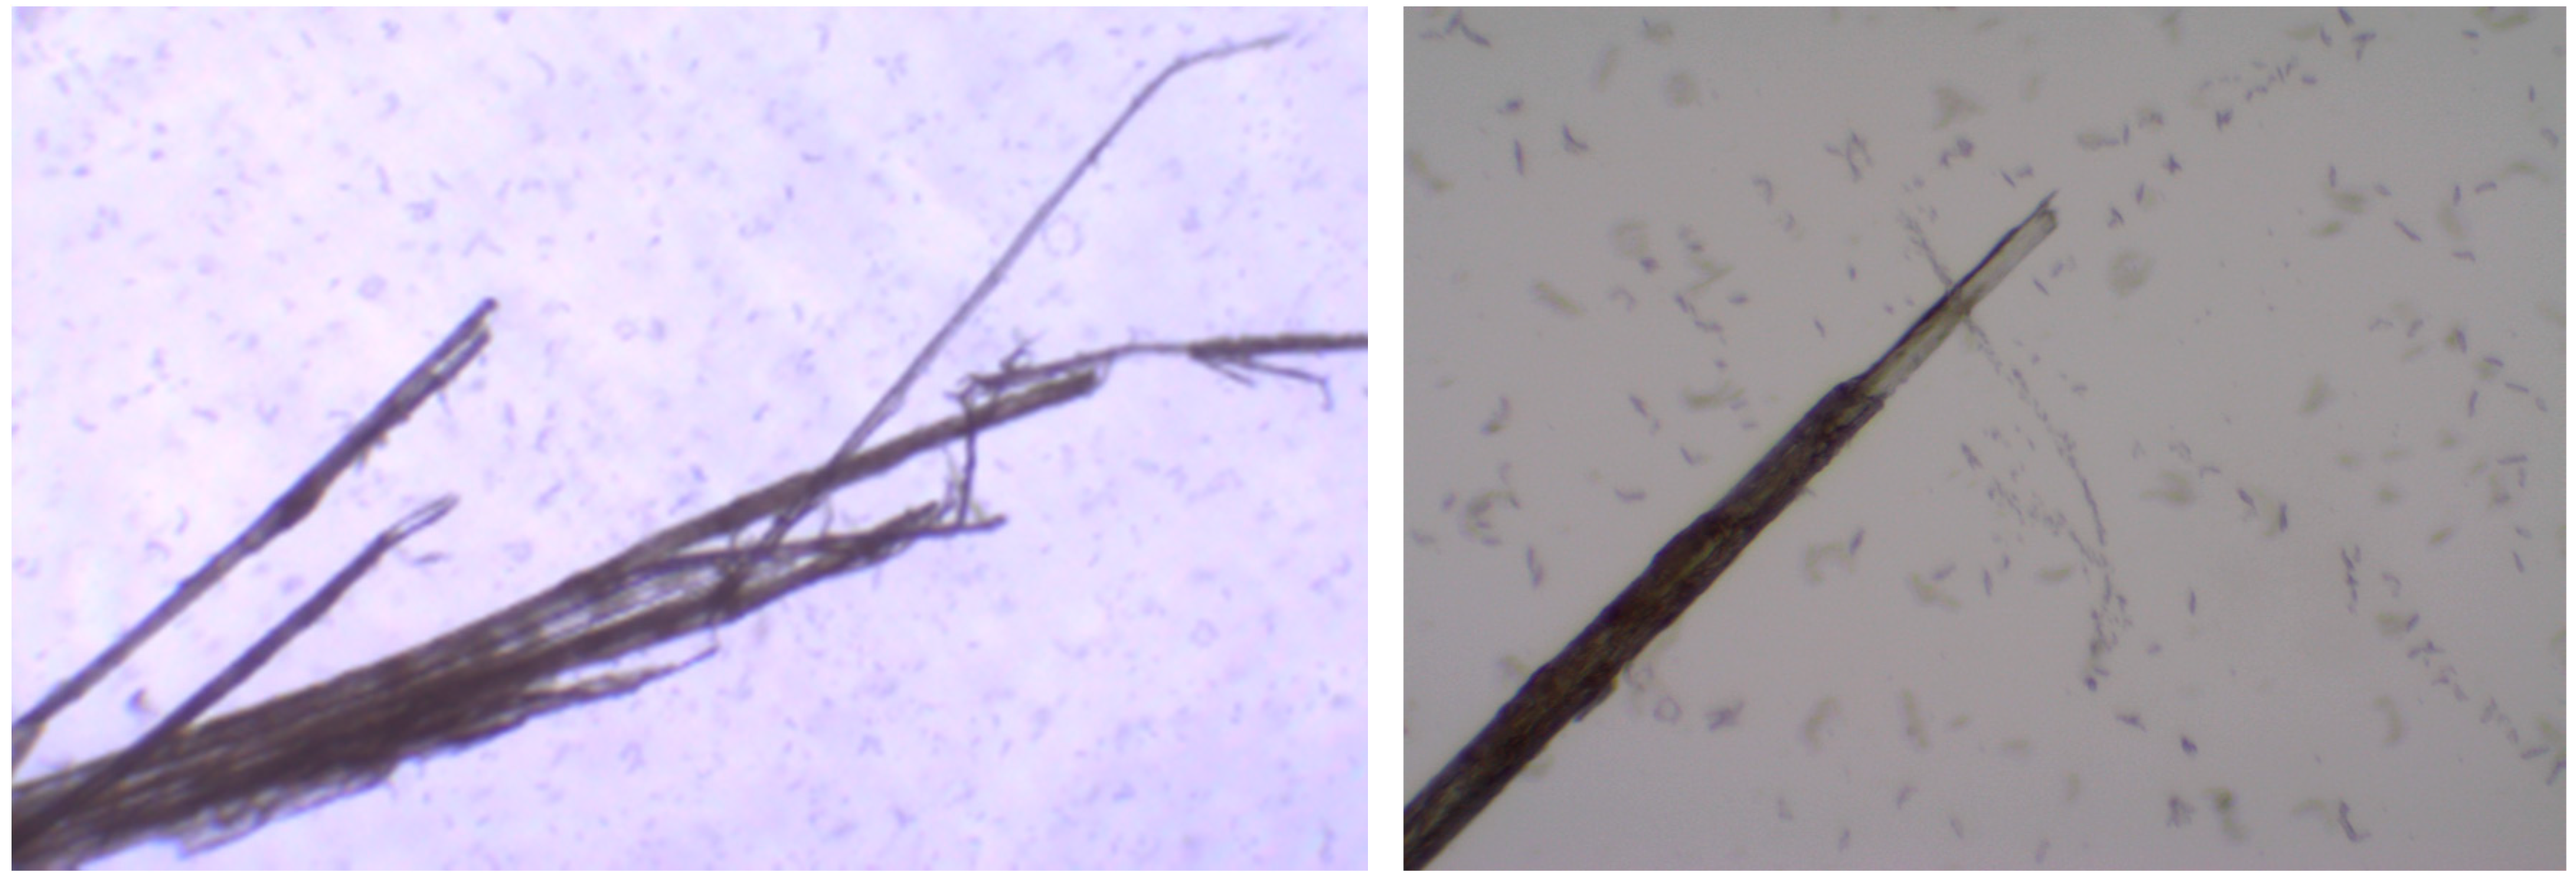
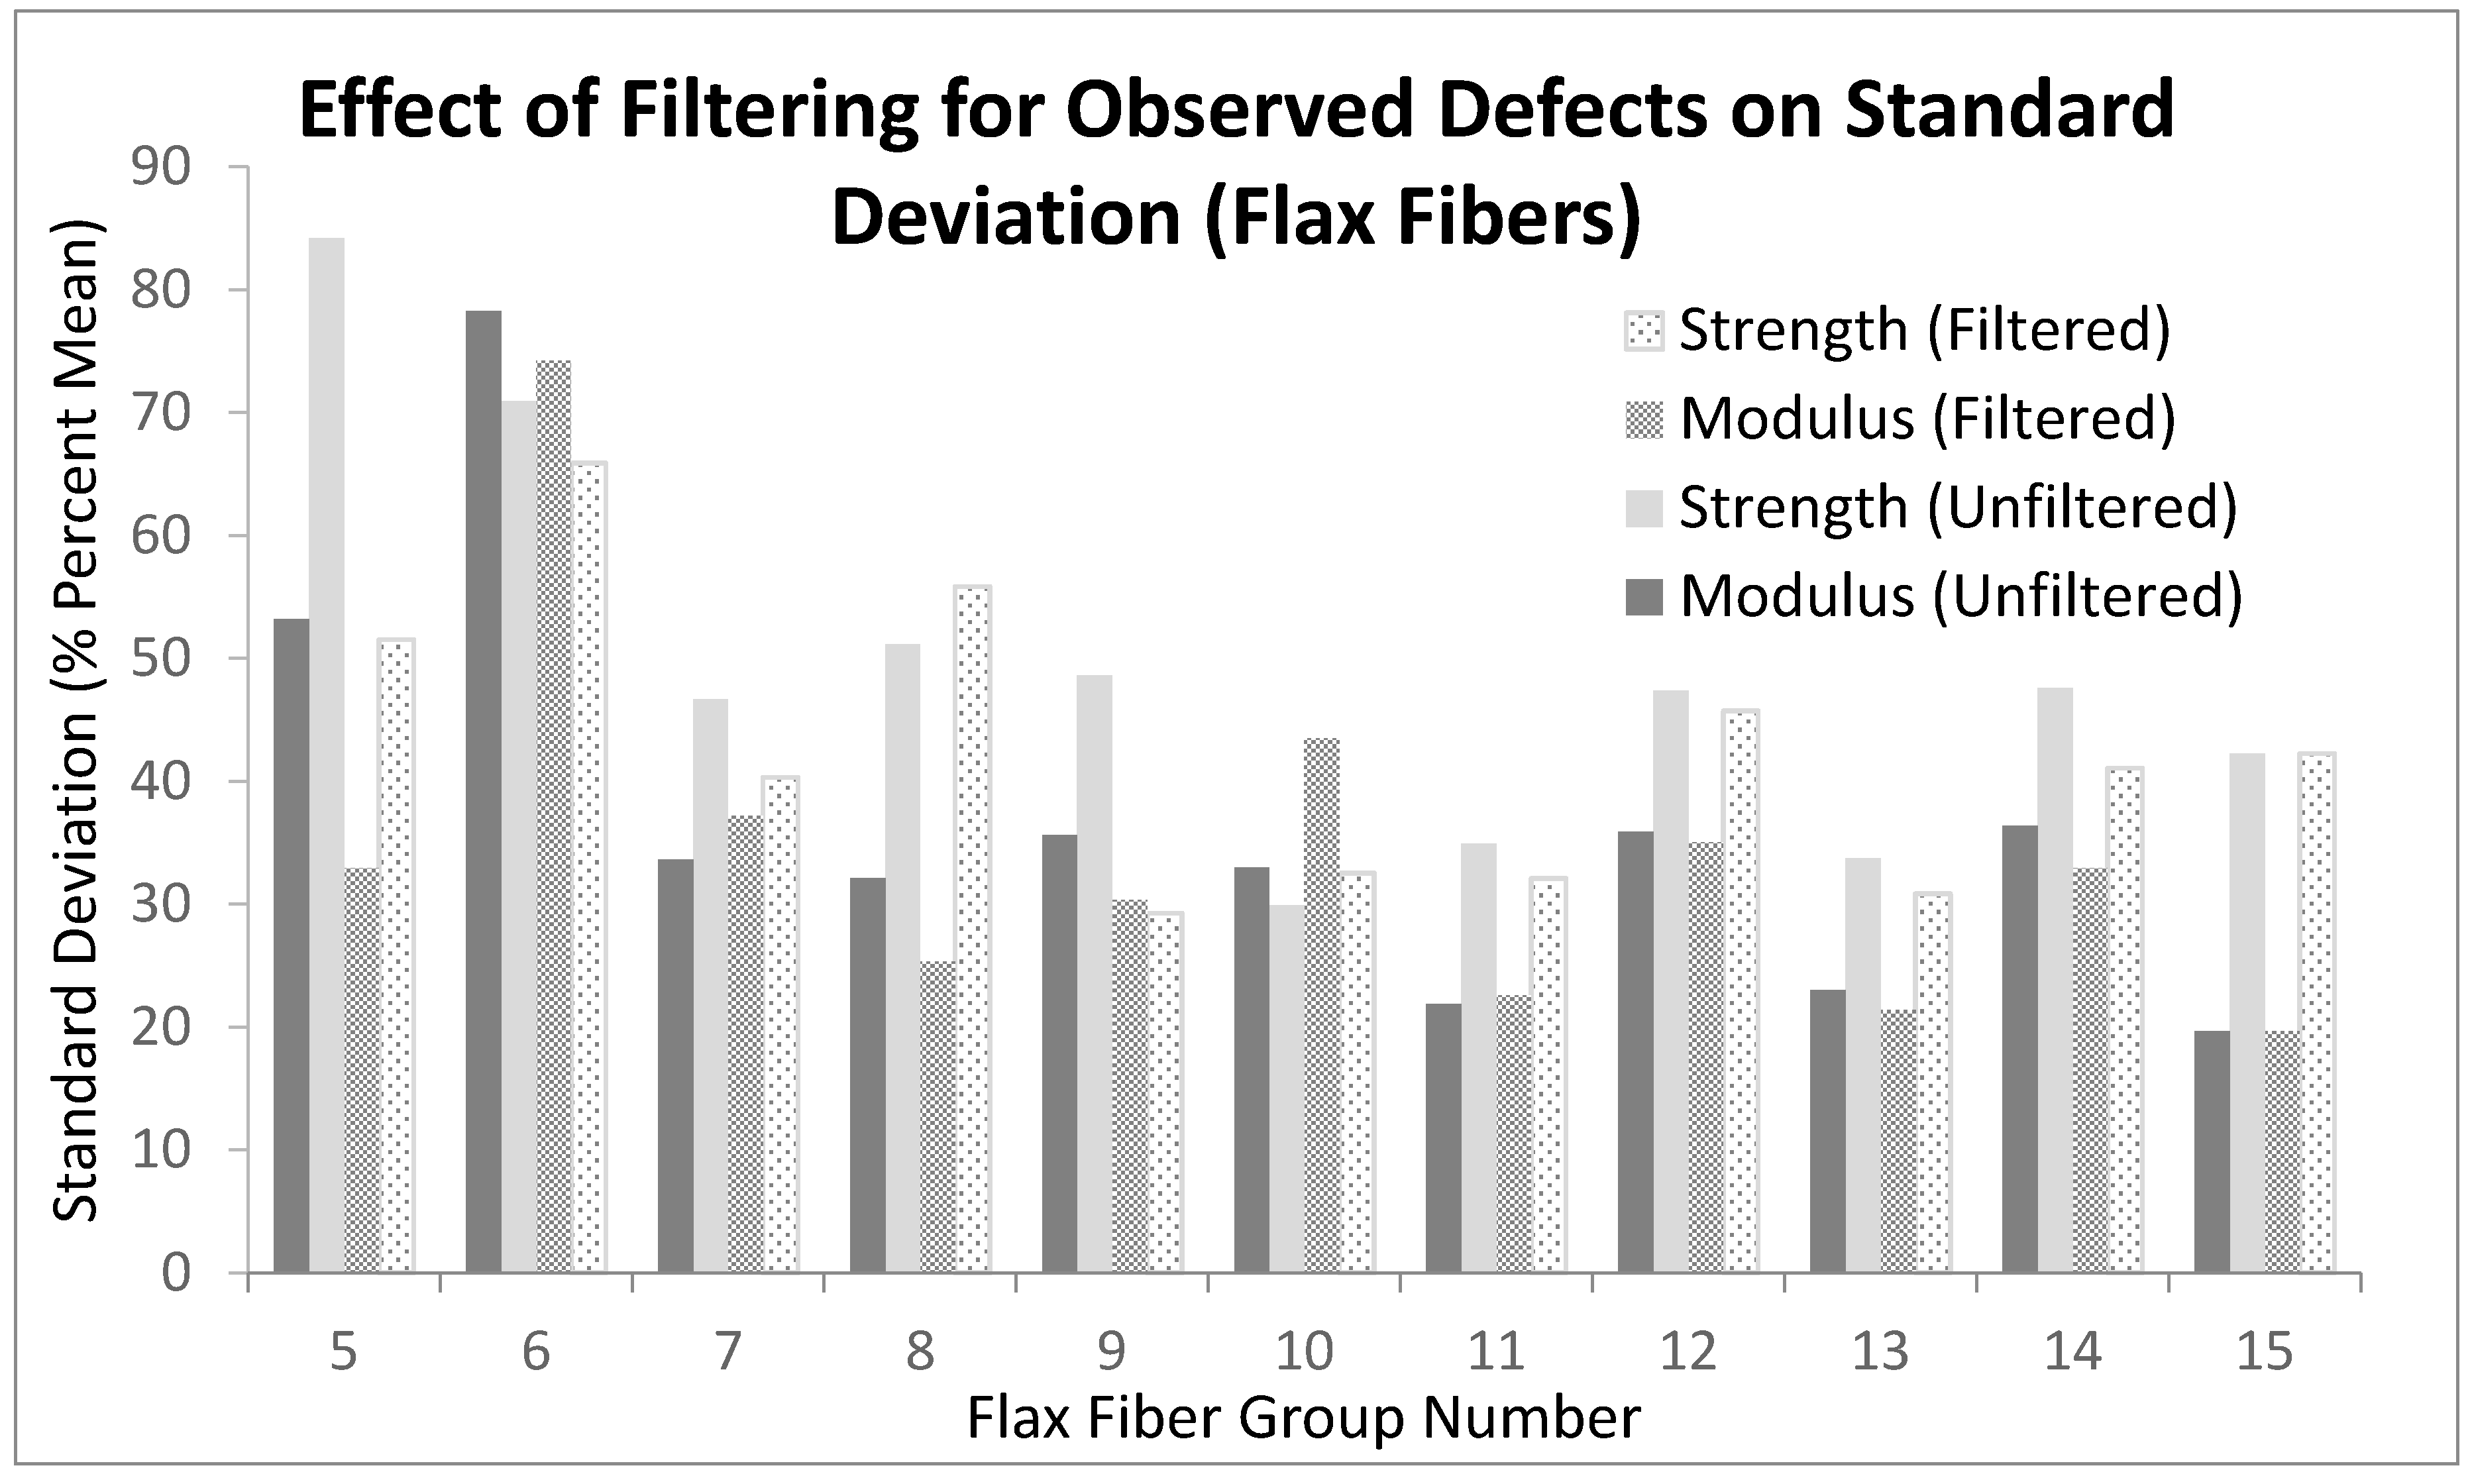
3.2. Observed Physical Defects

The observed importance of physical differences in tested fibers suggested the need for further examination of their impact on mechanical properties. It was hypothesized that variation of material properties could be limited by accounting for physical differences in the form of defects. Data were sorted based on observed characteristics made before, during, and after each fiber was tested. To minimize variability, hemp fibers were utilized; thus, the baseline values used were 21 ± 9 GPa for modulus and 337 ± 207 MPa for strength, as shown in Table 2.
Using the observations taken during fiber selection (Table 1), fibers were first sorted to remove transient data due to grip failure or unexplained loss of load carrying capability; however, there was no change in the baseline mean or standard deviation. Next, only specimens of consistent thickness along the length of the fiber were considered, and while there was no significant change in the modulus values, the mean of the strength increased to 390 MPa with a negligible drop in the standard deviation (207 MPa to 206 MPa). Following the results from the analyzed hemp data, a similar investigation of a subset of the flax fibers tested was performed as these groups had the largest number of defect-free tests. Separate groups, which varied in both type and processing methods, were tested and analyzed. In these datasets, variation of both modulus and tensile strength before and after filtering for kinks, inconsistencies, fraying, and transient data due to grip failure or unexplained loss of load carrying capability is shown in Figure 5.
Within the subset of flax fiber data, groups 5–9 and 11–14 consisted of 40 fibers selected by eye and observed for the previously specified defects. Variation of modulus improved in groups 7 and 9 after filtering, with an average improvement of 6%. Tensile strength variation dropped in groups 8 and 9, with an average improvement of 10%. Although variation was reduced, both the range and magnitude of variation in modulus and tensile strength remained high, at 20–74% and 29–66%, respectively. It was theorized that observations by eye were not sufficient to observe all defects, and as a result, unobserved defects were still accounting for a significant portion of the variation.
White light microscopy was utilized as a more detailed method of defect identification to select fibers without any observed physical defects. Groups 10 and 15 in Figure 5 consisted of 10 fibers selected and tested, intending to look more closely at the impacts of these defects that resulted in groups 5–9 and 11–14, respectively. Observations were still made by eye for filtering purposes, and because defects were already accounted for in the preselection, variation did not change after filtering (see group 15 of Figure 5). However, several data points in group 10 were unusable due to grip failures, and a resulting increase in variation due to the limited dataset size is noted as these fibers were not easily replaced.
Combining the results of fibers filtered only by eye observations and comparing them to the results of fibers preselected with white light microscopy shows that more accurately assessing fiber defects decreases variation. Fibers undergoing white light microscopy preselection had variation in tensile strength of 49%, while those only filtered by eye observations had variation of 74%. For modulus, variation reduced from 74% to 36% between eye observation filtered and white light microscopy preselected fibers, respectively. Overall, accounting for material defects reduced the magnitude of standard deviations with respect to the mean value of both modulus and strength.

3.3. Stem Diameter and Fiber Color

Stem diameter (stems <1 cm, 1–2 cm stems, and 2–3 cm stems) of hemp fibers grown together were tested. After testing at least 60 fibers from each of these groups and using the elliptical cross-sectional area approximation, the modulus values and tensile strengths were found to decrease as diameter increased, matching the diameter trends noted previously [22,38]. While this was not a new finding, it confirmed the fiber testing methods utilized herein.
Analysis was performed based on the observed color of each fiber (i.e., light, spotted, and dark), which may be associated with degree of retting [44]. Unbleached hemp from the 296 records grouped together in Table 2 were separated and sorted according to these three categorizations. Mean and standard deviation of each group was determined. Little difference from the overall mean and standard deviation in Table 2 above was noted for the light and spotted groups, though the dark group was noted to have reduced standard deviations. These were further reduced when the same defect groups noted above were deselected, resulting in 22 ± 6 GPa and 296 ± 135 MPa for modulus and strength, respectively. It is notable that 12% of the records analyzed consisted of the darker fiber color, indicating that darker fibers are less common. To better understand these implications as well as those from the sources of variation already observed, the composition of the fiber was taken into consideration with the use of confocal microscopy.

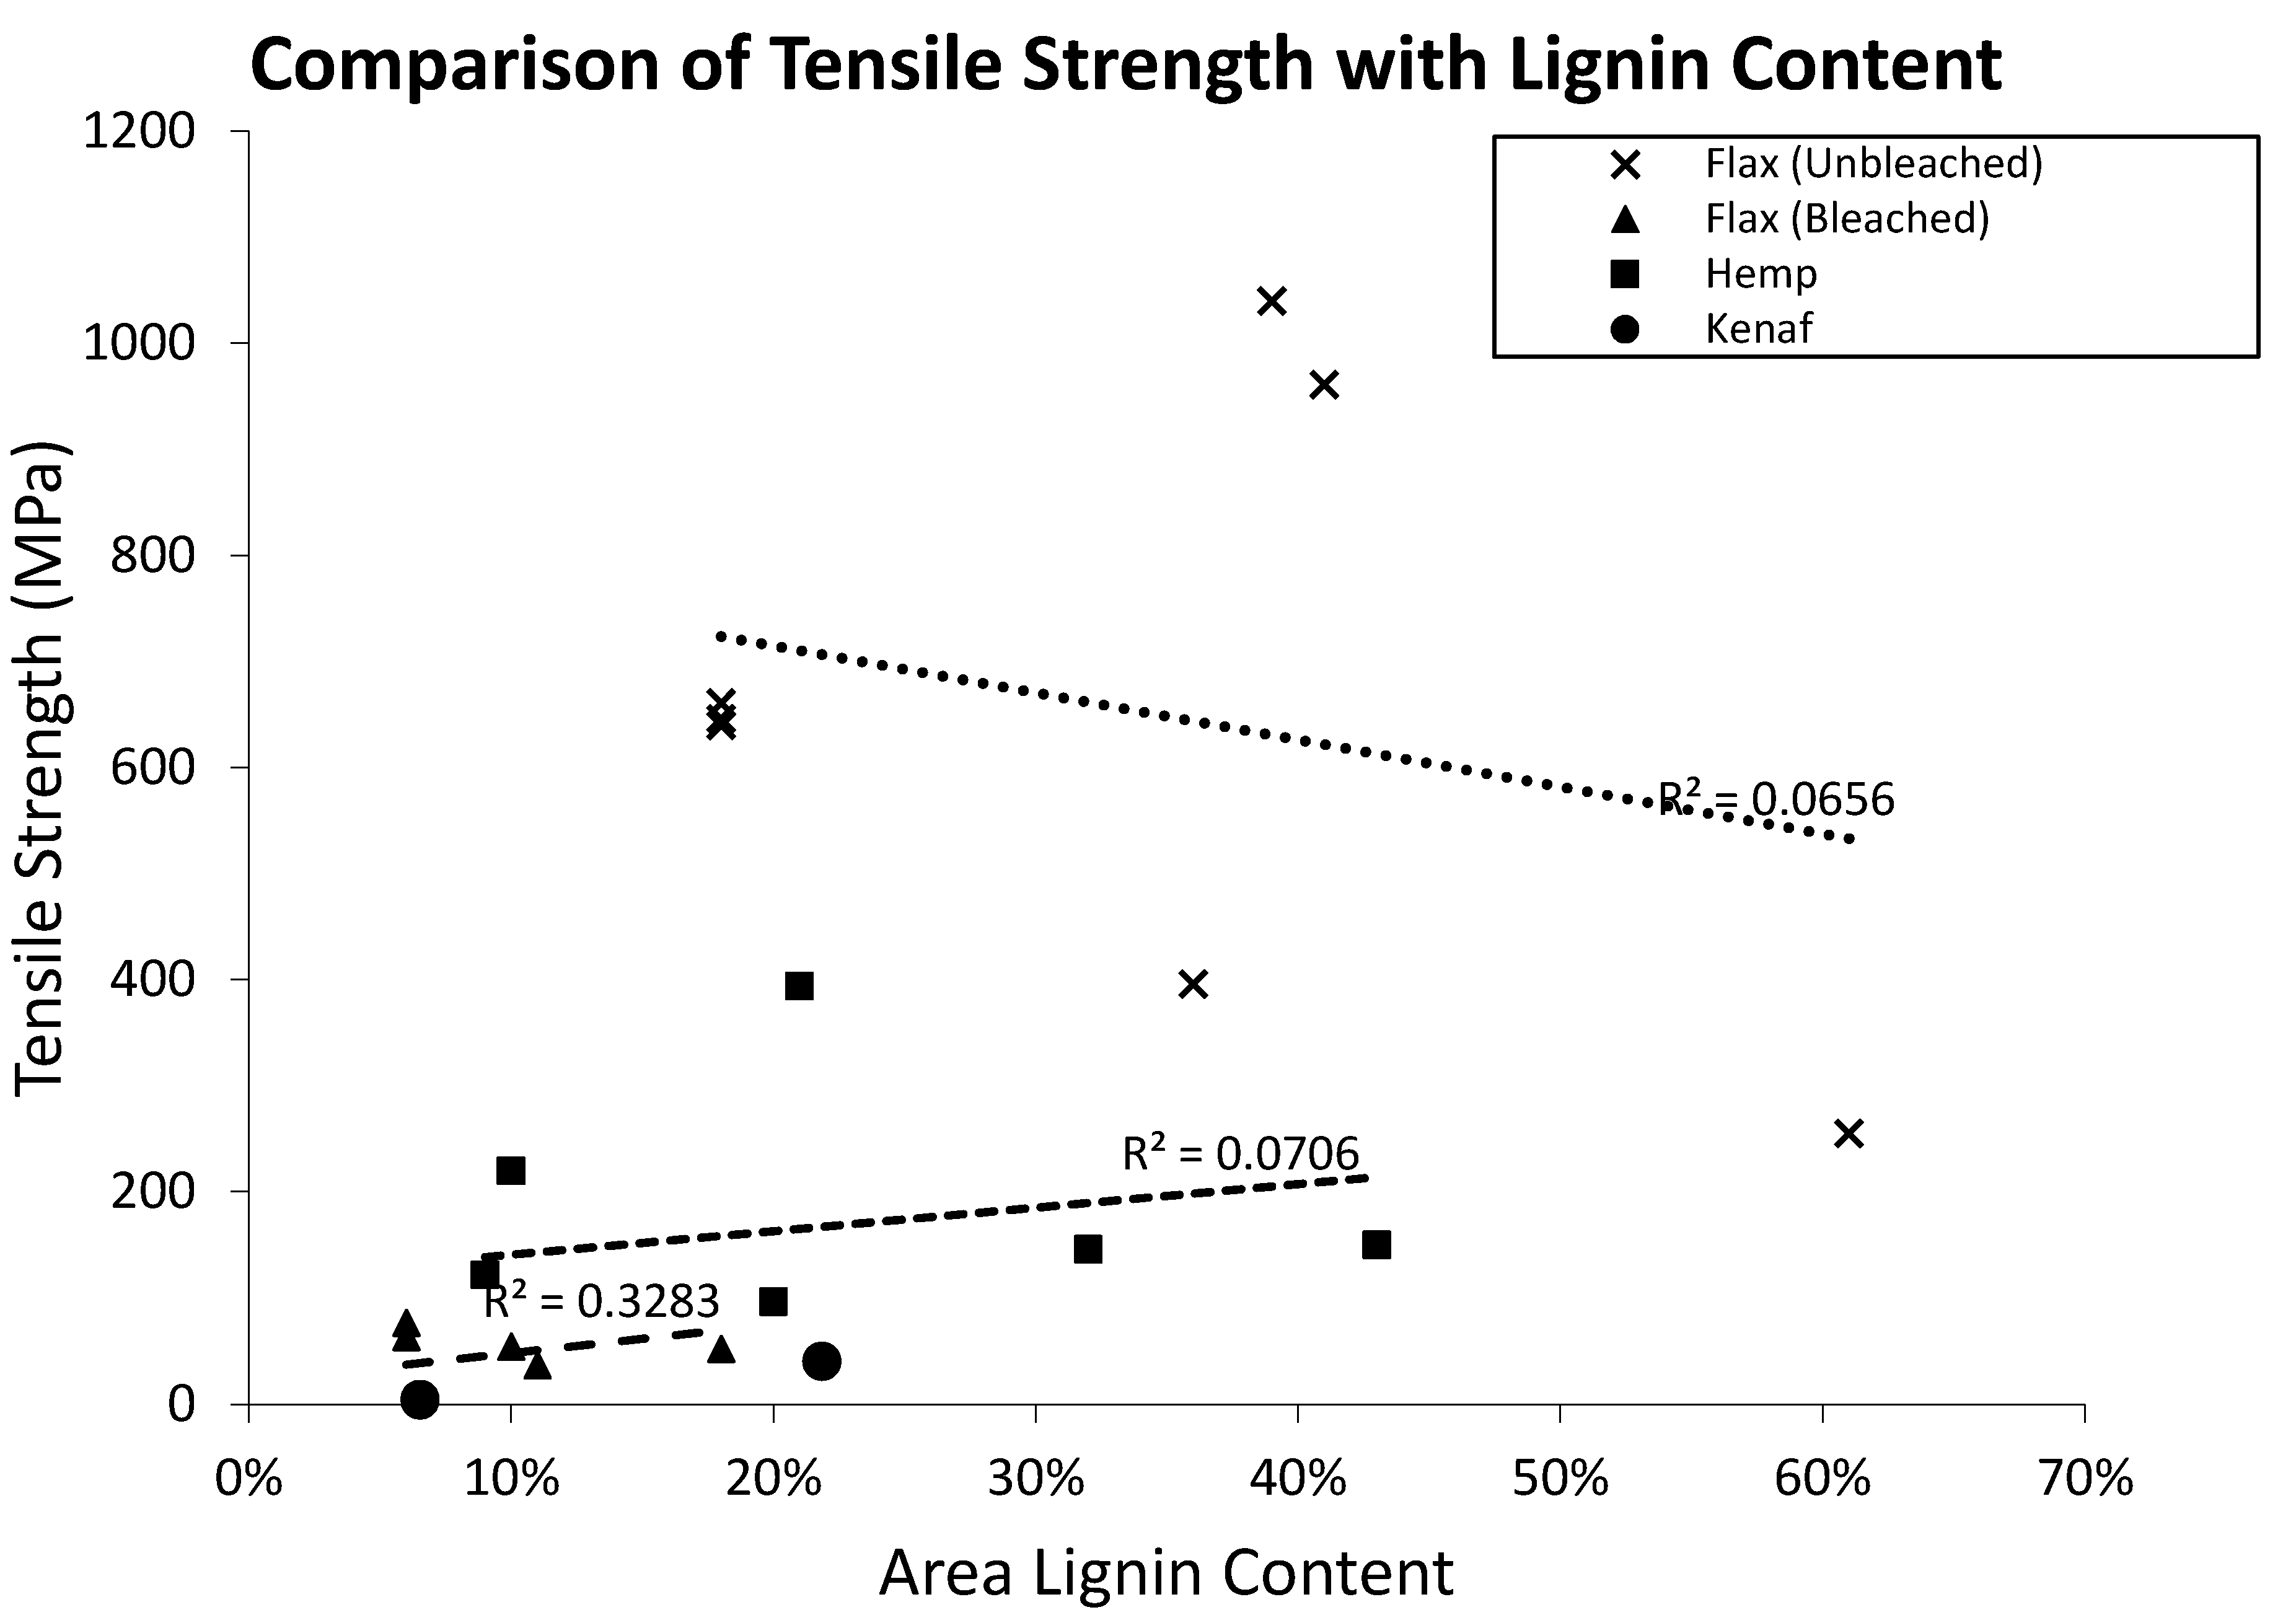
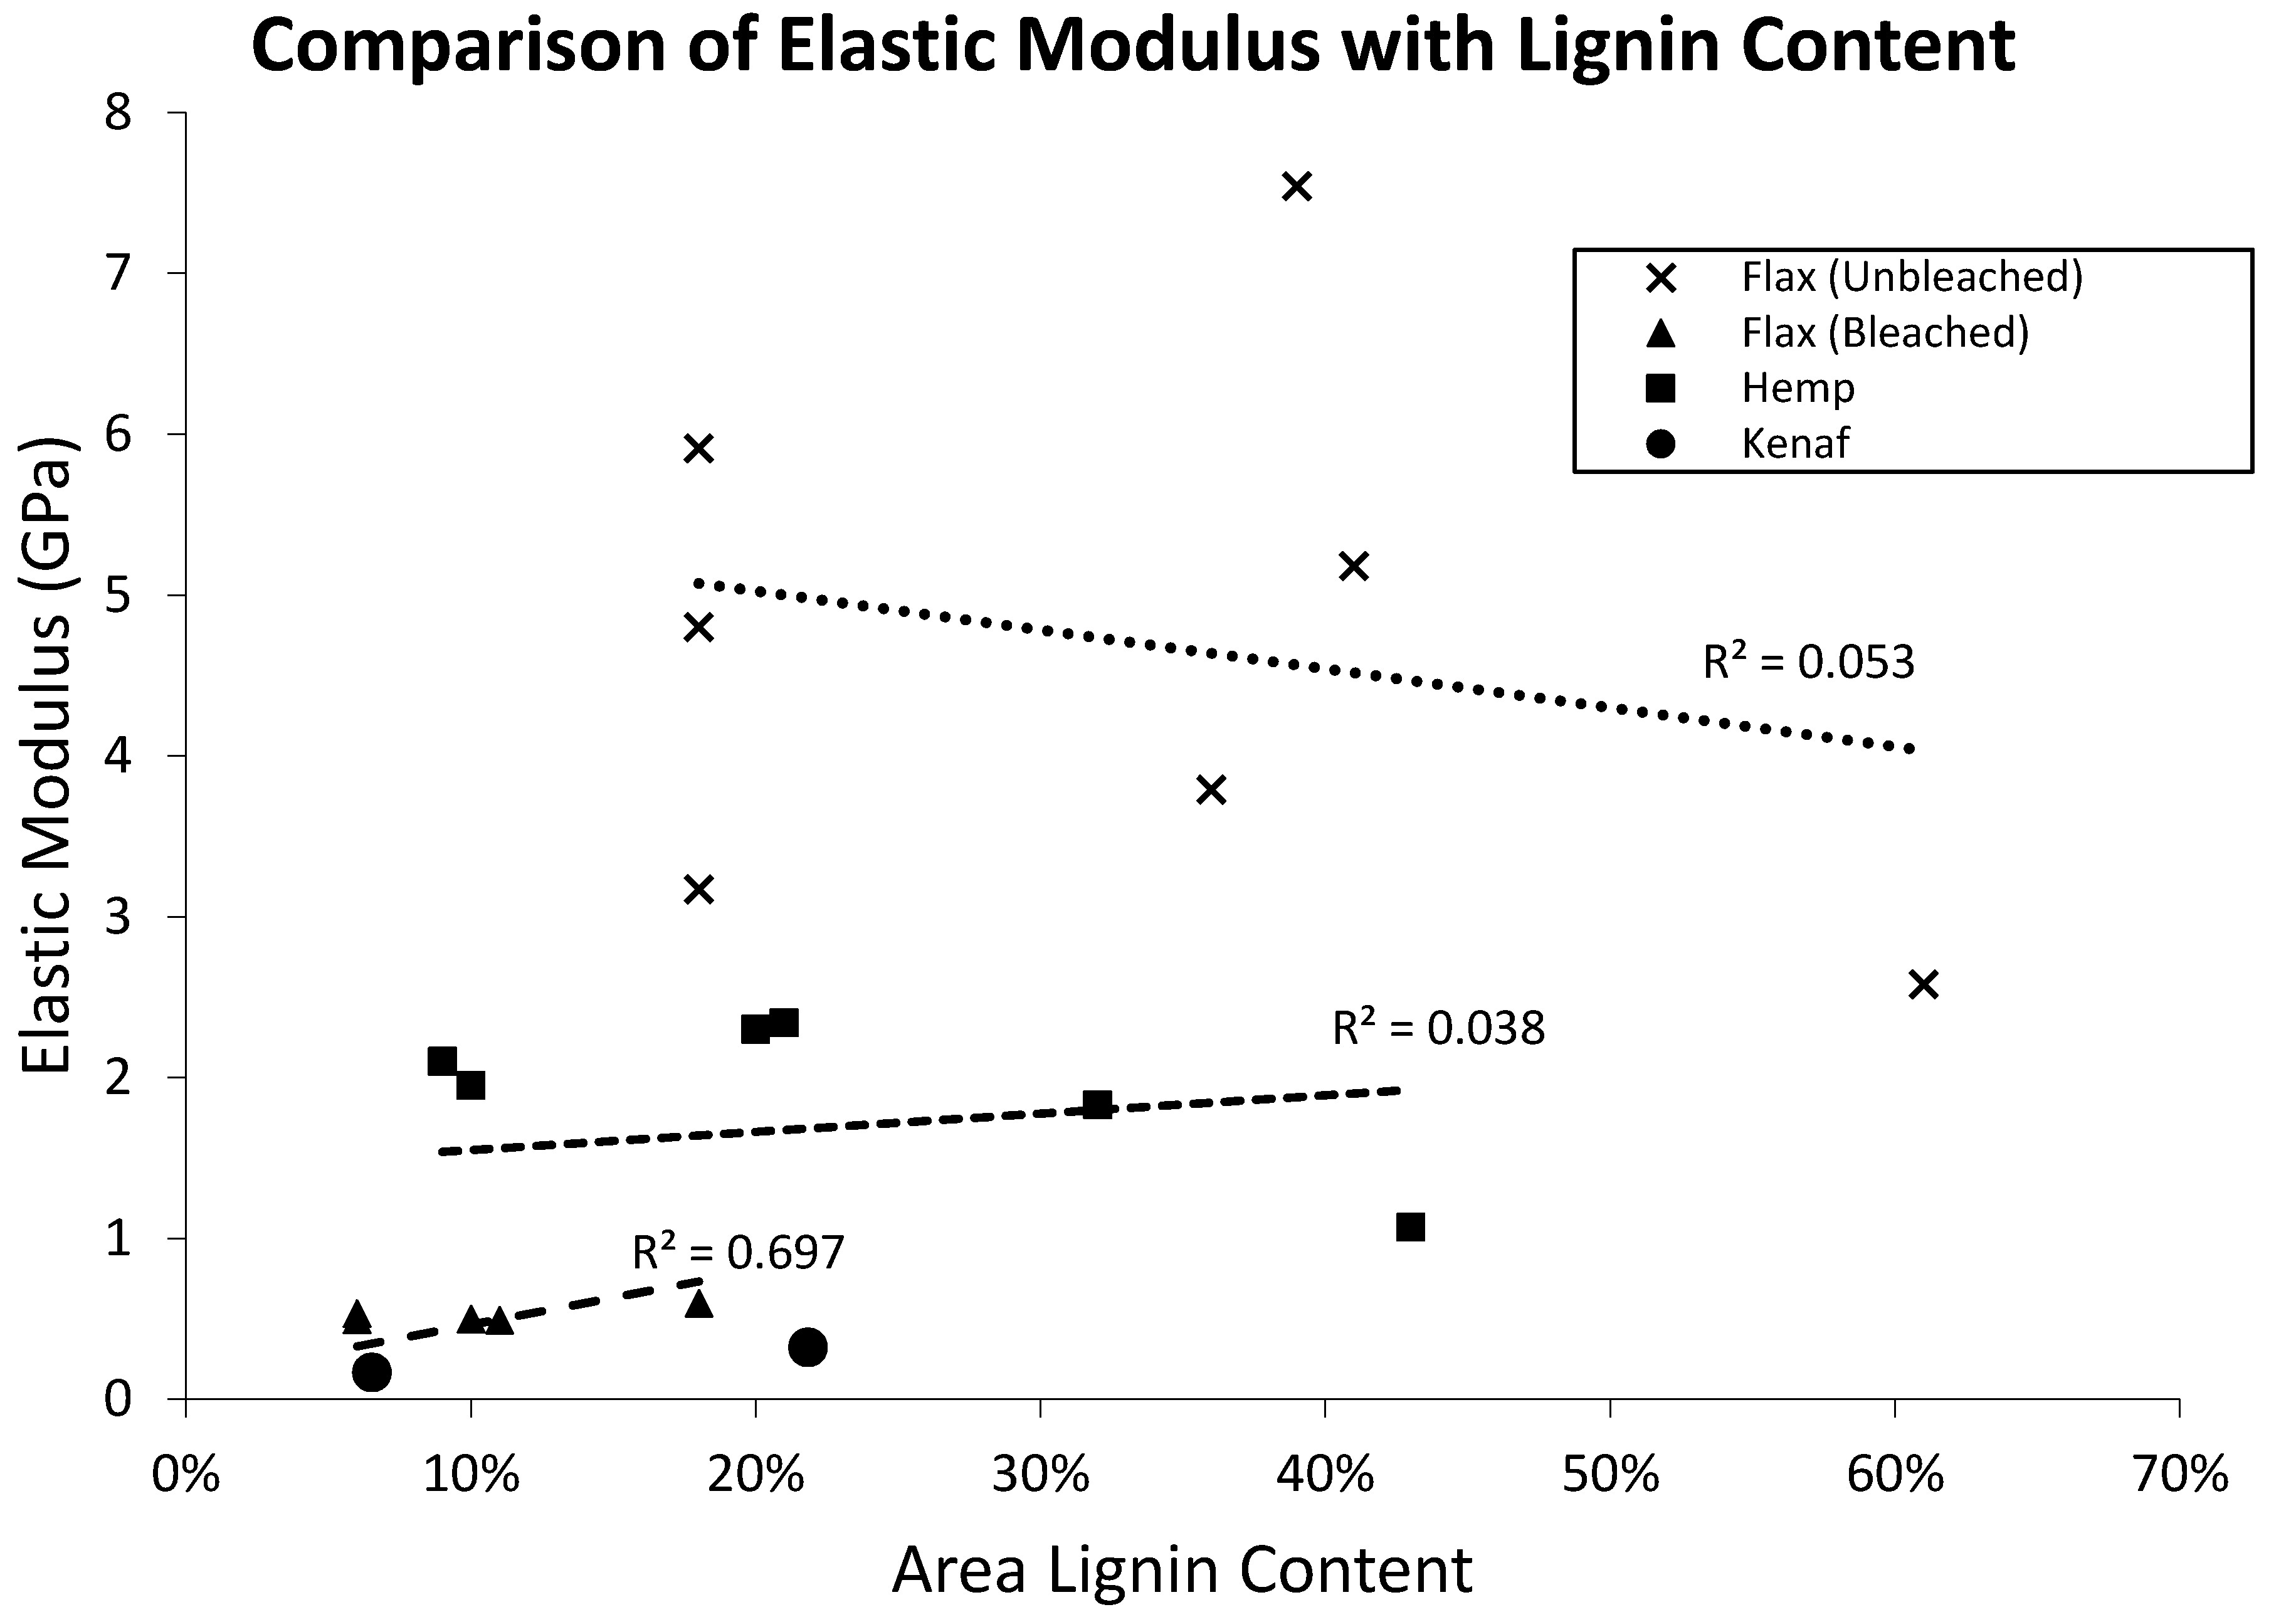
3.4. Fiber Composition

Given the observation that defect-free, dark-colored hemp fibers have reduced mechanical property variation, fiber composition was investigated using fluorescence confocal microscopy. Using methods similar to those used in [46], the fibers’ components were revealed using autofluorescence at green emission wavelengths. The dark region of the fiber is representative of the cellulose, while the bright-green portions are the lignin components throughout the fiber. The pectin wall is not shown in confocal microscopy, allowing the clear view of the internal components in the fibers. Using confocal microscopy, the compositions of a variety of previously broken fibers were analyzed. In particular, the percent area of lignin of a given fiber was found and compared with tensile strength (Figure 6) and elastic modulus (Figure 7).
Characterization of several fibers of each type and corresponding material property data provided the opportunity to establish trends between lignin content and tensile strength of the different bast fibers. The standard error of regression values (R2) of each of the fiber types were very low, with the exception of kenaf, which only had two data points. These results were not significant enough to establish an identifiable trend relating the lignin content and tensile properties of these natural fibers.
Comparing the percent area of lignin in the same fibers with their respective elastic modulus yielded similar results to that of the tensile strength. The highest standard error of regression value, with the exception of kenaf, belonged to bleached flax and was 0.70. This reflects a weak trend correlating increasing lignin content to an increase in modulus. The remaining fiber types showed no trend, indicated by standard error of regression values of less than 0.1. Overall, the estimations of lignin content did not correlate with the material properties of the natural fibers.
Noting the relationship to fiber color, color and composition were also compared. Five fibers of each color noted above were tested and averaged. Using a subgroup of the hemp fiber dataset in the color section above, it was noted that the dark fiber had a lower percent lignin content (3.0%), while the light fiber had a higher percent area of lignin (34.5%). The lignin content of the spotted fiber was noted to be between the light and dark fibers (29.3%). These data appear to complement the results noted above, where less variation was noted to be associated with the darker fiber color, and suggest that lignin content may impact variation.
Thus, it was deemed appropriate to investigate the variation of the lignin and cellulosic content along the length and through the thickness of each fiber. Looking at Figure 8 below, it is seen that lignin content changes along the length of the fiber. As a result, a fiber which has a low percent area of lignin overall may still have cross sections along the length of dramatically higher lignin content. In practice, that means a given estimate of the lignin percentage over a segment of the fiber might not accurately reflect a low point where breakage could occur. In a similar fashion, the variation of lignin content throughout the thickness of the fiber may similarly affect the failure. Observing the failure point of the fibers, it was seen that the location of the break changed through the thickness of the fiber. This indicates that the sample did not have a clean fracture, but instead was jagged due to progressive fracture. Considering the lignin contents associated with the colors noted above, the reduced lignin content associated with the darker color appears to be related to the reduced variation, while the increased lignin of the light and spotted fibers relates to higher variation. Further investigation of these relationships, including validation of the lignin and cellulose approximations for these bast fibers, is warranted.
Further refinement of the cellulose-to-lignin investigative methods in combination with physical defect control are suggested as continuing steps toward understanding fiber variability. This will allow for effectively studying the impacts of fiber type, growing location, and retting process on variation of mechanical properties. In addition, these are trackable characteristics that would lend toward automated, in-line quality methods attainable at the throughputs needed for economic feasibility. Thus, as more is learned about these and other sources of variation, natural fibers may be fully realized as replacements for synthetic materials in engineered applications.

4. Conclusions

In order for bast fibers to reach their potential for engineered uses, particularly as sustainable replacements of synthetic fibers in composite applications, performance characterization of the fibers is needed to reduce variation in mechanical properties. Building upon previous findings, this work investigates the root causes of four main sources of mechanical property variability of large-scale, as-processed fibers: cross-sectional area approximation, physical defects, color, and fiber composition.
In line with previous findings, mean elliptical approximation of cross-sectional area provides mechanical properties with the lowest standard deviation as a percentage of the mean [48]. Variation of fiber mechanical properties can be reduced by accounting for various physical defects, including kinks, geometric inconsistencies, fraying, and transient data due to unexplained loss of load-carrying capability. Further, hemp fibers of darker color were found to have reduced standard deviation when compared to lighter or spotted fibers, even though the color was not found to significantly affect the mean strength or modulus of the fiber.
Finally, comparing modulus with lignin content for bleached flax fibers, a slight increase in modulus was noted as the percent area of lignin increased. Excepting this weak trend, no other trends could be established between the lignin content and either tensile strength or modulus in any of the other natural fibers.

Author Contributions

Conceptualization, J.W.N. and J.M.S.W.; Formal analysis, B.F. and H.R.; Investigation, B.F., H.R., and L.J.B.; Methodology, B.F., H.R., J.W.N., J.M.S.W., and L.J.B.; Project administration, J.W.N.; Resources, J.W.N., J.M.S.W., and L.J.B.; Supervision, J.W.N.; Writing—original draft, B.F., H.R. and J.M.S.W.; Writing—review & editing, J.W.N., J.M.S.W., and L.J.B.

Funding

This research was funded in part through the SUNY New Paltz AC2 Summer Research Program (2018).

Acknowledgments

The authors would like to acknowledge the contributions of Sigmund Bereday, Mark Castellanos, and Matthew Pero, who participated in experimentation and preliminary analysis. In addition, the authors acknowledge the support from the AC2 Program and Nancy Campos (Director), which allowed for this work to be initiated. Finally, this work would not have been possible without the contributions of Trey Riddle, Natalie Hendrix, and the rest of Sunstrand LLC’s engineering team.

Conflicts of Interest

The authors declare no conflict of interest.

References

  1. Hill, C.; Hughes, M. Natural fibre reinforced composites opportunities and challenges. J. Biobased Mater. Bioenergy 2010, 4, 148–158. [Google Scholar] [CrossRef]
  2. Ku, H.; Wang, H.; Pattarachaiyakoop, N.; Trada, M. A review on the tensile properties of natural fiber reinforced polymer composites. Compos. Part B Eng. 2011, 42, 856–873. [Google Scholar] [CrossRef] [Green Version]
  3. Summerscales, J.; Dissanayake, N.; Virk, A.; Hall, W. A review of bast fibres and their composites. Part 1—Fibres as reinforcements. Compos. Part A Appl. Sci. Manuf. 2010, 41, 1329–1335. [Google Scholar] [CrossRef]
  4. La Mantia, F.P.; Morreale, M. Green composites: A brief review. Compos. Part A Appl. Sci. Manuf. 2011, 42, 579–588. [Google Scholar] [CrossRef]
  5. Malkapuram, R.; Kumar, V.; Negi, Y.S. Recent development in natural fiber reinforced polypropylene composites. J. Reinf. Plast. Compos. 2009, 28, 1169–1189. [Google Scholar] [CrossRef]
  6. Wang, B.; Panigrahi, S.; Tabil, L.; Crerar, W. Effects of chemical treatments on mechanical and physical properties of flax fiber-reinforced rotationally molded composites. In 2004 ASAE Annual Meeting; American Society of Agricultural and Biological Engineers: St. Joseph, MI, USA, 2004. [Google Scholar]
  7. Huo, S.; Thapa, A.; Ulven, C.A. Effect of surface treatments on interfacial properties of flax fiber-reinforced composites. Adv. Compos. Mater. 2013, 22, 109–121. [Google Scholar] [CrossRef]
  8. Reux, F.; Verpoest, I. Flax and Hemp Fibres: A Natural Solution for the Composite Industry; JEC Composites Publications: Springfield, MO, USA, 2014. [Google Scholar]
  9. Thomas, L.; Mishra, S.; Bismarck, A. Plant Fibers as Reinforcement for Green Composites. In Natural Fibers, Biopolymers, and Biocomposites; CRC Press: Boca Raton, FL, USA, 2005; pp. 52–128. [Google Scholar]
  10. Lefeuvre, A.; Bourmaud, A.; Morvan, C.; Baley, C. Elementary flax fibre tensile properties: Correlation between stress–strain behaviour and fibre composition. Ind. Crops Prod. 2014, 52, 762–769. [Google Scholar] [CrossRef]
  11. Baley, C. Analysis of the flax fibres tensile behaviour and analysis of the tensile stiffness increase. Compos. Part A Appl. Sci. Manuf. 2002, 33, 939–948. [Google Scholar] [CrossRef]
  12. Shah, D.U.; Nag, R.K.; Clifford, M.J. Why do we observe significant differences between measured and ‘back-calculated’ properties of natural fibres? Cellulose 2016, 23, 1481–1490. [Google Scholar] [CrossRef] [Green Version]
  13. Andersons, J.; Poriķe, E.; Spārniņš, E. Ultimate strain and deformability of elementary flax fibres. J. Strain Anal. Eng. Des. 2011, 46, 428–435. [Google Scholar] [CrossRef]
  14. Hornsby, P.R.; Hinrichsen, E.; Tarverdi, K. Preparation and properties of polypropylene composites reinforced with wheat and flax straw fibres: Part I fibre characterization. J. Mater. Sci. 1997, 32, 443–449. [Google Scholar] [CrossRef]
  15. Barkoula, N.M.; Garkhail, S.K.; Peijs, T. Effect of compounding and injection molding on the mechanical properties of flax fiber polypropylene composites. J. Reinf. Plast. Compos. 2010, 29, 1366–1385. [Google Scholar] [CrossRef]
  16. Kessler, R.W.; Becker, U.; Kohler, R.; Goth, B. Steam explosion of flax—A superior technique for upgrading fibre value. Biomass Bioenergy 1998, 14, 237–249. [Google Scholar] [CrossRef]
  17. Stamboulis, A.; Baillie, C.A.; Peijs, T. Effects of environmental conditions on mechanical and physical properties of flax fibers. Compos. Part A Appl. Sci. Manuf. 2001, 32, 1105–1115. [Google Scholar] [CrossRef]
  18. Graupner, N.; Herrmann, A.S.; Müssig, J. Natural and man-made cellulose fibre-reinforced poly (lactic acid)(PLA) composites: An overview about mechanical characteristics and application areas. Compos. Part A Appl. Sci. Manuf. 2009, 40, 810–821. [Google Scholar] [CrossRef]
  19. Shibata, S.; Cao, Y.; Fukumoto, I. Press forming of short natural fiber-reinforced biodegradable resin: Effects of fiber volume and length on flexural properties. Polym. Test. 2005, 24, 1005–1011. [Google Scholar] [CrossRef]
  20. Goda, K.; Sreekala, M.S.; Gomes, A.; Kaji, T.; Ohgi, J. Improvement of plant based natural fibers for toughening green composites—Effect of load application during mercerization of ramie fibers. Compos. Part A Appl. Sci. Manuf. 2006, 37, 2213–2220. [Google Scholar] [CrossRef]
  21. Angelini, L.G.; Lazzeri, A.; Levita, G.; Fontanelli, D.; Bozzi, C. Ramie (Boehmeria nivea (L.) Gaud.) and Spanish Broom (Spartium junceum L.) fibres for composite materials: Agronomical aspects, morphology and mechanical properties. Ind. Crops Prod. 2000, 11, 145–161. [Google Scholar] [CrossRef]
  22. Alcock, M.; Ahmed, S.; DuCharme, S.; Ulven, C.A. Influence of Stem Diameter on Fiber Diameter and the Mechanical Properties of Technical Flax Fibers from Linseed Flax. Fibers 2018, 6, 10. [Google Scholar] [CrossRef]
  23. Lefeuvre, A.; Bourmaud, A.; Lebrun, L.; Morvan, C.; Baley, C. A study of the yearly reproducibility of flax fiber tensile properties. Ind. Crops Prod. 2013, 50, 400–407. [Google Scholar] [CrossRef]
  24. Duval, A.; Alain, B.; Laurent, A.; Christophe, B. Influence of the sampling area of the stem on the mechanical properties of hemp fibers. Mater. Lett. 2011, 65, 797–800. [Google Scholar] [CrossRef]
  25. Charlet, K.; Baley, C.; Morvan, C.; Jernot, J.P.; Gomina, M.; Bréard, J. Characteristics of Hermès flax fibres as a function of their location in the stem and properties of the derived unidirectional composites. Compos. Part A Appl. Sci. Manuf. 2007, 38, 1912–1921. [Google Scholar] [CrossRef]
  26. Sankari, H.S. Comparison of bast fibre yield and mechanical fibre properties of hemp (Cannabis sativa L.) cultivars. Ind. Crops Prod. 2000, 11, 73–84. [Google Scholar] [CrossRef]
  27. Mediavilla, V.; Leupin, M.; Keller, A. Influence of the growth stage of industrial hemp on the yield formation in relation to certain fibre quality traits. Ind. Crops Prod. 2001, 13, 49–56. [Google Scholar] [CrossRef]
  28. Fuqua, M.A.; Huo, S.; Ulven, C.A. Natural fiber reinforced composites. Polym. Rev. 2012, 52, 259–320. [Google Scholar] [CrossRef]
  29. Bledzki, A.K.; Gassan, J. Composites reinforced with cellulose based fibres. Prog. Polym. Sci. 1999, 24, 221–274. [Google Scholar] [CrossRef]
  30. Van de Velde, K.; Kiekens, P. Effect of material and process parameters on the mechanical properties of unidirectional and multidirectional flax/polypropylene composites. Compos. Struct. 2003, 62, 443–448. [Google Scholar] [CrossRef]
  31. Cantero, G.; Arbelaiz, A.; Llano-Ponte, R.; Mondragon, I. Effects of fibre treatment on wettability and mechanical behaviour of flax/polypropylene composites. Compos. Sci. Technol. 2003, 63, 1247–1254. [Google Scholar] [CrossRef]
  32. Keener, T.J.; Stuart, R.K.; Brown, T.K. Maleated coupling agents for natural fibre composites. Compos. Part A Appl. Sci. Manuf. 2004, 35, 357–362. [Google Scholar] [CrossRef]
  33. Arbelaiz, A.; Fernandez, B.; Ramos, J.A.; Mondragon, I. Thermal and crystallization studies of short flax fibre reinforced polypropylene matrix composites: Effect of treatments. Thermochim. Acta 2006, 440, 111–121. [Google Scholar] [CrossRef]
  34. Bos, H.L.; Müssig, J.; van den Oever, M.J. Mechanical properties of short-flax-fibre reinforced compounds. Compos. Part A Appl. Sci. Manuf. 2006, 37, 1591–1604. [Google Scholar] [CrossRef]
  35. Angelov, I.; Wiedmer, S.; Evstatiev, M.; Friedrich, K.; Mennig, G. Pultrusion of a flax/polypropylene yarn. Compos. Part A Appl. Sci. Manuf. 2007, 38, 1431–1438. [Google Scholar] [CrossRef]
  36. Madsen, B.; Lilholt, H. Physical and mechanical properties of unidirectional plant fibre composites—An evaluation of the influence of porosity. Compos. Sci. Technol. 2003, 63, 1265–1272. [Google Scholar] [CrossRef]
  37. Mohanty, A.K.; Misra, M.; Hinrichsen, G.I. Biofibres, biodegradable polymers and biocomposites: An overview. Macromol. Mater. Eng. 2000, 276, 1–24. [Google Scholar] [CrossRef]
  38. Lamy, B.; Baley, C. Stiffness prediction of flax fibers-epoxy composite materials. J. Mater. Sci. Lett. 2000, 19, 979–980. [Google Scholar] [CrossRef]
  39. Baley, C.; Busnel, F.; Grohens, Y.; Sire, O. Influence of chemical treatments on surface properties and adhesion of flax fibre–polyester resin. Compos. Part A Appl. Sci. Manuf. 2006, 37, 1626–1637. [Google Scholar] [CrossRef]
  40. Zafeiropoulos, N.; Williams, D.; Baillie, C.; Matthews, F.L. Engineering and characterisation of the interface in flax fibre/polypropylene composite materials. Part I. Development and investigation of surface treatments. Compos. Part A Appl. Sci. Manuf. 2002, 33, 1083–1093. [Google Scholar] [CrossRef]
  41. Joffe, R.; Andersons, J.; Wallström, L. Strength and adhesion characteristics of elementary flax fibres with different surface treatments. Compos. Part A Appl. Sci. Manuf. 2003, 34, 603–612. [Google Scholar] [CrossRef]
  42. Bessadok, A.; Langevin, D.; Gouanvé, F.; Chappey, C.; Roudesli, S.; Marais, S. Study of water sorption on modified Agave fibres. Carbohydr. Polym. 2009, 76, 74–85. [Google Scholar] [CrossRef]
  43. John, M.J.; Anandjiwala, R.D. Recent developments in chemical modification and characterization of natural fiber-reinforced composites. Polym. Compos. 2008, 29, 187–207. [Google Scholar] [CrossRef]
  44. Doherty, W.O.; Mousavioun, P.; Fellows, C.M. Value-adding to cellulosic ethanol: Lignin polymers. Ind. Crops Prod. 2011, 33, 259–276. [Google Scholar] [CrossRef] [Green Version]
  45. Coletta, V.C.; Rezende, C.A.; da Conceição, F.R.; Polikarpov, I.; Guimarães, F.E. Mapping the lignin distribution in pretreated sugarcane bagasse by confocal and fluorescence lifetime imaging microscopy. Biotechnol. Biofuels 2013, 6, 43. [Google Scholar] [CrossRef]
  46. Hernández-Hernández, H.M.; Chanona-Pérez, J.J.; Vega, A.; Ligero, P.; Farrera-Rebollo, R.R.; Mendoza-Perez, J.A.; Calderón-Domínguez, G.; Vera, N.G. Spectroscopic and Microscopic Study of Peroxyformic Pulping of Agave Waste. Microsc. Microanal. 2016, 22, 1084–1097. [Google Scholar] [CrossRef]
  47. Virk, A.S.; Hall, W.; Summerscales, J. Modulus and strength prediction for natural fibre composites. Mater. Sci. Technol. 2012, 28, 864–871. [Google Scholar] [CrossRef]
  48. Virk, A.S.; Hall, W.; Summerscales, J. Physical characterization of jute technical fibers: Fiber dimensions. J. Nat. Fibers 2010, 7, 216–228. [Google Scholar] [CrossRef]
  49. Ji, Z.; Ma, J.F.; Zhang, Z.H.; Xu, F.; Sun, R.C. Distribution of lignin and cellulose in compression wood tracheids of Pinus yunnanensis determined by fluorescence microscopy and confocal Raman microscopy. Ind. Crops Prod. 2013, 47, 212–217. [Google Scholar] [CrossRef]
  50. Sunstrand, LLC. Available online: https://www.sunstrands.com/ (accessed on 29 March 2019).
  51. Diastron Limited. Available online: https://www.diastron.com/technical-fibre/ (accessed on 29 March 2019).
  52. Bourmaud, A.; Baley, C. Rigidity analysis of polypropylene/vegetal fibre composites after recycling. Polym. Degrad. Stab. 2009, 94, 297–305. [Google Scholar] [CrossRef]
  53. ASTM. ASTM C1557-14, Standard Test Method for Tensile Strength and Young’s Modulus of Fibers; ASTM International: West Conshohocken, PA, USA, 2014; Available online: www.astm.org (accessed on 23 May 2019).
  54. ImageJ: Image Processing and Analysis in Java. Available online: https://imagej.nih.gov/ij/ (accessed on 23 April 2019).
Figure 1. Fiber mounted onto V-shaped tab (left) that is then measured using dimensional analysis (middle) before tensile testing is performed (right).
Sustainability 11 02655 g001
Figure 2. A representation of the methods for calculating fiber cross-sectional area is compared to a hexagonal approximation. Calculated cross section was assumed to be constant along the fiber length.
Sustainability 11 02655 g002
Figure 3. Confocal microscopy image of a representative fiber (left) that is processed using ImageJ to determine lignin content (right).
Sustainability 11 02655 g003
Figure 4. White-light microscopy (at l0× (left) and 20× (right) magnification) of two broken flax fibers representative of the failure variations noted in all fiber types tested.
Sustainability 11 02655 g004
Figure 5. Comparison of strength and modulus standard deviations as a percent of the mean resulting from observed defect filtering for several groups of flax fibers as noted in Table 2.
Sustainability 11 02655 g005
Figure 6. Comparison of change in the area of lignin content to tensile strength of various flax, hemp, and kenaf fibers with weak trends shown (no trend shown for kenaf due to limited data points).
Sustainability 11 02655 g006
Figure 7. Comparison of change in the area of lignin content to elastic modulus of various flax, hemp, and kenaf fibers with weak trends shown (no trend shown for kenaf due to limited data points).
Sustainability 11 02655 g007
Figure 8. Fluorescence image of fiber break point above (left) and below (right) the mid-plane of the fiber, indicating variation in lignin through the fiber thickness.
Sustainability 11 02655 g008
Table 1. Fiber characteristics with corresponding descriptions and representative white light microscopy images (20× magnification) of flax.
CharacteristicsDescriptionImage
ConsistentUniform thickness along gage lengthSustainability 11 02655 i001
FrayingMicrofibrils
peeling
along length
Sustainability 11 02655 i002
KinkObservable
corner or sharp
change in
direction
Sustainability 11 02655 i003
InconsistencyObservable
variation in
diameter along
length
Sustainability 11 02655 i004
Table 2. Mean (standard deviation) of elastic modulus and tensile strength for each fiber type based on all tests performed.
Minor Circle ApproximationMajor Circle ApproximationRectangular ApproximationElliptical Approximation
Fiber TypeNumber of Valid TestsElastic Modulus (GPa)Tensile Strength (MPa)Elastic Modulus (GPa)Tensile Strength (MPa)Elastic Modulus (GPa)Tensile Strength (MPa)Elastic Modulus (GPa)Tensile Strength (MPa)
Hemp2968 (6)139 (119)61 (109)937 (975)15 (7)249 (159)21 (9)337 (207)
Flax45411 (11)212 (212)86 (71)1255 (1086)26 (15)391 (287)33 (19)523 (381)
Kenaf996 (5)64 (78)30 (29)284 (330)11 (10)108 (123)14 (13)138 (157)

