1. Introduction
The methodology for the semi-quantitative assessment of multiple risks at a local scale constitutes the background employed for the development of the framework and theories of the multidisciplinary research center of Politecnico di Torino ‘R3C’—Responsible Risk Resilience Center. The R3C Project aims at designing and operationalizing an interdisciplinary research methodology to implement resilience in regional and urban systems. Within the project, an in-depth discussion around the epistemological meaning of resilience in different fields of application has been set up, comparing the theoretical approaches and their practical applications derived from the operational research carried out by urban and regional planners, social scientists, anthropologists, engineers, historicists, and ecologists [
1].
The R3C group adheres to the definition of resilience as “the capacity of the system—and of all its socio-ecological, technical, and infrastructural components—to preserve or rapidly return to basic functionalities, responding to turbulence and/or shocks, of adaptation to climate change, and to transform the subset of components which limit the present and/or the future evolution capacity” [
2]. In particular, the emerging idea of “territorial resilience” is introduced, as a concept capable of supporting the decision-making process, together with the tool needed for identifying vulnerabilities and guiding the transformation of socio-geographical areas [
3]. In order to operationalize the “territorial resilience”, it is essential to develop a framework for the measurement of the resilience itself. Measurement is strictly related to the management of the risks impinging on an area, integrating the approaches of multi-risk assessment with climate modelling and the qualitative study of governance models [
1].
The methodology described in this paper aimed at overcoming the common approach to risk analysis for single hazard factors [
1], through the proposition of a multi-risk approach able to represent the mutual interaction of natural and anthropic stressors for the territory in a more useful view, for the development of an “operational resilience approach”. The methodology was expressly developed and tested for the application at a local scale, because local authorities are on the front-line in facing the consequences of shocks and territorial changes, and often they do not have adequate instruments to cope with them. In fact, in Italy, as an example, the land use planning is delegated to municipalities, that are responsible both for the emergency planning and land use strategies. The operative tools available to the municipalities are the City Plan and the Municipal Emergency Plan. The first one aims at regulating urban and land functions, adapting the needs of urban development to the natural specificities of the territory (geomorphological, hydrological, etc.). The second one sets up the operational activities, the materials, capacities, and means to deal with possible emergencies, on the basis of the existing sectorial risk analysis. Both the plans implement and apply planning measures derived from the superordinate sectorial plans (seismic, flood, etc.), but, even if they share the same basic indications, they are not mutually linked in terms of long-term risk management, adaptation, and increase of resilience [
4].
As a consequence of this planning structure, municipalities currently deal with multiple risks, but they merely implement contents from superior plans, without analyzing or correlating them in a systemic way. Additionally, the management of risks in a separate way, with different procedures, timings, and methodologies, makes it difficult for the municipalities to have a clear and updated concept of the actual hazards that threaten their territories, most of all for those deriving from the mutual influence and interaction between risks.
Till now, no mandatory rules require municipalities to evaluate the combined effects of risks; but the increasing effects of the climate change, together with the lack of resources for preventive and protective interventions, highlights the need of advanced approaches and tools for the identification of the areas more exposed to risks and risk interactions, to optimize and better address the use of resources, and to improve the actions related to adaptation and mitigation strategies.
However, the available methodologies for multi-risk assessment could present some problems for the application at a local scale (see [
5] for a complete literature review). On one side, they still suffer some criticalities that need to be settled out, for example, as highlighted by Garcia-Aristizabal and Marzocchi [
6], there are huge difficulties on the definition of a common metric for loss assessment, and the weighting of the different categories of exposed elements. On the other side, sometimes “specialists in various fields studying risks have failed to produce results in a form that could be useful to planners” [
7]. Many methodologies for multiple risks are based on quantitative techniques for risk analysis; even if this mathematically rigorous approach can seem the most reliable one, the application to real cases usually require great simplifications, mainly related to the difficulties in obtaining the detailed information needed. Additionally, the high specialization level of this type of methodologies makes them hardly manageable for local administrations, that can have a limited technical preparation, and in many cases cannot afford the expenses for detailed risk investigations.
In order to address the problems above-mentioned, multi-risk projects like MATRIX [
8] adopted a multi-level strategy, introducing the most technical phase of the methodology only after a first simpler phase. Analogously, the objective of the authors was the implementation of an easy-to-use risk screening instrument, based on a simplified methodology like an index approach, to allow the municipalities to directly evaluate the risks and possible risk interactions that affect their territory. After this, the Municipalities could define possible further actions, including the adoption of more specific risk-assessment procedures, in accordance with superior local authorities (provinces, regions).
The following paragraph presents the methodology proposed for this screening path. This approach was adopted as a baseline for the identification of the vulnerabilities of the territorial system and the measure of its resilience. As discussed in
Section 3, a set of indicators of resilience are under development, able to estimate territorial vulnerabilities, and some of them are introduced in this paper.
2. Materials and Methods
2.1. A Semi-Quantitative Methodology at a Local Scale
The proposed methodology considers, in an integrated framework, the main risks on the territory and their possible interactions, in order to better orient further in-depth studies and interventions related to land use planning and emergency. Since the methodology was intended for a direct use from the municipalities’ technicians, it recovered the simplified scheme adopted for the Italian plans related to the industrial risk, called E.R.I.R.—Elaborato Tecnico per il Rischio di Incidente Rilevante (Technical Plan for Major Risk accidents), composed by:
Characterization of risks;
Characterization of the territorial and environmental vulnerable elements;
Assessment of the compatibility;
Planning phase (development of further studies and adaptation strategies).
The risks to be taken into account were chosen following the concept of the “spatial relevance” stated in the ESPON project [
9]: only risks that regularly or irregularly interest the same territorial area should be take into account, disregarding those that could take place everywhere. The methodology was developed for the risks more diffused in Italy: industrial, flood, and seismic risk, and, given the recent increase in extreme climatic events—violent rains, windstorms etc.—a climate related factor was also included. Each municipality should clearly consider also its main territorial criticalities, other than those included in the main model (i.e., volcanic risk, avalanches, wildfires, etc.).
A semi-quantitative approach was adopted, introducing a rating system common for all the main risks present on the territory. This type of approach, already employed in European projects [
7] or regional methodologies [
10], was chosen for its simplicity, which could allow its use also with low economical resources and technical skills. The adopted rating scale assumes different scores related to the possible impact of the risk/risks analyzed:
0 < I ≤ 0.99: Negligible;
1 < I ≤ 1.99: From low to moderate;
2 < I ≤ 2.99: From moderate to high;
I ≥ 3 onwards: From high to very high.
2.2. Characterization of the Risks
The first step of the proposed methodology consists of an in-depth analysis of the main territorial risks that insist on the territory of the municipality. An in-depth data collection has to be developed on the basis of existing sectorial plans, emergency plans, and through a direct investigation of the territory. In order to better understand and address the description of each risk, the risk characterization was based on three macro-categories, aimed at highlighting the characteristics of the analyzed risk which could mostly influence its dangerousness and its possible interaction with other events. The categories are:
SE—strengthening effects: Local characteristics able to increase the dangerousness (i.e., in case of seismic risk, the type of soil);
HE—historical and recent events: All the events related to the specific risk should be taken into account, to evaluate if the return times expressed by the overall plans are reliable;
PM—protection measures: The presence of protection and preventive measures could reduce the impact of the risk analyzed.
The ratings defined in
Section 2.1 were assigned to each risk based on these three macro-categories; a guideline for the assignation of the scores was defined. Climate related events were introduced and rated, but they were evaluated through a simplified approach, related to the global tendencies, because an analysis of the local trends could present difficulties related to the data collection and interpretation.
Table 1 below shows the guide for flood risk; it analyzes the functioning of individual regulatory subsystems or elements, such as water intakes, pumping stations, the water distribution network [
11,
12], and the events that occurred on the territory, both those reported in the flood plans through probabilistic approach, and the recent occurred ones.
2.3. Risks Interactions
The macro-categories SE, HE, and PM are the basis to assess the possible impact of risk interaction, because they determine the risk role in a possible risk interaction and provide useful indications on the possible plausible effects. However, the macro-categories have different levels of influence on the interaction, and different reliability in terms of data; therefore, different weights were attributed to express this variability. The weights (HE = 2, SE = 1, and PM = 0.5) were designed to obtain results in line with the general scale employed in the methodology (see
Section 2.1.) and were validated through experts’ judgement.
The binary risk interaction, intended as the impact a hazard factor could have on another one, should be assessed in the area of risk overlaying, where vulnerable environmental or territorial elements are present. The binary risk interaction is calculated through a weighted average of the values assigned to each category of the different risks, shown in Equation (1).
A dedicated binary interaction table was developed in order to simplify the assessment of the possible interactions: the values assumed by each risk macro-categories in the analyzed point of the territory are reported in the table; when a possible risk correlation was encountered, the formula of Equation (1) was applied.
The values of interaction obtained through the Table can be also assessed directly through a GIS (Geographic Information System): each risk factor can be represented on a single layer; then, it is possible to directly obtain the georeferenced value of the integrated risk intersecting the risk layers and making use of the “calculator” field.
Table 2 shows an example of an interaction table: in this case, on the territory under study, a major risk chemical plant (I) was present and flood (F), earthquake (E), and extreme climate events (C) could occur. The table shows the values assigned to each macro-category and it returns the results of the mutual interaction between the risks, where relevant. In the specific case, interactions with moderate effects could occur; in fact, despite the high dangerousness of the Seveso plant (due to the huge quantity of substances stored, presence of vulnerable items, etc. (SE = 3)), the natural risks had quite low values. The seismic risk was unlikely in the area (HE = 1), even if the poor quality of soil could enhance the SEISMIC EFFECTS (SE = 2), while the flood risk had been dramatically reduced through an effective system of protection (PM = −3); as a consequence, the possible binary interactions obtained a low value, tending towards moderate.
2.4. Vulnerability and Compatibility Assessment
The assessment of territorial and environmental vulnerabilities was based on the legislative indications of Ministerial Decree 09/05/2001 [
13] and of D.G.R. 17/377 [
14] for E.R.I.R. plan—plan for the safe planning of the areas around major risk plants. According to [
13,
14], the vulnerability is mainly identified as “exposure to the risks in terms of population”; the possible factors of sensitivity and coping capacity of the analyzed elements are not taken into account.
The proposed methodology recovered the classification of urban functions and strategic buildings in six different categories (see
Table 3), assigned on the basis of the people density and mobility.
However, the assessment of the compatibility differed from that indicated by [
13,
14], because multiple risks had to be considered. Therefore, the assessment was based on a threshold of 2.5, corresponding to a medium impact tending towards high: If the ratings of risk interactions and of macro-categories SE and HE overcome the threshold in areas where A and B elements are included, a potential incompatibility is detected. This is a signal for the municipality that a further investigation on the area is needed, to prove the incompatibility and verify possible preventive and protective measures.
2.5. Planning
The last step of the methodology is dedicated to the studies and actions to be carried out to face possible incompatibilities. Two levels of actions are foreseen: The first step is an analysis in detail of the potential incompatible situations, both as far as it concerns the hazards and the vulnerabilities. If the incompatibility is confirmed, the second step, based on possible prevention and protection measures and interventions, could be prepared; in this last phase, the municipality will have to involve and cooperate with experts of several fields.
Some existing manuals and guidelines, diffused by the government or other public authorities [
15,
16,
17,
18,
19,
20,
21,
22,
23] or settled by research groups [
24,
25,
26], already provide useful indications for in-depth analysis and actions, but in many cases, they do not have binding value, and; therefore, are little known and applied. These indications were collected in dedicated tables, that can guide the municipalities in the choice of a correct approach to face problems related to multiple risks.
Table 4 below reports an example of further investigations that can be carried on related to flood and seismic risk, here referred to as Italian regulations and guidelines.
2.6. A Step towards a Measure for the Resilience: The Definition of Vulnerabilites
As remarked in
Section 2.4, the characterization of the vulnerabilities for the proposed methodology followed the simplified approach proposed by the Ministerial Decree 09/05/2001 [
13]. This classification does not explore in-depth the intrinsic characteristics of the vulnerable element that contribute to its sensitivity or capacity to react and recover towards an external event, therefore the further investigation on the vulnerable elements were transferred to the last step of the methodology, the Planning.
The awareness of the need to develop a more detailed investigation on vulnerability was considered and developed in the wider context of the framework for the ‘Operationalization of resilience’ by R3C research Centre. In fact, one of the ongoing projects within the Centre refers to measuring the resilience of a territory, and its first step is the identification of indicators able to spatially describe the vulnerability of the territorial and urban system.
Indicators were defined for three main components of the system (Environment, Urban system, Population). With reference to the indicators related to Urban systems and building, general indicators able to express the sensitivity towards external pressure and events were settled, i.e., in relation to quality, function and age of the buildings.
In this context, the authors proposed specific risk-oriented indicators, developed to test the peculiar sensitivity towards the risks more recurrent in a determined territory. One of the guiding principles for the selection of these indicators was the availability and reliability of the data, in order to be able to provide quick elaborations and quick responses. In fact, the survey of specific vulnerability towards risks is often based on a deep level of investigation on site, that requires the compilation of data-sheets, the involvement of owners etc.; these long procedures sometimes can obstacle or even stop the correct application of plans and legislation. In example in Italy, the compilation of the basic level of the seismic vulnerability data-sheets required by [
15] for the strategic public buildings required ten years more than those foreseen.
As far as it concerns Flood, a valid help to identify the factors of increment of the sensitivity was found in [
17,
27,
28], that provide detailed lists of technical indications on the best characteristics that buildings should have to resist to a flood. However, these indications were rarely translatable into helpful indicators at a local scale; firstly, they usually referred to new buildings, and not existing ones; secondly, they required a level of information too punctual (i.e., material composing pavements, presence of interspaces, specific use of the underground spaces, etc.), very difficult to be acquired in a reasonable period and without the cooperation of the building owners.
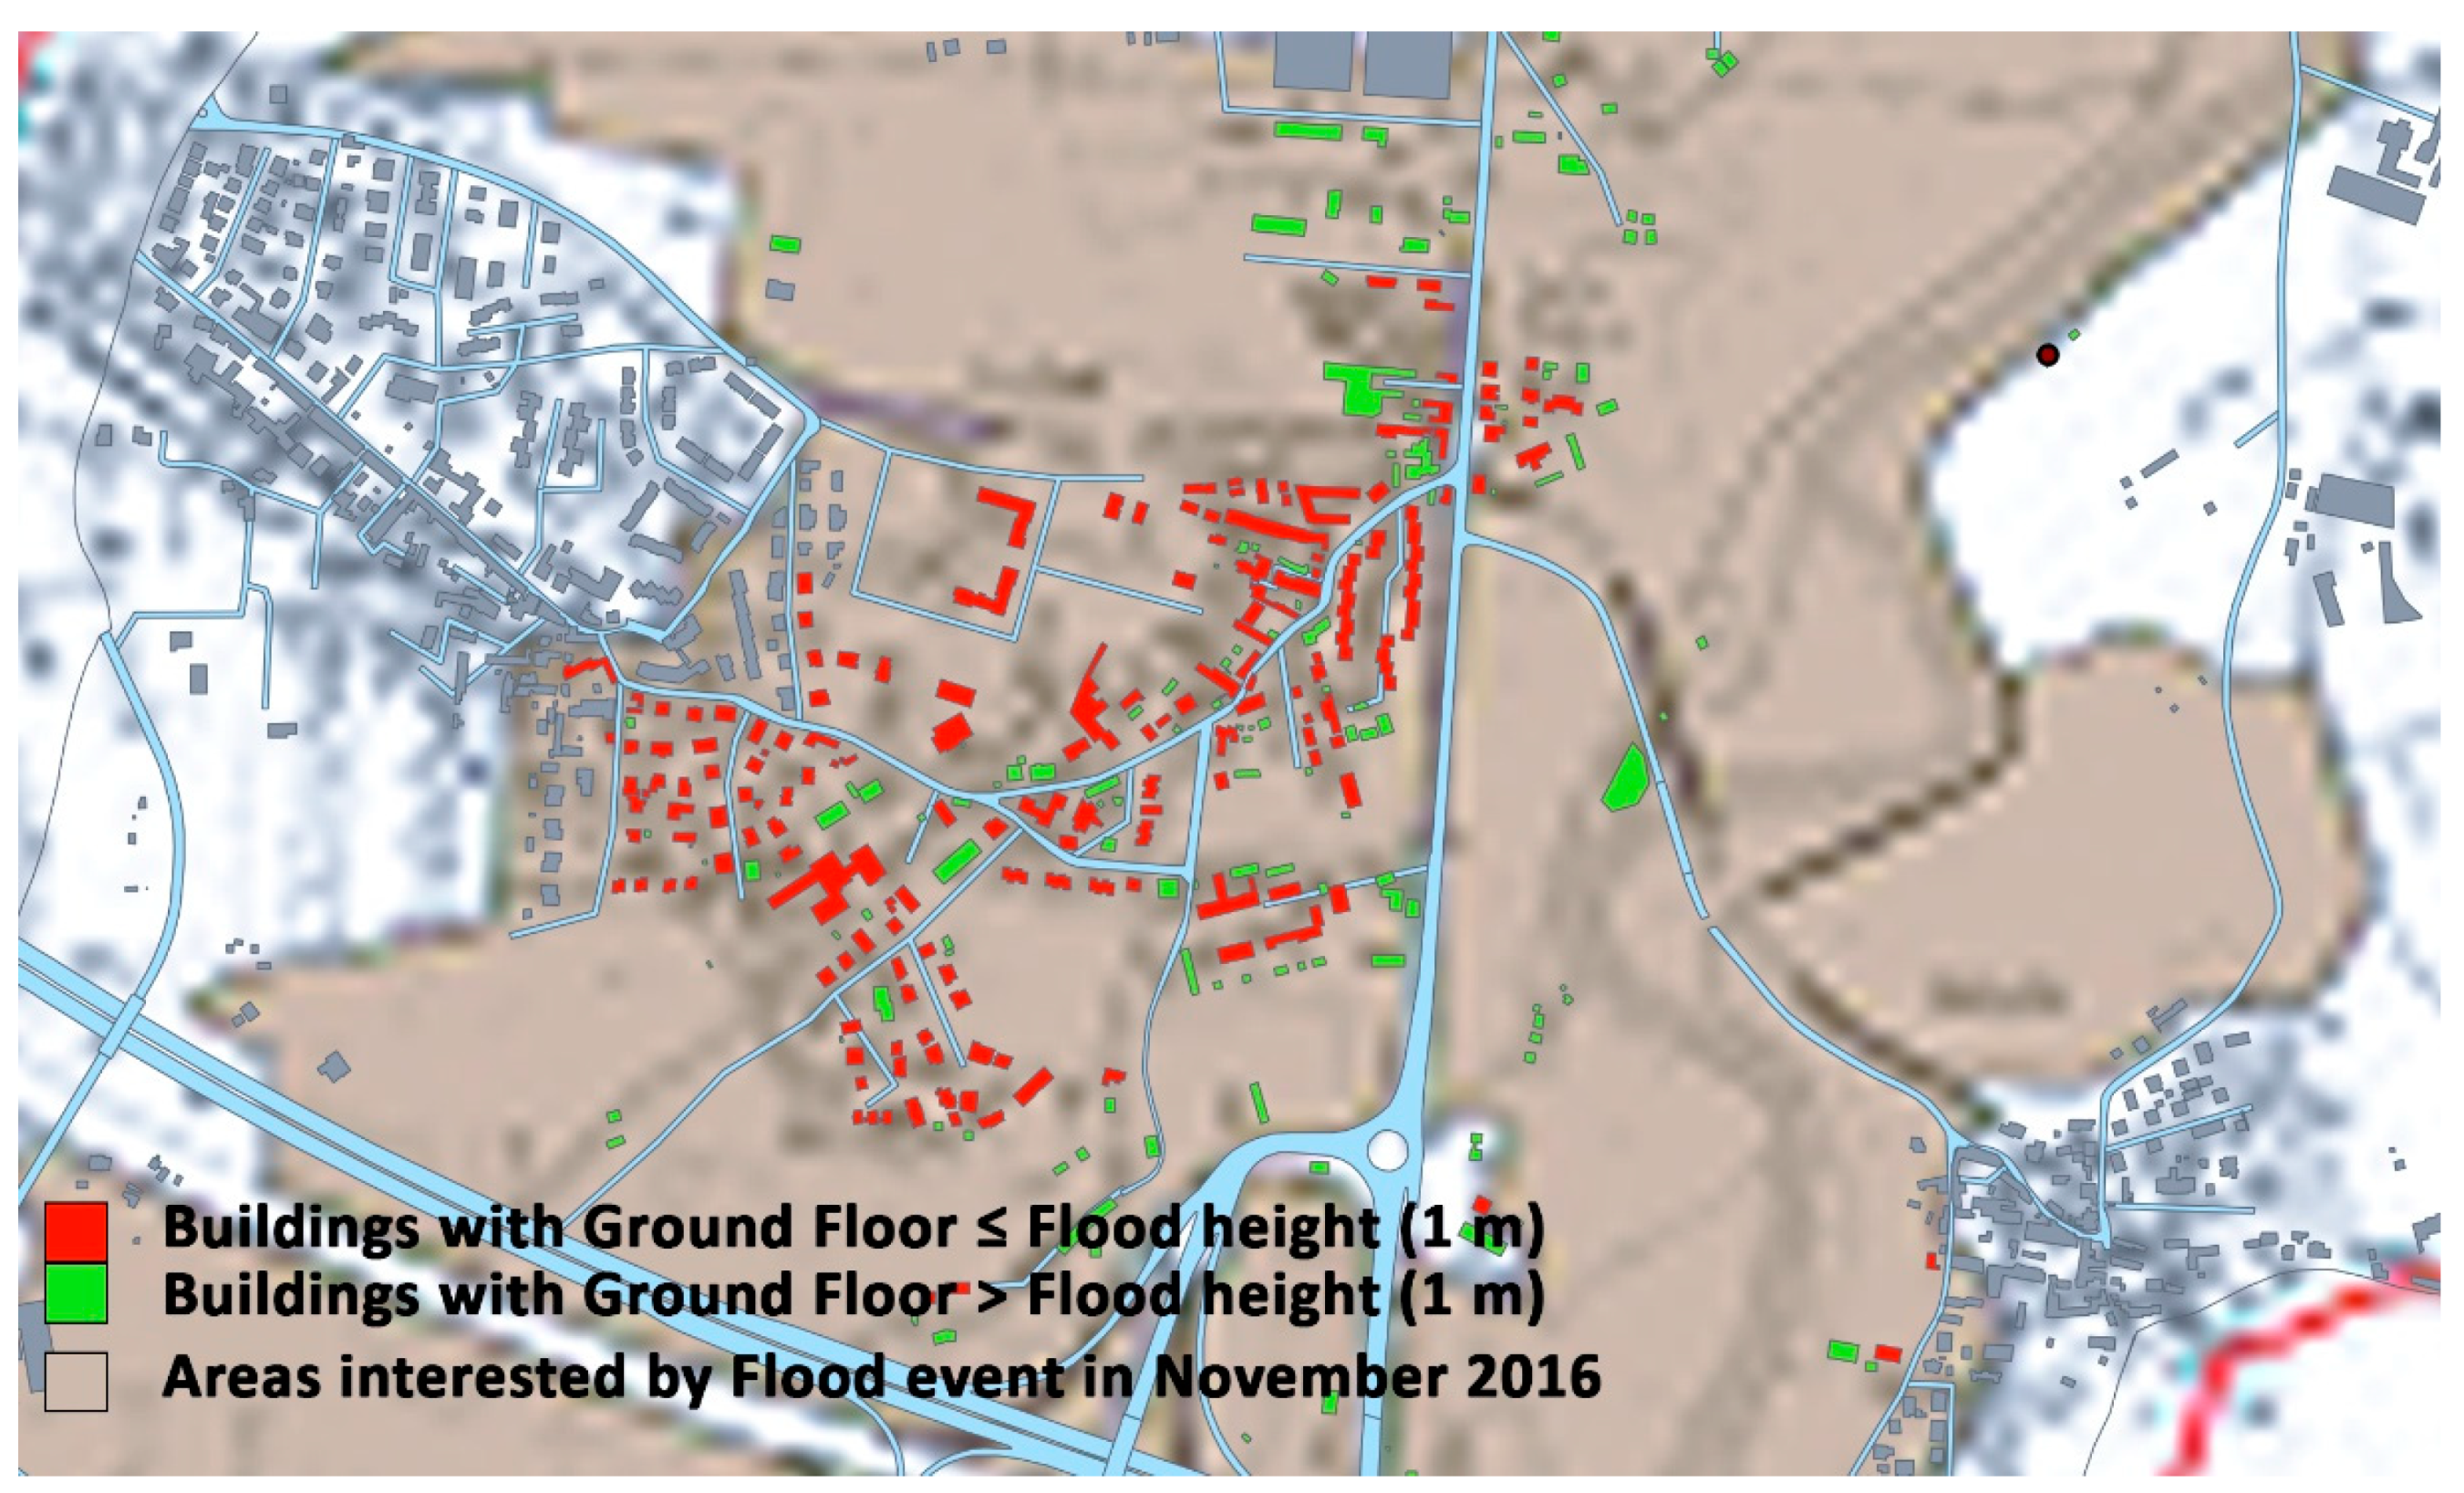
For this reason, only one possible parameter was selected from these literature resources and converted into an indicator: the height of the ground floor compared to the flood height. The expected flood height is usually known from the existing flood plans and the surveys of the events occurred, while the ground floor height is easily verifiable through Google street-view. Exposure being equal, this indicator of sensitivity can provide an essential information on the vulnerability of built landscape, because a ground floor used for residential purposes located under the max flood height is deeply more vulnerable with respect to other types of buildings and functions.
The second indicator here presented is related to Fire risks; in this case, the vulnerability towards a fire strictly depends on the characteristics of the building and of the vegetation cover in its close surrounds. An index considering 4 different factors of vulnerability towards risks is defined by [
29], like i.e., type of materials employed for the roof and coating of the building, and some of these factors can be found also in [
27,
28].
The parameters most suitable to be applied at a local scale, because of the availability of information and spatial data, were the so-called ‘defensive space’ around the buildings and the slope. The defensive space is an area of 10 m around the building in which only grass should be present; if trees or bushes are included in it, they can increase the sensitivity of the building towards fire. The slope should be minor of 40%. Spatial data related to vegetation cover and slopes are available in regional archives.
3. Results
The proposed semiquantitative methodology, as described from
Section 2.1,
Section 2.2,
Section 2.3,
Section 2.4 and
Section 2.5 was tested and applied to two Italian case studies that returned positive results in terms of soundness of the interactions detected, highlighting possible problems that were not clearly signaled or neglected by the risk sectorial plans.
I.e., one of the case studies considered was Mantua: on the Mincio river, in front of the ancient city that is an Unesco site, an important industrial hub rose in 1950. Two plants are still active and relevant for their dimensions and quantities of stored hazardous substances: a petrochemical plant and a warehouse of gasoline and diesel fuels. During the years, both the plants produced a serious situation of pollution, but despite of the proximity to the river, and the unexpected earthquake of 2012, the possible effects of the interactions between the industries and natural events were not taken into account in the official planning instruments of the city. The methodology was applied to find out if the risk-interactions could produce damages not analyzed in Mantua E.R.I.R. The values of interaction obtained through the interaction tables resulted between low and moderate (see
Table 2, referred to the petrochemical plant), because of the initial low levels of the natural risk. These values were therefore employed to settle simulations of industrial damages with ALOHA
® and HSSM
®, that revealed possible criticalities both for the environment and the population. On one side, due to the quality of the soil, even a very small damage to the tanks caused by an external event could cause the penetration of pollutants in the underground aquifer, confirming why the pollution under Mantua plants is still ongoing today. On the other side, despite of the several protections adopted by the petrochemical plant and the warehouse, unexpected consequences could come from minor damages to the rail-tankers that bring the products to the plants; as shown by
Figure 1 below, possible toxic releases could interest residential areas located alongside the railway.
The second case study was related to a small city in Piedmont; it was repeatedly interested by floods due to a minor hydrographic network, not reported and analyzed in the regional Flood plan. Some Seveso plants were located in the town (see
Figure 2), so that it was important to verify possible risk interactions.
The following two tables (
Table 5 and
Table 6) report the analysis developed for Plant B, a plant detaining an amount of hazardous substances that overcame the Seveso thresholds, but that was not compliant with the Seveso regulations. Plant B was hit by Flood in 1994, 2000 and 2008; the flood events however had a moderate impact, reaching the maximum height of 1 m. This initial moderate value of the flood risk, combined with low value adopted for the Industrial macro-category H.E. in absence of certain information, produced a low interaction risk tending to medium (1.98).
Even if the Interaction values were moderate, the ratings assigned to some risk macro-categories overcame the threshold of 2.5, therefore the Compatibility analysis was carried out:
Even starting from low level impact risks, some problematics related to the environment were identified (as shown by
Table 6). The Municipality in this case should develop some further in-depth investigations.
The proposed approach provides the Municipalities with a quick and easy to use tool that can be developed almost completely with internal resources; the application of the methodology can be done by a work team composed by Municipal technicians and members of superior authorities or institutes (like Regions, Agencies for the Protection of the Environment, etc.). The work team proceed with the assignation of ratings, exploiting the major direct knowledge of the territory that usually the Municipality has, and then assess the risk interactions and the possible incompatibilities. The methodology aims at filling a gap in the existing planning and risk instruments, helping local planners in find out the unexpected effects of multiple risks and providing an important indication on the priority areas to which address technical studies and financial resources.
The methodology constituted an important background for the development of the “R3C” framework, whose development is at an initial stage: The R3C research group is focusing on the development of spatial indicators able to describe the vulnerability of a territory, in order then to test and develop effective solutions to increase resilience and adaptation. In particular, the research group is currently working on the definition of indicators of vulnerability that are spatially meaningful and able to usefully describe the local vulnerability. The experience with the above-mentioned multi-risk methodology guided the authors in the definition of indicators of sensitivity strictly related to risks.
The indicators proposed in the context of R3C were identified and tested for the experimental case-study of Moncalieri, a town of medium dimensions nearby Turin, that constitutes an interesting case-study for its peculiarities. In fact, it presents both hilly and flat areas, crossed by the Po river and its tributaries, it owns an important historical heritage together with extensive industrial areas, and it is crossed by important transport and energy infrastructures.
The indicator “
Height of the ground floor compared to the flood height”, mentioned in
Section 2.6., was investigated and identified for the experimental case study of Moncalieri, that in 2016 was interested by a huge flood event that overcame the limits reported in the flood plan for catastrophic events. Following the rupture of a levee, the flood hit some quarters of Moncalieri never reached by floods, connoted by residential cottages of maximum of two floors. These areas were accurately investigated to identify all the buildings more sensitive to the flood because of the height of their ground floor.
Figure 3 below shows the superimposition between the flooded areas and the residential building whose ground floor was below the flood height (1 m).
As far as it concerns the indicator related to fire risk, the area of Moncalieri more exposed is the hilly one: the defensive space of the buildings here located was investigated to identify the presence of trees or bushes. This data was spatially obtained though GIS, using the thematic regional map of the vegetable cover and verifying, for each building, a buffer zone of 10 m. The result of the investigation is shown in
Figure 4.
The indicators for sensitivity here presented could be valid not only to highlight the vulnerability of residential buildings, but they could be applicable also to industrial buildings. However, in this case, a further investigation on the type of substances detained should be indispensable to verify possible effects and unexpected consequences of the impact of flood or fire.
A process of weighting will be soon carried out for all the R3C spatial indicators of vulnerability, in order to properly use them to give priorities to the most vulnerable areas.
4. Discussion and Conclusions
R3C adopted the concept of territorial resilience as the focus and objective of its research work: It expresses a novel concept of resilience, aimed at reconnecting the theoretical knowledge to a factual translation into spatial plans and projects. The implementation of resilience in a territorial system means reduction of vulnerability, the pursuit of social and institutional learning capacity, and the achievement of better territorial governance that increase the adaptation ability and reduce vulnerabilities [
1]. The R3C research group is composed of several contributors, coming from different disciplines, both related to risks and land use planning; it promotes a multi-disciplinary approach that should generate feedback between assessment and territorial government, indicating and selecting sites where specific actions of mitigation, adaptation, risk reduction, or transformations should be implemented to reduce the vulnerability of the system.
This paper presents, on one side, a background contribution to the research carried out by R3C, and, on the other side, one of the outputs of R3C’s first stage—the research of feasible indicators of vulnerability for urban systems. The proposed semi-quantitative methodology for multi-risk pre-screening produced interesting results for the analyzed case-studies, evidencing possible negative events deriving from risk interactions; however, since the methodology requires a phase of in-depth studies to confirm and prove the consistency of the results, wider investigations on the vulnerabilities of the territorial system should be carried out. As mentioned in
Section 2.4, at the moment the vulnerabilities are evaluated according to the Ministerial decree 09/05/2001 [
13], but further analyses on the risk-specific sensitivity were needed: two indicators were proposed to quickly evaluate the vulnerability of buildings towards flood and fire. They identify important aspects of sensitivity towards external risks, and, at the same time, are quite reliable in terms of available information and spatial data. The insertion of specific indicators of sensitivity related to risks in a wider approach aimed at influencing the current practices of land use planning could represent an important advancement to obtain major preparedness and awareness at a local scale, obviously keeping in mind the final objective of increasing “territorial resilience”.
Beside the indicators here presented, the authors are currently working to develop indicators of sensitivity more strictly related to industrial areas and strategic infrastructures on the territory. Both these elements are connoted by a dual nature: On one side they are vulnerable towards external natural events, but at the same time, they can provoke damages to the population and urban functioning in case of failure and damage. For this reason, the authors are in the development phase of specific indicators related to: (1) the type of production and items correlated for industries; and (2) accessibility and redundancy for strategic infrastructures.
As far as it concerns the methodology for rapid risk pre-screening, some further refinements are in progress; in particular, a sensitivity test was carried out to verify the impact of subjectivity in the phase of the rating attributions, and possible corrective actions were proposed. The sensitivity test made clear that the interaction values that are more susceptible to variations consequent to the assignation of the rating are those closer to the limits between the intervals of the scale adopted (“low”, “medium”, “high”). In fact, in these cases, the variation of only one parameter of the risk macro-categories can determine an interval change; therefore, it can be said that these interaction values are those more exposed to discretion risks. In order to compensate for this result, a variation was proposed for the application of the methodology: In the case of interaction values near to the limit of the intervals, an attention threshold of ±0.25 could be adopted. This means that, for example, if the interaction value is 1.75, or 2.25, the user should know that this value could be particularly sensitive to uncertainties and thus discretion occurred during the rating phase; therefore, the results of the interaction tables could need some in-depth analyses [
30].


