Inter-University Sustainability Benchmarking for Canadian Higher Education Institutions: Water, Energy, and Carbon Flows for Technical-Level Decision-Making


Abstract
1. Introduction
2. Background
2.1. Sustainable Development in HEIs
2.2. Sustainability Reporting Systems
3. Methodology
3.1. Size-Based Classification of HEIs
3.2. Data Collection
3.3. Regression Analysis for Missing Data
3.4. Normalization of Factors Affecting WEC Flows
3.5. Ranking of HEIs Based on WEC Flows
4. Results
5. Discussion
6. Conclusions
Author Contributions
Funding
Acknowledgments
Conflicts of Interest
Appendix A. Historical Background of Declarations on Sustainability of HEIs

| No | Year | Declaration |
|---|---|---|
| 1 | 1972 | Stockholm Declaration on the Human Environment UNEP |
| 2 | 1977 | Tbilisi Declaration UNESCO |
| 3 | 1988 | Manga Charta of European Universities Association (EUA) |
| 4 | 1990 | University Presidents for a Sustainable Future: the Talloires Declaration ULSF |
| 5 | 1991 | Halifax Declaration (International Institute for Sustainable Development) |
| 6 | 1992 | Agenda 21 Report of the United Nations Conference on Environment and Development (UNCED) |
| 7 | 1993 | Ninth International Association of Universities Round Table: the Kyoto Declaration |
| 8 | 1993 | Association of Commonwealth Universities “Fifteenth Quinquennial Conference: Swansea Declaration |
| 9 | 1994 | CRE Copernicus Charter |
| 10 | 1997 | International Conference on Environment and Society: Education and Public Awareness for Sustainability UNESCO |
| 11 | 1998 | World Declaration on Higher Education for the Twenty-first Century: Vision and action UNESCO |
| 12 | 2000 | Earth Charter |
| 13 | 2001 | Luneburg Declaration UNESCO |
| 14 | 2002 | Ubuntu Declaration UN |
| 15 | 2002 | Johannesburg Plan of Implementation World Summit on Sustainable Development (WSSD) |
| 16 | 2005-2014 | The UN Decade Education for Sustainable Development UNESCO |
| 17 | 2005 | Graz Declaration on Committing Universities to Sustainable Development |
| 18 | 2006 | Declaration on the Responsibility of Higher Education for a Democratic Culture Citizenship, Human Rights and Sustainability |
| 19 | 2008-2017 | G8 University Summit Sapporo Sustainability Declaration |
| 20 | 2009 | Abuja Declaration on Sustainable Development in Africa |
| 21 | 2009 | Tokyo Declaration of HOPE ASSU |
| 22 | 2009 | Turin Declaration on Education and Research for Sustainable and Responsible Development, Italy |
| 23 | 2009 | World Conference on Higher Education UNESCO |
| 24 | 2010 | G8 University Summit |
| 25 | 2011 | Copernicus Charta 2.0 |
| 26 | 2012 | Peoples Sustainability Treaty on Higher Education |
| 27 | 2012 | UN Higher Education Sustainability Initiative with Rio+20 |
| 28 | 2015 | Higher Education Sustainability Initiative: Climate change action for sustainable development |
Appendix B. Assessment Procedure of Sustainability Tracking Assessment and Reporting System (STARS)
| Category/Group | Subgroups | Indicators | Points |
|---|---|---|---|
| Academics (AC) | Curriculum (40 points) | AC1 Academic Courses AC2 Learning Outcomes AC3 Undergraduate Program AC4 Graduate Program AC5 Immersive Experience AC6 Sustainability Literacy Assessment AC7 Incentives for Developing Courses AC8 Campus as a living Laboratory | 14 8 3 3 2 4 2 4 |
| Research (18 points) | AC9 Academic Research AC10 Support for Research AC11 Access to Research | 12 4 2 | |
| Engagement (EN) | Campus Engagement (21 points) | EN1 Student Educators Program EN2 Student Orientation EN3 Student Life EN4 Outreach Materials and Publications EN5 Outreach Campaign EN6 Assessing Sustainability culture EN7 Employee Educators Program EN8 Employee Orientation EN9 Staff Professional Development | 4 2 2 2 4 1 3 1 2 |
| Public Engagement (20 points) | EN10 Community Partnerships EN11 Inter-Campus Collaboration EN12 Continuing Education EN13 Community Service EN14 Participation in Public Policy EN15 Trademark Licensing | 3 3 5 5 2 2 | |
| Operations (OP) | Air & Climate (11 points) | OP1 Greenhouse Gas Emissions OP2 Outdoor Air Quality | 10 1 |
| Buildings (8 points) | OP3 Building Operations and Maintenance OP4 Building Design and Construction | 5 3 | |
| Energy (10 points) | OP5 Building Energy Consumption OP6 Clean and Renewable Energy | 6 4 | |
| Food & Dining (8 points) | OP7 Food and Beverage Purchasing OP8 Sustainable Dining | 6 2 | |
| Grounds (3-4 points) | OP9 Landscape Management OP10 Biodiversity | 2 1-2 | |
| Purchasing (6 points) | OP11 Sustainable Procurement OP12 Electronics Purchasing OP13 Cleaning and Janitorial Purchasing OP14 Office Paper Purchasing | 3 1 1 1 | |
| Transportation (7 points) | OP15 Campus Fleet OP16 Student Commute Modal Split OP17 Employee Commute Modal Split OP18 Support for Sustainable Transportation | 1 2 2 2 | |
| Waste (10 points) | OP19 Waste Minimization and Diversion OP20 Construction and Demolition Waste Diversion OP21 Hazardous Waste Management | 8 1 1 | |
| Water (6-8 points) | OP22 Water Use OP23 Rainwater Management | 4-6 2 | |
| Planning & Administration (PA) | Coordination & Planning (8 points) | PA1 Sustainability Coordination PA2 Sustainability Planning PA3 Participatory Governance | 1 4 3 |
| Diversity & Affordability (10 points) | PA4 Diversity and Equity Coordination PA5 Assessing Diversity and Equity PA6 Support for Underrepresented Groups PA7 Affordability and Access | 2 1 3 4 | |
| Investment & Finance (7 points) | PA8 Committee on Investor Responsibility PA9 Sustainable Investment PA10 Investment Disclosure | 2 4 1 | |
| Well-being & Work (7 points) | PA11 Employee Compensation PA12 Assessing Employee Satisfaction PA13 Wellness Program PA14 Workplace Health and Safety | 3 1 1 2 | |
| Innovation & Leadership (IN) | (4 bonus points available) | Exemplary Practice (Catalog of credits available) Innovation (4 credits available) | 0.5 each 1 each |
References
- World Health Organization (WHO). Health Promoting Universities Concepts, Experience and Framework for Action; Tsouros, A.D., Dowding, G., Thompson, J., Dooris, M., Eds.; World Health Organization: Copenhagen, Denmark, 1998. [Google Scholar]
- Caeiro, S.; Filho, W.L.; Jabbour, C.; Azeiteiro, U.M. Sustainability Assessment Tools in Higher Education Institutions; Springer International Publishing: Gewerbestrasse, Switzerland, 2013; p. 432. [Google Scholar]
- Cortese, A.D. The Critical Role of Higher Education in Creating a Sustainable Future. Plan. High. Educ. 2003, 13, 15–22. [Google Scholar]
- Orr, D.W. Earth in Mind. In The Heart of Higher Education: A Call to Renewal, 10th ed.; Island Press: San Francisco, CA, USA, 2004. [Google Scholar]
- Univcan. Facts and Stats. Available online: http://www.webcitation.org/782U49h9N (accessed on 25 April 2019).
- Organisation for Economic Co-Operation and Development (OCED). Education at a Glance: OCED Indicators; OCED Publishing: Paris, France, 2014. [Google Scholar]
- United Nations (UN). Agenda 21, Ch. 36: Promoting Education and Public Awarness and Training. Available online: http://www.webcitation.org/782UFY9pI (accessed on 24 April 2019).
- Raj, B. Directed and Systematic Approaches Towards Sustainability in the Twenty-first Century, Chapter in The Mind of an Engineer. In The Mind of an Engineer; Ghosh, P., Raj, B., Eds.; Springer: Singapore, 2016. [Google Scholar]
- AASHE. Technical Manual Version 2.1. Available online: http://www.webcitation.org/782VI1ulG (accessed on 4 October 2017).
- Bauer, M.; Bormann, I.; Kummer, B.; Niedlich, S.; Rieckmann, M. Sustainability Governance at Universities: Using a Governance Equalizer as a Research Heuristic. High. Educ. Policy 2018, 31, 491–511. [Google Scholar] [CrossRef]
- Alshuwaikhat, H.M.; Abubakar, I. An integrated approach to achieving campus sustainability: Assessment of the current campus environmental management practices. J. Clean. Prod. 2008, 16, 1777–1785. [Google Scholar] [CrossRef]
- NSF. What’s an Engineered System? Available online: erc-assoc.org/content/what%E2%80%99s-engineered-system (accessed on 28 November 2018).
- Ward, I.; Ogbonna, A.; Altan, H. Sector review of UK higher education energy consumption. Energy Policy 2008, 36, 2939–2949. [Google Scholar] [CrossRef]
- Geng, Y.; Liu, K.; Zue, B.; Fujita, T. Creating a “green university” in China: A case of Shenyang university. J. Clean. Prod. 2013, 61, 13–19. [Google Scholar] [CrossRef]
- Larsen, H.N.; Pettersen, J.; Solli, C.; Hertwich, E.G. Investigating the Carbon Footprint of a University—The case of NTNU. J. Clean. Prod. 2013, 48, 39–47. [Google Scholar] [CrossRef]
- Canada’s Emission Trends. Environment Canada. 2013. Available online: https://www.ec.gc.ca/ges-ghg/985F05FB-4744-4269-8C1A-D443F8A86814/1001Canada’s%20Emissions%20Trends%202013_e.pdf (accessed on 20 April 2015).
- NRC. Energy Efficiency Trends in Canada 1990–2013. Available online: https://www.nrcan.gc.ca/sites/www.nrcan.gc.ca/files/energy/pdf/trends2013.pdf (accessed on 7 June 2015).
- NRC. Consumption of Energy Survey for Universities, Colleges and Hospitals 2003. 2004. Available online: http://oee.nrcan.gc.ca/corporate/statistics/neud/dpa/data_e/consumption03/universities.cfm?attr=0 (accessed on 24 April 2017).
- NRC. Comprehensive Energy Use Database. Available online: https://oee.nrcan.gc.ca/corporate/statistics/neud/dpa/showTable.cfm?type=CP§or=com&juris=ca&rn=3&page=0 (accessed on 8 December 2017).
- United Nations (UN). Stockholm Declaration on the Human Environment; United Nations: Stockholm, Sweden, 1972; Volume 1650, p. 383. [Google Scholar]
- Dlouhá, J.; Barton, A.; Janoušková, S.; Dlouhý, J. Social learning indicators in sustainability-oriented regional learning networks. J. Clean. Prod. 2013, 49, 64–73. [Google Scholar] [CrossRef]
- Klein-Banai, C.; Theis, T.L. Quantitative analysis of factors affecting greenhouse gas emissions at institutions of higher education. J. Clean. Prod. 2013, 48, 29–38. [Google Scholar] [CrossRef]
- Anand, C.K.; Bisaillon, V.; Webster, A.; Amor, B. Integration of sustainable development in higher education—A regional initiative in Quebec (Canada). J. Clean. Prod. 2015, 108, 916–923. [Google Scholar] [CrossRef]
- Lozano, F.J.; Lozano, R. Developing the curriculum for a new Bachelor’s degree in Engineering for Sustainable Development. J. Clean. Prod. 2014, 64, 136–146. [Google Scholar] [CrossRef]
- Tenley, M.C.; Chelsea, D.; Jennifer, L.; Laura, B. Developing ecological footprint scenarios on university campuses: A case study of the University of Toronto at Mississauga. Int. J. Sustain. High. Educ. 2008, 9, 4–20. [Google Scholar] [CrossRef]
- Velazquez, L.; Munguia, N.; Platt, A.; Taddei, J. Sustainable university: What can be the matter? J. Clean. Prod. 2006, 14, 810–819. [Google Scholar] [CrossRef]
- Komiyama, H. G8 University Summit: Sapporo Sustainability Declaration (SSD). Available online: https://www.global.hokudai.ac.jp/wp-content/uploads/2017/05/SSD.pdf (accessed on 25 April 2019).
- United Nations (UN). Transforming Our World: The 2030 Agenda for Sustainable Development. Available online: https://sustainabledevelopment.un.org/content/documents/21252030%20Agenda%20for%20Sustainable%20Development%20web.pdf (accessed on 26 April 2019).
- Fischer, D.; Jenssen, S.; Tappeser, V. Getting an empirical hold of the sustainable university: A comparative analysis of evaluation frameworks across 12 contemporary sustainability assessment tools. Assess. Eval. High. Educ. 2015, 40, 785–800. [Google Scholar] [CrossRef]
- Scheuer, C.; Keoleian, G.A.; Reppe, P. Life cycle energy and environmental performance of a new university building: Modeling challenges and design implications. Energy Build. 2003, 35, 1049–1064. [Google Scholar] [CrossRef]
- Junnila, S.; Horvath, A.; Guggemos, A. Life-Cycle Assessment of Office Buildings in Europe and the United States. J. Infrastruct. Syst. 2006, 12, 10–17. [Google Scholar] [CrossRef]
- Collinge, W.; Landis, A.; Jones, A.; Schaefer, L.; Bilec, M. Dynamic life cycle assessment: Framework and application to an institutional building. Int. J. Life Cycle Assess. 2013, 18, 538–552. [Google Scholar] [CrossRef]
- Omer, A.M. Energy, environment and sustainable development. Renew. Sustain. Energy Rev. 2008, 12, 2265–2300. [Google Scholar] [CrossRef]
- AASHE. The Sustainability Tracking, Assessment & Rating System. Available online: https://reports.aashe.org/institutions/participants-and-reports/ (accessed on 27 April 2019).
- Sinha, P.; Schew, W.A.; Sawant, A.; Kolwaite, K.J.; Strode, S.A. Greenhouse Gas Emissions from U.S. Institutions of Higher Education. J. Air Waste Manag. Assoc. 2010, 60, 568–573. [Google Scholar] [CrossRef] [PubMed]
- University of Nebraska-Lincoln (UNL). Greenhouse Gas Emissions. Available online: https://sustainability.unl.edu/greenhouse-gas-emissions (accessed on 27 April 2019).
- Massachusetts Institute of Technology (MIT). Climate Action Plan Update 2018: Reducing MIT’s Emissions. Available online: http://sustainability.mit.edu/sites/default/files/resources/2018-11/2018_ghg_summary_report_handout.pdf (accessed on 21 April 2019).
- Grindsted, T.S. Sustainable universities—From declarations on sustainability in higher education to national law. Environ. Econ. 2011, 2, 29–36. [Google Scholar] [CrossRef]
- Lozano, R.; Lukman, R.; Lozano, F.J.; Huisingh, D.; Lambrechts, W. Declarations for sustainability in higher education: Becoming better leaders, through addressing the university system. J. Clean. Prod. 2013, 48, 10–19. [Google Scholar] [CrossRef]
- Wright, T. The Evolution of Sustainability Declarations in Higher Education. In Higher Education and the Challenge of Sustainability: Problematics, Promise, and Practice; Corcoran, P.B., Wals, A.E.J., Eds.; Springer: Dordrecht, The Netherlands, 2004; pp. 7–19. [Google Scholar]
- Wright, T.S.A. Definitions and frameworks for environmental sustainability in higher education. Int. J. Sustain. High. Educ. 2002, 3, 203–220. [Google Scholar] [CrossRef]
- Findler, F.; Schönherr, N.; Lozano, R.; Stacherl, B. Assessing the Impacts of Higher Education Institutions on Sustainable Development—An Analysis of Tools and Indicators. Sustainability 2018, 11, 59. [Google Scholar] [CrossRef]
- Clarkson, R.E.; Samson, K.; Bekessy, S.A. The failure of non-binding declarations to achieve university sustainability: A need for accountability. Int. J. Sustain. High. Educ. 2007, 8, 301–316. [Google Scholar] [CrossRef]
- UBC. Annual Sustainability Report 2013–2014. Available online: https://sustain.ubc.ca/sites/sustain.ubc.ca/files/uploads/CampusSustainability/CS_PDFs/PlansReports/Reports/2013-2014-Annual-Sustainability-Report.pdf (accessed on 10 September 2016).
- UBC. UBC Vancouver Campus—2007 GHG Emissions Inventory. Available online: https://sustain.ubc.ca/sites/sustain.ubc.ca/files/uploads/CampusSustainability/CS_PDFs/ClimateEnergy/UBCGHGInventory_2007.pdf (accessed on 10 September 2016).
- UBC. UBC Vancouver Campus—2015 Greenhouse Gas Emissions Inventory. Available online: https://sustain.ubc.ca/sites/sustain.ubc.ca/files/UBCGHGInventory_2015.pdf (accessed on 10 September 2016).
- Martin, S.; Jucker, R. Educating Earth-literate Leaders. J. Geogr. High. Educ. 2005, 29, 19–29. [Google Scholar] [CrossRef]
- Rees, W.; Wackernagel, M. Urban ecological footprints: Why cities cannot be sustainable—And why they are a key to sustainability. Environ. Impact Assess. Rev. 1996, 16, 223–248. [Google Scholar] [CrossRef]
- Kate, F. Institutional ecological footprint analysis—A case study of the University of Newcastle, Australia. Int. J. Sustain. High. Educ. 2001, 2, 48–62. [Google Scholar] [CrossRef]
- Alghamdi, N.; den Heijer, A.; de Jonge, H. Assessment tools’ indicators for sustainability in universities: An analytical overview. Int. J. Sustain. High. Educ. 2017, 18, 84–115. [Google Scholar] [CrossRef]
- Shriberg, M. Institutional assessment tools for sustainability in higher education: Strengths, weaknesses, and implications for practice and theory. Int. J. Sustain. High. Educ. 2002, 3, 254–270. [Google Scholar] [CrossRef]
- Alba-Hidalgo, D.; Benayas del Álamo, J.; Gutiérrez-Pérez, J. Towards a Definition of Environmental Sustainability Evaluation in Higher Education. High. Educ. Policy 2018, 31, 447–470. [Google Scholar] [CrossRef]
- Lozano, R. Incorporation and institutionalization of SD into universities: Breaking through barriers to change. J. Clean. Prod. 2006, 14, 787–796. [Google Scholar] [CrossRef]
- Lozano, R. A tool for a Graphical Assessment of Sustainability in Universities (GASU). J. Clean. Prod. 2006, 14, 963–972. [Google Scholar] [CrossRef]
- Lozano García, F.J.; Kevany, K.; Huisingh, D. Sustainability in higher education: What is happening? J. Clean. Prod. 2006, 14, 757–760. [Google Scholar] [CrossRef]
- Disterheft, A.; Ferreira da Silva Caeiro, S.S.; Ramos, M.R.; de Miranda Azeiteiro, U.M. Environmental Management Systems (EMS) implementation processes and practices in European higher education institutions—Top-down versus participatory approaches. J. Clean. Prod. 2012, 31, 80–90. [Google Scholar] [CrossRef]
- Yuan, X.; Zuo, J.; Huisingh, D. Green Universities in China—What matters? J. Clean. Prod. 2013, 61, 36–45. [Google Scholar] [CrossRef]
- Haider, H.; Sadiq, R.; Tesfamariam, S. Intra-utility performance management model (In-UPM) for the sustainability of small to medium sized water utilities: Conceptualization to development. J. Clean. Prod. 2016, 133, 777–794. [Google Scholar] [CrossRef]
- Wann, D.L.; Schrader, M.P.; Allison, J.A.; McGeorge, K.K. The Inequitable Newpaper Ceverage of Men’s and Womens Athletics at Small, Medium, and Large Universities. J. Sport Soc. Issues 1998, 22, 79–87. [Google Scholar] [CrossRef]
- Herremans, I.; Allwright, D.E. Research: Environmental Management Systems at North American Universities: What Drives Good Performance? ULSF: Washington, DC, USA, 2000. [Google Scholar]
- Haider, H.; Sadiq, R.; Tesfamariam, S. Selecting performance indicators for small and medium sized water utilities: Multi-criteria analysis using ELECTRE method. Urban Water J. 2014. [Google Scholar] [CrossRef]
- ECCC. Greenhouse Gas Emissions from Large Facilities Canada. 2014. Available online: https://www.canada.ca/en/environment-climate-change/services/environmental-indicators.html (accessed on 15 February 2018).
- Piper, J.E. Operations and Maintenance Manual for Energy Management; Routledge: Abingdon, UK, 1998. [Google Scholar]
- Chung, W.; Hui, Y.V.; Lam, Y.M. Benchmarking the energy efficiency of commercial buildings. Appl. Energy 2006, 83, 1–14. [Google Scholar] [CrossRef]
- AASHE. Dalhousie Univeristy Greenhouse Gas Emissions. Available online: https://stars.aashe.org/institutions/dalhousie-university-ns/report/2015-01-07/OP/air-climate/OP-1/ (accessed on 4 November 2017).
- AASHE. Sheridan Institute of Technology and Advanced Learning OP-1: Greenhouse Gas Emissions. Available online: https://stars.aashe.org/institutions/sheridan-institute-of-technology-and-advanced-learning-on/report/2015-04-20/OP/air-climate/OP-1/ (accessed on 4 November 2017).
- Dalhousie_University. Greenhouse Gas (GAS) Inventory Report 2014–2015. Available online: https://www.dal.ca/content/dam/dalhousie/pdf/dept/sustainability/Dalhousie%20GHG%20Inventory%202014-15%20Final.pdf (accessed on 4 November 2017).
- Sun, H.; Lee, S.E.; Priyadarsini, R.M.T.; Wu, X.; Chia, Y.; Majid, S. Building energy performance benchmaking and simulation under tropical climatic conditions. In Proceedings of the International Workshop on Energy Perofrmance and Environmental Quality of Buildings, Milos Island, Greece, 6–7 July 2006. [Google Scholar]
- Birtles, A.B.; Grigg, P. Energy efficiency of buildings: Simple appraisal method. Build. Serv. Eng. Res. Technol. 1997, 18, 109–114. [Google Scholar] [CrossRef]
- Faust, A.-K.; Baranzini, A. The economic performance of Swiss drinking water utilities. J. Product. Anal. 2014, 41, 383–397. [Google Scholar] [CrossRef][Green Version]
- van Calker, K.J.; Berentsen, P.B.M.; Romero, C.; Giesen, G.W.J.; Huirne, R.B.M. Development and application of a multi-attribute sustainability function for Dutch dairy farming systems. Ecol. Econ. 2006, 57, 640–658. [Google Scholar] [CrossRef]
- Alberta, E. Alberta’s Electricity Generation. 2015. Available online: http://www.energy.alberta.ca/Electricity/682.asp (accessed on 4 October 2017).
- SaskPower. A Powerful Connection. Available online: http://www.saskpower.com/wp-content/uploads/2015-16_SaskPower_annual_report.pdf (accessed on 4 October 2017).
- Agdas, D.; Srinivasan, R.S.; Frost, K.; Masters, F.J. Energy use assessment of educational buildings: Toward a campus-wide sustainable energy policy. Sustain. Cities Soc. 2015, 17, 15–21. [Google Scholar] [CrossRef]
- Tilton, C.; El Asmar, M. Assessing LEED versus Non-LEED Energy Consumption for a University Campus in North America: A Preliminary Study. In Proceedings of the ICSI 2014, Long Beach, CA, USA, 6–8 November 2014; pp. 1071–1076. [Google Scholar]
- BU. What Is LEED. Available online: http://www.bu.edu/sustainability/what-were-doing/green-buildings/leed/%3E%20cited%20on%20November%202018 (accessed on 20 November 2018).
- Waheed, B.; Khan, F.I.; Veitch, B. Developing a quantitative tool for sustainability assessment of HEIs. Int. J. Sustain. High. Educ. 2011, 12, 355–368. [Google Scholar] [CrossRef]
- Boons, F.A.A.; Baas, L.W. Types of industrial ecology: The problem of coordination. J. Clean. Prod. 1997, 5, 79–86. [Google Scholar] [CrossRef]
- HEEPI. Results of the HEEPI HE Building Energy Benchmarking Initative. 2004. Available online: http://heepi.org.uk/ (accessed on 8 December 2015).
- Altan, H. Energy efficiency interventions in UK higher education institutions. Energy Policy 2010, 38, 7722–7731. [Google Scholar] [CrossRef]
- Tuladhar, A.; Cheng, P.; Xiao, C.; Siemens, E. An Investigation into the Potential for PVC Reduction in Building Floorings. Available online: https://open.library.ubc.ca/collections/18861/items/1.0108802 (accessed on 20 April 2019).
- Novotny, V. Water and energy link in the cities of the future—Achieving net zero carbon and pollution emissions footprint. Water Sci. Technol. 2011, 63, 184–190. [Google Scholar] [CrossRef]
- Tiyarattanachai, R.; Hollmann, N.M. Green campus initiative and its impacts on quality of life of stakeholders in green and non-green campus universities. SpringerPlus 2016, 5, 84. [Google Scholar] [CrossRef] [PubMed]
- Bhuiyan, N.; Baghel, A. An overview of continuous improvement: From the past to the present. Manag. Decis. 2005, 43, 761–771. [Google Scholar] [CrossRef]
- Elmuti, D.; Kathawala, Y. An overview of benchmarking process: A tool for continuous improvement and competitive advantage. Benchmark. Qual. Manag. Technol. 1997, 4, 229–243. [Google Scholar] [CrossRef]
- Bereskie, T.; Haider, H.; Rodriguez, M.J.; Sadiq, R. Framework for continuous performance improvement in small drinking water systems. Sci. Total Environ. 2017, 574, 1405–1414. [Google Scholar] [CrossRef]


| No | HEI | Fiscal Year | Number of FTEs | GHG Emissions (tCO2e/ FTE) |
|---|---|---|---|---|
| 1 | University of Saskatchewan | 2015/2016 | 18,082 | 8.43 |
| 2 | University of Alberta | 2015/2016 | 34,693 | 8.24 |
| 3 | University of Calgary | 2017/2018 | 28,860 | 6.31 |
| 4 | Dalhousie University | 2016/2017 | 17,610 | 4.94 |
| 5 | University of New Brunswick | 2015/2016 | 6748 | 4.59 |
| 6 | Northern Alberta Institute of Technology | 2013/2014 | 12,479 | 4.34 |
| 7 | MacEwan University | 2016/2017 | 12,623 | 2.22 |
| 8 | Nova Scotia Community College | 2015/2016 | 10,420 | 1.94 |
| 9 | Western University | 2016 | 32,529 | 1.71 |
| 10 | McGill University | 2014 | 31,755 | 1.36 |
| Input | Units | N | Min | Max | Mean | SD | Q1 | Q3 |
|---|---|---|---|---|---|---|---|---|
| Climate | °C | 33 | 2.975 | 10.4 | 7.014 | 2.492 | 4.188 | 9.342 |
| HDD | 33 | 2136 | 11,296 | 4700 | 2179 | 3312 | 5666 | |
| CDD | 33 | 2 | 632 | 260 | 168 | 129.8 | 350.3 | |
| FTE | 33 | 971 | 56,123 | 17,860 | 13,363 | 8224 | 28,413 | |
| Area | m2 | 33 | 39,912 | 1,434,513 | 369,772 | 367,429 | 113,478 | 550,147 |
| GHG | tCO2e | 30 | 1021 | 299,127 | 42,953 | 67,409 | 4200 | 52,795 |
| Energy | GJ | 33 | 0.0368 | 2.4031 | 0.5815 | 0.6994 | 0.1162 | 0.9647 |
| Water | Gallons1 | 31 | 6,326,921 | 806,266,185 | 132,466,219 | 183,924,619 | 21,774,381 | 197,980,185 |
| Water Use Coefficients | ||
|---|---|---|
| Intercept | X1 | −3.93 |
| Log Energy | X2 | 1.0789 |
| HEI | Climate(°C) | HDD | CDD | FTE | Area (m2) | GHG (tCO2e) | Energy (GJ) | Water (Gallons)1 |
|---|---|---|---|---|---|---|---|---|
| UBC (Vancouver) | 10.4 | 5093 | 95.8 | 43,509 | 1,434,513 | 52,350 | 1.2472 | 806,266,185 |
| HEI mean | - | 4710 | 262 | 18,157 | 374,902 | 35,453 | 0.5809 | 126,627,438 |
| Normalized UBC | - | 1.08 | 0.37 | 2.39 | 0.3558 | 1.34 | 3.4711×10⁻⁶ | 6.05 |
| No. | HEI | Fuel Source Scope 1 | Fuel Source Scope 2 |
|---|---|---|---|
| L4 | University of Calgary | 84% natural gas, 0.22% propane | 73.8% coal, 20.61% natural gas, 5.39% renewables, 0.18% other |
| M3 | University of Regina | 100% natural gas | 100% coal |
| L6 | Western University | 98% natural gas, 2% electricity | 40.85% hydro, 55.67% nuclear, 3.49% natural gas, biomass, and coal |
| M4 | MacEwan University | 100% natural gas | 3% biomass, 40.65% coal, 6.4% hydro, 41.3% natural gas, 7.9% wind, 0.8% other sources |
| M2 | Nova Scotia Community College | 70% fuel oil, 8% other sources, 22% natural gas | 2% biomass, 53% coal, 14% hydro, 14% natural gas, 12% wind, 4% other sources |
| M7 | Dalhousie University | 8% biomass, 84% natural gas, 3% electricity, 5% fuel oil | 2% biomass, 63% coal, 7% hydro, 12% natural gas, 9% wind, 7% other sources |
| L7 | University of Alberta | 54% natural gas, 45.4% purchased electricity | 53% coal, 38% natural gas, 3% hydro, 1% wood biomass, 5% renewables |
| M5 | Northern Alberta Institute of Technology | - | - |
| L2 | University of Manitoba | 99.9% natural gas, 0.05% fuel oil | 95% hydro, 5% natural gas |
| M9 | University of Saskatchewan | 99.96% natural gas, 0.04% fuel oil | 37% coal, 20% hydro, 37% natural gas, 0.02% solar, 5% wind, 0.08% other sources |
| Floor Area of Building (thousand ft2) [Y = a Xb] | ||||||||
|---|---|---|---|---|---|---|---|---|
| X = Water Consumption (Million Gallons)1 | X = Energy Consumption (GJ) | X = GHG Emissions (Million-ton CO2 Equivalent) | ||||||
| a | b | R2 | a | b | R2 | a | b | R2 |
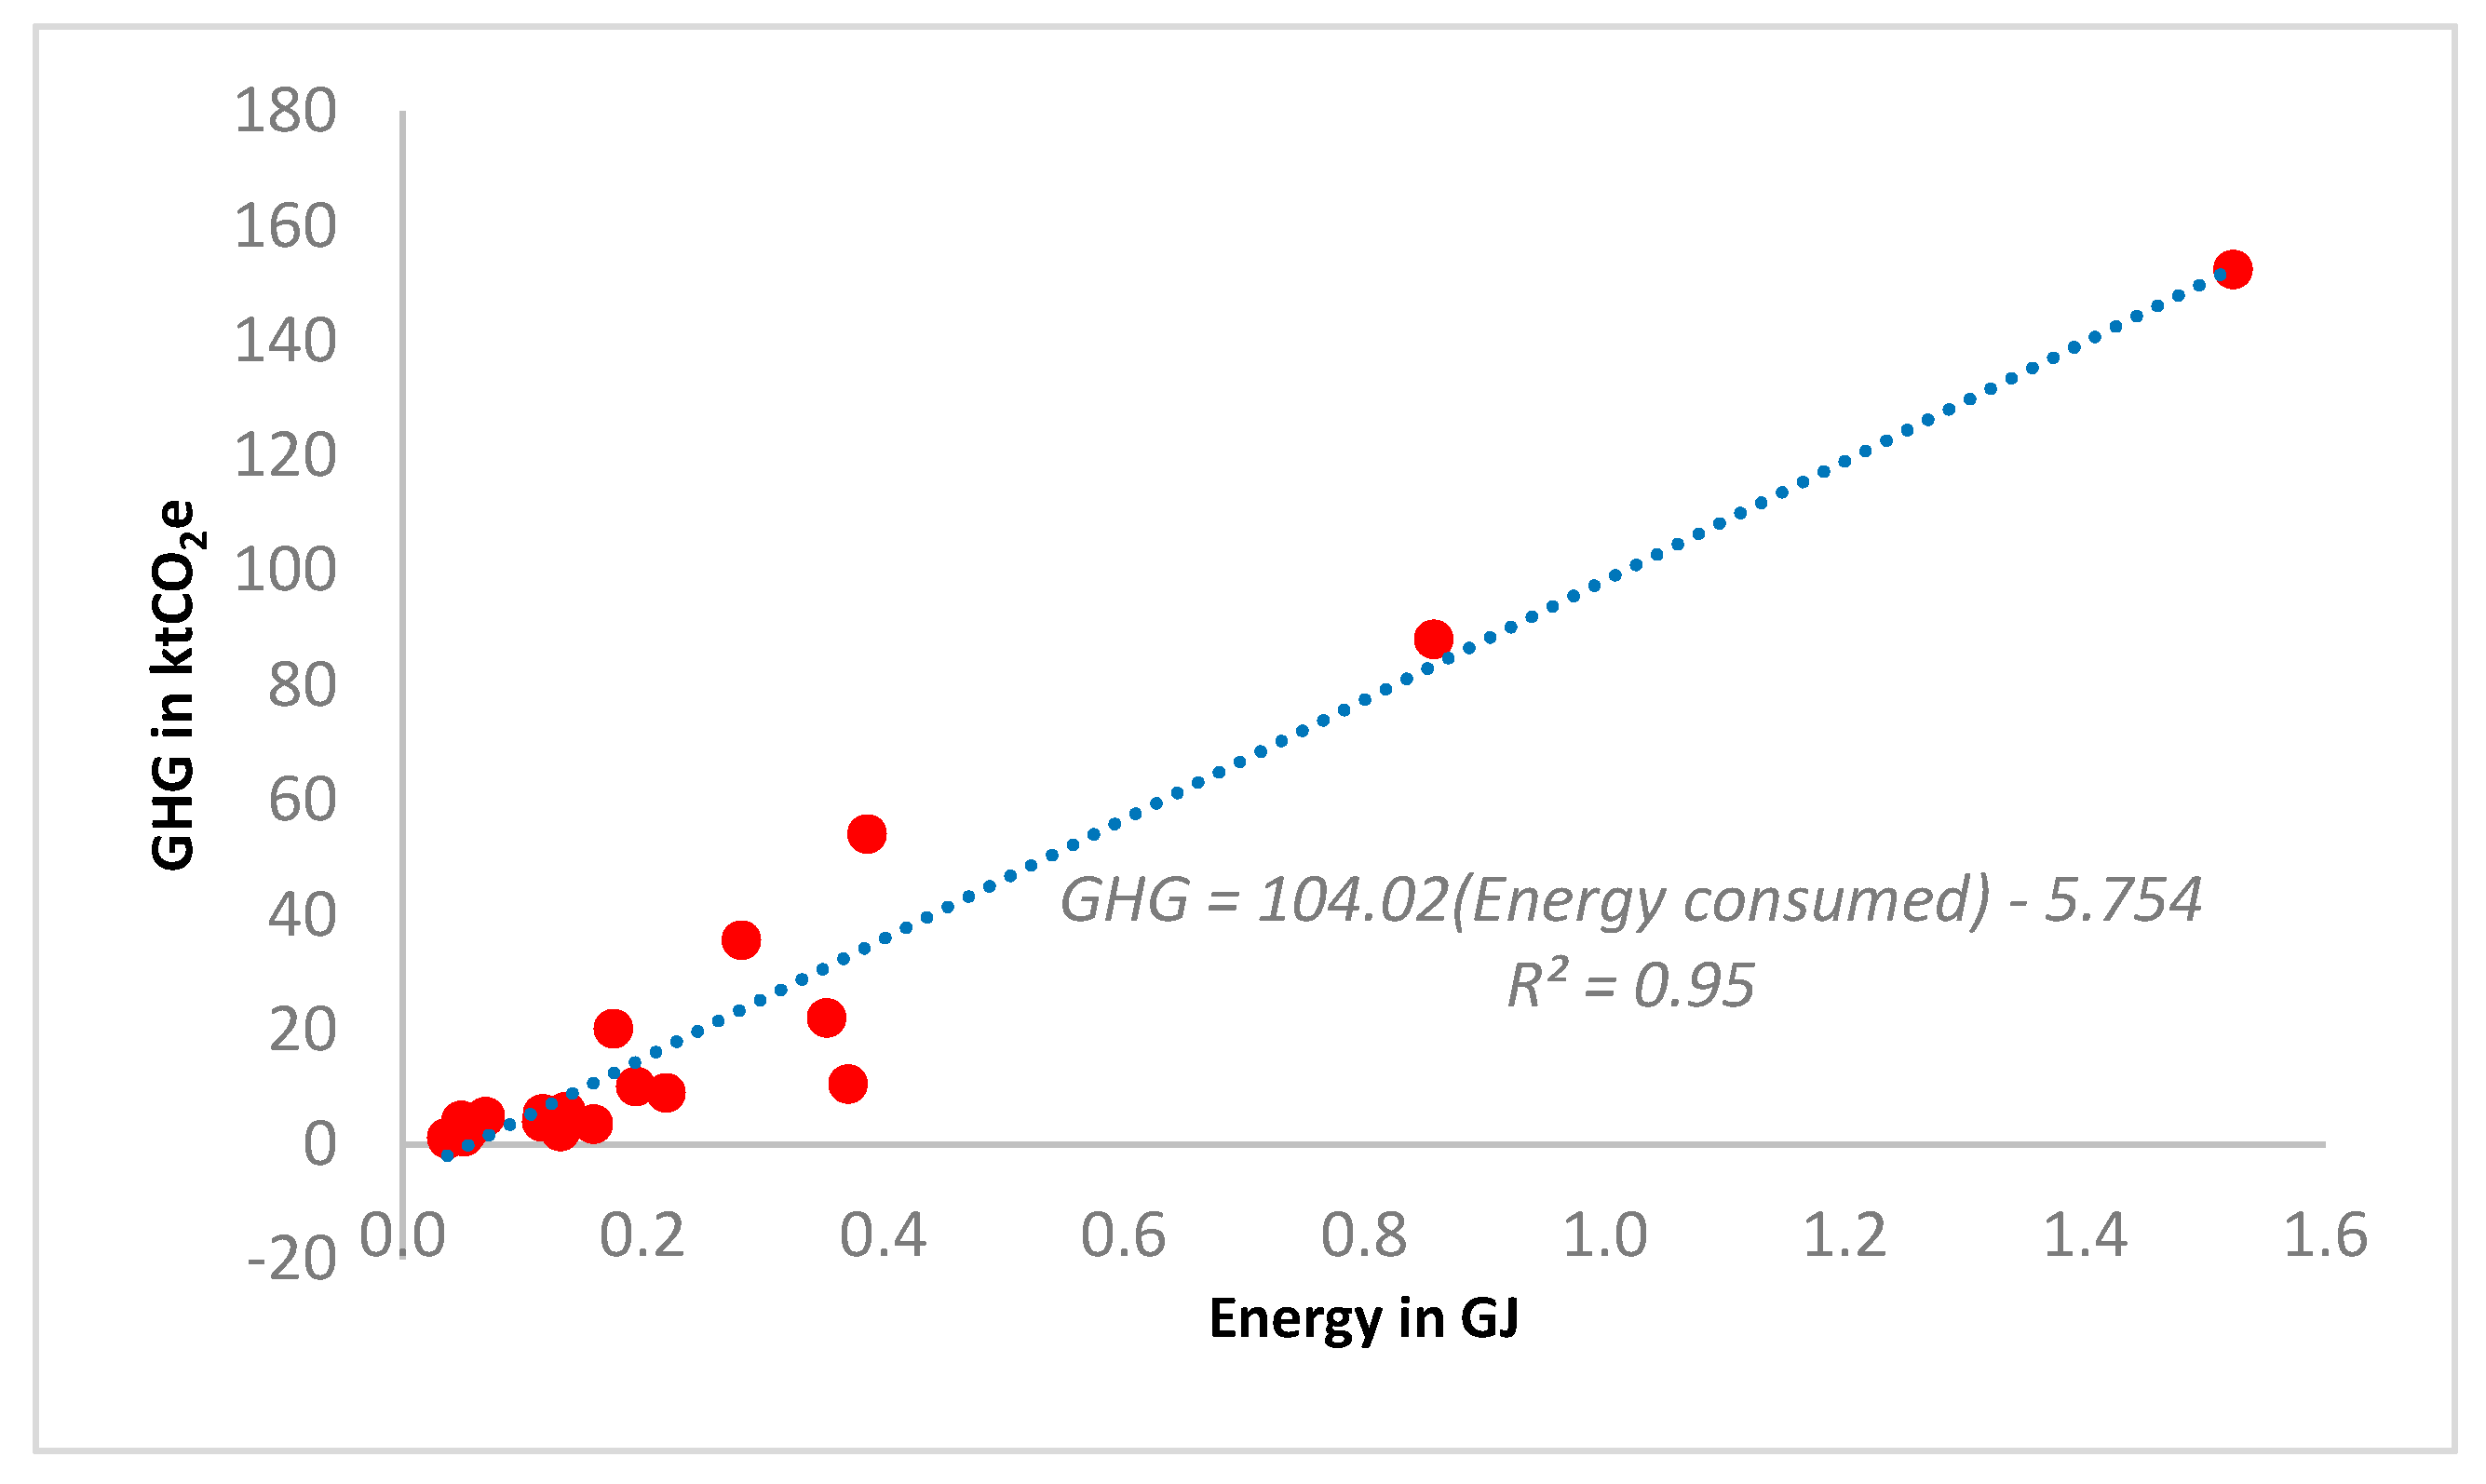
| 0.0019 | 1.309 | 0.8790 | 11.908 | 1.273 | 0.942 | 0.2234 | 1.396 | 0.797 |
© 2019 by the authors. Licensee MDPI, Basel, Switzerland. This article is an open access article distributed under the terms and conditions of the Creative Commons Attribution (CC BY) license (http://creativecommons.org/licenses/by/4.0/).
Share and Cite
Alghamdi, A.; Haider, H.; Hewage, K.; Sadiq, R. Inter-University Sustainability Benchmarking for Canadian Higher Education Institutions: Water, Energy, and Carbon Flows for Technical-Level Decision-Making. Sustainability 2019, 11, 2599. https://doi.org/10.3390/su11092599
Alghamdi A, Haider H, Hewage K, Sadiq R. Inter-University Sustainability Benchmarking for Canadian Higher Education Institutions: Water, Energy, and Carbon Flows for Technical-Level Decision-Making. Sustainability. 2019; 11(9):2599. https://doi.org/10.3390/su11092599
Chicago/Turabian StyleAlghamdi, Abdulaziz, Husnain Haider, Kasun Hewage, and Rehan Sadiq. 2019. "Inter-University Sustainability Benchmarking for Canadian Higher Education Institutions: Water, Energy, and Carbon Flows for Technical-Level Decision-Making" Sustainability 11, no. 9: 2599. https://doi.org/10.3390/su11092599
APA StyleAlghamdi, A., Haider, H., Hewage, K., & Sadiq, R. (2019). Inter-University Sustainability Benchmarking for Canadian Higher Education Institutions: Water, Energy, and Carbon Flows for Technical-Level Decision-Making. Sustainability, 11(9), 2599. https://doi.org/10.3390/su11092599