Article

Stability of Ecosystem CO2 Flux in Response to Changes in Precipitation in a Semiarid Grassland

1
College of Natural Resources and Environment, Northwest A & F University, Yangling 712100, China
2
State Key Laboratory of Soil Erosion and Dryland Farming in the Loess Plateau, Northwest A & F University, Yangling 712100, China
3
Institute of Soil and Water Conversation, Ministry of Water Resources and Chinese Academy of Sciences, Yangling 712100, China
*
Author to whom correspondence should be addressed.
Sustainability 2019, 11(9), 2597; https://doi.org/10.3390/su11092597
Submission received: 3 March 2019 / Revised: 9 April 2019 / Accepted: 25 April 2019 / Published: 6 May 2019

Abstract

:
Carbon dioxide (CO2) flux provides feedback between C cycling and the climatic system. There is considerable uncertainty regarding the direction and magnitude of the responses of this process to precipitation changes, hindering accurate prediction of C cycling in a changing world. We examined the responses of ecosystem CO2 flux to ambient precipitation and experimentally decreased (−35%) and increased precipitation (+20%) in a semiarid grassland in China between July 2013 and September 2015. The measured CO2 flux components included the gross ecosystem productivity (GEP), net ecosystem CO2 exchange (NEE), ecosystem respiration (Re), and soil respiration (Rs). The results showed that the seasonal and diurnal patterns of most components of ecosystem CO2 flux were minimally affected by precipitation treatments, with less than 4% changes averaged across the three growing seasons. GEP and NEE had a quadratic relationship, while Re and Rs increased exponentially with soil temperature. GEP, RE, and Rs, however, decreased with soil moisture. Decreased precipitation reduced the dependence of CO2 flux on soil temperature but partly increased the dependence on soil moisture; in contrast, increased precipitation had the opposite influence. Our results suggested a relatively stable CO2 flux in this semiarid grassland across the tested precipitation regimes.

1. Introduction

Semiarid grassland ecosystems are among the most vulnerable ecosystems and are highly susceptible to global climate change [1,2]. Semiarid grassland ecosystems are also increasingly important drivers of the inter-annual variability of the global carbon (C) cycle [3]. Precipitation and the availability of soil water are the major limiting factors in semiarid ecosystems [4]. Precipitation directly affects soil moisture, which plays a prominent role in terrestrial ecosystems by affecting plant productivity and soil processes [5,6]. In turn, soil moisture modulates the impacts of other drivers of global change, such as elevated atmospheric CO2 levels, temperature, and nitrogen deposition [7,8,9]. Therefore, the responses of ecosystem processes to variations in soil moisture have become a focus of current ecological and environmental research.
Photosynthesis and plant and soil respiration, which are the main components of the ecosystem CO2 flux, are the major processes determining the productivity and C cycling in terrestrial ecosystems. Although the responses of these processes to precipitation changes (both increasing and decreasing precipitation) have been studied in various ecosystems, considerable uncertainty remains regarding the direction and magnitude of the responses [3,4,10,11]. Studies in arid and semiarid regions, where precipitation is expected to decrease [12,13], are particularly lacking. Such uncertainties and lack of knowledge make it difficult to accurately predict the responses to future scenarios of precipitation change [14,15].
The CO2 flux at various levels (from leaf to ecosystem) may acclimate to changes in temperature [16,17,18], which is characterized by a downward or upward regulation in the shape of long- or short-term response functions of CO2 flux to temperature at different thermal environments [18]. Such shifts in the response function can modulate the feedback between C cycling in terrestrial and climate systems [18,19]. For example, shifts in the response function of plant respiration due to warming are predicted to have the potential to reduce the annual CO2 release by 35–80%, in comparison to a theoretical case without shifts in the response function [18,19]. However, the shift in the components of CO2 flux to soil moisture has rarely been examined. This information is urgently needed because such a shift in CO2 flux would have important implications for ecosystem C cycling, which would be potentially similar to acclimation to temperature on ecosystem C cycling. This effect is particularly important for ecosystems limited by water, as changes in precipitation regimes can affect C dynamics and fluxes and are expected to have significant feedback on the terrestrial C cycle [20].
We investigated the components of ecosystem CO2 flux (photosynthesis and plant and soil respiration) in plots with manipulated levels of precipitation in a Stipa capillata L. grassland in a semiarid region of the northwestern China. The S. capillata is a dominant native species adapted to the highly variable precipitation in this semiarid region [21,22]. We hypothesized that CO2 flux components in this S. capillata grassland would not vary widely across precipitation regimes (H1). We also hypothesized that increased precipitation would enhance the dependence of CO2 flux components (photosynthesis and respiration) on temperature, but decreased precipitation would weaken such dependence (H2) and that increased precipitation would weaken the dependence of CO2 flux components on soil moisture, but decreased precipitation would enhance the dependence on soil moisture (H3). Hypotheses H2 and H3 were generated because long-term changes in precipitation might significantly change soil temperature and moisture, which in turn would lead to the shifts in the response curves of CO2 flux components to the altered environment. The specific objectives of this study were to understand the following questions: (1) How does precipitation change influence components of ecosystem CO2 flux? (2) Is the dependence of CO2 flux components on soil temperature or moisture affected by precipitation? In our study, the precipitation treatments included ambient precipitation (AP), decreased precipitation (DP, 35% decreased), and increased precipitation (IP, 20% increased). Each CO2 flux component was measured during the growing seasons from 2013 to 2015. We analysed the changes in the response functions of each CO2 flux component to soil temperature or moisture to determine whether the dependence of these components on soil temperature or moisture shifted with precipitation manipulation.

2. Materials and Methods

2.1. Study Site and Experimental Design

This study was performed in the Yunwushan Natural Grassland Protection Zone (36°13′–36°19′ N, 106°24′–106°28′ E) near Guyuan City, Ningxia Hui Autonomous Region, China, in the centre of the Loess Plateau (Figure 1). The grassland protection zone was established in 1984, with an area of 4000 km2 and elevation ranging from 1800–2148 m a.s.l. The study area has a continental monsoon climate. The mean annual temperature is 6.9 °C, and the annual maximum and minimum temperatures occur in July (24 °C) and January (−14 °C), respectively. The mean annual precipitation is 448 mm (from 1957 to 2011). The growing season (May to September) precipitation accounts for 81% of the total annual precipitation. The soil in the study area is a mountain grey-cinnamon soil classified as a Calci-Orthic Aridisol according to the Chinese taxonomic system, which is equivalent to a Haplic Calcisol in the FAO/UNESCO system.
This experiment was established in an S. capillata grassland derived from farmland that was abandoned 30 years ago. The grassland has been protected from mowing and grazing by the Yunwushan Natural Grassland Management Bureau since the farmland was abandoned. In the experiment, a random block design was used with four replicates and 1.0–2.0 m between blocks. Each block contained three 4.0 m × 5.0 m plots randomly arranged with 1.0 m between plots. The three plots in each block received one of the following three precipitation treatments: ambient precipitation (AP), decreased precipitation (DP), or increased precipitation (IP). Soil properties were the same among the plots. A movable rainout shelter (6.0 m long × 5.0 m wide × 2.1 m high), consisting of a steel frame supporting a clear plastic roof, was installed in each block to intercept precipitation in the plots with decreased precipitation. The rainout shelters were manually moved to cover the DP plots before the rain, and they were removed after approximately one-third of the duration of the rain. The amount of precipitation excluded was calculated from the measurement of rainfall over time and recorded with an automatic rain gauge at the site every 10 min. Water, equivalent to approximately 20% of the precipitation event, was added manually and evenly to the IP plots immediately after the end of the rain over both plants and soil; thus, the rate of application was similar to the rate of infiltration into the soil. Snowfall, accounting for <5% of the total annual precipitation, was not manipulated in this experiment. The precipitation was manipulated from July 2013 to September 2015.

2.2. Measurement of Ecosystem CO2 Flux and Soil Temperature and Moisture

The seasonal pattern of ecosystem CO2 flux, including net ecosystem CO2 exchange (NEE), ecosystem respiration (Re), and soil respiration (Rs), was measured 2–8 times per month between 09:00 and 11:00 during the growing season (from July 2013 to September 2015) using a revised chamber system described by Chen et al. [23]. The diurnal pattern of CO2 flux (NEE, Re, and Rs) was measured between 07:00 and 18:00 on 17 August and 25 September 2013; 15 July, 14 August, and 29 September 2014; and 28 July and 15 August 2015. NEE and Re were measured by an infrared gas analyser (LI-840, LI-COR Inc., Lincoln, NE, USA) attached to a cubic transparent chamber (50 cm × 50 cm × 50 cm) placed over a square PVC base (50 cm × 50 cm and 10 cm in height) that was inserted 7 cm into the soil in each plot. Two small fans in the top of the chamber mixed the air during the measurement, and a temperature probe was inserted into the chamber to determine the air temperature. A pump (6262-04, LI-COR Inc.) transported air from the chamber to the LI-840 to measure the CO2 concentration. The chamber was lifted and vented after each NEE measurement. The chamber was then replaced on the base, covered by a lightproof cloth mantle, and the CO2 flux (Re) was measured. Rs was measured using the same infrared gas analyser attached to a cylindrical chamber (20 cm in diameter and 20 cm in height) placed over a PVC base (20 cm in diameter and 10 cm in height) and inserted 7 cm into the soil in each plot. The plant in the PVC base was removed by hand a week prior the start of the experiment to exclude the effects of plant respiration and photosynthesis on the Rs measurement. A small fan in the top of the chamber mixed the air during the measurement, and a temperature probe was inserted into the chamber to determine the air temperature. The same pump was used to pump air from the chamber to the LI-840 for measuring the CO2 concentration.
The data for measurements of NEE, Re, and Rs were logged into a computer using the LI-840 data-acquisition software. The CO2 concentrations inside the chamber were recorded every second for 2.5 min after the chamber was placed on the base. Our measurement showed that change in air temperature inside the chamber was less than 0.2 °C during the 2.5 min measurement, and thus the change in air temperature could be neglected. The attenuation of PAR by the chamber was less than 5%. There was no fog on the chamber during the measurement. Only data for the last 120 s were used to calculate NEE, Re, and Rs according to the following equation [23,24]:
F = V × P av × ( 1000 W av ) R × S × ( T av + 273 ) × dc dt
where F is the CO2 flux components (NEE, Re, or Rs, μmol m−2 s−1), V is the volume of the chamber (m3), Pav is the average pressure (kPa) during measurement, Wav is the average water vapor mole fraction (mmol mol−1) during measurement, R is the ideal gas constant (8.314 J mol−1 K−1), S is the surface area covered by the chamber (m2), Tav is the average temperature (°C) during measurement, and dc/dt is the slope of the fitted equation between CO2 and time.
The gross ecosystem productivity (GEP) was calculated as
GEP = NEE + Re
Soil temperature and volumetric moisture content at a depth of 0–10 cm were measured with time-domain transmission sensors (Acclima, Meridian, ID, USA) in each plot every 10 min during the experimental period with a Campbell Scientific CR1000 data logger (Campbell Scientific, Logan, UT, USA). The climatic data, including rainfall and air temperature, were recorded by a weather station at the study site. The monthly mean precipitation in each treatment and the air temperature during the experimental period are presented in Figure 2.

2.3. Data Analysis

A quadratic equation was used to fit the response function of GEP or NEE to soil temperature [25]:
F = a × T 2 + b × T + c
where F is GEP or NEE; T is soil temperature at a depth of 0–10 cm; and a, b, and c are parameters. The values of a and b indicate the quadratic and linear slopes of the response function.
The optimal temperature (T0) at which NEE and GPP were the smallest and greatest, respectively, was calculated from the parameters of the temperature–response curve Equation (3) as follows:
T 0 = b 2 a
An exponential equation was used to fit the response function of Re or Rs to soil temperature [17,18]:
F = a × e b × T
where F is Re or Rs, and a and b are the parameters. The value of b indicates the slope of the response function.
The temperature sensitivity (Q10) of the respiration rate (Re or Rs), a metric that describes the proportional increase in the respiration rate for a 10 °C increase in temperature, was calculated from the slope (b) of the temperature–response curve by Equation (5) as follows:
Q 10 = e 10 × b
A linear equation was used to fit the response function of CO2 flux component to soil moisture [26,27,28]:
F = a + b × M
where F is the CO2 flux, M is soil moisture at a depth of 0–10 cm, and a and b are parameters. The value of b indicates the slope of the response function.
A repeated measure of ANOVA was conducted to compare the CO2 flux components among the precipitation treatments, stages of the season (early, middle, or late), and interactions between the precipitation treatments and stages of the season through 2013 to 2015. Linear and nonlinear regression analyses were conducted to fit the equations. We tested normal distribution (Shapiro-Wilk test) and homogeneity of variances (Levene test) for each metric prior to statistical analysis. All data were analysed with JMP 10.0 (SAS Institute, Cary, NC, USA). In this study, although there are lots of scatters in soil moisture, nearly all the fittings of CO2 flux to soil moisture were significant at p < 0.05. Therefore, our fittings reflected the general response pattern of CO2 flux to soil moisture. However, we recommended that such measurements should be intensified to avoid scatters.

3. Results

3.1. Changes in Microclimate

When averaged across the experimental period (July 2013 to September 2015), the mean rainfall for AP, DP, and IP plots during the growing season were 291 mm, 191 mm, and 354 mm, respectively (Figure 2). The rainfall for AP, DP, and IP corresponded to 55%, 10% and 90%, respectively, of the percentile in the 1957–2011 growing season rainfall distribution, presenting a normal year, drier year, and wetter year, respectively. The precipitation treatments significantly changed soil temperatures during the growing season (p = 0.0091), with a 0.26 °C increase in DP and a 0.59 °C decrease in IP relative to AP (Figure 3). The averaged soil moisture was 21% higher in IP but 16% lower in DP (p < 0.0001) compared to AP (Figure 3).

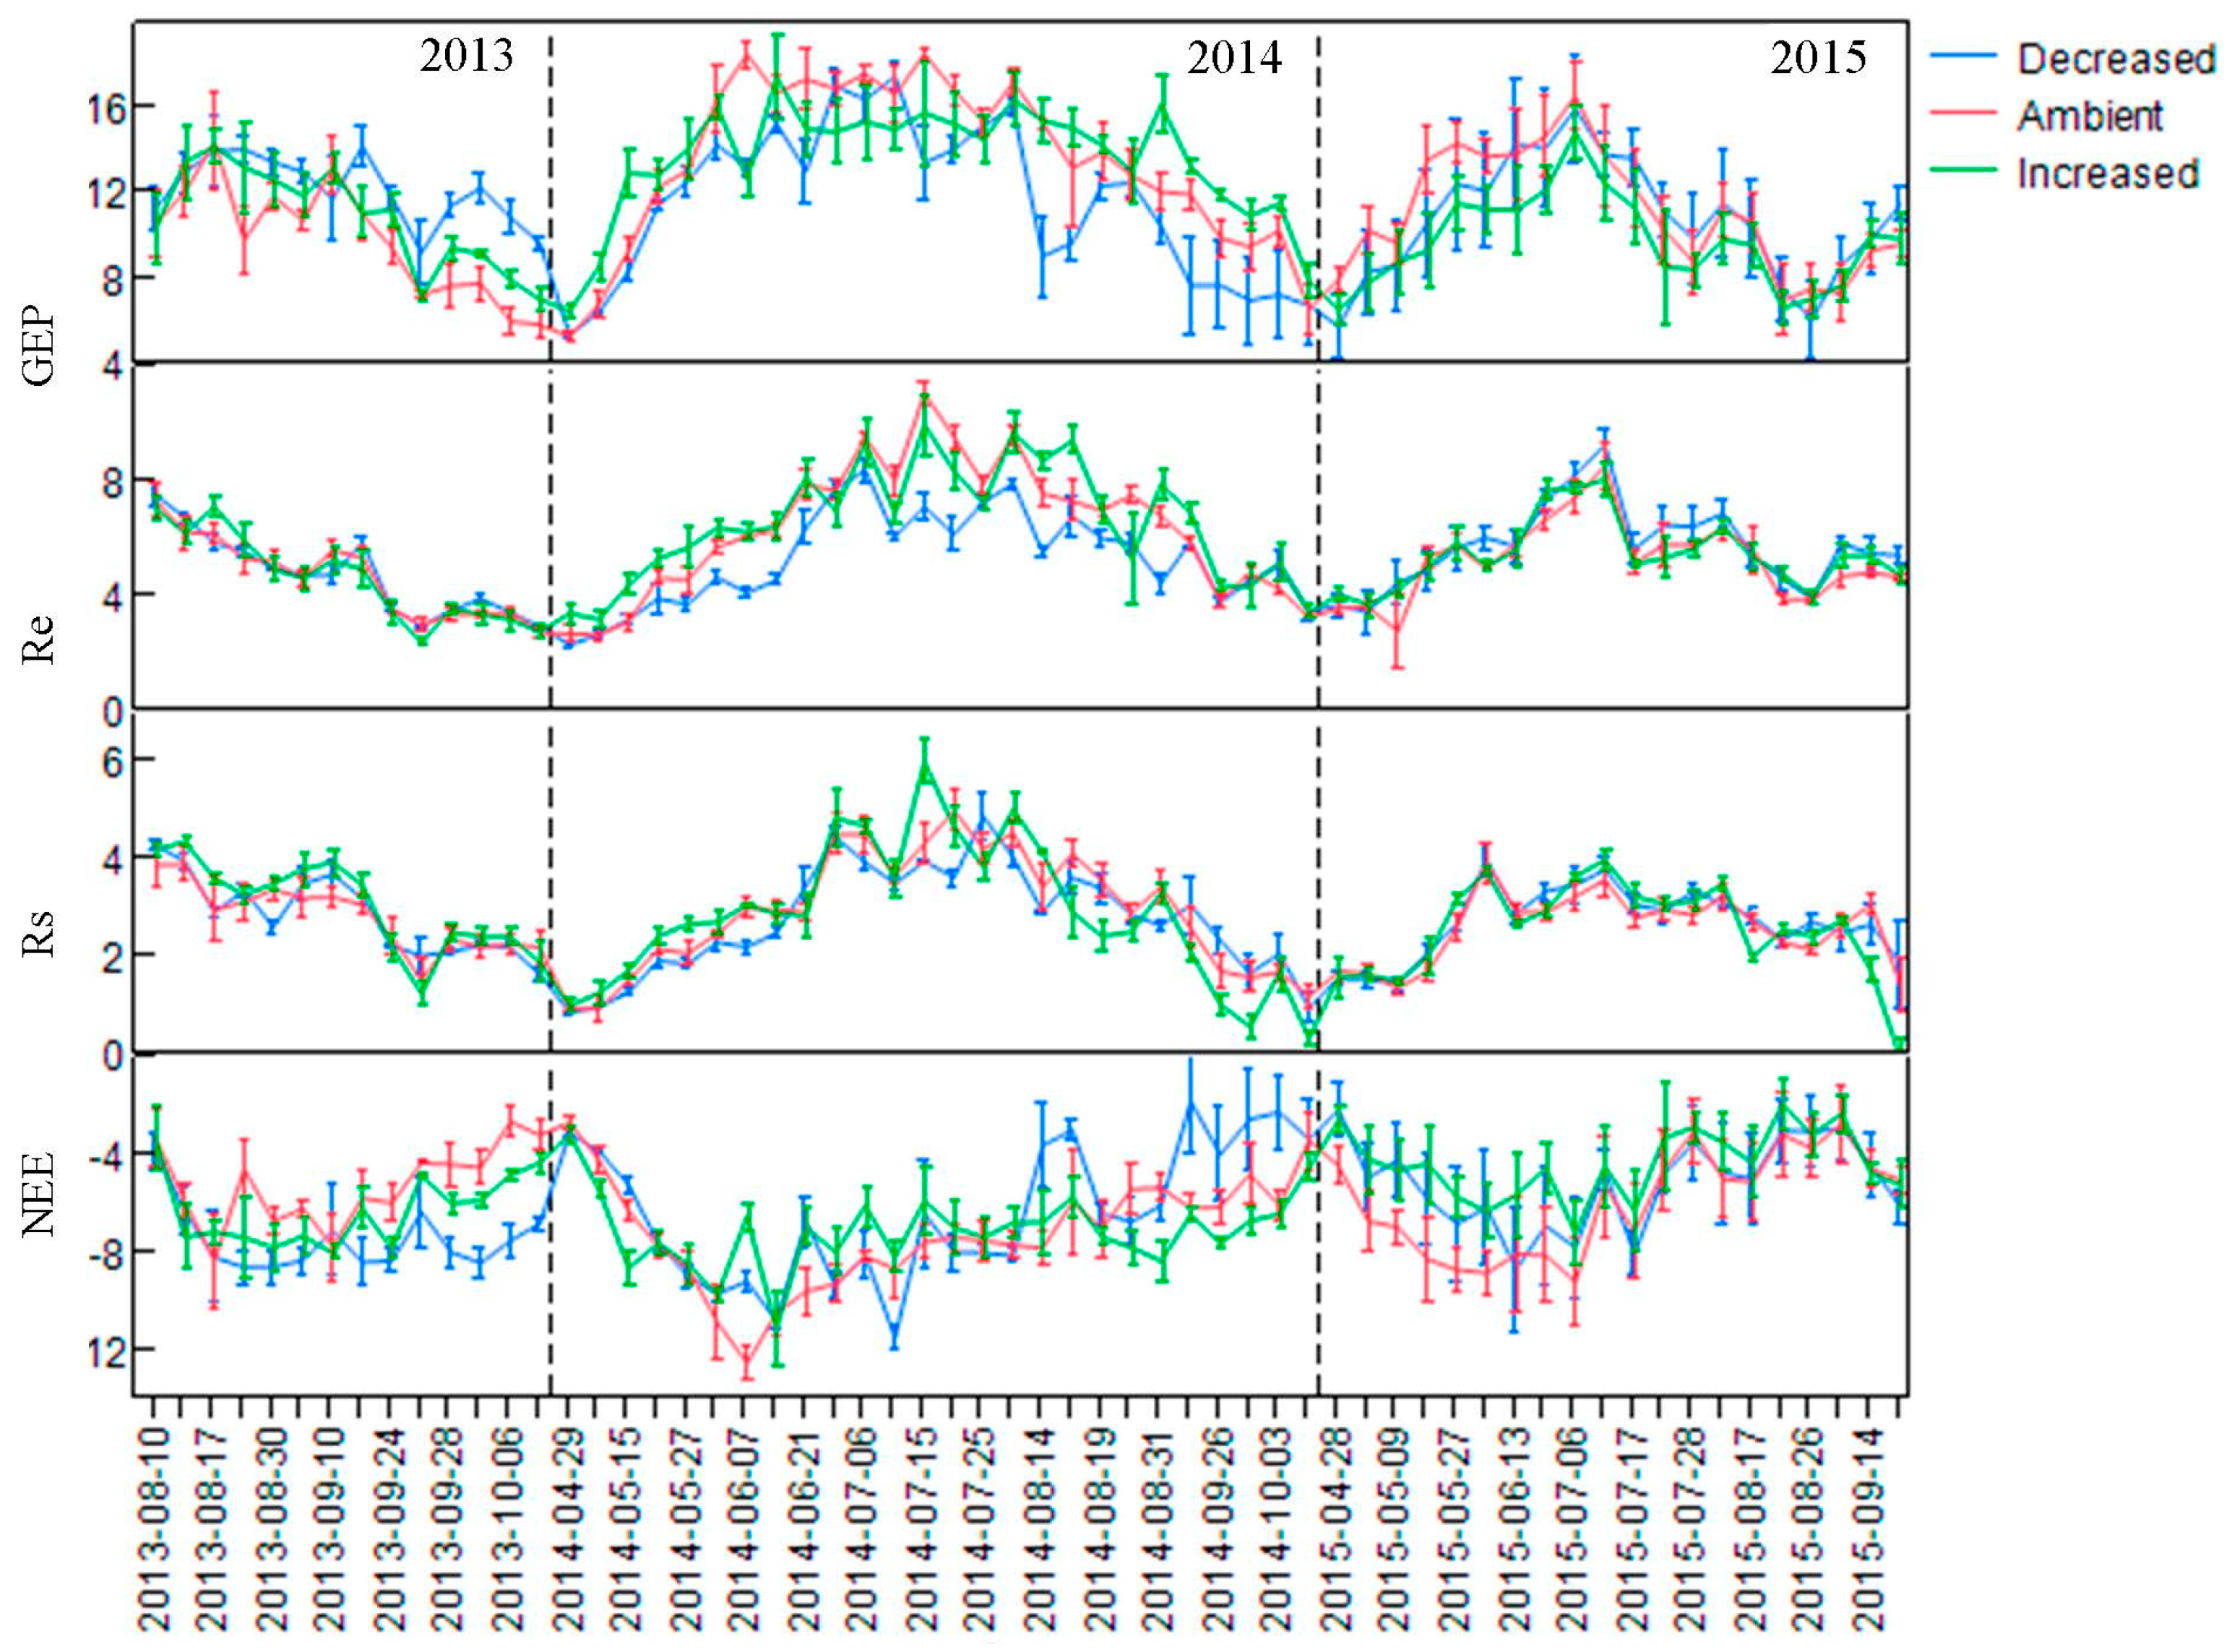
3.2. Seasonal and Diurnal Changes in Ecosystem CO2 Flux

The components of ecosystem CO2 flux varied significantly with the stage of the growing season. There were relatively higher GEP and respiration rates (Re and Rs) during the mid-season (July and August) but more negative NEE and, thus, a high rate of C sequestration in the early season (May and June) (Figure 4 and Figure 5, Table 1).
The precipitation treatment did not significantly affect the rate of most CO2 flux component across the three growing seasons, with less than 4% changes in these components compared with ambient treatment. When tested within each stage of the growing season, DP showed a trend to decrease GEP and Re in the early stage of the season. Furthermore, both DP and IP increased GEP in the late stage of the season (Figure 5). NEE decreased (less negative) in the early stage of the season (+15 and +19%) but increased (more negative) in the late stage of the season (−15 and −19%) in both precipitation treatments. The Rs was not affected at any stage of the season (Figure 5).
Degree of freedoms of the model, date, season, treatment, and interaction were 8, 1, 2, 2, and 4, respectively. Degree of error was 679.
Most diurnal patterns of CO2 flux components were unaffected by precipitation treatments (Figure 6). Among the seven measurements of diurnal patterns, NEE was unaffected, and only one measurement of GEP was affected (decreased by DP in August 2014). The Re was unaffected in five measurements but decreased by DP in two measurements (July and August 2014). The Rs was unaffected in 2013, 2015, and August 2014, increased by IP in July 2014 but decreased in September 2014.

3.3. Dependence of Ecosystem CO2 Flux Components on Soil Temperature and Moisture

The GEP and NEE had a quadratic relationship with soil temperature. The rate of respiration (Re and Rs) increased exponentially with soil temperature (Figure 7, Table 2). These components of ecosystem CO2 flux, however, decreased with soil moisture (Figure 7, Table 3). This was mainly due to decreased rates of these components in the late growing season when soil moisture was significantly higher, but the temperature was significantly lower than in the early and middle stages of the season (Figure 3). When averaged across each growing season, mean GEP and Re increased with precipitation during each season (Figure 8), indicating that CO2 flux was dependent on growing season precipitation in this semiarid grassland.
The dependence of GEP on soil moisture and temperature was affected by the precipitation treatments. The GEP decreased with soil moisture, and the absolute value of the slope for the decreasing function (parameter b) increased by 9% in DP but decreased by 15% in IP relative to AP (Table 3). The dependence of GEP on soil temperature (the value of parameter b for the quadratic function) decreased by 41.1% in DP (p < 0.05) but increased by 7.0% in IP (p > 0.05). The T0 of this quadratic function increased by 1.24 °C in DP but decreased by 0.95 °C in IP (Table 2).
In this study, NEE accounted for nearly 60% of GEP and was mainly determined by GEP (NEE = 1.662 − 0.666 × GEP, RMSE = 1.381, R2 = 0.777, p < 0.01). The effects of the precipitation treatments on dependence of NEE on soil temperature and moisture were similar to the effects on dependence of GEP. The DP decreased the slope for the NEE-temperature response function but increased the slope for the NEE-moisture response function; IP had the opposite effect on these dependencies (Table 2 and Table 3).
The response functions of respiration (Re and Rs) to soil moisture and temperature also varied with treatments. The DP generally decreased the dependence of respiration on soil moisture (absolute values of the slope for the response function) and soil temperature (slope for the response function and temperature sensitivity (Q10)) relative to AP, but IP increased these dependences (Table 2 and Table 3). The effects of DP were greater than those of IP, probably due to larger changes in precipitation in DP (−35%) than in IP (+20%). For example, the Q10s of Re and Rs decreased by 16.5 and 15.6% in DP but increased by 9.4 and 5.1% in IP, respectively (Table 2).

4. Discussion

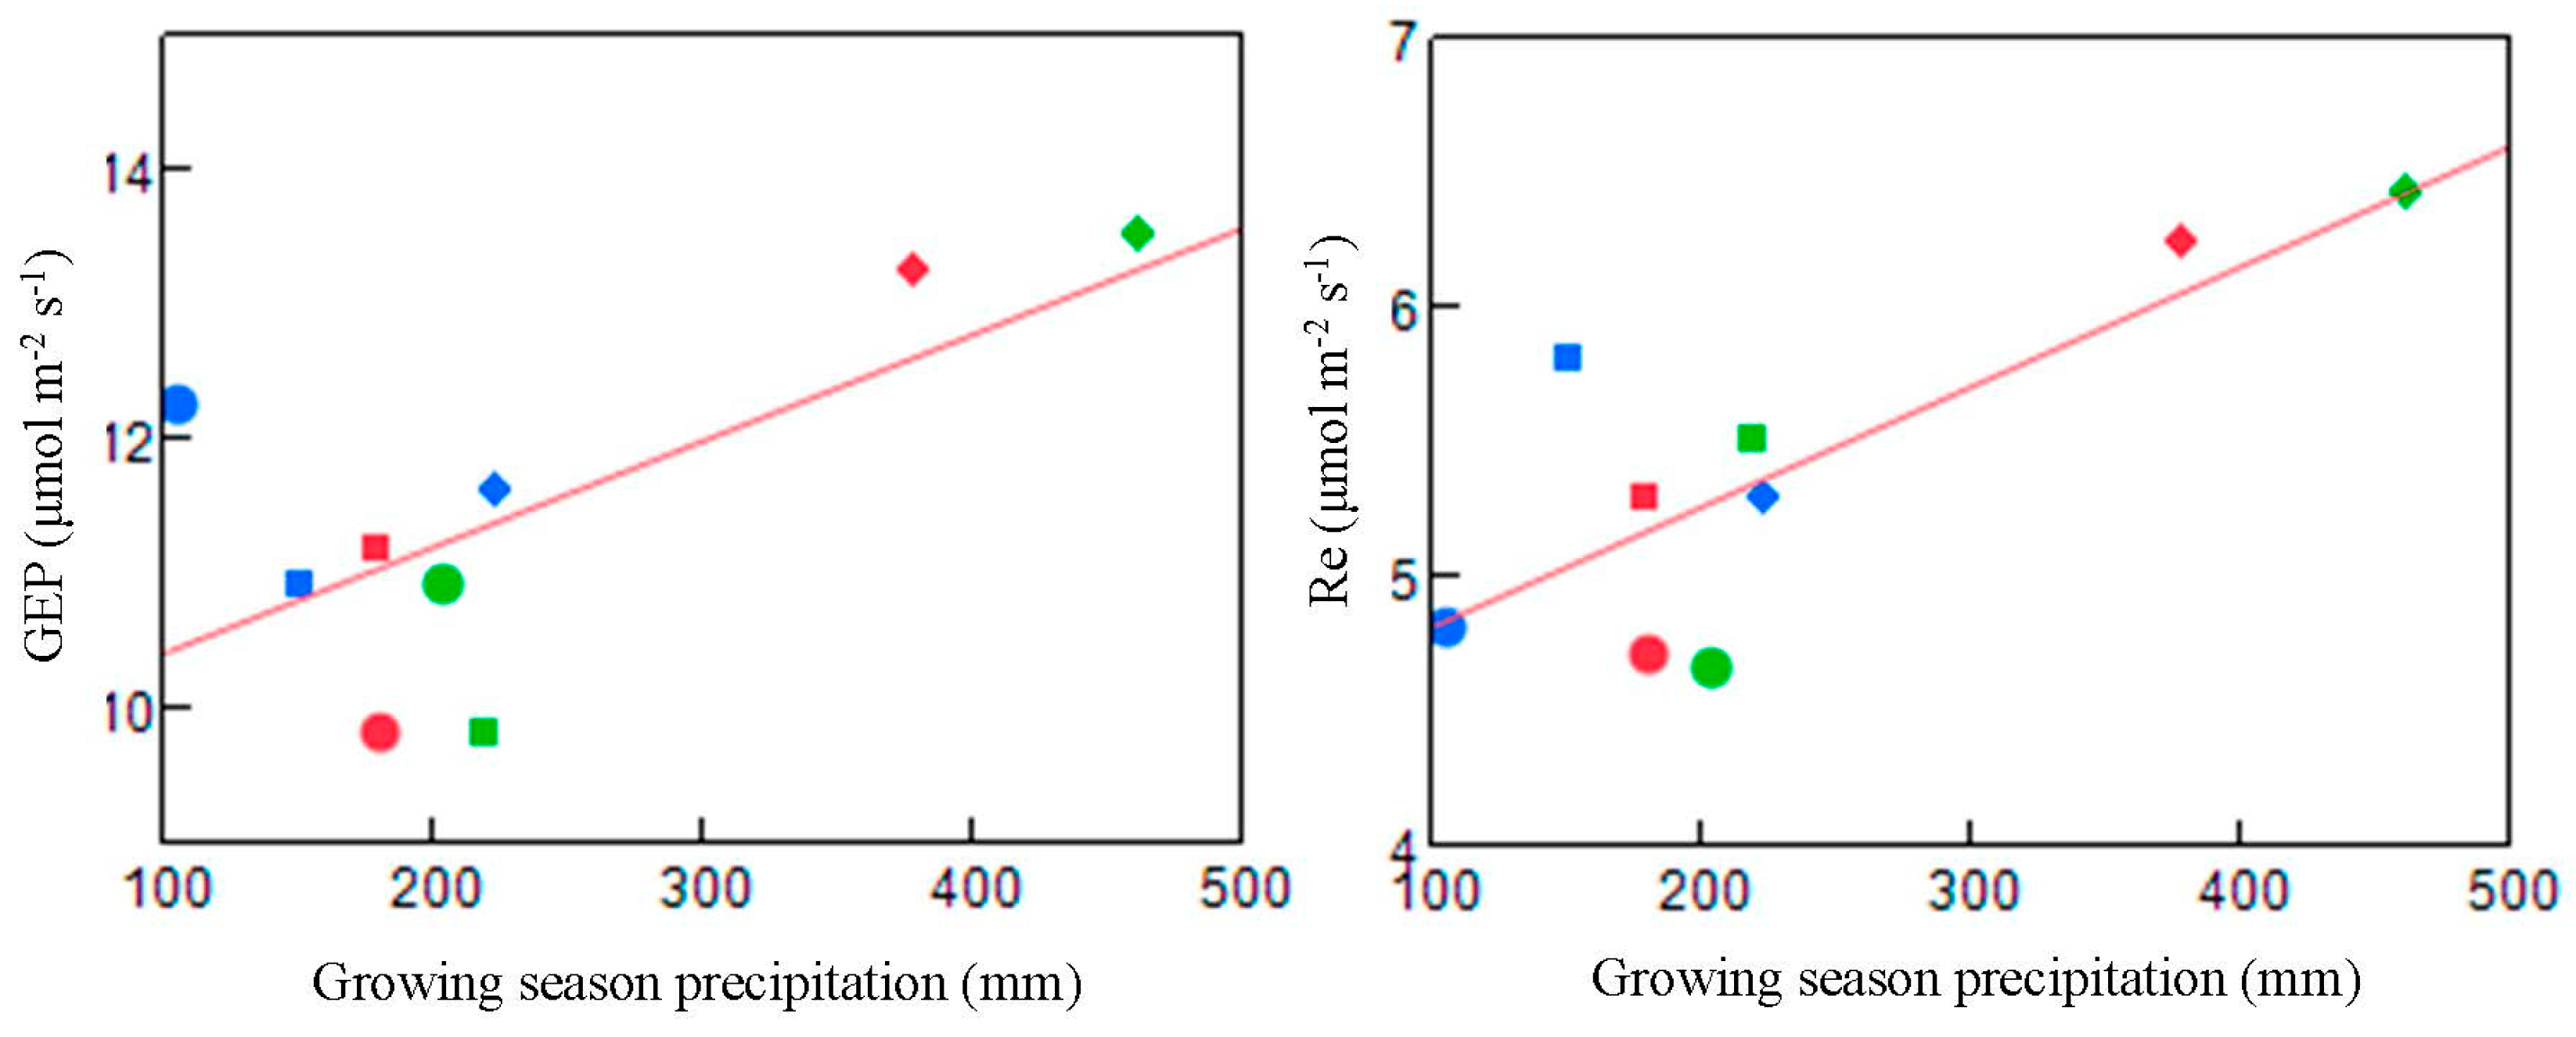
4.1. Response of CO2 Flux to the Precipitation Treatments

Our results showed a seasonal pattern of CO2 flux in this semiarid grassland (Figure 4 and Figure 5), which was mainly due to variations in plant growth throughout the growing season. A previous study at the same site showed that S. capillata is characterized by a higher growth rate early in the season and higher aboveground biomass accumulation at mid-season [29]. High growth rates often produce more negative NEEs and, thus, high rates of ecosystem C sequestration [30,31,32]. High above-ground biomass accumulation corresponds to a high GEP and, thus, high Re and Rs because respiration is driven by photosynthesis-provided substrate in most ecosystems [33,34]. In our study, Re and Rs were positively correlated with GEP (r = 0.683 and 0.419, respectively, p < 0.01). The growth and accumulation of biomass in the ecosystem was lowest in the late stage of the growing season, resulting in a lower rate of each CO2 flux component (Figure 4). Our results are consistent with the dependence of the seasonal pattern of CO2 flux on plant growth observed in various grasslands [30,35,36,37,38,39].
We demonstrated that the seasonal and diurnal patterns of most CO2 flux component were not affected by increased or decreased precipitation in this study (Figure 4 and Figure 5, Table 1). These results indicated that most components of CO2 flux were relatively stable in this semiarid grassland across the various precipitation scenarios, supporting our first hypothesis. The response of ecosystem CO2 flux to precipitation treatments was mainly manifested by changes in ecosystem productivity [40,41,42]. Ecosystem productivity generally increases with increasing precipitation [43,44,45] and decreases with decreasing precipitation [46,47]. In our study, however, above-ground biomass averaged across 2013 to 2015 was not affected by changes in precipitation, with mean aboveground biomass (post-experiment biomass) of 87.2, 88.0, and 88.9 g m−2 in AP, DP, and IP plots, respectively. The most direct effect of the precipitation treatments on plant growth was the changes in the availability of soil water to plants [44]. However, soil water availability to plants remained constant at levels of 40–80% field capacity in the same region as this study [48], corresponding to 10.4–20.8% volumetric soil moisture at the same site of this study [49]. Soil moisture in our study was within this range in the three precipitation treatments during the early and middle stages of the growing season (Figure 3), indicating that the treatments did not affect the availability of soil water to plants. Soil moisture in DP was sometimes less than this range and, thus, may have influenced the stomatal performance of the leaves [50,51]. Furthermore, the little response of available soil moisture further indicated that soil water recharge from non-growing season precipitation might be important for determining the main processes of this ecosystem. Soil temperature in DP, however, was relatively higher than in AP, which may have partly enhanced the photosynthetic rate in this temperature-limited ecosystem [25,52], thus, may have offset the decreases in CO2 flux due to stomatal limitation. A lack of an effect of precipitation treatments on GEP was expected because the adaptation of plants would decrease the response to environments [18,19,53]. This indicated that productivity in the semiarid grassland was relatively stable to variation in precipitation.
The Re and Rs were not affected by precipitation treatments, primarily due to the lack of response of GEP (−1% across three seasons), which drives ecosystem and soil respiration, as proposed by previous studies [33,34,54] and suggested by the linear relationship between the variables in our study (Re = 1.662 + 0.334 × GEP, R2 = 0.467, RMSE = 1.381, p < 0.0001; Rs = 1.381 + 0.121 × GEP, R2 = 0.175, RMSE = 1.016, p < 0.0001). Our results further showed significant changes in GEP and NEE in the early and late seasons and significant changes in Re in the early season with the precipitation treatments (Figure 5). This result indicated an asynchronous response of ecosystem respiration and assimilation to treatments, which is consistent with observations in Eucalyptus saligna [55] and in a Mediterranean species with different growth forms [56].
Alternatively, Rs may have acclimated to changes in soil temperature and moisture resulting from the treatments, which can decrease the sensitivity of soil CO2 flux to precipitation treatments (Figure 5). Soil temperature and moisture regulate the availability of substrates, the activities of roots and microbes, and thus soil respiration [27,57]. However, soil temperature and moisture respond sensitively to precipitation regimes (Figure 3), while long term changes in soil temperature or moisture would result in acclimation in Rs. Acclimation of Rs to temperature changes due to grassland management in the semiarid grassland of the Loess Plateau has been demonstrated [58], but acclimation to soil moisture changes needs further examination.
The response of NEE to precipitation treatments was determined by the trade-off between GEP and Re [52,59] and was dominated by GEP (60%) in our study. Across the three seasons, both precipitation treatments did not affect GEP and Re and, thus, did not affect NEE (Table 1). Furthermore, NEE and GEP had a similar response pattern to precipitation changes in the early and late season (Figure 5).

4.2. Dependence of CO2 Flux on Soil Temperature

Our results demonstrate that decreased precipitation reduced the dependence of CO2 flux components (GEP, Re, Rs, NEE) on temperature, while increased precipitation enhanced these dependencies (Table 2). The DP increased soil temperature by 0.26 °C and the range of soil temperature (difference between maximum and minimum values) by 1.35 °C during the growing season, which partly decreased the temperature limitation at the study site and thus weakened the dependencies of ecosystem processes on temperature. This occurred because the change in CO2 flux per degree change in temperature in an ecosystem unlimited by temperature would be less than in a low-temperature limited ecosystem. This result was consistent with other findings that increases in temperature weakened the temperature limitation in temperate ecosystems, or those at high latitude or altitude [60,61,62]. In our study, IP decreased the mean value and range of soil temperature by 0.59 and 1.23 °C, respectively, during the growing season. The IP also enhanced the temperature limitation and, thus, increased the dependence of CO2 flux on temperature. Our observation was consistent with results by Jia et al. [63] that water addition increased the temperature sensitivity of soil respiration in three of four communities in the semiarid region of northern China. It was also consistent with previous findings that there is lower temperature sensitivity of soil respiration during dry periods than during wet periods [28,54,64,65].
In this study, the influencing patterns of precipitation regimes on the dependence of each CO2 flux component on temperature further indicated an interaction between soil temperature and moisture on these components (Table 4. In other words, CO2 flux components depended more on temperature (higher slope for the response function) when soil moisture was higher (in IP treatment) but less on temperature (lower slope for the response function) when soil moisture was lower (in DP treatment), compared with AP treatment (Table 2). This interaction could be due to the co-limitation of temperature and moisture in the ecosystem.

4.3. Dependence of CO2 Flux on Soil Moisture

The rate of each CO2 flux component was expected to increase with soil moisture in semiarid regions [1,41], but our results demonstrated decreased CO2 flux with soil moisture (Table 3). This decreased CO2 flux was mainly due to the asynchrony between soil moisture and plant growth or soil temperature during the growing season (Figure 3). Plants grew quickly in the early and middle stages of the season [29], and they had relatively high rates of assimilation and respiration, and more negative NEE (Figure 4 and Figure 5). The air and soil temperatures were both higher, but soil moisture was lower at these stages, compared with the late stage of the growing season (Figure 3). In contrast, the plants stopped growing later in the season with lower (or less negative) GEP, NEE, and Re (Figure 4 and Figure 5). The air and soil temperatures were lower, but soil moisture was higher at this stage (Figure 3). This asynchronous pattern between plant growth and soil moisture during the growing season results in a declining trend of CO2 flux with soil moisture (Figure 7, Table 3). These results indicate that the ecosystem in the study region was more limited by soil moisture during the early and middle stages of the growing season but was more limited by temperature in the late stage of the season. This asynchrony was consistent with findings by Wan et al. [66] in a grassland in Tennessee and implied that the dependence of CO2 flux on soil moisture was modulated by this asynchrony.
The precipitation treatments significantly changed the dependence of CO2 flux on soil moisture. The DP resulted in 16% decrease in soil moisture, strengthening the limitation of soil moisture. In contrast, IP resulted in a 21% increase in soil moisture, which weakened the limitation of soil moisture and, thus, the dependence of GEP on soil moisture (Table 3). The dependence of respiration (Re and Rs) on soil moisture, however, decreased in DP (Table 3), which was consistent with results from a study in a piñon-juniper woodland [67]. The opposite influencing patterns of precipitation treatments on the dependence of GEP and Re to soil moisture may be due to differences in the mechanism between GEP and respiration in response to soil moisture conditions. Precipitation can directly affect GEP by changing stomatal performance, which is directly modulated by soil moisture [50,51]. On the other hand, respiration response is mainly determined by the availability of substrates, which is indirectly affected by soil moisture. In comparison to wet conditions, drought affects the allocation of assimilates in the plant-soil system by transferring a larger proportion of assimilates to the roots [68] and increasing microbial biomass and enzymatic activities in the rhizosphere [69]. Therefore, it has a contrasting effect on soil respiration, in comparison to effects on GEP.
Since long-term changes in precipitation might significantly change soil temperature and moisture (Figure 3), which determine ecosystem CO2 flux, we hypothesized that increased precipitation would enhance the dependence of CO2 flux components on temperature but weaken the dependence on soil moisture, while decreased precipitation would have opposite effects on such dependencies. The changes in the dependence of GEP, Re, and Rs on temperature (Table 2), and the changes in the dependence of GEP and NEE on soil moisture (Table 3), supported these hypotheses. These results indicated shifts in the response functions of CO2 flux to soil temperature or moisture resulting from precipitation treatments, which is consistent with the acclimation of foliar gas exchange to different precipitation regimes in a piñon-juniper woodland [67]. Such shifts in the response functions could be a mechanism underlying the relatively stable ecosystem CO2 flux in this semiarid grassland and should be incorporated in current models that do not consider such shifts in the response functions to better predict ecosystem processes at various precipitation change scenarios.

5. Conclusions

Precipitation change is one of the most important global change factors. It is often interrelated with other factors (e.g., global warming and CO2 elevation) in influencing ecosystem processes and leads to feedback between C cycling and climate systems [7,8,9]. Moreover, the effects of precipitation change on C cycling are particularly important in water-limited ecosystems [11,70]. Our results show relatively stable ecosystem CO2 flux in a semiarid grassland over three years across various precipitation scenarios, implying that the dominant native species is adapted to the highly variable precipitation in this semiarid region. The response function of CO2 flux to temperature and/or moisture changes was the basis for predicting C cycling [71,72]. However, we demonstrated the shifts in these response functions with precipitation treatments, which were rarely considered previously. We recommend that these shifts should be considered or incorporated into current models for predicting ecosystem processes at various precipitation change scenarios. Our field results suggest that CO2 flux in semiarid grasslands may be less affected by precipitation changes. Such a response would weaken the feedback between C cycling and the climate system and simplify future modelling in semiarid environments.

Author Contributions

Conceptualization, L.Q. and X.W.; Methodology, X.W., Y.Z., J.L. and H.G.; Investigation, K.B., H.T., M.S., Y.Z., J.L. and H.G.; Writing—Original Draft, K.B., L.Q. and J.C.

Funding

This study was supported by the National Key Research and Development Program (No. 2016YFC0500704), the National Natural Science Foundation of China (41471244, 41622105 and 41571130082), the Youth Innovation Team of Shaanxi Universities, the Programs from Chinese Academy of Sciences (QYZDB-SSW-DQC039) and the Northwest A&F University (2452017028).

Conflicts of Interest

The authors declare no conflict of interest.

References

  1. Carbone, M.S.; Still, C.J.; Ambrose, A.R.; Dawson, T.E.; Williams, A.P.; Boot, C.M.; Schaeffer, S.M.; Schimel, J.P. Seasonal and episodic moisture controls on plant and microbial contributions to soil respiration. Oecologia 2011, 167, 265–278. [Google Scholar] [CrossRef]
  2. Morgan, J.A.; LeCain, D.R.; Pendall, E.; Blumenthal, D.M.; Kimball, B.A.; Carrilli, Y.; Williams, D.G.; Heisler-White, J.; Dijkstra, F.A.; West, M. C4 grasses prosper as carbon dioxide eliminates desiccation in warmed semi-arid grassland. Nature 2011, 476, 202–205. [Google Scholar] [CrossRef]
  3. Poulter, B.; Frank, D.; Ciais, P.; Myneni, R.B.; Andela, N.; Bi, J.; Broquet, G.; Canadell, J.G.; Chevallier, F.; Liu, Y.Y.; et al. Contribution of semi-arid ecosystems to interannual variability of the global carbon cycle. Nature 2014, 509, 600–603. [Google Scholar] [CrossRef]
  4. Austin, A.T.; Yahdjian, L.; Stark, J.M.; Belnap, J.; Porporato, A.; Norton, U.; Ravetta, D.A.; Schaeffer, S.M. Water pulses and biogeochemical cycles in arid and semiarid ecosystems. Oecologia 2004, 141, 221–235. [Google Scholar] [CrossRef] [PubMed]
  5. Ehrenfeld, J.G.; Ravit, B.; Elgersma, K. Feedback in the plant-soil system. Annu. Rev. Environ. Resour. 2005, 30, 75–115. [Google Scholar] [CrossRef]
  6. Rodríguez-Iturbe, I.; Porporato, A. Ecohydrology of Water-Controlled Ecosystems: Soil Moisture and Plant Dynamics; Cambridge University Press: Cambridge, UK, 2005. [Google Scholar]
  7. Dai, A. Increasing drought under global warming in observations and models. Nat. Clim. Chang. 2013, 3, 52–58. [Google Scholar] [CrossRef]
  8. Hovenden, M.J.; Newton, P.C.; Wills, K.E. Seasonal not annual rainfall determines grassland biomass response to carbon dioxide. Nature 2014, 511, 583–586. [Google Scholar] [CrossRef]
  9. Reich, P.B.; Hobbie, S.E.; Lee, T.D. Plant growth enhancement by elevated CO2 eliminated by joint water and nitrogen limitation. Nat. Geosci. 2014, 7, 920–924. [Google Scholar] [CrossRef]
  10. Knapp, A.K.; Fay, P.A.; Blair, J.M.; Collins, S.L.; Smith, M.D.; Carlisle, J.D.; Harper, C.W.; Danner, B.T.; Lett, M.S.; McCarron, J.K. Rainfall variability, carbon cycling, and plant species diversity in a mesic grassland. Science 2002, 298, 2202–2205. [Google Scholar] [CrossRef]
  11. Doughty, C.E.; Metcalfe, D.; Girardin, C.; Amézquita, F.F.; Cabrera, D.G.; Huasco, W.H.; Silva-Espejo, J.E.; Araujo-Murakami, A.; da Costa, M.C.; Rocha, W.; et al. Drought impact on forest carbon dynamics and fluxes in Amazonia. Nature 2015, 519, 78–82. [Google Scholar] [CrossRef] [Green Version]
  12. Lázaro, R.; Rodrigo, F.; Gutiérrez, L.; Domingo, F.; Puigdefábregas, J. Analysis of a 30-year rainfall record (1967–1997) in semi–arid SE Spain for implications on vegetation. J. Arid Environ. 2001, 48, 373–395. [Google Scholar] [CrossRef]
  13. Modarres, R.; da Silva, V.d.P.R. Rainfall trends in arid and semi-arid regions of Iran. J. Arid Environ. 2007, 70, 344–355. [Google Scholar] [CrossRef]
  14. Lauenroth, W.K.; Sala, O.E. Long-term forage production of North American shortgrass steppe. Ecol. Appl. 1992, 2, 397–403. [Google Scholar] [CrossRef] [PubMed]
  15. Sala, O.E.; Gherardi, L.A.; Reichmann, L.; Jobbagy, E.; Peters, D. Legacies of precipitation fluctuations on primary production: Theory and data synthesis. Philos. Trans. R. Soc. B 2012, 367, 3135–3144. [Google Scholar] [CrossRef]
  16. Oechel, W.C.; Vourlitis, G.L.; Hastings, S.J.; Zulueta, R.C.; Hinzman, L.; Kane, D. Acclimation of ecosystem CO2 exchange in the Alaskan Arctic in response to decadal climate warming. Nature 2000, 406, 978–981. [Google Scholar] [CrossRef] [PubMed]
  17. Luo, Y.; Wan, S.; Hui, D.; Wallace, L.L. Acclimatization of soil respiration to warming in a tall grass prairie. Nature 2001, 413, 622–625. [Google Scholar] [CrossRef] [PubMed]
  18. Reich, P.B.; Sendall, K.M.; Stefanski, A.; Wei, X.; Rich, R.L.; Montgomery, R.A. Boreal and temperate trees show strong acclimation of respiration to warming. Nature 2016, 531, 633–636. [Google Scholar] [CrossRef]
  19. Atkin, O.K.; Tjoelker, M.G. Thermal acclimation and the dynamic response of plant respiration to temperature. Trends Plant Sci. 2003, 8, 343–351. [Google Scholar] [CrossRef]
  20. Shen, W.; Reynolds, J.F.; Hui, D. Responses of dryland soil respiration and soil carbon pool size to abrupt vs. gradual and individual vs. combined changes in soil temperature, precipitation, and atmospheric [CO2]: A simulation analysis. Glob. Chang. Biol. 2009, 15, 2274–2294. [Google Scholar] [CrossRef]
  21. Akiyama, T.; Kawamura, K. Grassland degradation in China: Methods of monitoring, management and restoration. Grassl. Sci. 2007, 53, 1–17. [Google Scholar] [CrossRef]
  22. Li, X.; Fang, X.; Wu, F.; Miao, Y. Pollen evidence from Baode of the northern Loess Plateau of China and strong East Asian summer monsoons during the Early Pliocene. Chin. Sci. Bull. 2011, 56, 64–69. [Google Scholar] [CrossRef] [Green Version]
  23. Chen, S.; Lin, G.; Huang, J.; Jenerette, G.D. Dependence of carbon sequestration on the differential responses of ecosystem photosynthesis and respiration to rain pulses in a semiarid steppe. Glob. Chang. Biol. 2009, 15, 2450–2461. [Google Scholar] [CrossRef]
  24. Jasoni, R.L.; Smith, S.D.; Arnone, J.A. Net ecosystem CO2 exchange in Mojave Desert shrublands during the eighth year of exposure to elevated CO2. Glob. Chang. Biol. 2005, 11, 749–756. [Google Scholar] [CrossRef]
  25. Sendall, K.M.; Reich, P.B.; Zhao, C.; Hou, J.; Wei, X.; Stefanski, A.; Rice, K.; Rich, R.L.; Montgomery, R.A. Acclimation of photosynthetic temperature optima of temperate and boreal tree species in response to experimental forest warming. Glob. Chang. Biol. 2015, 21, 1342–1357. [Google Scholar] [CrossRef] [PubMed]
  26. Inglima, I.; Alberti, A.; Bertolini, T.; Vaccari, F.P.; Giolo, B.; Miglietta, F.; Cotrufo, M.F.; Peressotti, A. Precipitation pulses enhance respiration of Mediterranean ecosystems: The balance between organic and inorganic components of increased soil CO2 efflux. Glob. Chang. Biol. 2009, 15, 1289–1301. [Google Scholar] [CrossRef]
  27. Qi, Y.; Xu, M. Separating the effects of moisture and temperature on soil CO2 efflux in a coniferous forest in the Sierra Nevada mountains. Plant Soil 2001, 237, 15–23. [Google Scholar] [CrossRef]
  28. Yuste, J.C.; Janssens, I.; Carrara, A.; Meiresonne, L.; Ceulemans, R. Interactive effects of temperature and precipitation on soil respiration in a temperate maritime pine forest. Tree Physiol. 2003, 23, 1263–1270. [Google Scholar] [CrossRef] [Green Version]
  29. Wang, L.; Cheng, J.; Wan, H.; Zhou, M.; Zhao, L.; Li, W.; Shi, H. The plant growth patterns in the natural grassland of Yunwu Mountain. Acta Ecol. Sin. 2008, 28, 3168–3175. [Google Scholar] [CrossRef]
  30. Flanagan, L.B.; Wever, L.A.; Carlson, P.J. Seasonal and interannual variation in carbon dioxide exchange and carbon balance in a northern temperate grassland. Glob. Chang. Biol. 2002, 8, 599–615. [Google Scholar] [CrossRef]
  31. Huxman, T.E.; Cable, J.M.; Ignace, D.D.; Eilts, J.A.; English, N.B.; Weltzin, J.; Williams, D.G. Response of net ecosystem gas exchange to a simulated precipitation pulse in a semi-arid grassland: The role of native versus non-native grasses and soil texture. Oecologia 2004, 141, 295–305. [Google Scholar] [CrossRef] [PubMed]
  32. Verburg, P.S.; Arnone, J.A., III; Obrist, D.; Schorran, D.E.; Evans, R.D.; Leroux-swarthout, D.; Johnson, D.W.; Luo, Y.; Coleman, J.S. Net ecosystem carbon exchange in two experimental grassland ecosystems. Glob. Chang. Biol. 2004, 10, 498–508. [Google Scholar] [CrossRef]
  33. Högberg, P.; Nordgren, A.; Buchmann, N.; Taylor, A.F.S.; Ekblad, A.; Högberg, M.N.; Nyberg, G.; Ottosson-Löfvenius, M.; Read, D.J. Large-scale forest girdling shows that current photosynthesis drives soil respiration. Nature 2001, 411, 789–792. [Google Scholar] [CrossRef]
  34. Tang, J.; Baldocchi, D.D.; Xu, L. Tree photosynthesis modulates soil respiration on a diurnal time scale. Glob. Chang. Biol. 2005, 11, 1298–1304. [Google Scholar] [CrossRef]
  35. Suyker, A.E.; Verma, S.B. Year-round observations of the net ecosystem exchange of carbon dioxide in a native tallgrass prairie. Glob. Chang. Biol. 2001, 7, 279–289. [Google Scholar] [CrossRef]
  36. Xu, L.; Baldocchi, D.D. Seasonal variation in carbon dioxide exchange over a Mediterranean annual grassland in California. Agric. Forest Meteorol. 2004, 123, 79–96. [Google Scholar] [CrossRef] [Green Version]
  37. Hastings, S.J.; Oechel, W.C.; Muhlia-Melo, A. Diurnal, seasonal and annual variation in the net ecosystem CO2 exchange of a desert shrub community (Sarcocaulescent) in Baja California, Mexico. Glob. Chang. Biol. 2005, 11, 927–939. [Google Scholar] [CrossRef]
  38. Wohlfahrt, G.; Hammerle, A.; Haslwanter, A.; Bahn, M.; Tappeiner, U.; Cernusca, A. Seasonal and inter-annual variability of the net ecosystem CO2 exchange of a temperate mountain grassland: Effects of weather and management. J. Geophys. Res. Atmos. 2008, 113. [Google Scholar] [CrossRef]
  39. Scott, R.L.; Jenerette, G.D.; Potts, D.L.; Huxman, T.E. Effects of seasonal drought on net carbon dioxide exchange from a woody-plant-encroached semiarid grassland. J. Geophys. Res. Biogeosci. 2009, 114. [Google Scholar] [CrossRef] [Green Version]
  40. Knapp, A.K.; Smith, M.D. Variation among biomes in temporal dynamics of aboveground primary production. Science 2001, 291, 481–484. [Google Scholar] [CrossRef] [PubMed]
  41. Huxman, T.E.; Snyder, K.A.; Tissue, D.; Leffler, A.J.; Ogle, K.; Pockman, W.T.; Sandquist, D.R.; Potts, D.L.; Schwinning, S. Precipitation pulses and carbon fluxes in semiarid and arid ecosystems. Oecologia 2004, 141, 254–268. [Google Scholar] [CrossRef] [PubMed]
  42. Beer, C.; Reichstein, M.; Tomelleri, E.; Ciais, P.; Jung, M.; Carvalhais, N.; Rödenbeck, C.; Altaf Arain, M.; Baldocchi, D.; Bonan, G.B.; et al. Terrestrial gross carbon dioxide uptake: Global distribution and covariation with climate. Science 2010, 329, 834–838. [Google Scholar] [CrossRef]
  43. Heisler-White, J.L.; Knapp, A.K.; Kelly, E.F. Increasing precipitation event size increases aboveground net primary productivity in a semi-arid grassland. Oecologia 2008, 158, 129–140. [Google Scholar] [CrossRef]
  44. Niu, S.; Yang, H.; Zhang, Z.; Wu, M.; Lu, Q.; Li, L.; Han, X.; Wan, S. Non-additive effects of water and nitrogen addition on ecosystem carbon exchange in a temperate steppe. Ecosystems 2009, 12, 915–926. [Google Scholar] [CrossRef]
  45. Jia, X.; Shao, M.; Wei, X. Soil CO2 efflux in response to the addition of water and fertilizer in temperate semiarid grassland in northern China. Plant Soil 2013, 373, 125–141. [Google Scholar] [CrossRef]
  46. Reichstein, M.; Ciais, P.; Papale, D.; Valentini, R.; Running, S.; Viovy, N.; Cramer, W.; Granier, A.; Ogée, J.; Allard, V.; et al. Reduction of ecosystem productivity and respiration during the European summer 2003 climate anomaly: A joint flux tower, remote sensing and modelling analysis. Glob. Chang. Biol. 2007, 13, 634–651. [Google Scholar] [CrossRef]
  47. Gilgen, A.; Buchmann, N. Response of temperate grasslands at different altitudes to simulated summer drought differed but scaled with annual precipitation. Biogeosciences 2009, 6, 2525–2539. [Google Scholar] [CrossRef] [Green Version]
  48. Shao, M.; Yang, W.; Li, Y. The availability of soil water to plant in Loess region. J. Hydrol. Eng. 1987, 18, 38–44. [Google Scholar]
  49. Liu, N.N.; Zhao, S.W.; Yong, Y.H.; Wang, H.J.; Zhao, Y.G.; Ji, X.Y.; Chao, L.H. Study on water-holding capacity of the top soil of a steppe reserve in the Yunwu Mountains, Guyuan, Ningxia Hui Autonomous Region. Acta Agrestia Sin. 2006, 14, 338–342. [Google Scholar] [CrossRef]
  50. Flexas, J.; Medrano, H. Drought-inhibition of photosynthesis in C3 plants: Stomatal and non-stomatal limitations revisited. Ann. Bot. 2002, 89, 183–189. [Google Scholar] [CrossRef]
  51. Ripley, B.S.; Gilbert, M.E.; Ibrahim, D.G.; Osborne, C.P. Drought constraints on C4 photosynthesis: Stomatal and metabolic limitations in C3 and C4 subspecies of Alloteropsis semialata. J. Exp. Bot. 2007, 58, 1351–1363. [Google Scholar] [CrossRef]
  52. Wan, S.; Xia, J.; Liu, W.; Niu, S. Photosynthetic overcompensation under nocturnal warming enhances grassland carbon sequestration. Ecology 2009, 90, 2700–2710. [Google Scholar] [CrossRef]
  53. Jump, A.S.; Penuelas, J. Running to stand still: Adaptation and the response of plants to rapid climate change. Ecol. Lett. 2005, 8, 1010–1020. [Google Scholar] [CrossRef]
  54. Davidson, E.A.; Janssens, I.A.; Luo, Y. On the variability of respiration in terrestrial ecosystems: Moving beyond Q10. Glob. Chang. Biol. 2006, 12, 154–164. [Google Scholar] [CrossRef]
  55. Ayub, G.; Smith, R.A.; Tissue, D.T.; Atkin, O.K. Impacts of drought on leaf respiration in darkness and light in Eucalyptus saligna exposed to industrial-age atmospheric CO2 and growth temperature. New Phytol. 2011, 190, 1003–1018. [Google Scholar] [CrossRef] [PubMed]
  56. Galmés, J.; Ribas-Carbó, M.; Medrano, H.; Flexas, J. Response of leaf respiration to water stress in Mediterranean species with different growth forms. J. Arid Environ. 2007, 68, 206–222. [Google Scholar] [CrossRef]
  57. Almagro, M.; López, J.; Querejeta, J.; Martínez-Mena, M. Temperature dependence of soil CO2 efflux is strongly modulated by seasonal patterns of moisture availability in a Mediterranean ecosystem. Soil Biol. Biochem. 2009, 41, 594–605. [Google Scholar] [CrossRef]
  58. Jia, X.; Shao, M.; Wei, X. Responses of soil respiration to N addition, burning and clipping in temperate semiarid grassland in northern China. Agric. Forest Meteorol. 2012, 166, 32–40. [Google Scholar] [CrossRef]
  59. Schwalm, C.R.; Williams, C.A.; Schaefer, K.; Arneth, A.; Bonal, D.; Buchmann, N.; Chen, J.; Law, B.E.; Lindroth, A.; Luyssaert, S.; et al. Assimilation exceeds respiration sensitivity to drought: A FLUXNET synthesis. Glob. Chang. Biol. 2010, 16, 657–670. [Google Scholar] [CrossRef]
  60. Wan, S.; Hui, D.; Wallace, L.; Luo, Y. Direct and indirect effects of experimental warming on ecosystem carbon processes in a tallgrass prairie. Glob. Biogeochem. Cycles 2005, 19. [Google Scholar] [CrossRef] [Green Version]
  61. Oberbauer, S.F.; Tweedie, C.E.; Welker, J.M.; Fahnestock, J.T.; Henry, G.H.R.; Webber, P.J.; Hollister, R.D.; Walker, M.D.; Kuchy, A.; Elmore, E.; et al. Tundra CO2 fluxes in response to experimental warming across latitudinal and moisture gradients. Ecol. Monogr. 2007, 77, 221–238. [Google Scholar] [CrossRef]
  62. Yvon-Durocher, G.; Jones, J.I.; Trimmer, M.; Woodward, G.; Montoya, J.M. Warming alters the metabolic balance of ecosystems. Philos. Trans. R. Soc. B 2010, 365, 2117–2126. [Google Scholar] [CrossRef] [Green Version]
  63. Jia, X.; Shao, M.; Wei, X.; Li, X. Response of soil CO2 efflux to water addition in temperate semiarid grassland in northern China: The importance of water availability and species composition. Biol. Fertil. Soils 2014, 50, 839–850. [Google Scholar] [CrossRef]
  64. Janssens, I.A.; Pilegaard, K. Large seasonal changes in Q10 of soil respiration in a beech forest. Glob. Chang. Biol. 2003, 9, 911–918. [Google Scholar] [CrossRef]
  65. Reichstein, M.; Subke, J.A.; Angeli, A.C.; Tenhunen, J.D. Does the temperature sensitivity of decomposition of soil organic matter depend upon water content, soil horizon, or incubation time? Glob. Chang. Biol. 2005, 11, 1754–1767. [Google Scholar] [CrossRef]
  66. Wan, S.; Norby, R.J.; Ledford, J.; Weltzin, J.F. Responses of soil respiration to elevated CO2, air warming, and changing soil water availability in a model old-field grassland. Glob. Chang. Biol. 2007, 13, 2411–2424. [Google Scholar] [CrossRef]
  67. Limousin, J.; Bickford, C.P.; Dickman, L.T.; Pangle, R.E.; Hudson, P.J.; Boutz, A.L.; Gehres, N.; Osuna, J.L.; Pockman, W.T.; McDowell, N.G. Regulation and acclimation of leaf gas exchange in a piñon–juniper woodland exposed to three different precipitation regimes. Plant Cell Environ. 2013, 36, 1812–1825. [Google Scholar] [CrossRef] [Green Version]
  68. Sanaullah, M.; Chabbi, A.; Rumpel, C.; Kuzyakov, Y. Carbon allocation in grassland communities under drought stress followed by 14C pulse labeling. Soil Biol. Biochem. 2012, 55, 132–139. [Google Scholar] [CrossRef]
  69. Sanaullah, M.; Blagodatskaya, E.; Chabbi, A.; Rumpel, C.; Kuzyakov, Y. Drought effects on microbial biomass and enzyme activities in the rhizosphere of grasses depend on plant community composition. Appl. Soil Ecol. 2011, 48, 38–44. [Google Scholar] [CrossRef]
  70. Liu, Y.Y.; Van Dijk, A.I.; De Jeu, R.A.; Canadell, J.G.; McCabe, M.F.; Evans, J.P.; Wang, G. Recent reversal in loss of global terrestrial biomass. Nat. Clim. Chang. 2015, 5, 470–474. [Google Scholar] [CrossRef]
  71. Smith, N.G.; Dukes, J.S. Plant respiration and photosynthesis in global-scale models: Incorporating acclimation to temperature and CO2. Glob. Chang. Biol. 2013, 19, 45–63. [Google Scholar] [CrossRef]
  72. Bagley, J.; Rosenthal, D.M.; Ruiz-Vera, U.M.; Siebers, M.H.; Kumar, P.; Ort, D.R.; Bernacchi, C.J. The influence of photosynthetic acclimation to rising CO2 and warmer temperatures on leaf and canopy photosynthesis models. Glob. Biogeochem. Cycles 2015, 29, 194–206. [Google Scholar] [CrossRef]
Figure 1. Location of the study site.
Sustainability 11 02597 g001
Figure 2. Monthly precipitation (columns) and mean air temperature (solid line) during the experimental period (July 2013 to September 2015) in a semiarid grassland of the northwest China.
Sustainability 11 02597 g002
Figure 3. Daily mean soil temperature and moisture at 0–10 cm depth for each treatment during the experimental period (July 2013 to September 2015) in a semiarid grassland of northwest China. Values are means of the replicates. Vertical dashed lines separate different years.
Sustainability 11 02597 g003
Figure 4. Seasonally dynamics of ecosystem CO2 flux through 2013 to 2015 of each precipitation treatment in a semiarid grassland of northwest China. GEP, Re, Rs, and NEE are gross ecosystem productivity, ecosystem respiration, soil respiration, and net ecosystem CO2 exchange, respectively. Values are mean ± standard error. The unit of CO2 flux is μmol m−2 s−1. Vertical dashed lines separate different years. The sampling size for each treatment is 4.
Sustainability 11 02597 g004
Figure 5. Averaged ecosystem CO2 flux at early, middle, and late part of the growing season through 2013 to 2015 of each precipitation treatment in a semiarid grassland of the northwest China. GEP, Re, Rs, and NEE are gross ecosystem productivity, ecosystem respiration, soil respiration, and net ecosystem CO2 exchange, respectively. Values are mean ± standard error. The unit of CO2 flux is μmol m−2 s−1. For each stage of the growing season, bars with different lowercase are significantly different at p < 0.05.
Sustainability 11 02597 g005
Figure 6. Diurnal pattern of CO2 flux as affected by precipitation treatments at different stages of the growing season in a semiarid grassland of the northwest China. GEP, Re, Rs, and NEE are gross ecosystem productivity, ecosystem respiration, soil respiration, and net ecosystem CO2 exchange, respectively. Values are mean ± standard error. The unit of CO2 flux is μmol m−2 s−1.
Sustainability 11 02597 g006
Figure 7. Relationships between ecosystem CO2 flux and soil temperature or soil moisture across all the treatments during the measuring period (July 2013 to September 2015). GEP, Re, Rs, and NEE are gross ecosystem productivity, ecosystem respiration, soil respiration, and net ecosystem CO2 exchange, respectively. Ln(Re) or ln(Rs) is the natural log transformed Re or Rs. The unit of CO2 flux or natural log transformed CO2 flux is μmol m−2 s−1. p < 0.05 for all relationships.
Sustainability 11 02597 g007
Figure 8. Relationship between precipitation and gross ecosystem productivity (GEP) or ecosystem respiration (Re) during growing season. Values were averaged across each treatment in each year. Blue is decreased precipitation treatment, red is ambient precipitation treatment, green is increased precipitation treatment. Square was measured in 2013, diamond was measured in 2014, circle was measured in 2015. p < 0.05 for both relationships.
Sustainability 11 02597 g008
Table 1. ANOVA results of precipitation treatment and stage of season on gross ecosystem productivity (GEP), ecosystem respiration (Re), soil respiration (Rs), and net ecosystem CO2 exchange (NEE) in a semiarid grassland of northwest China.
GEPReRsNEE
SSStage of season1321.0741.2286.9332.7
Treatment6.212.50.17.6
Interaction120.519.86.0114.3
Date346.95.626.9440.4
FStage of season51.3153.3175.421.9
Treatment0.22.60.00.5
Interaction2.32.11.83.8
Date27.02.332.958.1
PStage of season<0.0001<0.0001<0.0001<0.0001
Treatment0.7850.07550.96740.6047
Interaction0.05380.08570.11870.0048
Date<0.00010.1292<0.0001<0.0001
Table 2. Parameters for the relationships between CO2 flux and soil temperature in a semiarid grassland of northwest China.
G E P = a × T 2 + b × T + c
aSE(a)bSE(b)cSE(c)T0 (°C)RMSER2P
Across treatments−0.0650.0062.4190.198−8.1901.47818.612.9430.386<0.01
Ambient precipitation−0.078 a0.0142.861 a0.398−11.555 a2.78218.343.0030.476<0.01
Decreased precipitation−0.043 b0.0101.684 b0.325−3.321 b2.57119.583.1520.250<0.01
Increased precipitation−0.088 a0.0163.060 a0.458−11.862 a3.17517.392.4880.452<0.01
R e = a × e b × T
aSE(a)bSE(b)Q10SE(Q10) RMSER2P
Across treatments2.5750.1340.0520.0031.6820.050 1.5480.429<0.01
Ambient precipitation2.293 ab0.2080.064 a0.0051.896 a0.095 1.5160.517<0.01
Decreased precipitation2.401 a0.1580.046 b0.0041.584 b0.063 1.0480.566<0.01
Increased precipitation2.024 b0.1940.073 a0.0062.075 a0.125 1.4370.554<0.01
R s = a × e b × T
aSE(a)bSE(b)Q10SE(Q10) RMSER2P
Across treatments1.2420.0780.0550.0041.7330.069 0.9610.364<0.01
Ambient precipitation1.098 a0.1130.067 a0.0061.954 a0.117 0.8670.472<0.01
Decreased precipitation1.204 a0.1050.050 b0.0051.649 b0.082 0.7400.486<0.01
Increased precipitation1.017 a0.1510.072 a0.0092.054 a0.185 1.1000.330<0.01
N E E = a × T 2 + b × T + c
aSE(a)bSE(b)cSE(c)T0 (°C)RMSER2P
Across treatments0.0450.005−1.4690.1614.4431.19916.322.3880.175<0.01
Ambient precipitation0.058 a0.011−1.889 a0.3097.725 a2.16016.282.3310.254<0.01
Decreased precipitation0.036 b0.009−1.207 b0.3002.671 b2.37016.762.9050.122<0.01
Increased precipitation0.070 a0.012−2.077 a0.3417.647 a2.36314.841.8510.215<0.01
GEP, Re, Rs, and NEE are gross ecosystem productivity, ecosystem respiration, soil respiration, and net ecosystem CO2 exchange, respectively. T is soil temperature at 0–10 cm depth, a, b, and c are parameters for each equation, respectively. T0 is optimal temperature at which CO2 flux is greatest. SE is the standard error for each parameter. RMSE is root mean square error. Temperature sensitivity (Q10) is calculated as e 10 × b . Standard error for Q10 is calculated as Q 10 × 10 × SE ( b ) . Values of the same parameters with the same lower-case letter were not statistically significant among precipitation treatments. The differences of parameters among treatments were identified as significant when the SE did not overlap. The sampling size for each treatment is 232.
Table 3. Parameters for the relationships between CO2 flux and soil moisture in a semiarid grassland of northwest China.
G E P = a + b × M
aSE(a)bSE(b)RMSER2P
Across treatments15.1510.574−0.1750.0323.6160.070<0.01
Ambient precipitation17.845 a1.236−0.313 ab0.0663.8430.137<0.01
Decreased precipitation15.769 b0.800−0.341 a0.0573.1860.227<0.01
Increased precipitation18.124 a1.129−0.267 b0.0553.0950.145<0.01
R e = a + b × M
aSE(a)bSE(b)RMSER2P
Across treatments6.2930.323−0.0430.0182.0330.0140.02
Ambient precipitation7.976 a0.675−0.121 a0.0362.1000.074<0.01
Decreased precipitation5.528 b0.395−0.048 b0.0281.5720.0230.09
Increased precipitation8.973 a0.737−0.154 a0.0362.0210.117<0.01
R s = a + b × M
aSE(a)bSE(b)RMSER2P
Across treatments3.4970.188−0.0390.0101.1850.033<0.01
Ambient precipitation3.863 b0.375−0.052 b0.0201.1660.0450.01
Decreased precipitation3.084 c0.255−0.035 b0.0181.0170.0290.06
Increased precipitation5.200 a0.448−0.114 a0.0221.2270.165<0.01
N E E = a + b × M
aSE(a)bSE(b)RMSER2P
Across treatments−8.8580.3990.1320.0222.5160.081<0.01
Ambient precipitation−9.869 a0.8110.192 b0.0442.5220.121<0.01
Decreased precipitation−10.240 a0.6800.293 a0.0492.7070.231<0.01
Increased precipitation−9.151 a0.7330.113 c0.0362.0110.067<0.01
GEP, Re, Rs, and NEE are gross ecosystem productivity, ecosystem respiration, soil respiration, and net ecosystem CO2 exchange, respectively. M is soil moisture at 0–10 cm depth, a and b are parameters for the linear equation, respectively. SE is the standard error for each parameter. RMSE is root mean square error. Values of the same parameters with the same lower-case letter were not statistically significant among precipitation treatments. The differences of parameters among treatments were identified as significant when the SE did not overlap. The sampling size for each treatment is 232.
Table 4. ANOVA results of soil temperature and moisture on gross ecosystem productivity (GEP), ecosystem respiration (Re), soil respiration (Rs), and net ecosystem CO2 exchange (NEE) in a semiarid grassland of the northwest China.
GEPReRsNEE
SSMoisture1067525
Temperature8569822464
Interaction86312646330
FMoisture13463
Temperature685043091
Interaction69655741
PMoisture0.3647<0.00010.01240.0808
Temperature<0.0001<0.0001<0.00010.4658
Interaction<0.0001<0.0001<0.0001<0.0001
Degree of freedoms of the model and error were 3 and 646, respectively.

