Article

Social Interaction Scaling for Contact Networks

1
Social Networks and Human-Centered Computing, Taiwan International Graduate Program, Academia Sinica, Taipei 115, Taiwan
2
Institute of Information Systems and Applications, Department of Computer Science, National Tsing Hua University, Hsinchu 300, Taiwan
3
Institute of Information Science, Academia Sinica, Taipei 115, Taiwan
*
Author to whom correspondence should be addressed.
Sustainability 2019, 11(9), 2545; https://doi.org/10.3390/su11092545
Submission received: 19 March 2019 / Revised: 25 April 2019 / Accepted: 26 April 2019 / Published: 1 May 2019

Abstract

:
Urbanization drives the need for predictive and quantitative methods to understand city growth and adopt informed urban planning. Population increases trigger changes in city attributes that are explicable by scaling laws. These laws show superlinear scaling of communication with population size, asserting an increase in human interaction based on city size. However, it is not yet known if this is the case for social interaction among close contacts, that is, whether population growth influences connectivity in a close circle of social contacts that are dynamic and short-spanned. Following this, a network is configured, named contact networks, based on familiarity. We study the urban scaling property for three social connectivity parameters (degree, call frequency, and call volume) and analyze it at the collective level and the individual level for various cities around the world. The results show superlinear scaling of social interactions based on population for contact networks; however, the increase in level of connectivity is minimal relative to the general scenario. The statistical distributions analyze the impact of city size on close individual interactions. As a result, knowledge of the quantitative increase in social interaction with urbanization can help city planners in devising city plans, developing sustainable economic policies, and improving individuals’ social and personal lives.

1. Introduction

Cities are dynamic, continuous structures that mobilize human activity and capture creativity [1]. These dynamic structures are continuously evolving and adapting in new successive innovation cycles that build opportunities and openings, which in turn leads people to flock to cities [2]. The world is facing a gradual shift in people’s residence from rural to urban areas in search of economic and social welfare. Fifty-five percent of the world’s population today lives in urban areas. This figure is expected to rise to 68% by 2050, according to a United Nations forecast [3]. This expected growth of urbanization makes it essential to have a science-based understanding of the impact of population on city attributes, such as infrastructure, communication, and economy, for maintaining city infrastructure and developing sustainable urban policies. With population increase, qualitative changes occur in urban cities [4,5]. Large-scale cities offer the benefits of increased socioeconomic activity [6,7], which are due to the fact that people interact more intensely with each other as city size grows and as the number of potential connections increases [4,8]. With the exponential increase in population, city attributes, such as employment opportunities, economic parameters like gross domestic product and gross metropolitan product, innovation, and productivity also increase [9,10,11,12]. However, this is a tradeoff that comes with the cost of increased pollution, crime, and epidemics [13,14,15]. These attributes are common to all urban cities as they are self-similar in terms of form and functionality with some variation on a theme [16,17]. These variations are quantitatively predictable by scaling laws with the properties of cities as a function of their population size. As city size changes, city attributes scale with the geometry of the city [18]. Studying city activities by scaling laws provides a linkage between the population and concepts of functional city attributes. This is explicable by relation, YNβ, where Y is the city attribute (infrastructure, social interaction, jobs); N is the population of the urban city; and scaling exponent β is the quantitative measure. The variation within city attributes with respect to population is estimated by scaling exponent β. β falls into three universality classes with respect to functionality: linear, sublinear, and superlinear scaling. Linear scaling, β = 1, is associated with individual needs variables (jobs, households), which stay neutral as the population increases. Sublinear scaling, β < 1, is associated with infrastructure variables (gasoline stations, roads) or biology, which decrease as the population increases. Lastly, superlinear scaling, β > 1, is associated with socioeconomic variables (interaction, wealth, innovation), which increase as the population increases and have increasing returns with population growth [5,19,20].
The important variable associated with increasing returns is social interaction, which is a key driver in regulating ideas, wealth, and epidemics [21,22,23,24]. Social interaction follows scale invariant superlinear scaling with population size, that is, increased social activity in cities when the population accelerates [25,26,27]. The social interaction networks formed in urban cities are based on homophily and familiarity rather than on geographical proximity, which is more observed at the country level [28]. Urban networks are self-organized, dispersed, and decentralized, making them dynamic and robust. Interaction networks based on familiarity and close contacts are distinctive and short-spanned and exhibit turnover over time as personal circumstances change [29,30]. It is yet to be discovered how population growth influences social interaction in this dynamic nature of urban networks. To our knowledge, no study has been done that analyzes urban scaling for familiarity-based networks (i.e., a close circle of social contacts). With access to massive data, this study answers two questions that are essential for the implementation of sustainable urban practices and policies in the future: (1) How does urban scaling property hold for close contact connectivity networks? and (2) Are these close contact interactions influenced at the individual level by city size?
A network is configured from call detail records (CDRs) based solely on close contacts, referred to as contact networks. The foundation of this work considers communication activity “only” with the people saved in the users’ phone contact lists. The people added to someone’s phone list presumably represent friends, relatives, colleagues, or acquaintances, and therefore constitute the proposed definition of close contacts for this study. These networks are egocentric in nature, emphasizing each user’s personal connectivity network. They represent nodes as individuals (ego) with social ties to other people (alters) in their contact list. Connectivity parameters, such as nodal degree, call frequency, and call volume, create social ties among close contacts, which successively form close contact connectivity networks. Social interaction is measured with the help of these connectivity metrics. We study the urban scaling connectivity property for contact networks and compare it with the baseline network. We also explore the statistical relation between city size and close contact interaction. After analyzing social interaction as a whole, it is analyzed at the microlevel for individuals. Parametric probability distributions are exhibited to study the impact of population size on individual social connectivity for contact networks.
In this work, an empirical evidence is presented for a novel scenario, close contact networks that support the urban scaling connectivity hypothesis. Urban scaling laws for ‘close circle of social contacts’ is yet to be studied and analyzed. These kinds of networks are distinctive and volatile yet significantly contribute to fast flow of information, the baseline for accelerated socioeconomic processes. Approaching close contact social interaction by scaling laws provides a linkage between the concepts of urban function, city size, and innovation cycles.
The objective of the study is to analyze the impact of population increase on social interaction among close contact networks at collective and individual levels. Having the quantitative understanding of population impact on human interaction is helpful for authorities to devise informed and predictive urban plans. The increase in familiarity-based interaction on an urban scale has implications for social capital, the adoption of innovation, epidemics, and health. For example, it can help in regulating social capital as it is developed by cooperation and connection among people. The estimated increase of population impact on human interaction can be of use to predict the change in social capital or stock markets. The connectivity scaling information provides quantitative evidence for the economies of scale that reinforce the sustainable development of cities.
For individuals, their social life in large cities is more fragmented and insecure than in smaller cities. Large and dense cities are accountable for individual variability and displaced personal relations, which are largely anonymous and transitory [31,32]. Big cities can derive serious issues of individual isolation, social disintegration, psychological disorders, low self-esteem, depression, and crime. Knowledge of population impact on close individual interaction is essential to handle these issues by incorporating social development programs that increase social connections correlated with good health and stability [33]. The increased interaction and dialogue at the individual level catalyzes cooperation among people that helps in bonding and bridging social capital.
The rest of the paper is organized as follows. In Section 2, material and methods are presented that elaborate on the data processing steps, connectivity parameters, and the methods used for the analysis of network. Section 3 reports the results for two different levels, collective and individual. This is followed by discussion and conclusion in Section 4 and Section 5, respectively, that summarize the work with open questions, limitations, and future scope of the study.

2. Materials and Methods

This section elaborates on the data and the methodology in three subsections. The first subsection explains the dataset and the extensive preprocessing procedure carried out to refine the data for experiments. The last two subsections elucidate the connectivity parameters and the methodology used to compute social scaling property for the proposed network.

2.1. Whoscall Data

Mobile phone communication is considered a reliable substitution to study the strength of individual-based social interaction [27,30]. The high penetration rate of mobile phones has led to the proliferation of ubiquitous and pervasive digital datasets. These datasets provide an opportunity to study the activity of an entire population at a granular level coupled with spatial and temporal details [34,35,36]. All the statistical information about the communication activity (e.g., degree of nodes, duration, frequency of calls, call direction, or destination) can be gathered from call detail records (CDRs). The data was obtained from the Whoscall mobile application for this research study. Whoscall is a caller ID and number management application. It identifies incoming calls that are not in the user’s contact list so the user can recognize important calls and filter out unwanted calls. It is carried out through support from other mediums (Internet searches, local networks, and user-generated data). Other features include blocking numbers and keywords, profile making, creating contact groups, and identifying commercial or telemarketing numbers [37]. Data privacy is maintained and preserved. No personal information is present in our data that traces back to any specific user. The data access was free for the academic purpose and noncommercial use.
The initial dataset was massive, covering the CDRs of 194 countries spanning 3541 cities and about 5 million users. The observation period of the data covers about three months consisting of 99 days from May 1, 2015 to August 7, 2015.
The dataset was processed before applying the analytical techniques. The process involved three basic steps: (i) data filtering, (ii) data location query, and (iii) data extraction.
  • Data filtering: The first step involved the conventional filtering procedure of removing irrelevant and spam entries, then generating complete and consistent information. It is important to test the structural robustness of networks as missing data can cripple the functionality and stability of the entire network. A seminal work studies the subgraph robustness against different attacks and for different network topologies, which is helpful in understanding aptly the resilience of many real-world networks since data missing is prevalent in such systems [38].
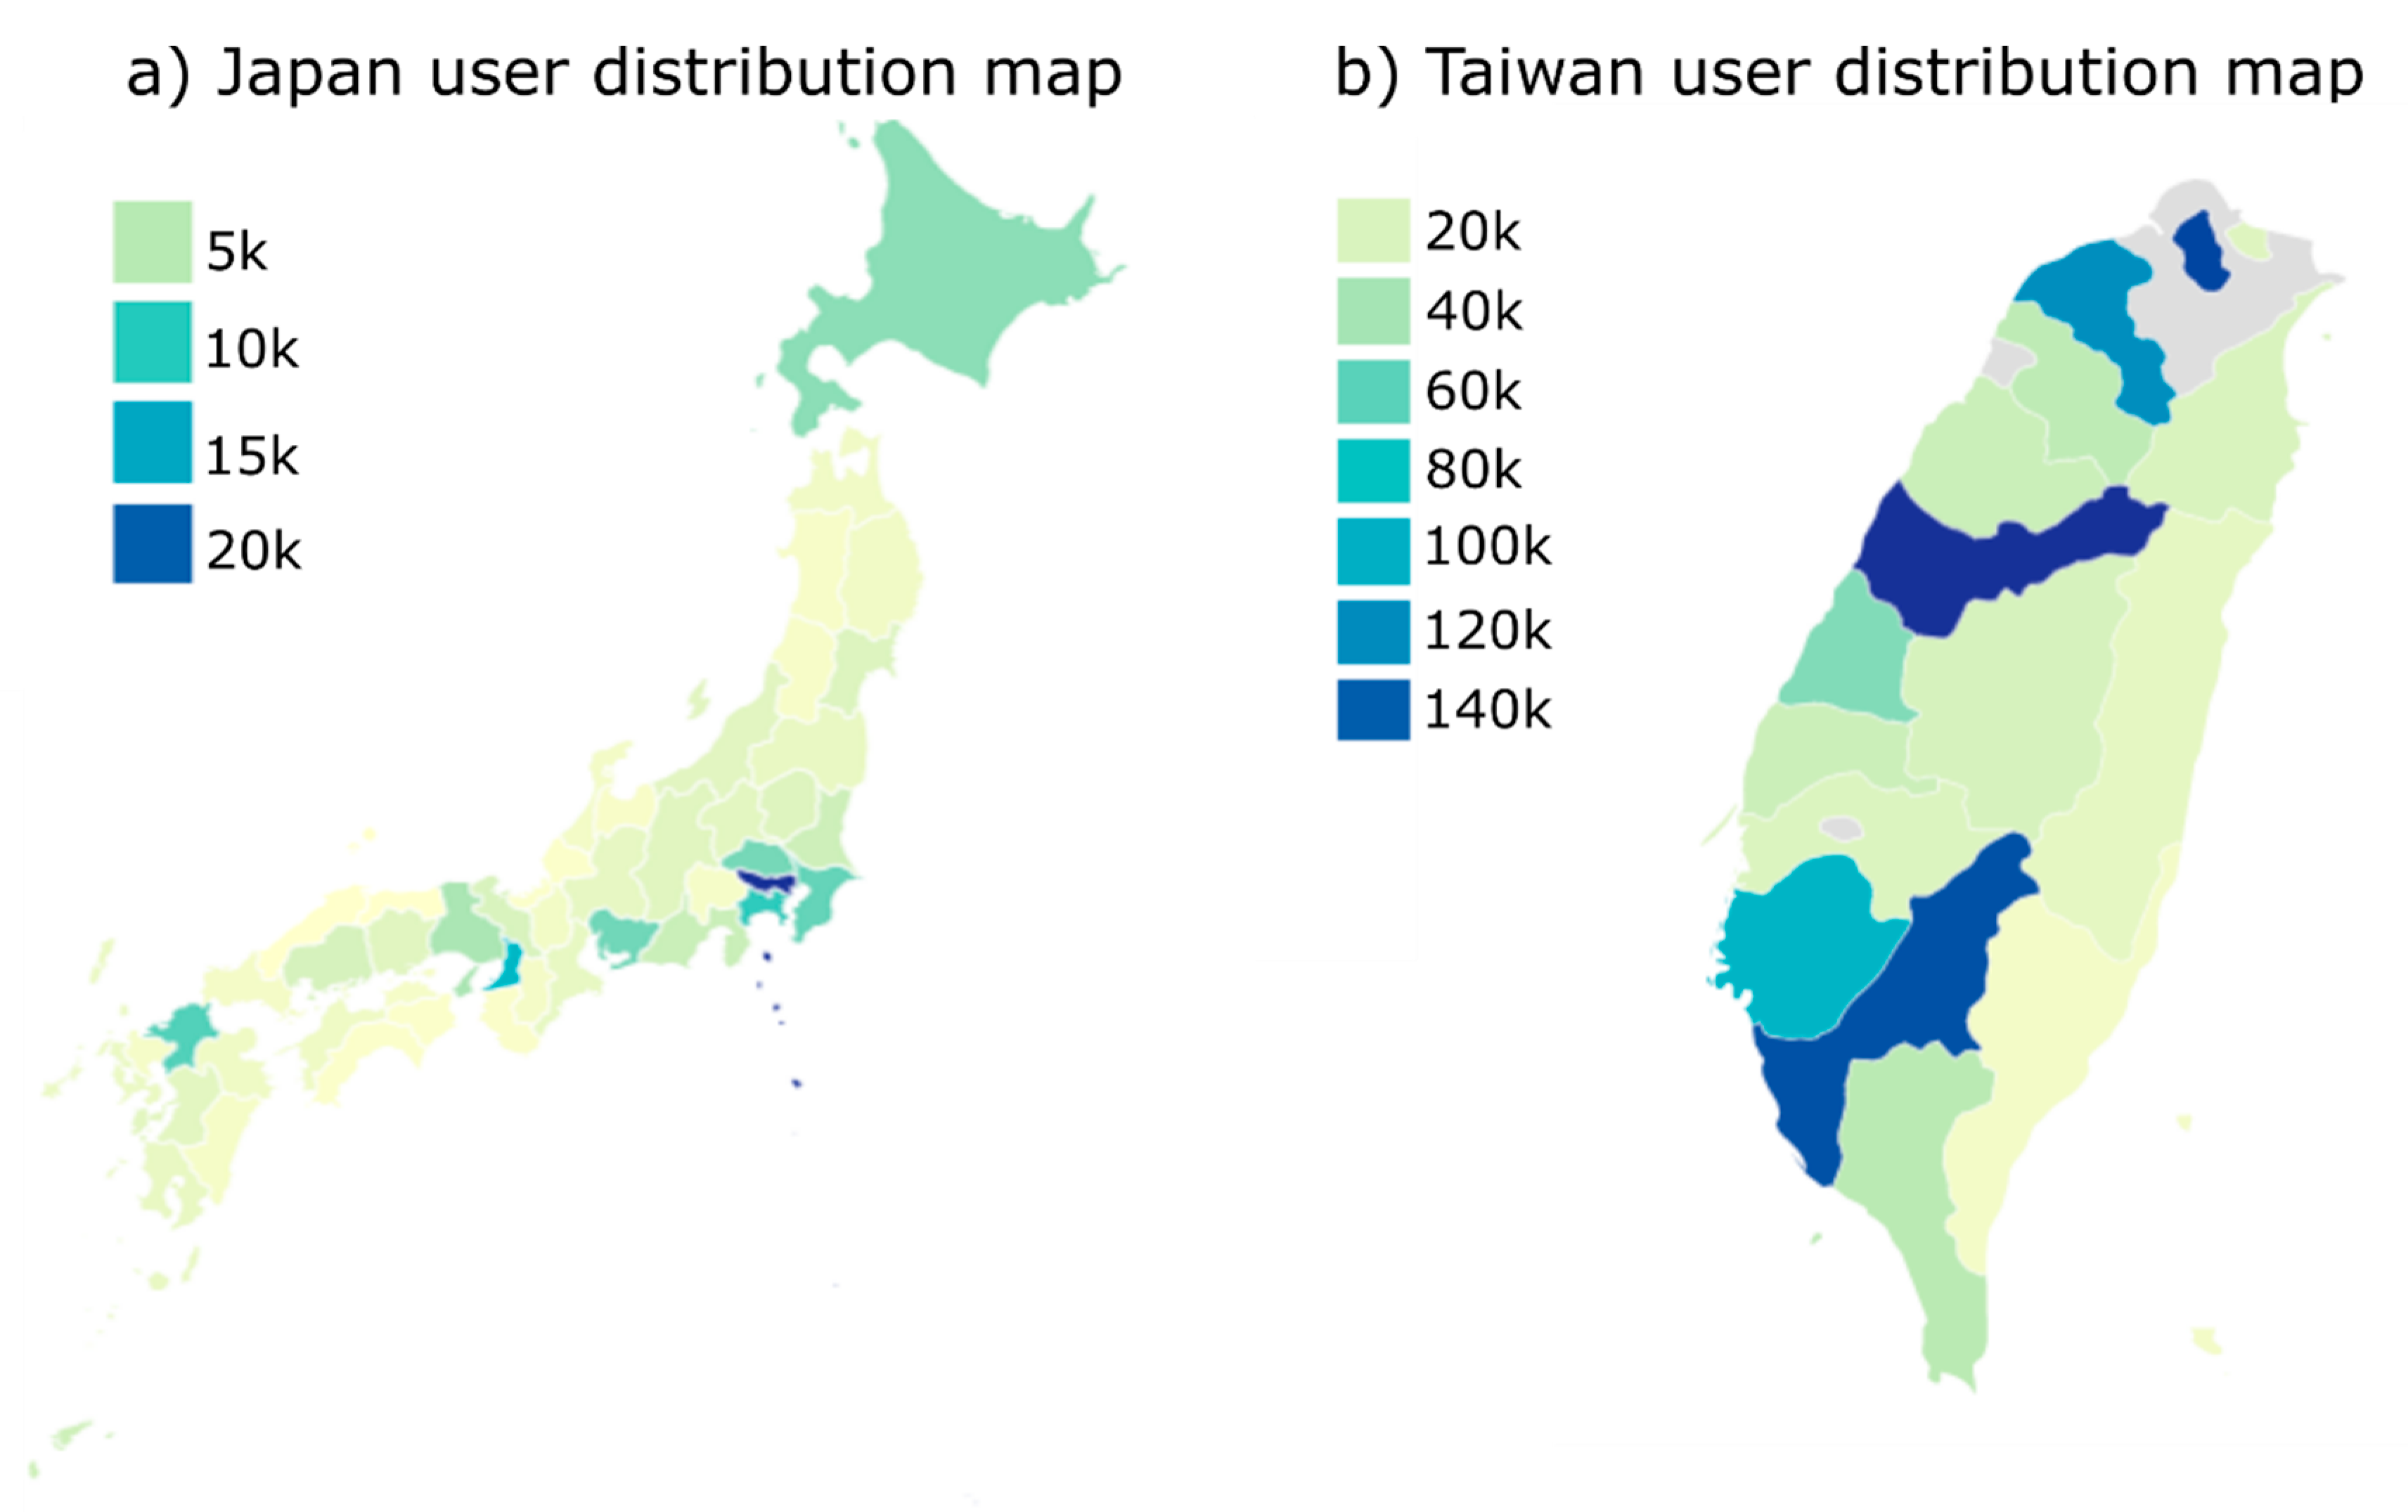
  • Data location query: This step aimed at identifying the location of the base station on Google Maps. With the help of cell ID (CID) sets available in the data, we identified the location of the cell towers that routed the users’ calls. This data contained information including the unique identifier of the cell, location area code, mobile network code, and the cell tower’s mobile country code. This information was inputted into the Google Maps Geolocation API to query the geographic coordinates (latitude and longitude) by translating the CID sets. Later, the Reverse Geocoding Google API (application programming interface) was used to convert the extracted coordinates into a human-readable address. This was helpful in identifying the location of a user.
  • Data extraction: The third and final preprocessing step mapped the acquired location and information to each user and extracted the communication details.
To provide an overview of the dataset, the spatial visualization for two of the countries from our dataset are shown in Figure 1. The figure illustrates the Whoscall user distribution for the cities of Japan and Taiwan. The cities with large numbers of users are major cities of respective countries signifying an urban population. For Japan, the city with the most users is Tokyo, and for Taiwan, Taipei, Kaohsiung, and Taichung are the three major cities having high user data.

2.2. Connectivity Parameters

Communication details were gathered for each user belonging to different cities around the world from Whoscall CDRs. These parameters were accounted as the function of population size to generalize and test the urban scaling social connectivity property for the contact networks. The three connectivity parameters used for analysis were nodal degree k, call frequency w, and call volume v.
  • Nodal degree k: The total number of nodes or contacts each user is linked with. As per egocentric definition, this is the number of links to alters by an ego.
  • Call frequency w: The number of calls initiated or received by each user. Frequency only considers calls from the contacts the user has in his or her phone and excludes unknown calls.
  • Call volume v: The time a user spent on the phone; the duration of the call.
Social networks evolve in time according to the dynamics of the network nodes, thus instigating volatile interaction topologies and multilayer parameters. This autonomous nature makes network complex systems and builds the need for an effective model that can cater to multilayered moving agents of network. A recent study has presented a model that provides the interplay between multilayered network topologies and spatial networks. It is useful for analyzing social interactions which possess the same dynamic time-varying properties with autonomous agents [39]. In view of this and the evolving nature of networks, we have chosen three different natured connectivity parameters with nodal degree exhibiting static topology and call frequency and volume presenting continuous quantities. Using varying multilayered quantities can provide broad coverage of the analysis.

2.3. Contact Networks

In our analysis, the connectivity parameters are scaled with city sizes to study the influence of population growth on social interaction. Previous studies [27,28] show that urbanization has a positive impact on social interactions for mobile phone networks and social networks. This is true for networks not bound by any constraints. The proposed contact network in this study is an urban network exclusively restricted to close and familiar calls. Contact networks are used to study the influence of urbanization for familiarity-based networks. The configuration of the contact network considers communication activity with the contacts a user has in his or her phone presumably representing friends, family members, colleagues, or acquaintances. This is an egocentric nonreciprocal network (i.e., each node has connections with other nodes representing the communication activity), however, it is unknown if this connection was ever reciprocated. These connectivity networks are scale-free. Scale-free networks are characterized by the presence of large hubs; few nodes are highly connected whereas most nodes have only a few links. These kinds of networks follow power-law degree distribution. The networks in our study are also scale-free as it abides by the above-mentioned properties. Contact networks follow power-law degree distributions with existence of hubs in the network.
Linear regression modeling is applied to observe how the urban scaling property holds for the configured contact networks’ close circles of social contacts. The regression model quantifies the strength of relationship between the variables connectivity and population. We examine the influence of independent variable population on the response variable connectivity by fitting a linear regression model. We compute both variables prior to fitting of linear model. For first variable connectivity parameters, the cumulative data are taken for nodal degree K, call frequency W, and volume V by the mathematical formula [27]:
W = i = T w i ,
where T is the total number of users for a given city and wi is the total number of calls generated or received by each individual i.
The cumulative degree of the node K and call duration V are estimated in the same way as the cumulative number of calls W. A large variation persists between the accumulated connectivity parameters (K, W, and V), making it difficult to characterize the relation between the connectivity parameters and population N. To overcome this concern, the parameters are rescaled by coverage s. Coverage for each city can be determined by:
s = | T | N ,
in which the rescaling of the cumulative number of calls Wr with coverage is represented by the formula:
W r = W s .
This reduces variation and helps to distinguish the mathematical relation between communication parameters and population by the power law, Wr Nβ. The given relation explains the association among the variables where β is the scaling exponent. The rescaled cumulative degree of nodes Kr and call volume Vr are calculated likewise:
K r = i = T k i s
V r = i = T v i s .
Furthermore, the rescaled cumulative connectivity parameters are divided by their respective means < Kr >, < Wr >, and < Vr >. Similarly, the other variable population N is divided by its mean which formulates N/< N >.
Once both the parameters are computed, we take the log transformation. Statistically, it is beneficial to transform both axes using logarithms and then fit a linear regression model on log–log scale. It normalizes the data and makes it easier to analyze trend using the slope of the line. The demonstration of power-law relation by fitting a linear regression model describes how a response variable connectivity changes as an explanatory variable population changes raised to exponent β.

3. Results

This section will elucidate on the social scaling property at two different levels: the collective level and the individual level. For the collective level, we use the accumulated sum of connectivity parameters calculated in Section 2 to determine the impact of the population for different urban cities. This part considers social interaction as a whole and measures scaling property for contact networks and compares it with the general scenario. The variations in scaling results are explained for both network settings. Furthermore, we move to a granular level to verify if population size in urban cities influences social connectivity at the individual level.

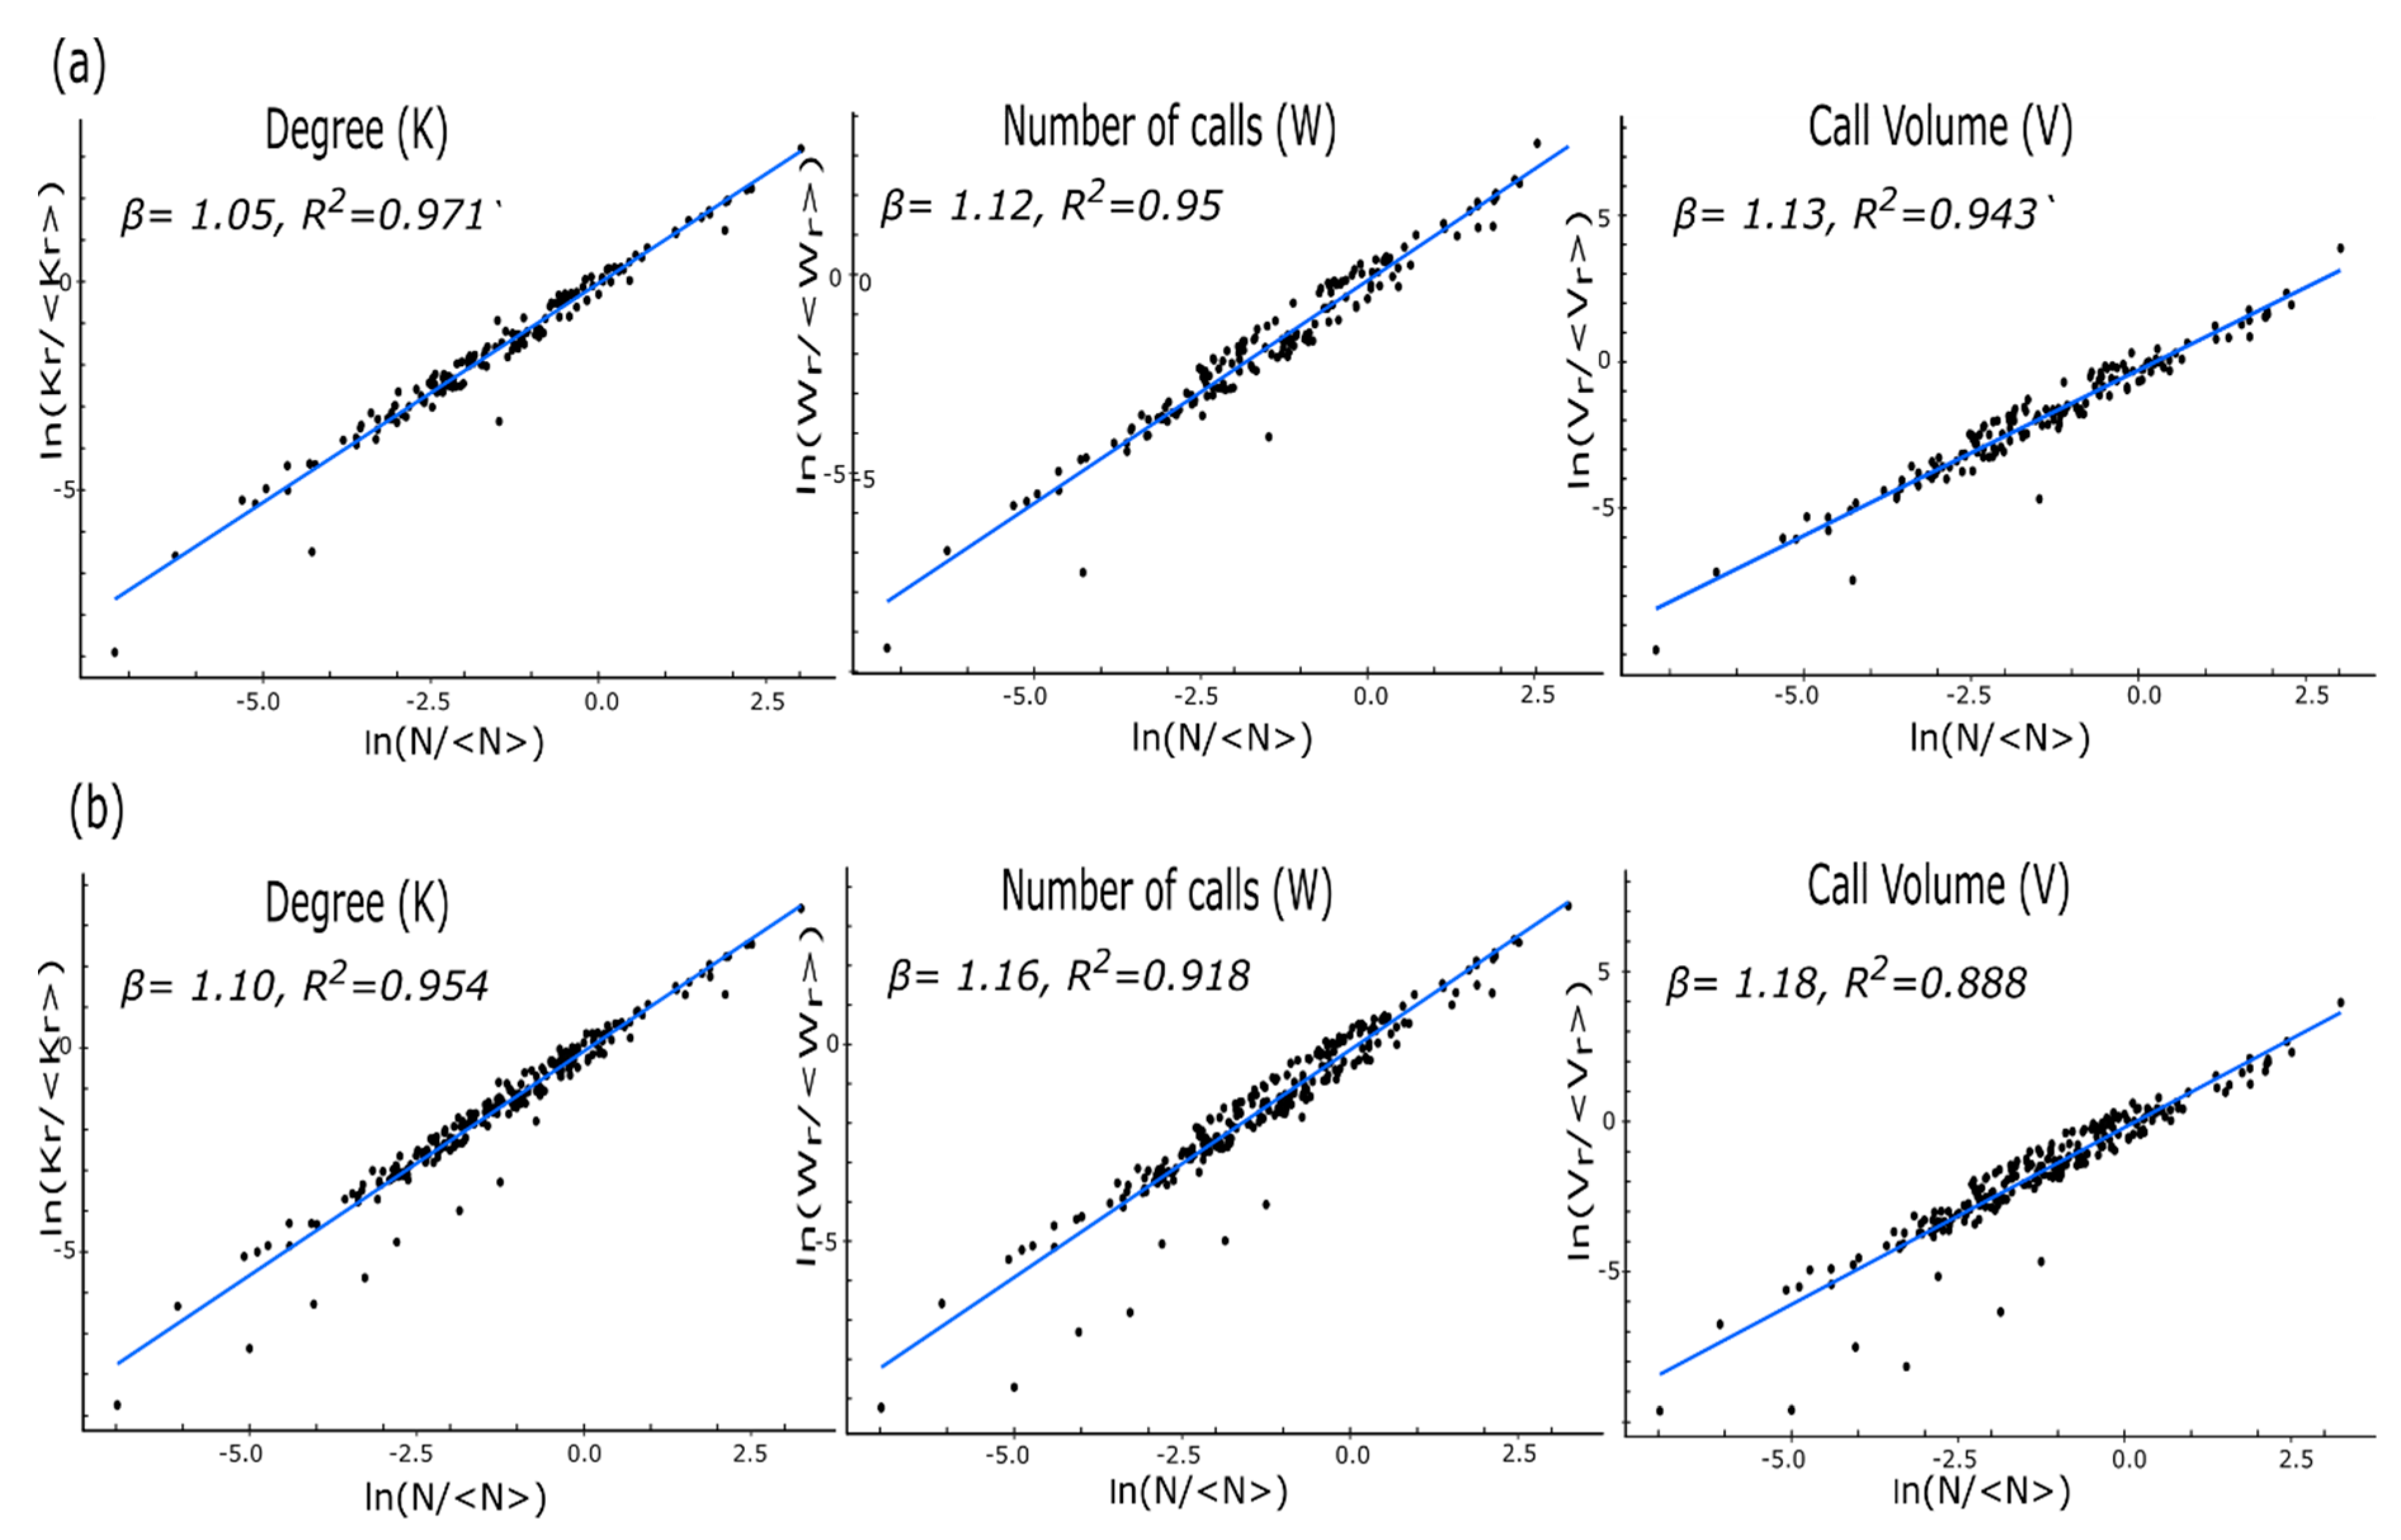
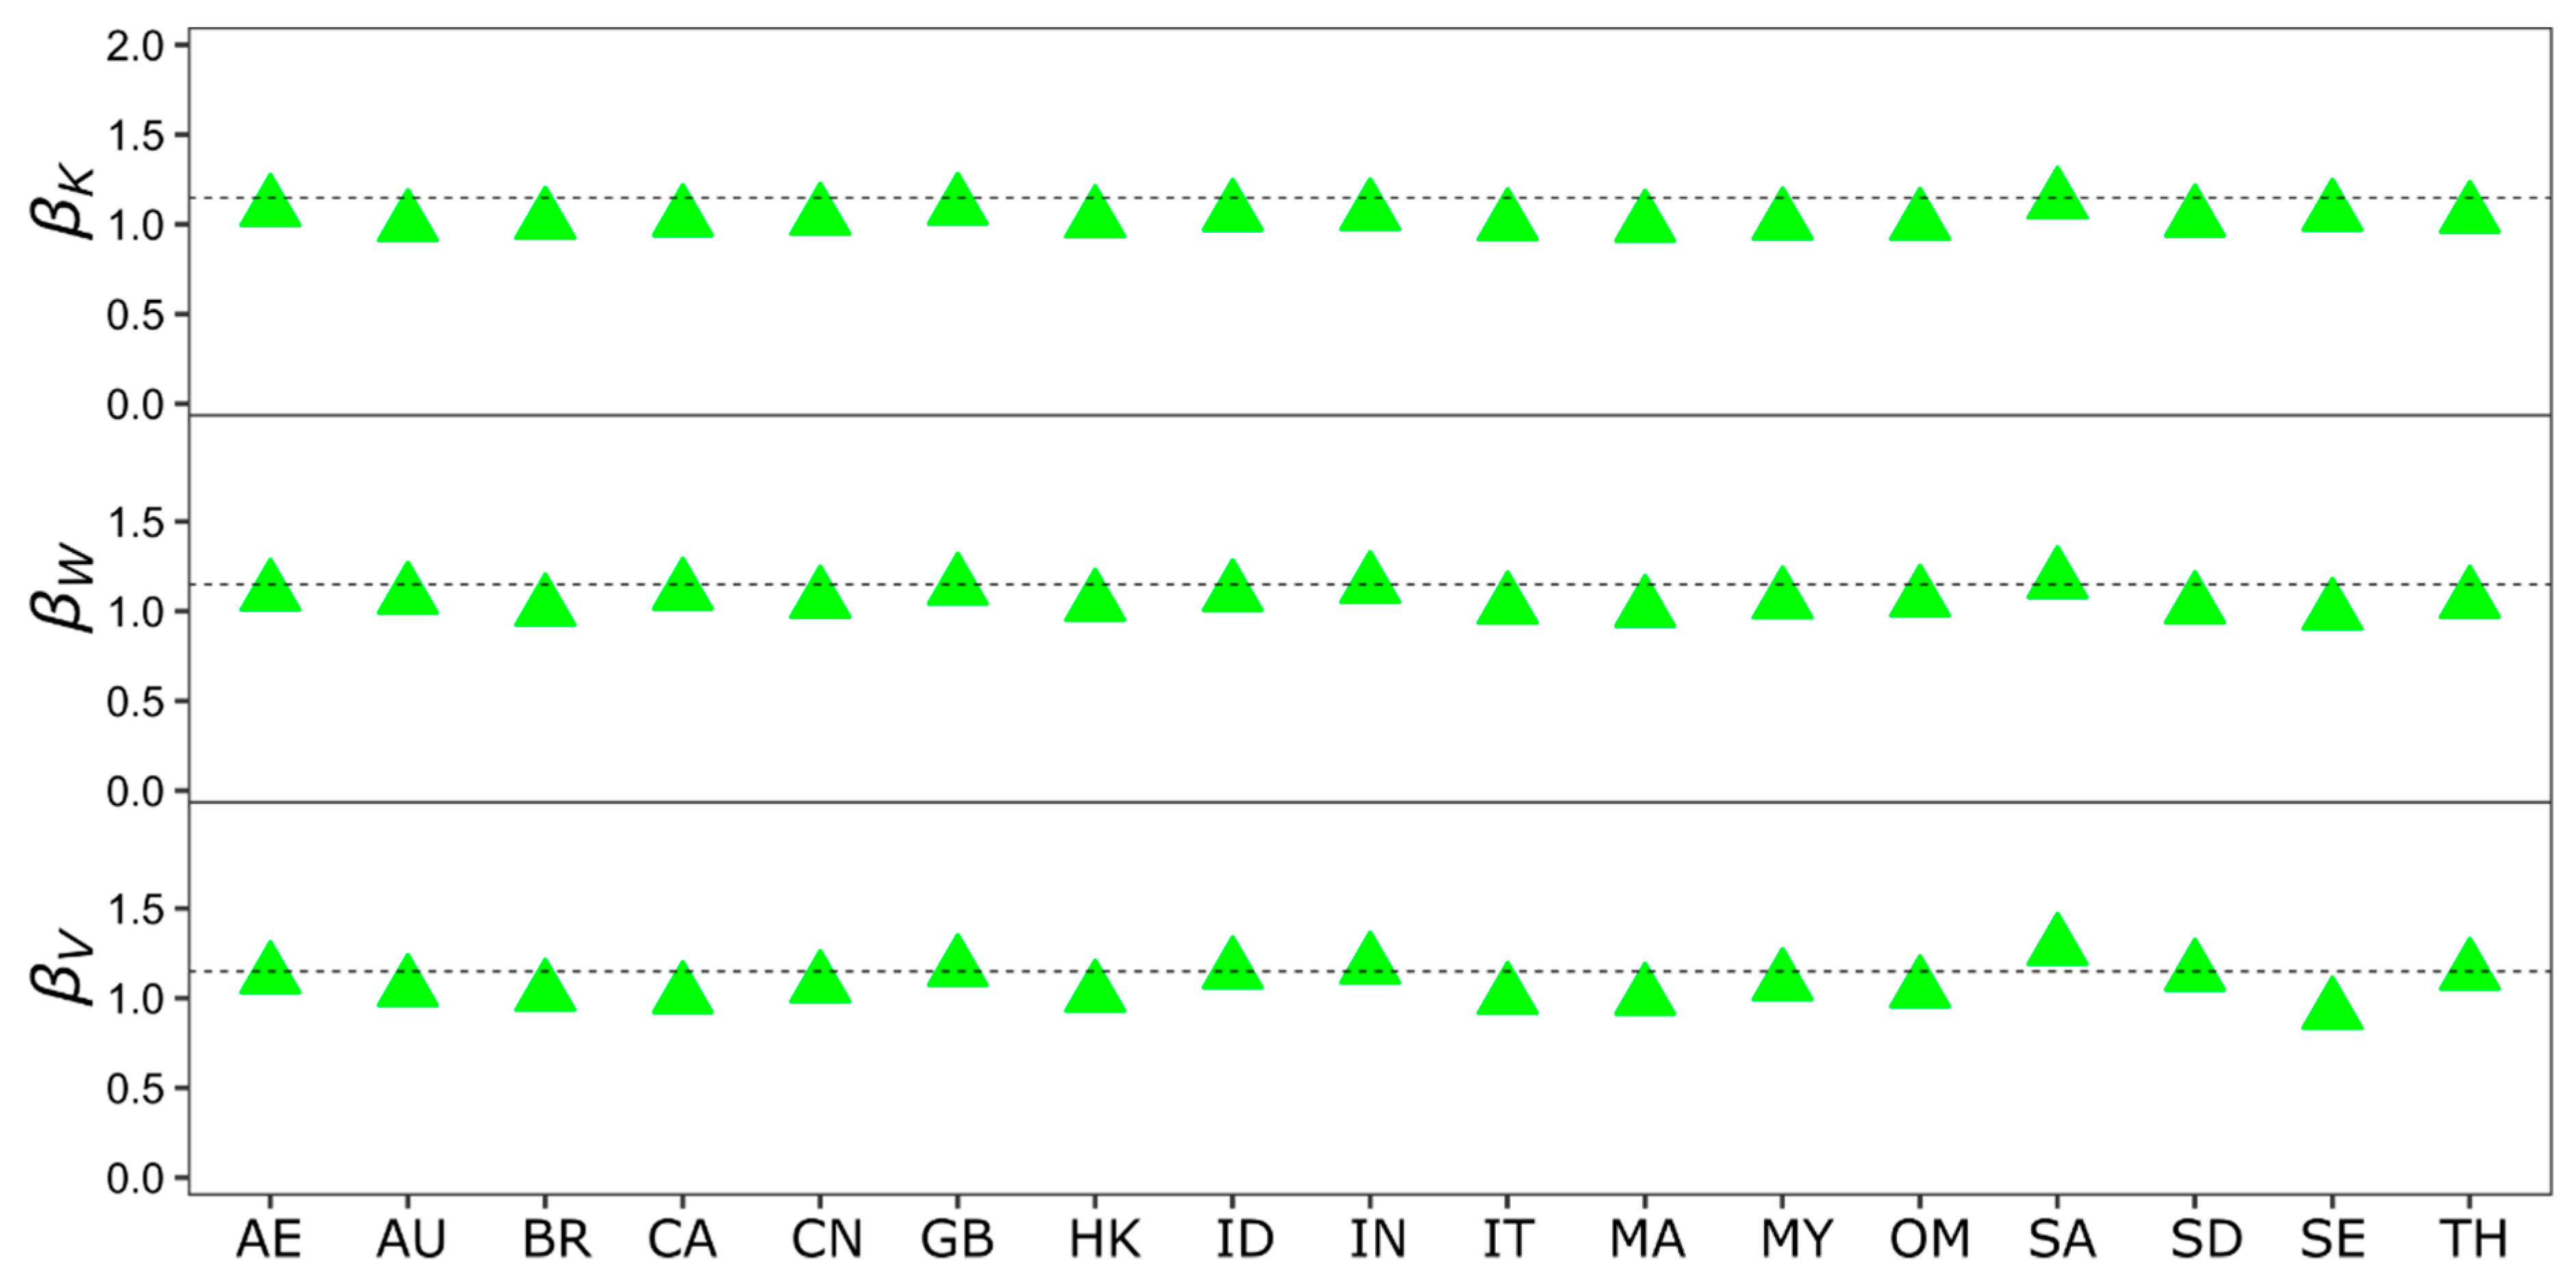
3.1. Social Connectivity Scaling Property at the Collective Level

Before we proceed with the analysis, it is noted that few studies have discussed the importance of city boundaries [40,41]. The choice of the unit of analysis that defines city boundaries affects the empirical analysis of urban scaling. The definition used for this study is second-level administrative subdivisions. These divisions have their own local governments and are referred to by different names around the world, such as municipalities, counties, districts, and amphoes, depending on the country [42]. This definition is considered as the unit of analysis as it is consistent with previous studies [27]. To maintain consistency and balance in the results, two conditions are applied to the dataset. First, there must be at least 100 Whoscall application users in each city. This is necessary to implement because a few cities have users that are nonexistent, which could cause discrepancies in the results. After applying this condition, the data are reduced to 1495 cities in 61 countries. Second, each city must have coverage higher than 0.5%. This coverage rate is set to make sure the cities have a determined amount of information. After applying this threshold, the archival data are reduced to 150 cities in 10 countries for contact networks. The connectivity parameters are computed for the archived cities, and we observe how the population size affects it through scaling laws.
Previous studies show that human interaction exhibits scale-invariant superlinear scaling with city sizes. We study urban scaling property in a connectivity setting where the user is familiar/close with the person on the other end (i.e., the contact networks). The networks formed from contacts and familiarity are known to be robust, distinctive, and short-spanned, which makes them essential to be analyzed as power law of city size. The impact of population growth is analyzed for contact network connectivity.
The scaling results of this network are compared with the baseline scenario to broadly observe the variations in results while keeping the same underlying parameters. This baseline setting is named communication network. The structure of this network will consider connectivity with all the nodes regardless of whether the user knows them or not. Any activity initiated or received by a user from anyone who may or may not be in his or her contact list will be the underlying property for the communication network. This can include random calls, advertising calls, business calls, as well as social (family, friends, or colleagues) calls. The urban scaling connectivity property is accumulated for the communication network that, apart from personal contacts, also includes an added feature of unknown calls.
The results of both the contact network and communication network are compared at the collective level to understand and analyze the variation in scaling property of social interaction for close contact networks.

Findings

We produce a linear regression plot for cumulative connectivity parameters (K, W, and V) with population size for contact network and communication network. Figure 2 shows the linear regression plot. The results show the scale-invariant superlinear scaling for both networks that substantiates an increase of social interaction with growing city sizes. The mapping of society-wide communication activity with population size for contact networks shows a minimal increase in the level of social interaction for all three connectivity parameters as compared to communication networks. However, the difference in variation is negligible. Nevertheless, contact networks show better fitting of the model.
For contact networks, the scaling exponents for nodal degree, call frequency, and call volume are higher than unity revealing the influence of population size on connectivity parameters. The superlinear scaling construes the model β = 1 + δ > 1 [6], hence, for a number of calls with scaling exponent value 1.12, the model yields β − 1 ≈ 0.12. This states that with population growth, the increase in call frequency is 12%. Similarly, for nodal degree and call volume, the increase is 5% and 13%, respectively. The increase observed for contact networks for all three scaling properties is moderately less compared to communication networks. The major relative difference for the nodal degree is a 5% increase for contact networks, whereas it is double at 10% for communication networks. The increase in the number of contacts for the familiarity-based network is least influenced by population growth. This asserts that users amid an increase in population do not excessively increase their number of personal or close contacts. The call frequency and volume exponent values are consistent with standard estimates of social interaction [6,27]. The population impact of communication networks on social interaction is predominantly higher for all three connectivity parameters. Considering that communication networks are massive with no constraints, the higher percentages of interaction with population growth relative to contact networks is understandable.
Close contact networks are likewise influenced by population growth as in other connectivity networks. Urbanization positively affects the connectivity in personal networks for different cities around the world. The connectivity scaling property is independent of city features, such as development, politics, time, or culture. This study universalizes the scaling property by taking into account a huge dataset gathered from around the world and testing it for a specified scenario (contact network) and the generalized scenario (communication network). Since the difference between the two networks is trivial, we will use contact networks for further analysis.
Utilizing the dataset to its fullest, scaling exponents are computed for different countries for contact networks. For each country, the threshold for number of cities is set at a minimum of three. Figure 3 shows the scatter plot of scaling exponents for all the three connectivity properties computed for different countries. The dashed horizontal line in the figure represents the common exponent value for socioeconomic indicators β ≈ 1.15 > 1. The countries measured span different parts of the world yielding many additional and dynamic properties. However, this study only considers social interactions irrespective of any cultural or political constraint. The results show that the exponent value for all the countries lies in the observed exponent range of socioeconomic activities [5,6]. The figure also shows that for contact networks, 17 countries remained after the threshold, revealing superlinear scaling with exponent values higher than unity. This suggests an increase in social interaction with an increase in population size.

3.2. Social Connectivity Scaling Property at the Individual Level

Social interaction at the individual level is the foundation of many underlying phenomena that make cities the engine of creativity and diversity. Social interaction is as essential to making city life dynamic as communication activity is at the collective level. In the previous section, the impact of population on communication activity is studied as a whole; this part emphasizes social interaction at the individual level and the impact of population size on it.
Positive social connection and harmonious relationships are fundamental social behaviors. They have become the measure of self-worth and are considered a sign of dignity and pride. These factors motivate people to make and maintain social connections [43]. Increased individual social connection is associated with enjoyment enhancement and reward system activation [44,45]. Likewise, a reduced social connection is linked with psychological disorders, health issues, loss of the meaning of life, depression, and other major issues, such as crime and suicide. Therefore, it is essential to study how social interactions are influenced at the individual level with the growth of population.
Previous studies [27] have shown that city size has an impact on individual social connectivity and higher communication activity with increasing sizes. The intricate granularity of our dataset has made it possible to calculate individual social connectivity for contact networks.

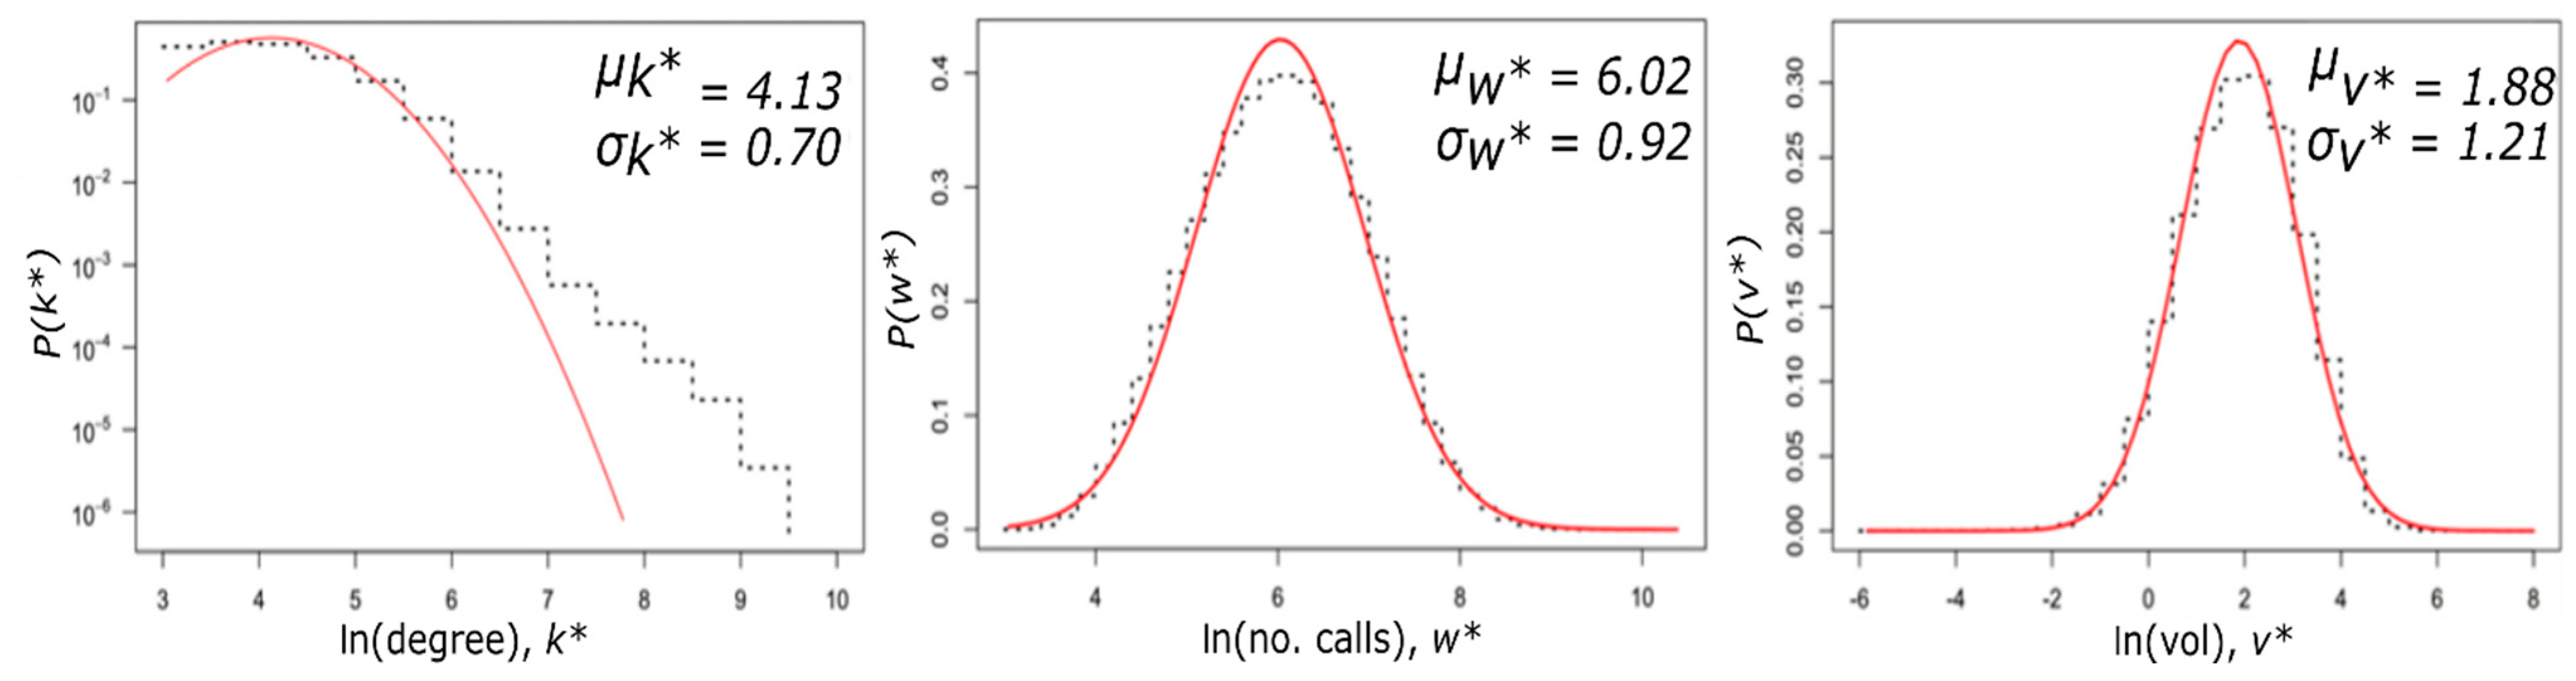
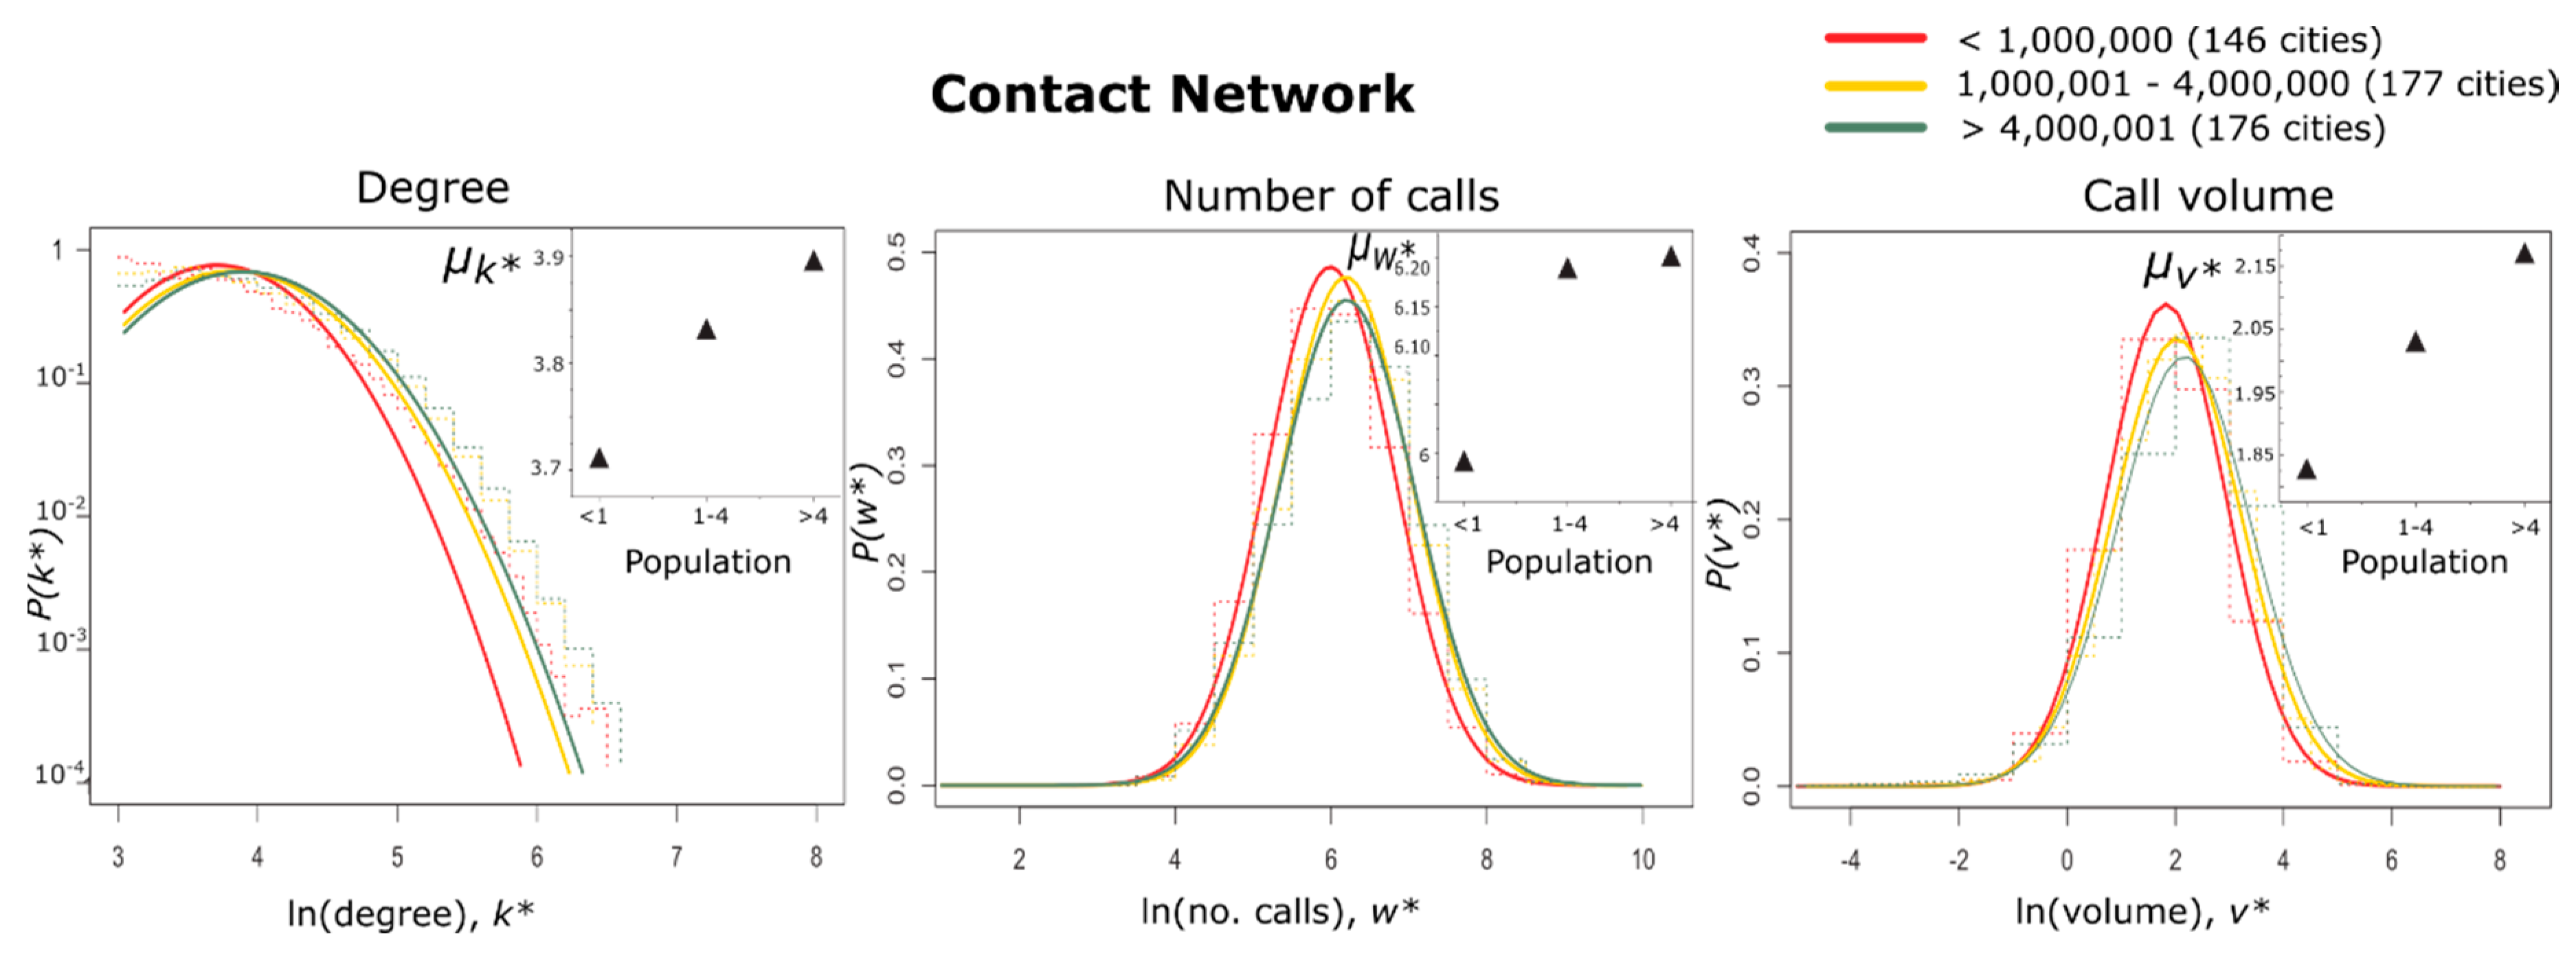
3.2.1. Generalized Distributions for Individual Social Connectivity

Before we get into detail with respect to the population size of each city, Figure 4 illustrates the general trends of individual social connectivity. The probability distribution of all users’ communication activity is plotted irrespective of the city sizes they belong to. The figure shows the statistical distributions for the three connectivity parameters (k, w, and v) with calculated mean and standard deviation. For parameter nodal degree k, it is log-transformed to k* with degree distribution exhibited by P(k*). The histogram is tabulated after the regression line is fitted to it. Similarly, the individual-based interaction distribution trend is computed for parameters w and v. Figure 4 shows that the nodal degree has a skewed lognormal distribution, whereas call frequency and call volume follow a normal distribution.

3.2.2. City Bins

To analyze the impact of population on individual interaction, preconditions were set to demonstrate the statistical probability distributions. We ranked the cities based on their population size, then we formed three groups, termed city bins, and assigned cities to each of the groups: cities with a population less than 1 million were placed in the first group, cities with a population between 1 million and 4 million were assigned to the second group, and cities with a population size higher than 4 million were assigned to the third group. The users were logged into city bins according to their city sizes. The lognormal distribution (probability density for a normal distribution) was estimated for the city bins, each representing the individual interaction of its occupants. We observed the probability distributions for the nodal degree, call volume, and call frequency for contact networks.

3.2.3. Population Impact on Individual Connectivity

Figure 5 shows the statistical distributions of city bins for contact networks. The trends observed for the three connectivity parameters for contact networks are likewise the general trends observed in Figure 4 with a skewed lognormal for nodal degree and a normal distribution for call volume and frequency. Figure 5 shows the shift in city bin distributions for all three connectivity parameters on the right, which are the higher values of connectivity. The city bin (red) with the smallest population size, toward the left, shows that the mean communication activity is less at the individual level for cities with a relatively low population. Conversely, the city bin (green) with the maximum population size, toward the right, reveals a higher mean communication activity associated with larger city size. The subfigures in Figure 5 elaborate on the increased mean communication activity for each city bin trend. These statistical distributions clearly show that as city size increases, communication activity at the individual level also increases for the number of contacts, call frequency, and call volume. City size has a clear impact on the demeanor of individual social connectivity for contact networks markedly shown through mean shifts.

4. Discussion

Our study proposes two unsolved mysteries that are essential to understanding the universality of scaling laws for the specified definition of network and at different levels: how scaling property holds for connectivity in familiarity-based networks, and whether the interaction in these networks is impacted by population size at the individual level. This is analyzed by configuring contact networks based on familiarity and close contacts. The urban scaling connectivity property is tested at the collective level and the individual level, hence asserting that at each level, population size has an impact on social interaction. The findings show that there is an increase in the cumulative number of contacts, call frequency, and call volume based on population growth for contact networks and the baseline communication networks. However, the increase in social activity for contact networks is relatively minimal and trivial. As for the individual level, it is observed that the higher the population of the city, the higher the average communication activity. This conforms to the assertion that the bigger the city, the more the citizens consume, earn, and learn [19,46,47]. Social interaction is the driver of socioeconomic activities. Increased interaction accelerates the flow of information thereby instigating a fast economic and social life.
The findings provide a science-based understanding of the quantitative increase in human interaction based on population size in networks of close contacts. City authorities can use these estimates to formulate predictive yet practical urban plans, as social interaction is the catalyst of socioeconomic activities. Our quantified estimates would be useful in accelerating innovation process and generation of opportunities by the amplified flow of information. The estimated exponents for familiarity-based networks can exclusively help in regulating social capital as it is developed through cooperation and trust among people gaining mutual benefits from economic and social welfare. This information is also essential for mapping epidemics, as studies have shown that diseases spread in a pattern through social contacts and familiarity networks [15]. Moreover, crime can be reduced by fostering social connections and feelings of self-expression and tolerance.
Increased interaction at the individual level is a constructive sign, as individuals in large urban cities are more fragmented and isolated, which can lead to serious issues of depression, psychological disorders, and in extreme cases, suicide or crime. Increased interaction should be availed for the betterment of individuals by implementing and devising policies, such as social cohesion, which is the staple of peace building and a well-functioning society.
If city properties are mentioned, one of the features that are applicable and significant is geographical size, which raises the question of why this parameter was not used instead of population size. So, it is relevant to explain its impact on the connectivity scaling property. If geographical size of cities is considered rather the population size, there will be a noticeable difference in results. We infer the geographical parameter will not follow superlinear scaling or the increase in communication activity will not be as much as the population parameter, as some very large boundary cities have less connectivity relative to small cities showing more communication activity. Moreover, geographical size means fixed boundaries; the scaling relations are essential to study varying parameters to discern some instructive information. Population parameters vary with changing (increasing or decreasing) statistics, which drives interesting scaling relations with connectivity. Connectivity is dependent on population; the role of geographical size is trivial for connectivity.

5. Conclusions

The continuous economic and social growth of cities make them a hub of opportunity, resulting in city expansion. As city size changes, city attributes scale along with geometry, calling for effective quantitative analysis for informed urban planning. We need to understand cities to quantify these changes, which, as per the new science of cities, is through networks and the flow of information rather than physical spaces. The networks formed in cities are through homophily and familiarity with a short-span, dynamic, and distinctive nature. This makes it interesting yet instructive to study urban scaling laws on such accounts. In view of this, a familiarity-based connectivity network is configured referred to as a contact network. The influence of population growth on such networks is studied by analyzing communication activity through scaling laws. We study how the urban scaling connectivity property holds at the collective level and analyze the impact at the individual level though statistical distributions. The results show that population size scales superlinearly with communication activity for contact networks, thereby asserting an increase in connectivity with population growth for familiarity-based networks. This study provides a quantitative measure of social interaction that increases with city size. This knowledge can be used to enhance city functionality and build city policies, because social interaction is the key element that accelerates the flow of information, which encourages wealth, innovation, and opportunities. Knowing such an impact is helpful in regulating social capital as it is developed through cooperation and connection among people. The estimated impact of population increase on human interactions can be of use to predict changes in social capital or the stock market. It is also helpful in devising other functional parameters of cities, such as innovation, job creation, infrastructure, economic growth, and epidemic investigation. This study’s information is also essential at the individual level to help in developing social cohesion policies, since people living in cities may feel isolated and suffer from psychological issues due to the fast pace of cities. Therefore, increased interaction among people would be helpful for their blending in and settling into cities so they can deal with serious issues of segregation and social exclusion. The science-based understanding of the impact of population on social interaction is extensive and impacts the economic growth of cities down to each individual citizen.
Our study lacks the information about interconnectivity and reciprocation of connections that can provide broad overviews of the network. This constraint limits the in-depth analysis of many network topological features which may lead to some instructive findings. It would be interesting to see the extensive implication of network properties as a recent study has shown how two networks with similar degree distribution and in seemingly similar scenarios can result in different clustering behaviors and path length characteristics [48]. The topological features can impact the performance of an entire network. It is important to entirely investigate the network properties as ignorance to these features can significantly provide erroneous results. We have discussed the implication of the geographical size parameter instead of population size for scaling property in the previous section, and this can be tested and verified. To our knowledge, no work has reported the impact of geographical size of cities on the connectivity scaling property. It would be pertinent to study its influence and compare how it differs with population size. With the constraint of having fixed boundaries, the scaling association of geographical size with social interaction would be interesting to distinguish. Furthermore, this study does not take into account any cultural or political parameters of cities and considers connectivity irrespective of their influence. It can be studied how these parameters influence the connectivity urban scaling property for future scope.

Author Contributions

The authors contributed in the following way: conceptualization, K.-T.C.; methodology, K.-T.C. and Y.G.; validation, Y.G., Y.-S.C., and K.-T.C.; formal analysis, Y.G. and K.-T.C.; investigation, Y.G.; resources, K.-T.C.; data curation, Y.G.; writing—original draft preparation, Y.G.; writing—review and editing, Y. G. and Y.-S.C.; visualization, Y.G.; supervision, Y.-S.C.; project administration, Y.-S.C. and K.-T.C.

Funding

This research received no external funding.

Conflicts of Interest

The authors declare no conflict of interest.

References

  1. Florida, R. Cities and the Creative Class; Routledge: New York, NY, USA, 2004. [Google Scholar]
  2. Pumain, D.; Paulus, F.; Vacchiani-Marcuzzo, C.; Lobo, J. An evolutionary theory for interpreting urban scaling laws. Cybergeo 2006, 343, 1–20. [Google Scholar] [CrossRef]
  3. World Urbanization Prospects: The 2018 Revision-Highlights; United Nations: New York, NY, USA, 2018.
  4. Batty, M. A Theory of city size. Science 2013, 340, 1418–1419. [Google Scholar] [CrossRef] [PubMed]
  5. Bettencourt, L.M.A.; Lobo, J.; Helbing, D.; Kühnert, C.; West, G.B. Growth, innovation, scaling, and the pace of life in cities. Proc. Natl. Acad. Sci. USA 2007, 104, 7301–7306. [Google Scholar] [CrossRef]
  6. Bettencourt, L.M.A. The origins of scaling in cities. Science 2013, 340, 1438–1441. [Google Scholar] [CrossRef]
  7. Bettencourt, L.M.A.; Lobo, J.; Strumsky, D.; West, G.B. Urban scaling and Its deviations: Revealing the structure of wealth, innovation and crime across cities. PLoS ONE 2010, 5, e13541. [Google Scholar] [CrossRef]
  8. Batty, M. The New Science of Cities; The MIT Press: Cambridge, MA, USA, 2013; p. 520. [Google Scholar]
  9. Arbesman, S.; Kleinberg, J.M.; Strogatz, S.H. Superlinear Scaling for Innovation in Cities. Phys. Rev. E 2009, 79, 1–5. [Google Scholar] [CrossRef] [PubMed]
  10. Bettencourt, L.M.A.; Lobo, J.; Strumsky, D.; West, G.B. Urban scaling and the production function for cities. PLoS ONE 2013, 8, e58407. [Google Scholar]
  11. Büchel, K.; von Ehrlich, M. Cities and the Structure of Social Interactions: Evidence from Mobile Phone Data; CESifo Working Paper: Munich, Germany, 2017. [Google Scholar]
  12. Strano, E.; Sood, V. Rich and poor cities in Europe. An urban scaling approach to mapping the European economic transition. PLoS ONE 2016, 11, e0159465. [Google Scholar] [CrossRef]
  13. Alves, L.G.A.; Ribeiro, H.V.; Mendes, R.S. Scaling laws in the dynamics of crime growth rate. Physica A 2013, 392, 2672–2679. [Google Scholar] [CrossRef]
  14. Oliveira, M.; Bastos-Filho, C.; Menezes, R. The scaling of crime concentration in cities. PLoS ONE 2017, 12, e0183110. [Google Scholar] [CrossRef] [PubMed]
  15. Tizzoni, M.; Sun, K.; Benusiglio, D.; Karsai, M.; Perra, N. The scaling of human contacts and epidemic processes in metapopulation networks. Sci. Rep. 2015, 5, 15111. [Google Scholar] [CrossRef]
  16. Bettencourt, L.M.A.; Lob, J.; Youn, H. The hypothesis of urban scaling: Formalization, implications and challenges. arXiv 2013, arXiv:1301.5919. [Google Scholar]
  17. Bettencourt, L.M.A.; Lobo, J.; West, G.B. Why are large cities faster? Universal scaling and self-similarity in urban organization and dynamics. Eur. Phys. J. B 2008, 63, 285–293. [Google Scholar] [CrossRef]
  18. Batty, M. The Size, Scale, and Shape of Cities. Science 2008, 319, 769–771. [Google Scholar] [CrossRef]
  19. Bettencourt, L.M.A.; West, G. A unified theory of urban living. Nature 2010, 467, 912–913. [Google Scholar] [CrossRef] [PubMed]
  20. Li, R.; Dong, L.; Wang, X.; Wang, W.-X.; Di, Z.; Stanley, H.E. Simple spatial scaling rules behind complex cities. Nat. Commun. 2017, 8, 1841. [Google Scholar] [CrossRef]
  21. Keeling, M.J.; Rohani, P. Modeling Infectious Diseases in Humans and Animals; Princeton Univeristy Press: Princeton, NJ, USA, 2008. [Google Scholar]
  22. Pan, W.; Ghoshal, G.; Krumme, C.; Cebrian, M.; Pentland, A. Urban characteristics attributable to density-driven tie formation. Nat. Commun. 2013, 4, 1961. [Google Scholar] [CrossRef]
  23. Rybski, D.; Buldyrev, S.V.; Havlin, S.; Liljeros, F.; Makse, H.A. Scaling laws of human interaction activity. Proc. Natl. Acad. Sci. USA 2009, 106, 12640–12645. [Google Scholar] [CrossRef]
  24. Sveikauskas, L. The productivity of cities. Q. J. Econ. 1975, 89, 393–413. [Google Scholar] [CrossRef]
  25. Charlot, S.; Duranton, G. Communication Externalities in Cities. J. Urban Econ. 2004, 56, 581–613. [Google Scholar] [CrossRef]
  26. Jessica, B. The Built Environment and Social Interactions: Evidence from Panel Data. Available online: https://www.sauder.ubc.ca/Faculty/Research_Centres/Centre_for_Urban_Economics_and_Real_Estate/News_and_Events/~/media/Files/Faculty%20Research/3%20SunBurleySocialInteractionsUBC%201.ashx (accessed on 30 May 2015).
  27. Schlapfer, M.; Bettencourt, L.M.A.; Grauwin, S.; Raschke, M.; Claxton, R.; Smoreda, Z.; West, G.B.; Ratti, C. The scaling of human interactions with city size. J. R. Soc. Interface 2014, 11. [Google Scholar] [CrossRef]
  28. Herrera-Yagüe, C.; Schneider, C.M.; Couronné, T.; Smoreda, Z.; Benito, R.M.; Zufiria, P.J.; González, M.C. The anatomy of urban social networks and its implications in the searchability problem. Sci. Rep. 2015, 5, 10265. [Google Scholar] [CrossRef]
  29. Miritello, G.; Lara, M.; Cebrian, M.; Moro, M. Limited communication capacity unveils strategies for human interaction. Sci. Rep. 2013, 3, 1950. [Google Scholar] [CrossRef]
  30. Saramäki, J.; Leicht, E.; López, E.; Roberts, S.; Reed-Tsochas, F.; Dunbar, R. Persistence of social signatures in human communication. Proc. Natl. Acad. Sci. USA 2014, 111, 942–947. [Google Scholar] [CrossRef]
  31. Jacobs, J. The Death and Life of Great American Cities; Random House: New York, NY, USA, 1961. [Google Scholar]
  32. Wirth, L. Urbanism as a way of life. Am. J. Sociol. 1938, 44, 1–24. [Google Scholar] [CrossRef]
  33. O’Malley, A.J.; Arbesman, S.; Steiger, D.M.; Fowler, J.H.; Christakis, N.A. Egocentric Social network structure, health, and pro-social behaviors in a national panel study of Americans. PLoS ONE 2012, 7, e36250. [Google Scholar] [CrossRef]
  34. Blondel, V.D.; Decuyper, A.; Krings, G. A survey of results on mobile phone datasets analysis. EPJ Data Sci. 2015, 4. [Google Scholar] [CrossRef]
  35. Deville, P.; Linard, C.; Martine, S.; Gilbert, M.; Stevensf, F.; Gaughanf, A.; Blondela, V.D.; Tatem, A.J. Dynamic population mapping using mobile phone data. Proc. Natl. Acad. Sci. USA 2014, 111, 15888–15893. [Google Scholar] [CrossRef]
  36. Seshadri, M.; Machiraju, S.; Sridharan, A.; Bolot, J.; Faloutsos, C.; Leskove, J. Mobile call graphs: Beyond power-law and lognormal distributions. In Proceedings of the 14th ACM SIGKDD, Las Vegas, NV, USA, 24–27 August 2008; pp. 596–604. [Google Scholar]
  37. Whoscall. Available online: https://whoscall.com/en-US/ (accessed on 17 January 2015).
  38. Shang, Y. Subgraph robustness of complex networks under attacks. IEEE Trans. Syst. Man Cybern. Syst. 2019, 49, 821–832. [Google Scholar] [CrossRef]
  39. Shang, Y. Consensus in averager-copier-voter networks of moving dynamical agents. Chaos 2017, 27, 023116. [Google Scholar] [CrossRef]
  40. Arcaute, E.; Hatna, E.; Ferguson, P.; Youn, H.; Johansson, A.; Batty, M. Constructing cities, deconstructing scaling laws. J. R. Soc. Interface 2015, 12. [Google Scholar] [CrossRef]
  41. Cottineau, C.; Hatna, E.; Arcaute, E.; Batty, M. Paradoxical interpretations of urban scaling laws. arXiv 2015, arXiv:1507.07878. [Google Scholar]
  42. Second-Level Administrative Country Subdivisions. Available online: http://www.fao.org/geonetwork/srv/en/metadata.show?id=12691&currTab=simple (accessed on 10 March 2016).
  43. Baumeister, R.; Leary, M. The need to belong: Desire for interpersonal attachments as a fundamental human motivation. Psychol. Bull. 1995, 117, 497–529. [Google Scholar] [CrossRef] [PubMed]
  44. Kawamichi, H.; Sugawara, S.K.; Hamano, Y.H.; Makita, K.; Kochiyama, T.; Sadato, N. Increased frequency of social interaction is associated with enjoyment enhancement and reward system activation. Sci. Rep. 2016, 6, 24561. [Google Scholar] [CrossRef] [PubMed]
  45. Holt-Lunstad, J.; Timothy, B.S.; Layton, J.B. Social relationships and mortality Risk: A meta-analytic review. PLoS Med. 2010, 7, e1000316. [Google Scholar] [CrossRef] [PubMed]
  46. Glaeser, E. Cities, productivity, and quality of Life. Science 2011, 333, 592–594. [Google Scholar] [CrossRef]
  47. Glaeser, E.L. Learning in cities. J. Urban Econ. 1999, 46, 254–277. [Google Scholar] [CrossRef]
  48. Shang, Y. Distinct clusterings and characteristic path lengths in dynamic small-world networks with Identical limit degree distribution. J. Stat. Phys. 2012, 149, 505–518. [Google Scholar] [CrossRef]
Figure 1. Whoscall user distribution on maps of Japan and Taiwan.
Sustainability 11 02545 g001
Figure 2. Connectivity parameters scaling with population size. (a) Superlinear scaling of degree, call frequency, and call volume with city size for proposed contact networks. (b) The connectivity scaling property observed for communication networks that include random communications.
Sustainability 11 02545 g002
Figure 3. Power-law scaling exponents for different countries for the nodal degree, number of calls, and call volume for the contact networks. The dotted line is the common scaling exponent value for social interaction drawn at β ≈ 1.15.
Sustainability 11 02545 g003
Figure 4. Individual social connectivity distribution for parameters k, w, and v.
Sustainability 11 02545 g004
Figure 5. Individual interaction-based probability distribution for contact networks. The insets show the increasing mean values μk*, μw*, and μv* for the three ranked city bins. The city bin with the highest population has a higher mean communication activity for all three connectivity parameters.
Sustainability 11 02545 g005

