Article

A Calculation Model for CO2 Emission Reduction of Energy Internet: A Case Study of Yanqing

1
Beijing Key Laboratory of New Energy and Low-Carbon Development, North China Electric Power University, Beijing 102206, China
2
School of Economics and Management, North China Electric Power University, Beijing 102206, China
*
Author to whom correspondence should be addressed.
Sustainability 2019, 11(9), 2502; https://doi.org/10.3390/su11092502
Submission received: 26 February 2019 / Revised: 19 April 2019 / Accepted: 20 April 2019 / Published: 29 April 2019

Abstract

:
This paper takes the regional energy internet as the research object, and combines the power system, primary energy system, transportation system, and thermal energy system to give the system boundary. First, the mathematical decomposition method and the logical integration method were combined to decompose the total low-carbon capability into seven single low-carbon capabilities. On the basis of the mechanism of carbon emission reduction, a comprehensive calculation model for CO2 emissions reduction of the energy internet was then established. Finally, taking the Yanqing Energy Internet Demonstration Zone in China as an example, it was calculated that the model could reduce CO2 emissions by 14,093.19 tons in 2025. The results show that the methods adopted in this paper avoided the overlap calculation reasonably well; the comprehensive calculation model of CO2 emissions reduction has strong versatility, and can quantitatively calculate the carbon emission reduction amount for any completed or planned energy internet. Among the seven low-carbon capabilities, “replacement of gasoline with electricity” had the highest contribution rate, with a value of 42.62%, followed by “renewable energy substitution” (37.13%). The innovations in this paper include: (1) The problem of reasonable splitting of the overlapping parts in carbon emission reduction calculations being solved. (2) The first comprehensive calculation model of CO2 emission reduction on the energy internet being established. (3) The contribution of the seven low-carbon capabilities of the energy internet to total emissions reduction being clarified.

1. Introduction

At present, fossil fuel combustion is the world’s main mode of energy generation. The carbon dioxide generated from this process accounts for more than 70% of the total concentration of greenhouse gases emitted, causing serious problems in resources, the environment, and climate change. These problems have triggered global action towards energy conservation and emissions reduction. The Paris Climate Conference reached an agreement to keep the increase in global temperature below 2 °C [1]. Most of China’s CO2 emissions are related to energy consumption in its cities [2]. In order to reach target CO2 emissions by 2026, China needs to decrease energy and carbon intensity levels by 43% and 45%, respectively, from 2015 to 2030 [3].
The energy internet, emerging under the trend of energy conservation and emissions reduction, is a new, integrated energy utilization system, including renewable energy, distributed generation, hydrogen storage technology, electric vehicles (EVs), and internet technology [4]. It has the following characteristics: cross-complementation of multiple energy sources; deep coupling of multiple systems; support of multiple new technologies; and two-way interaction of energy flow and information flow [5,6]. The energy internets in different regions all have the above characteristics, but their coverage and emphases are different. The micro energy internet is a complex of microgrids and integrated energy centers, equivalent to an energy local area network (LAN) [7,8]. A microgrid is more focused on a small power distribution system. The global energy internet is composed of several micro energy internets connected by an ultra-high voltage (UHV) grid [9]. Because the energy internet has such characteristics, it could play an important role in energy structure adjustment, energy conservation, and emissions reduction. First of all, the establishment of a carbon emissions reduction capacity assessment system could effectively make use of a significant contribution from the energy internet in this respect. Secondly, the energy internet needs a large amount of investment, covers a wide range of fields, and has a long construction period. Defining the effects it could have on low-carbon development is of great significance for guiding rational planning and scientific investment.
At present, there is much literature on the study of the energy internet, mainly on conceptual frameworks, key equipment, core technologies, and market operations. However, the specific research content and analysis angles are different. The more systematic research has focused on the following aspects:
From the perspective of grid acceptance, grid-connected coordination of distributed equipment and power electronics technology has been studied. The stability of a power system can be improved by coordinating the planning of distributed devices across a wide area, but attention should be paid to energy management, reactive power, and voltage control of the intelligent distribution network or microgrid [10]. Shukla proposed a small-signal stability-constrained distribution system reconfiguration (DSR) methodology to deal with uncertainties associated with the load demand and the power output of renewable energy based distributed generation [11]. Yao et al. used the “stratified optimization” strategy and the “distributed optimization” strategy as the main methods to model the coordinated optimization problem of large-scale distributed equipment [12]. The optimization degree of distributed devices will affect the efficiency of resource utilization in the energy internet. The breakthrough of power electronics technology has provided a strong impetus for the development of smart grids and the energy internet. Huang et al. proposed a plug-and-play future distribution system architecture for distributed renewable energy and distributed energy storage devices [13]. A solid-state transformer can support distributed power supply and energy storage equipment to access a distribution network through a high-frequency power electronic interface [14]. UHV flexible direct current (DC) technology, which is being widely studied at present, is the backbone technology of the energy internet [15]. The realization of these technologies has also become a link of system coupling in the energy internet, which provides a reference for the following research on the system coupling relationship.
From the perspective of energy dispatch and utilization, the optimal scheduling of low-carbon energy was studied. Li et al. proposed a zero-carbon emission micro energy internet (ZCE-MEI) architecture by introducing a non-supplementary fired compressed air energy storage (NSF-CAES) hub to achieve joint scheduling of clean power and thermal energy [16]. Based on a software defined network (SDN), Hou et al. utilized a new heuristic approach to design effective decisions for energy transport and storage collaboration [17]. As the background of economic dispatch (ED) in renewable integration systems, Tong et al. presented a new distributionally robust optimization (DRO) ED framework (DRED) [18]. Zhou et al. used a three-stage Stackelberg game theory and big data to solve the problem of coordinated management of renewable energy and traditional energy [19]. In this paper, the mechanisms used for energy saving and emission reduction on the power side of the energy internet were based on the aforementioned research on the clean scheduling of low-carbon energy.
From the perspective of the supporting role of information technology in the energy internet, internet technology and communication technology were studied. Xu et al. introduced the architecture and communication performance of energy routers that were used to regulate key devices in the energy internet [20]. Tapscott and Wu introduced the principles and characteristics of blockchain technology and its application for the energy internet [21,22]. Pan et al. introduced the significant impact of the application for the Internet of Things on improving energy efficiency [23]. Huang proposed the concept of the future renewable electric energy delivery and management (FREEDM) system and studied its framework and feasible technologies [24]. In addition, there is also some literature from the perspective of energy data analysis to explore the market operation of the energy internet [25]. These technologies and operation modes promote the coupling and energy trading among the transportation system, energy storage system, natural gas system, and power system on the user side, which are the basis of the mechanism analysis of energy saving and emissions reduction on the user side.
From the research directions mentioned above, the research on the energy internet mainly focused upon factors such as the conceptual framework, key equipment, core technology, and market operation. The literature on comprehensively studying the capacity of energy-saving and emissions reduction of the energy internet and its quantitative calculations does not yet exist. The research results of grid-connected coordination of distributed devices, optimized scheduling of low-carbon energy, and market operation in the energy internet have laid a good foundation for analyzing the energy-saving and emission reduction mechanisms of the energy internet in this paper.
The energy internet is an extension of the power system, and many scholars have conducted quantitative research on the low-carbon capabilities of the power system. Most of the existing research focuses on specific technologies and projects to calculate low carbon benefits by introducing some low carbon elements such as wind power [26], carbon capture and storage (CCS) [27], biomass power generation [28], and photovoltaics [29]. In the study of the analysis method and technical route, Zhou established a standardized assessment model for low-carbon benefits of the grid to achieve quantitative analysis of different transmission networks and different energy transmission modes [30]. Based on the demand for a low carbon benefit assessment system of the smart grid in China, Jia et al. proposed another technical route from low carbon capacity assessment to low carbon efficiency [31]. This is roughly consistent with the technical route of this paper. In the selection of low-carbon factors or capabilities, almost all existing literature has applied qualitative methods to decompose the comprehensive low-carbon capabilities of power systems. Cao et al. considered that the low-carbon factors of the power system included demand-side management, smart grid technology, low-carbon power generation technology, low-carbon energy utilization, and low-carbon power dispatch [32]. Through the analysis of energy-saving and emissions reduction capabilities of the smart grid, Zhou et al. directly listed several low-carbon capabilities: power optimization comprehensive capacity, power grid efficiency comprehensive capacity, load shaping comprehensive capacity, and user energy-saving comprehensive capacity [33]. Based on the above qualitative methods, this paper combined quantitative methods to separate the low-carbon capability of the energy internet. For the modeling method of comprehensive low-carbon benefits calculation of power system, Li et al. predicted the carbon emissions of power industry by linear smoothing method, and calculated the cost and benefits based on the carbon emission price [34]. Ridge regression analysis is a commonly used modeling method for carbon emissions prediction in the power industry [35]. In addition, some literature has quantitatively calculated the low-carbon benefits by using mathematical formulas. For example, Kang et al. deeply excavated and analyzed the coupling relation among the individual capabilities through the logical method, and proposed a comprehensive low-carbon capability evaluation model [36]. Cai et al. elaborated the power load shaping ability which is caused by user interaction from three aspects of the electric vehicle, energy storage technology, and peak-load shifting, and then established the calculation model for load shaping ability [37]. The mathematical formula method is a relatively simple and direct method used to calculate low-carbon capability. The low-carbon calculation method of power system provides a reference for the study in this paper.
In summary, the technical route, the selection of low-carbon factors, the quantitative calculation model of load-shaping ability, and the comprehensive evaluation model provide a good reference for in-depth study of carbon emissions reduction of the energy internet in this paper. At the same time, the comprehensive low-carbon estimation models of the power system in the research above noticed that the overlapping effect should be eliminated, but they were only the result of classification in theory. Moreover, there was no guarantee that the part of the overlap calculation was completely eliminated. However, some ideas from these results have given great inspiration to this paper. Therefore, this paper intended to study the calculation of carbon emissions reduction in the energy internet based on the research results above, and tried to solve the problem of overlap in the calculation model.
The regional energy internet is the basic unit and foundation of the global energy internet. There are many pilot projects focusing on the regional energy internet which have been constructed. Therefore, this paper took the regional energy internet as the research object, and used the combination of the power system, primary energy system (mainly the renewable energy system and natural gas system), transportation system, and thermal energy system to give the system boundary.
The paper aimed to solve the following problems: (1) To solve the problem of overlapping calculation, and divide the total low-carbon capacity into several single low-carbon capacities; (2) Based on the comprehensive analysis of the energy saving and emissions reduction generated by the coupling of various subsystems, establish a comprehensive calculation model of CO2 emissions reduction of the energy internet; (3) Analyze the contribution of each of the low-carbon capabilities to CO2 emissions reduction.

2. Methods

2.1. Technical Route

The energy internet is centered on the power system and consists of various energy systems and users. The power system, primary energy system, transportation system, and thermal energy system are deeply coupled and interact within in the energy internet. The energy internet has changed the mode of human energy utilization mainly in the power system and transportation system, and realized the clean utilization of energy. In the power system, coal-fired power is replaced by clean energy (renewable energy and natural gas) power. In the transportation system, gasoline is replaced by electricity and natural gas. In addition, the user’s ability to interact in various systems also promotes the energy-saving and emissions reduction.
In order to effectively avoid the overlapping calculation, this paper combined the mathematical decomposition method and the logic integration method to study the CO2 emissions reduction of the energy internet. The energy internet and users were used as the main body, and they were divided into three basic components (power supply side, power grid side, and demand side). The mathematical decomposition method and logical integration method were used to decompose the total low-carbon capacity into seven single low-carbon capacities. Then, based on the analysis of the mechanisms, the carbon emissions reduction caused by each sub-capacity were calculated separately. Finally, a comprehensive calculation model for CO2 emissions reduction of energy internet was established. The combination of the two methods not only ensured the comprehensiveness of the model calculation angle but also avoided the calculation overlap. The idea framework is shown in Figure 1.

2.1.1. Mathematical Decomposition Method

From the perspective of the power system, the core hub of the various systems within the energy internet, three processes are mainly included: power generation, transmission and distribution, and power consumption. First, this paper calculated the carbon dioxide emissions of the power system coupled with other systems. For research convenience, this paper specified that clean energy includes renewable energy and natural gas. Nuclear power generation will not be considered for the time being.
The emissions of clean energy generation were assumed as negligible. Then, the total CO2 emissions reduction in the j-year compared to the base year is calculated as α0x0αjxj, and it is easy to derive the following equation:
α 0 x 0 α j x j = ( y j y 0 ) α 0 + ( p 0 q 0 ) ( p j q j ) α 0 + ( q 0 q j ) α 0 + ( α 0 x j α j x j )
Summarize each emissions reduction capacity in Equation (1) above:
  • (yjy0)α0 indicates the CO2 emissions reduction generated by the increased amount of clean energy generation.
  • [(p0q0) − (pjqj)]α0 represents the CO2 emissions reduction caused by the reduction in the loss of the transmission line.
  • (q0qj)α0 indicates the CO2 emissions reduction (positive or negative) due to the amount of power saving (negative power saving).
  • α0xjαjxj indicates the CO2 emissions reduction due to the decrease in the emission coefficient of the thermal power unit.
Therefore, under ideal conditions, the CO2 emissions reduction brought by the coupled system under the influence of all social factors can be decomposed into four parts: (1) The carbon emissions reduction caused by the replacement of thermal power by clean energy power. (2) The carbon emissions reduction caused by the reduction of transmission line losses. (3) Total amount of power consumption reduction (or increment). (4) Emissions reduction caused by the reduction of the carbon emission coefficient of thermal power units.

2.1.2. Logical Integration Method

The four parts listed above, which were separated by mathematical models, have covered the emissions reduction generated by the coupling of the primary energy system, transportation system, thermal system and power system. Next, the emissions reduction of “replacing gasoline with natural gas” formed by the coupling of the natural gas system and transportation system, and the emissions reduction of “replacing gasoline with electricity” formed by the coupling of the power system and transportation system need to be considered. In addition, the interactive peak-load shifting and energy-saving effects of users on the demand side should also be considered.
After the comprehensive analysis of the mathematical decomposition method and the logical integration method, the CO2 emissions reduction capability of the energy internet can be divided into seven parts. They are “renewable energy substitution”, “natural gas substitution”, “line loss reduction”, “energy saving”, “load shaping”, “replacing gasoline with natural gas”, and “replacing gasoline with electricity”. Among them, “renewable energy substitution” refers to the substitution of renewable energy for coal to generate electricity. “Natural gas substitution” refers to the substitution of natural gas for coal to generate electricity. “Line loss reduction” refers to the reduction of power transmission and distribution losses. “Load shaping” is a technique that describes the process of changing the timing of your energy consumption to take advantage of low energy prices when they occur, or avoid times of high prices. This paper will establish the calculation model of CO2 emissions reduction from the power supply side, power grid side, and demand side. The research model is shown in Figure 2.
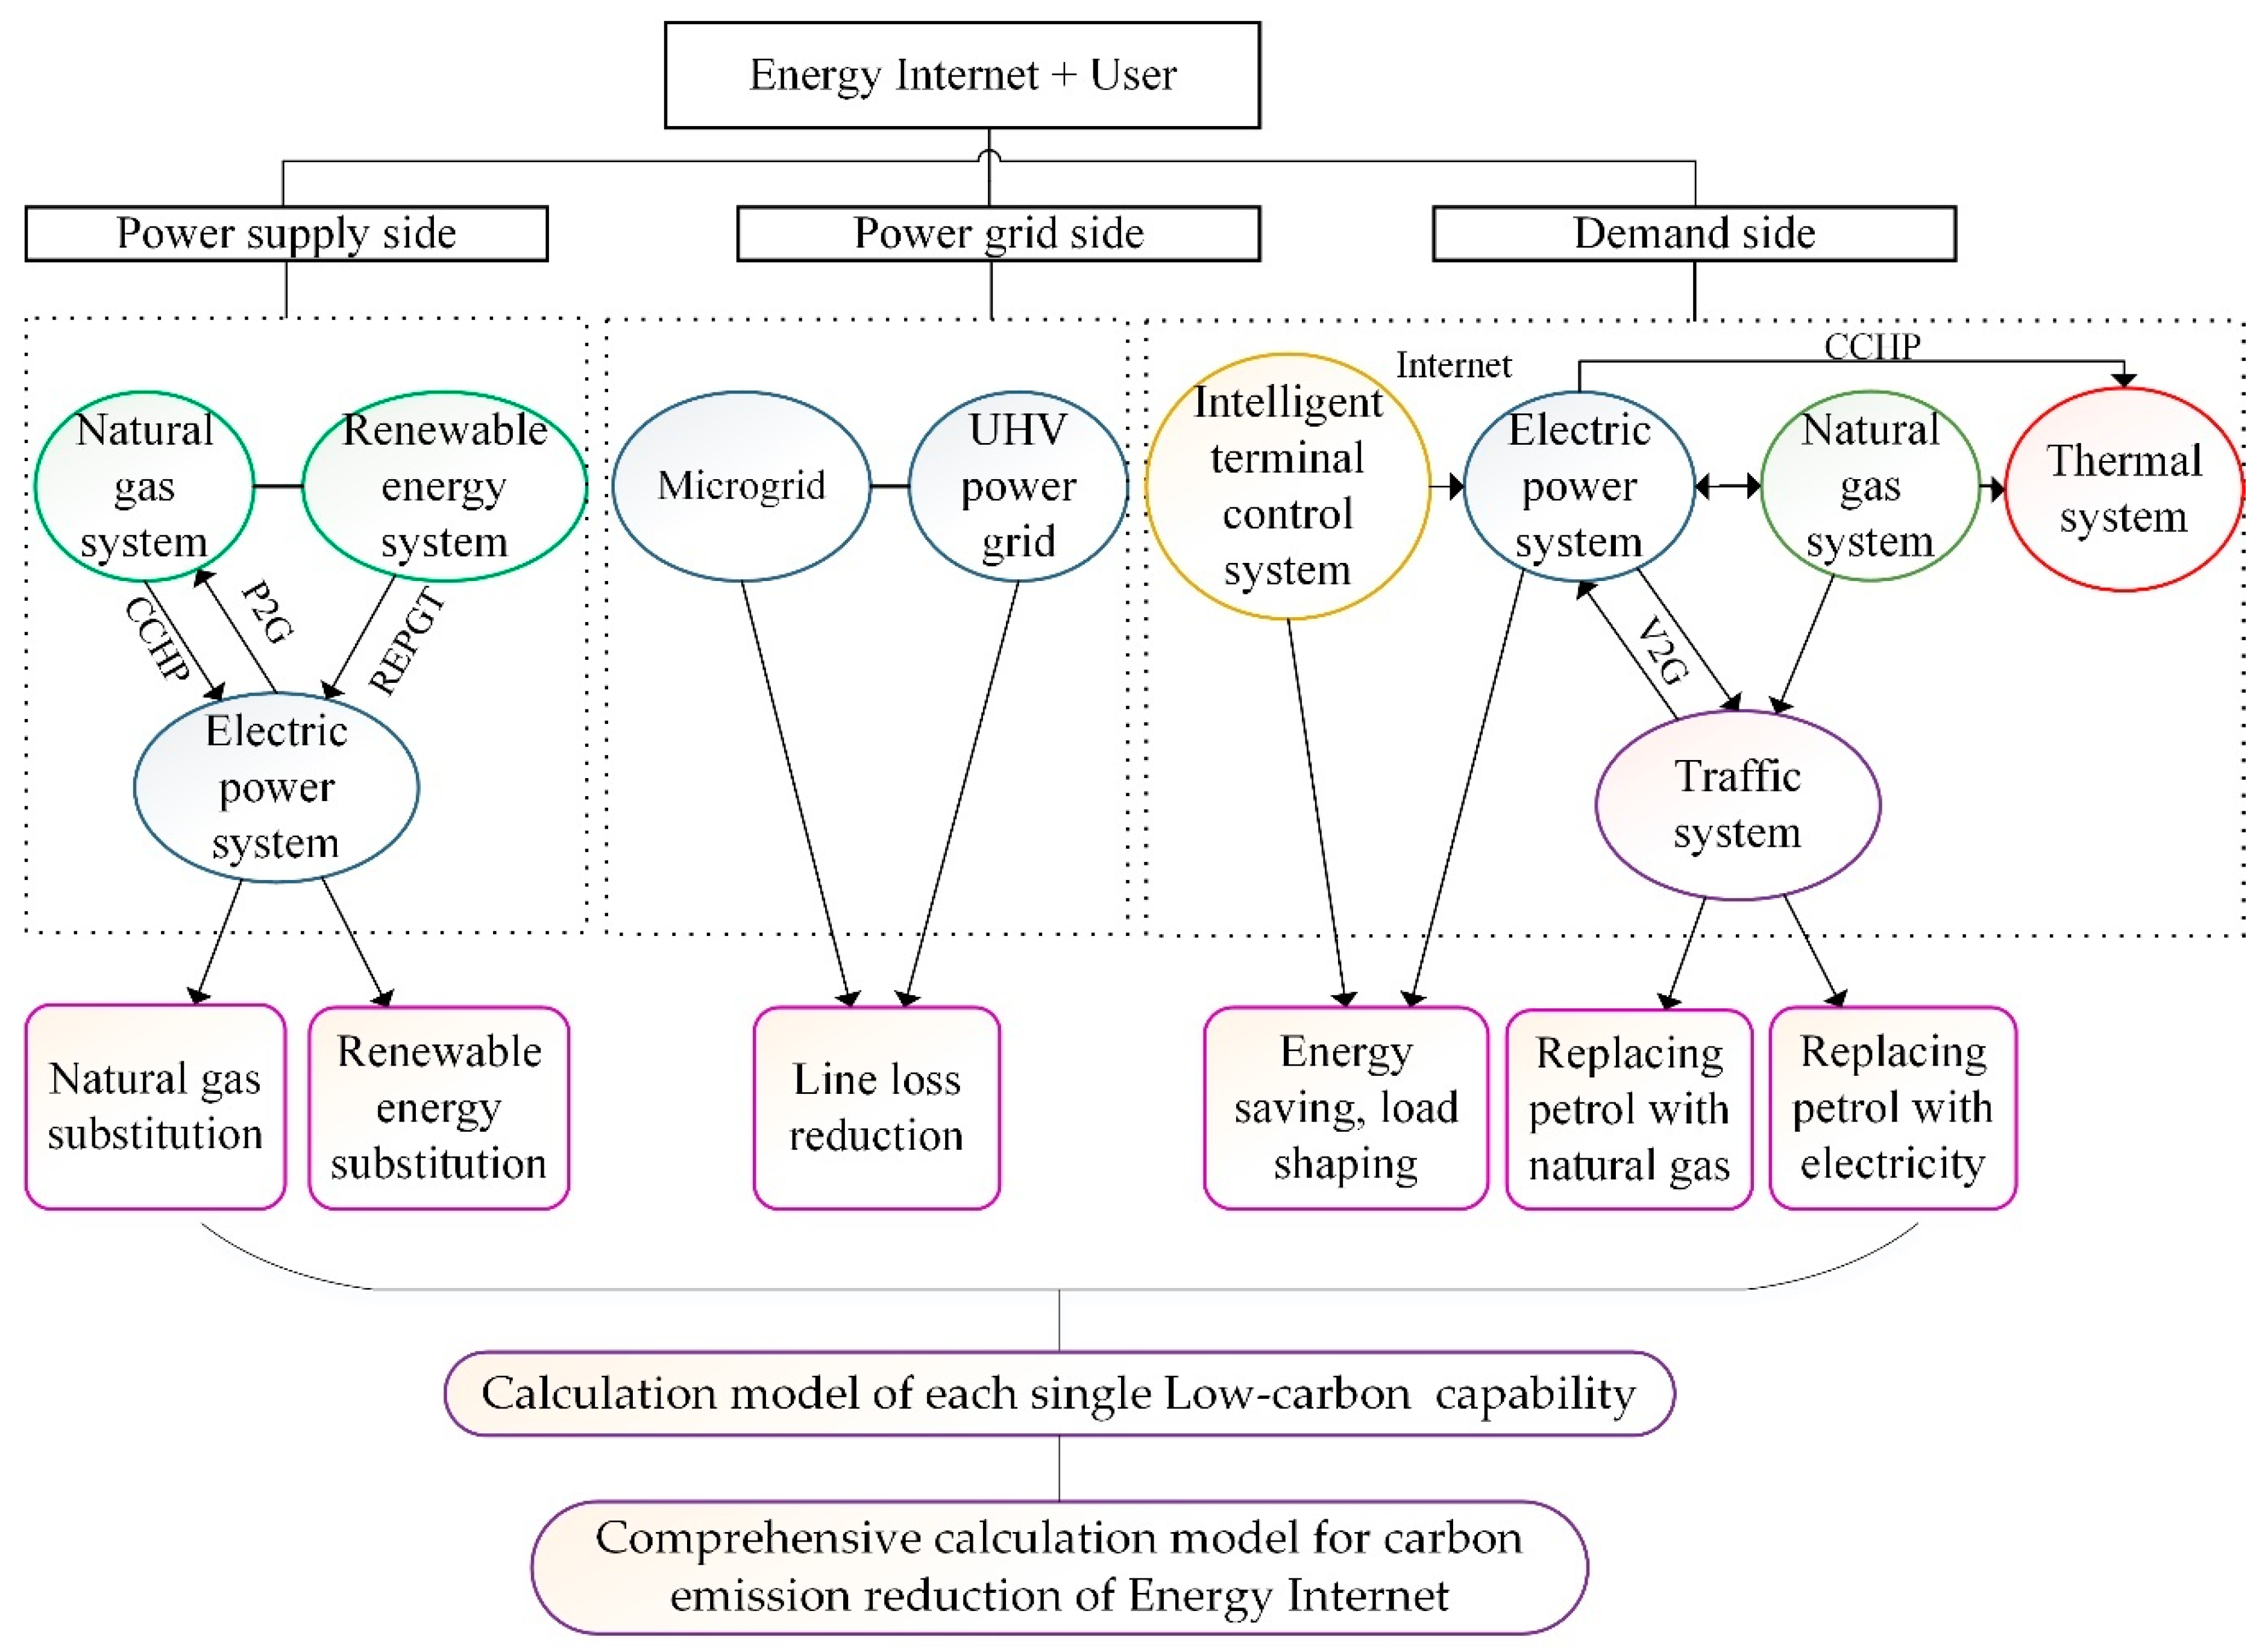
At the same time, as can be seen from Figure 2, on the power supply side, renewable energy systems and natural gas systems constitute a primary energy system. As the core and hub of the energy internet, the power system is coupled with the distributed renewable energy system through REPGT; it is coupled to the natural gas system through natural gas power generation and P2G technology. On the power supply side, the coupling makes the energy internet have two low-carbon capabilities: renewable energy substitution and natural gas substitution. The micro grid and the UHV grid constitute the basic structure of the power grid in the energy internet. The change of power grid structure makes line loss reduce and energy transmission efficiency higher. On the user side, the power system is coupled to the transportation system through V2G; it is coupled with the natural gas system and the thermal (cold) system through CCHP. Therefore, the energy transformation of the transportation system has brought about two low-carbon capabilities: replacing gasoline with natural gas and replacing gasoline with electricity. With the internet as the medium, the intelligent terminal control system can control and adjust the power system, which is helpful to realize energy saving and power load shaping. The coupling of the information system and the physical system enables the energy flow and the information flow to interact in both directions, and also optimizes the resource allocation, thereby achieving energy saving and emissions reduction as a whole.

2.2. Calculation Model of CO2 Emission Reduction on Power Supply Side

2.2.1. Mechanism Analysis of Energy Saving and Emission Reduction on Power Supply Side

Under the energy internet system, the use of clean energy reduces the consumption of fossil energy. Compared to current energy systems, the energy internet facilitates distributed renewable energy consumption through multi-physical system coupling, and improves clean energy allocation efficiency through micro-balanced scheduling. It plays an important role in promoting the consumption of renewable energy at different levels.
Clean energies in the energy internet mainly include renewable energy and natural gas. The penetration rate of natural gas in the power generation industry tends to increase. P2G, CCHP, and renewable energy generation technologies enable direct coupling between the power system and clean energy system. At the same time, with the development of technology, energy storage equipment and energy routers have become two important parts of the energy internet. Based on technologies such as cloud computing and big data analysis, the prediction accuracy of renewable energy generation capacity is greatly improved, and the capacity of power supply for peak shaving or energy storage equipment is reduced [38]. The application of various technologies in the energy internet has deepened the degree of coupling of various physical systems. The control system with the energy router as the main body can improve the configuration efficiency of clean energy through micro-balance scheduling. The energy internet can support the coordinated operation of multiple energy sources [39]. In general, the replacement of traditional coal by distributed renewable energy and natural gas makes the energy internet ultimately achieve carbon emission reduction.

2.2.2. Renewable Energy Substitution

The energy internet has formed a substitution of renewable energy on traditional thermal power. Assume that the initial point of the calculation period is the 0-th year. The termination point is the j-th year. Assume that the increment in clean energy generation is equal to the decrement in coal-fired power generation. Referring to the method of low-carbon calculation on the power supply side of the smart grid [31], the calculation model for CO2 emissions reduction is shown in Equation (2):
S j , 1 = σ ε [ i = 1 n ( Δ Q i r e n e w ρ i r e n e w ) ]

2.2.3. Natural Gas Substitution

Natural gas power generation emits almost no sulphur dioxide and soot. The carbon dioxide emissions of the CCHP system fueled by natural gas are only one fourth of those of coal-fired power generation. Therefore, this paper attempts to establish a low-carbon calculation model for natural gas substitution. CO2 emissions reduction generated by the replacement of traditional coal-fired power by gas-fired power are expressed in Equation (3):
S j , 2 = 3 4 σ ε Δ Q g a s ρ g a s

2.3. Calculation Model of CO2 Emission Reduction on the Power Grid Side

2.3.1. Mechanism Analysis of Energy Saving and Emission Reduction on Power Grid Side

The energy transformation concept of the energy internet has triggered the transformation of traditional power grids, and the grid structure has become more distributed and flattened. The concepts of energy consumption and sharing brought about by the marketization of electricity have made the permeability of the microgrid higher [40]. As the smallest energy network in the energy internet, the microgrid with flexible DC transmission as the main technology is also the core node of the power distribution system in energy internet. It can connect a variety of distributed devices such as distributed power supplies, energy storage facilities, and loads to achieve self-control and management within the region. The UHV power grid, which is the backbone of the energy internet grid, plays a key role in forming a wider range of connections between local distribution networks [41].
The distributed power supply in the microgrid is close to the power load, which greatly shortens the power supply distance and reduces the power loss during the transmission process. The long-distance UHV power grid increases the voltage operating level and simplifies the grid structure. Flexible DC technology has achieved breakthrough applications in microgrids and UHV grids because of its advantages in reducing commutation links. The combination of the UHV power grid and microgrid forms the overall grid architecture of the energy internet. Through the improvement of energy transmission efficiency, the capability of energy saving and emissions reduction have been promoted.

2.3.2. Line Loss Reduction

After optimizing the modeling method of line loss reduction of power grid by Jia et al. [31] and Chen et al. [42], the low-carbon estimation model of micro-grid is obtained. Microgrid permeability is defined as the ratio of the DC power that a renewable energy generation system penetrates to the grid to the maximum power of the grid [43]. The line loss reduction factor of the microgrid in the j-th year is shown in Equation (4):
α j , m p g = θ j , m p g Δ δ m p g
where θj,mpg is the permeability of the microgrid in the j-th year. The penetration rate for the base year is defined as θ0,mpg. Assuming that the penetration rate increases exponentially with the year, Equation (5) can be obtained.
θ j , m p g = θ 0 , m p g e j
Similarly, in the j-th year, the line loss reduction factor of the UHV power grid is shown in Equation (6):
α j , e h v = i = 1 n θ j , i , e h v Δ δ i , e h v
where θj,i,ehv is the permeability of the UHV grid in different voltage grades in the j-th year, as shown in Equation (7):
θ j , i , e h v = θ 0 , i , e h v e j
Therefore, the CO2 emissions reduction caused by the reduction of line loss in the energy internet is shown in Equation (8). Assume that the reduced power loss is equal to the reduced power generation of coal-fired units.
S j , 3 = σ ε ( α j , m p g + α j , e h v ) Q j p

2.4. Calculation Model of CO2 Emission Reduction on the Demand Side

2.4.1. Mechanism Analysis of Energy Saving and Emission Reduction on Demand Side

In the energy internet, with the application for information technology and the reform of power market, the traditional energy trading mode has changed. Both energy producers and consumers will participate in market competition [44]. Equipment, energy, and services can be traded freely, and the role of the market in energy production and consumption will become more prominent [45].
In the energy consumption terminal, the energy internet gradually realizes the replacement of fossil energy such as coal and gasoline with electricity. This increases the proportion of electrical energy in the terminal energy consumption, reducing environmental pollution and greenhouse gas emissions. The coupling effect of power system, natural gas system, transportation system, and heating system on the demand side is reflected in the following three aspects: (1) Energy-saving can be achieved through wide-area energy sharing, transparent information and other new electricity-using modes as a whole; (2) Load shaping can be achieved by the promotion of energy storage equipment and user interaction, so that the energy consumption of power system can be reduced; (3) Electrification of terminals, a clean energy-using mode, can reduce pollutant emissions.

2.4.2. Energy Saving

The widespread use of smart meters in the energy internet has made electricity information transparent and reduced overall power demand. As a kind of “generalized load”, electric vehicles will play a negative power saving role in the energy internet.
Focusing on the energy-saving potential of user interaction brought by smart meters, this paper defines the interactive energy-saving factor for the j-th year, as shown in Equation (9):
λ j , 1 = i = 1 4 χ i , j υ i ϕ i , j
According to Kang et al.’s modeling method [36], the negative energy-saving factor of the electric vehicle is defined as shown in Equation (10):
λ j , 2 = Q j c a r Q j p ( 1 δ )
where Qjcar is the increased electricity consumption of electric vehicles in the j-th year compared to the base year, as shown in Equation (11):
Q j car = β Δ Q j car
The comprehensive energy-saving capability is embodied by the interactive energy-saving ability of users and the negative energy-saving ability based on electric vehicles. Its factor for the j-th year is shown in Equation (12):
Δ ϖ j = 1 ( 1 λ j , 1 ) ( 1 + λ j , 2 )
Therefore, the power saved in the j-th year is as shown in Equation (13). Assume that the amount of energy savings is equal to the reduction in power generation by coal-fired units, and the emissions reduction from the energy saving in the j-th year can be written in Equation (14).
Δ Q j = Δ ϖ j Q j p ( 1 δ )
S j , 3 = σ ε Δ Q j

2.4.3. Load Shaping

In the energy internet, various energy storage facilities and information and communication technologies (ICT) have been vigorously developed. Orderly access of various “generalized loads”, effective demand side management, and demand response can reduce the peak-to-valley difference of the load curve by optimizing the electrical load of the entire grid. Therefore, the consumption of the power system is reduced.
There are three main ways in which the energy internet can achieve load shaping: (1) Smart meters based on technologies such as the Internet of Things (IoT), cloud computing, and big data, that provide users with comprehensive information about electricity metering and electricity price. It is beneficial for users to reasonably arrange their electricity usage period [46]. (2) With the construction of the energy internet, EVs will become important interactive devices on the load side. A reasonable charging price will guide the EV to charge reasonably in time and space [47]. (3) The energy storage system can realize the decoupling between the power supply side and the load side to shift the peak load. The energy storage system is used to realize the energy storage in the low valley load period to meet the peak load demand, and effectively ease the peak electricity usage.
Attention must be paid to the ability of user interaction based on smart meters to shift peak load. This paper attempts to model the peak-shifting ability factor caused by user interaction for the j-th year, as shown in Equation (15):
ζ j , 1 = i = 1 4 χ i , j γ i ϕ i , j
The ability of electric vehicles to increase peak load must be focused upon. In the j-th year, the ability factor established in this paper is as shown in Equation (16):
ζ j , 2 = Δ P j c a r , h i g h P j h i g h
where ∆Pjcar,high represents the charging capacity of the EV in the peak period in the j-th year, as shown in Equation (17):
Δ P j c a r , h i g h = N j κ ρ
The peak-shifting capacity factor of the energy storage system in the j-th year is shown in Equation (18):
ζ j , 3 = Δ P j e s s P j h i g h
where ∆Pjess is the sum of the total power of the grid-connected discharge of energy storage equipment during peak hours. Therefore, the integrated peak-load shifting capacity is as shown in Equation (19):
Δ p max , j = 1 ( 1 ζ j , 1 ) ( 1 + ζ j , 2 ) ( 1 ζ j , 3 )
On the basis of Cai’s modeling method for estimating the low-carbon benefits of power load shaping [36], this paper optimizes the expression of comprehensive factor of load shaping, as shown in Equation (20):
Δ ω j = 100 × [ P 2 , j ( 1 Δ p max , j ) P j max P 1 , j P j max ]
P1,j and P2,j respectively represent the average load under the non-energy internet and energy internet in the j-th year, as shown in Equations (21) and (22). In this paper, the non-energy internet refers to when there is no energy internet.
P 1 , j = Q j p ( 1 δ ) 8760
P 2 , j = ( 1 Δ ϖ j ) Q j p ( 1 δ ) 8760
where δ is the average line loss rate under the non-energy internet. Based on the analysis of the load rate above, the correlation factor between the load rate and the coal consumption of coal-fired power unit is η (with the increase of load rate by one percentage point, unit coal consumption of coal-fired power units decreases by η). Then, the emissions reduction of the energy internet due to load shaping can be obtained as shown in Equation (23):
S j , 4 = σ η Δ ω j ( 1 Δ ϖ j ) Q j p ( 1 δ )

2.4.4. Electrification of Energy-Using Terminal

One of the characteristics of the energy internet is to support the extensive access of a large number of electric vehicles, which promotes the cleanliness of energy terminals. Zero road emission is considered to be one of the most attractive features of EVs [48,49]. Driven by the construction of the energy internet, various new types of batteries and charging facilities have also promoted the popularity of EVs. EVs can achieve carbon reduction by replacing gasoline with electricity. According to Shi’s modeling method [50], the CO2 emissions reduction due to the promotion of EVs can be written as follows:
S j , 6 = Δ Q j elec β μ φ
With the advancement of natural gas engine technology, natural gas will play an important role in carbon emission reduction in the transportation field. At the same time, the emergence of P2G technology can convert the surplus of renewable energy into methane, and then inject it into the natural gas network for transportation or storage. As a result, the degree of coupling between the power system and the natural gas system is deepened, forming a closed-loop system in which energy can flow in both directions. Replacing fuel vehicles with natural gas vehicles can reduce carbon dioxide by 24%. Gas vehicles can achieve carbon emission reduction by replacing gasoline with natural gas. Therefore, the calculation model of CO2 emissions reduction generated by gas vehicles established in this paper is shown in Equation (25):
S j , 7 = Δ Q j g a s b μ φ 24 %

2.5. Comprehensive Calculation Model of CO2 Emission Reduction for Energy Internet

The energy internet is a huge complex system. There are many overlapping effects on the study of carbon emissions reduction, such as calculation and functional overlap effects. This paper has adopted a scientific and effective method to reasonably avoid the overlaps. It has obtained the calculation model from over seven perspectives. Therefore, a comprehensive calculation model for CO2 emissions reduction of the energy internet in the j-th year can be obtained, as shown in Equation (26):
S j , a l l = i = 1 7 S j , i

3. Results

3.1. Yanqing Energy Internet Demonstration Zone

The energy internet in Yanqing, China, has carried out a comprehensive demonstration of regional energy internet from electric vehicles, flexible resources, smart energy, flexible trading, and industry integration. It is one of 55 demonstration projects at the national level. It mainly includes four sub-projects: smart energy park, green energy beautiful village, high-efficiency energy agriculture, and green transportation tourism. The official completion time is expected to be 2025. The Yanqing Energy Internet Comprehensive Demonstration Zone comprehensively utilizes the clean energy supply of wind, light, water, and natural gas resources, and builds a smart microgrid group in combination with distributed power sources. In the demonstration area, the utilization rate of renewable energy reached 100%, forming a situation of comprehensive utilization of cold, heat, electricity, and gas. The active distribution network, the DC power grid, the energy management system, and the existing distribution network structure are organically combined to form a multi-level intelligent microgrid architecture. The energy is optimally configured and the microgrid operates economically and efficiently. Meanwhile, the two-way interaction between the microgrid and the user is realized. In many ways, the goal of energy saving and emissions reduction of the energy internet is achieved.
After conducting a field survey of the Yanqing Energy Internet Demonstration Project, this paper selected 2016 as the base year and 2025 as the final calculation year. The calculation model established above was used to calculate the CO2 emissions reduction after the completion of the Yanqing Energy Internet. That is, to calculate the future expected amount of CO2 emissions reduction of the Yanqing Energy Internet.

3.2. Data

3.2.1. Power Supply Side

The carbon emissions reduction on the power supply side of the Yanqing Energy Internet includes two components: renewable energy substitution and natural gas power generation. The heating center renovation project is expected to build a batch of 5.8 million watt (MW) natural gas cogeneration units. The natural gas power generation and heating project will effectively replace the original coal-fired heating and promote the clean utilization of natural gas on a large scale. The project plans that the natural gas cogeneration units mainly support winter heating, and the annual utilization hours can be calculated as 2160 h. After data collation and research, the statistical data obtained is shown in Table 1. Assume that 90% of renewable power generation and 60% of natural gas power generation are attributed to the construction of the energy internet.

3.2.2. Power Grid Side

Projects in all integrated demonstration areas are covered by microgrids. The total power generation in 2016 was 836.21 million kWh. It is estimated that the amount of renewable energy power generation by 2025 will increase by 12.53 million kWh. The increased permeability of the microgrid is about 0.4%, assuming that the microgrid can reduce the line loss rate by 0.5%. The relevant data is shown in Table 2:

3.2.3. Demand Side

Through the survey results, it is possible to estimate the permeability of smart meters, electricity consumption structure, energy saving potential, and peak-load shifting capacity of various industries in the Yanqing district. The survey data is shown in Table 3:
According to data from the Beijing Municipal Bureau of Statistics and research results, at the end of 2016, there were about 60,000 EVs in Yanqing district. It is estimated that when the energy internet is completed, the number of EVs in Yanqing district will reach 100,000. Assume that the average charging power of each EV is 10 kilowatts (kW). Assume that under the non-energy internet, the peak power load is 25,000 kW, and the maximum load in Yanqing district is 42,617 million watts in 2025. Assume that the sum of the total power of grid-connected discharge of energy storage equipment during peak hours is 0.08 kW. The summary data is shown in Table 4:

3.3. Total Carbon Emission Reduction and Contribution Rate of Each Ability

The model in Section 2 of the paper and the survey data from Section 3.2 are used in the calculations. The amount of total CO2 emissions reduction and the CO2 emissions reduction brought by various low-carbon capabilities in the Yanqing energy internet can be predicted, as shown in Table 5:
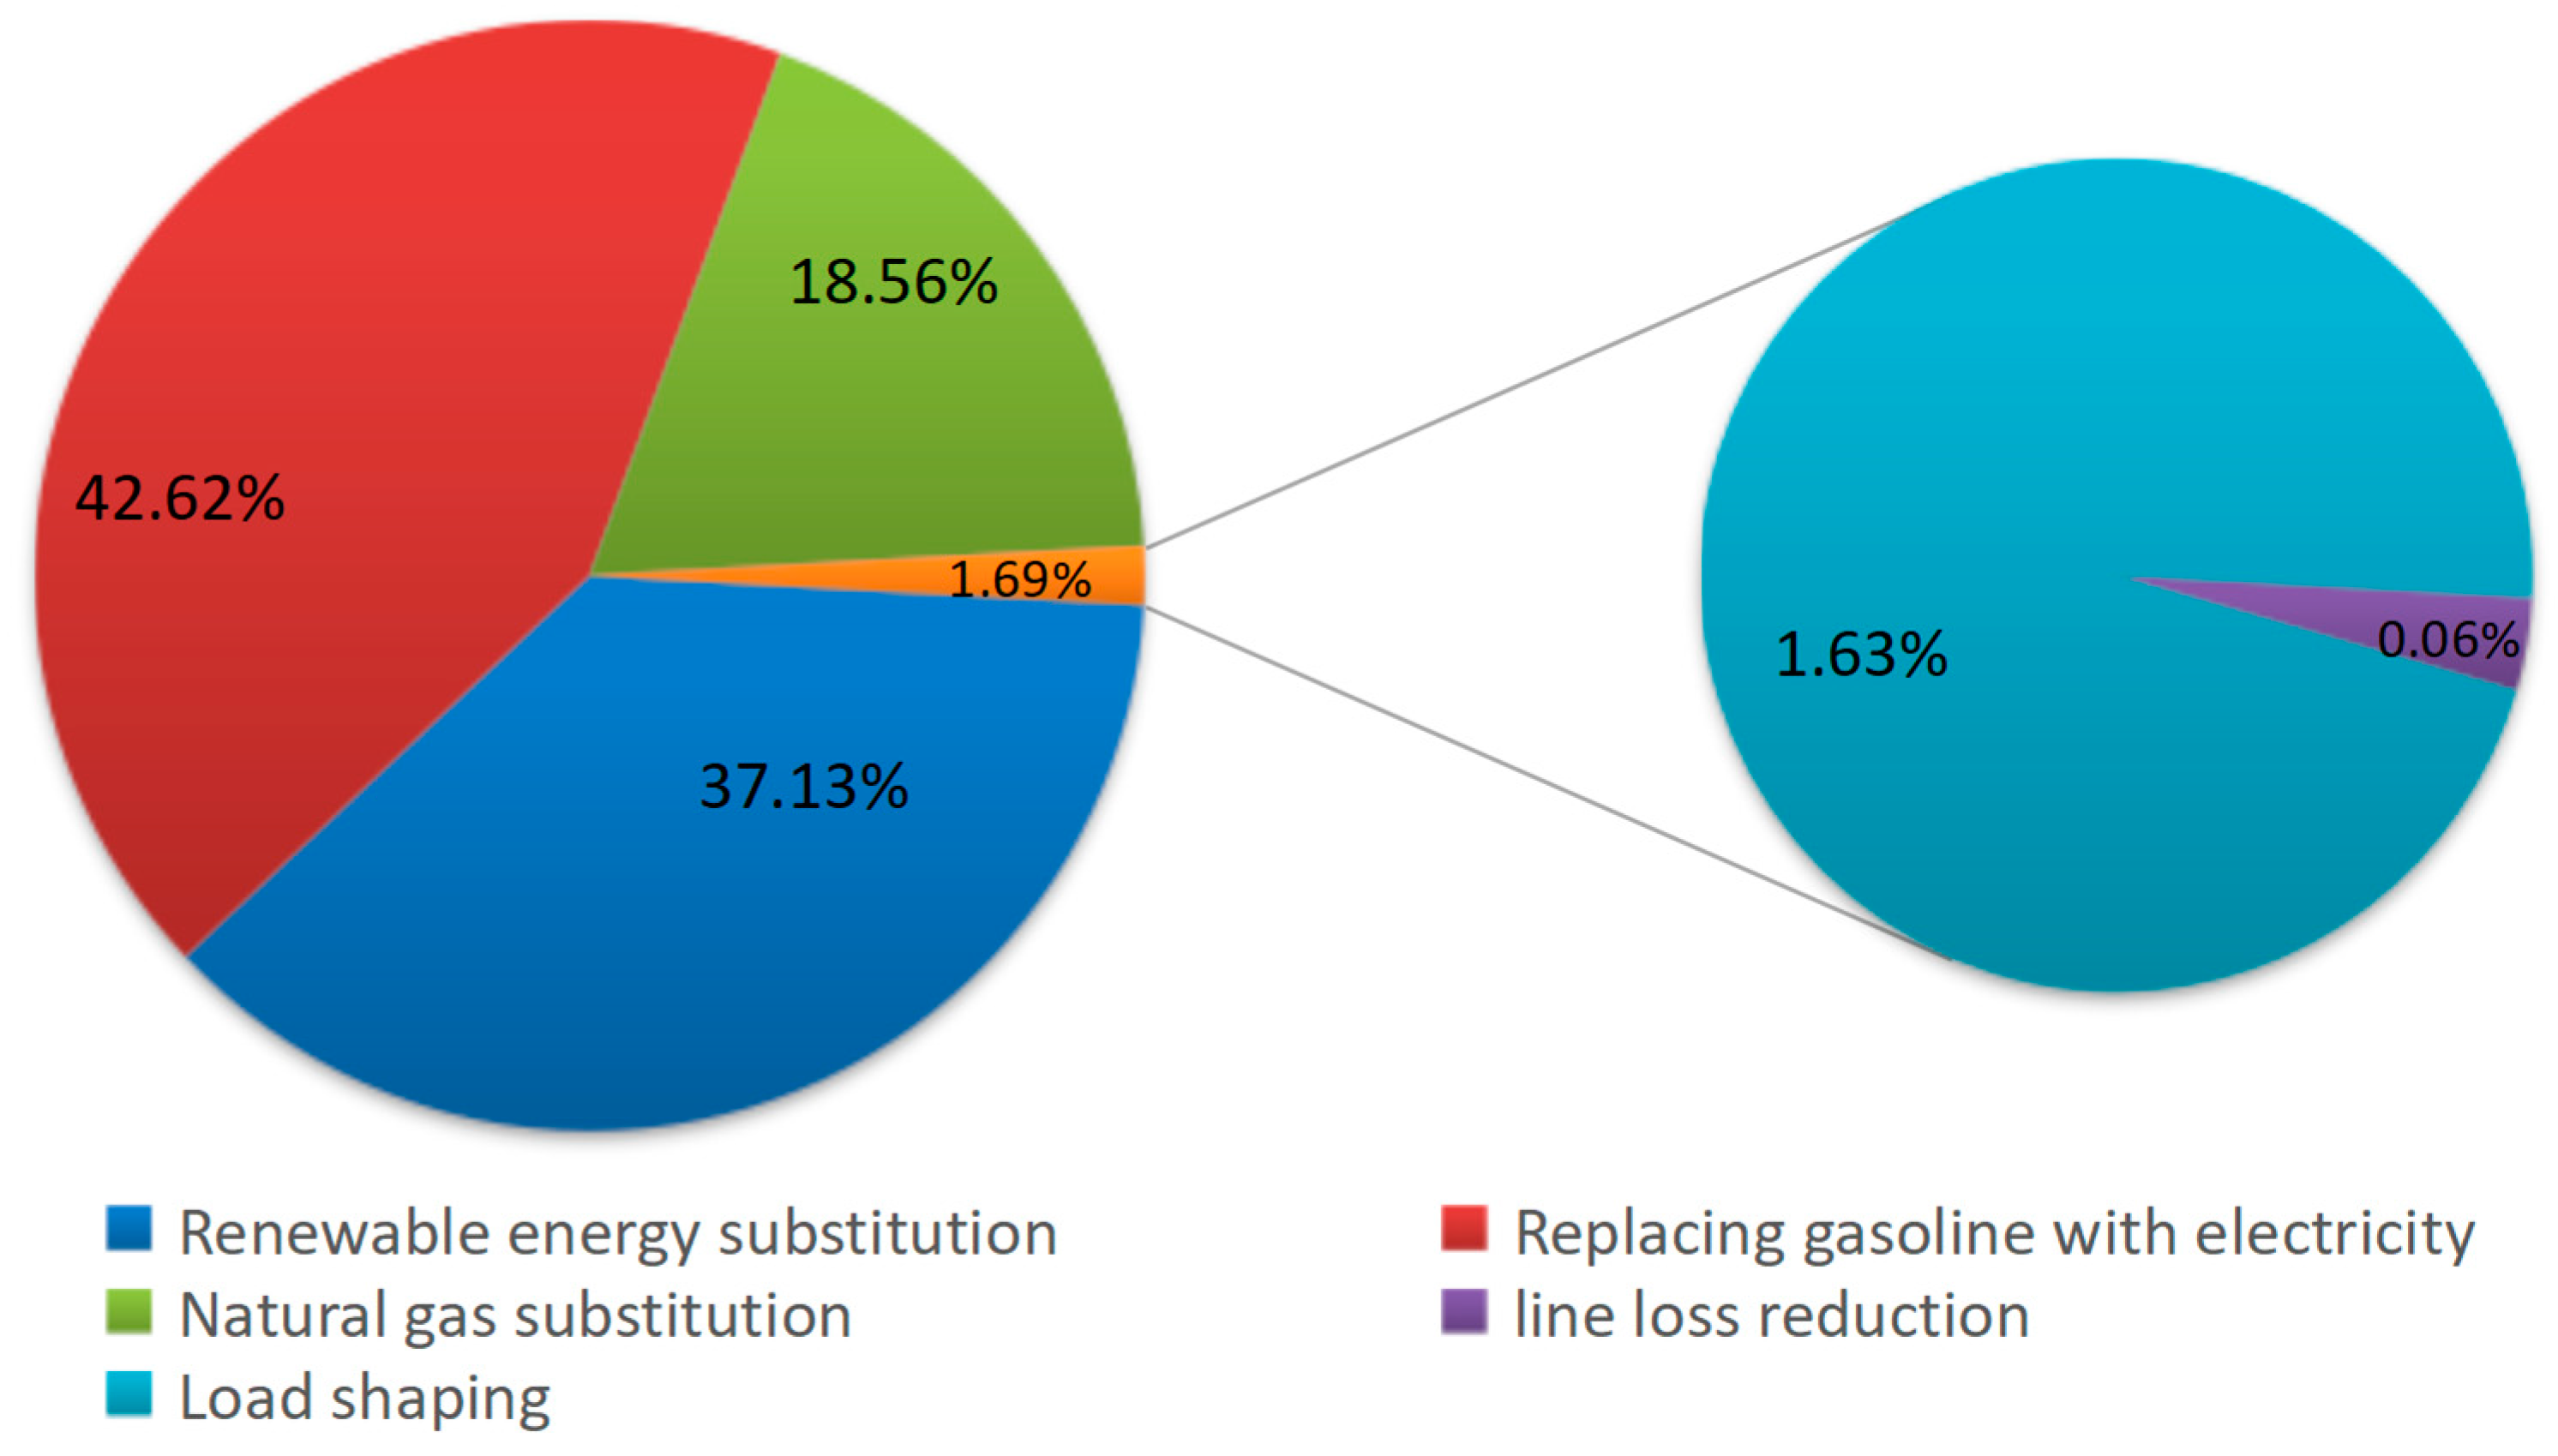
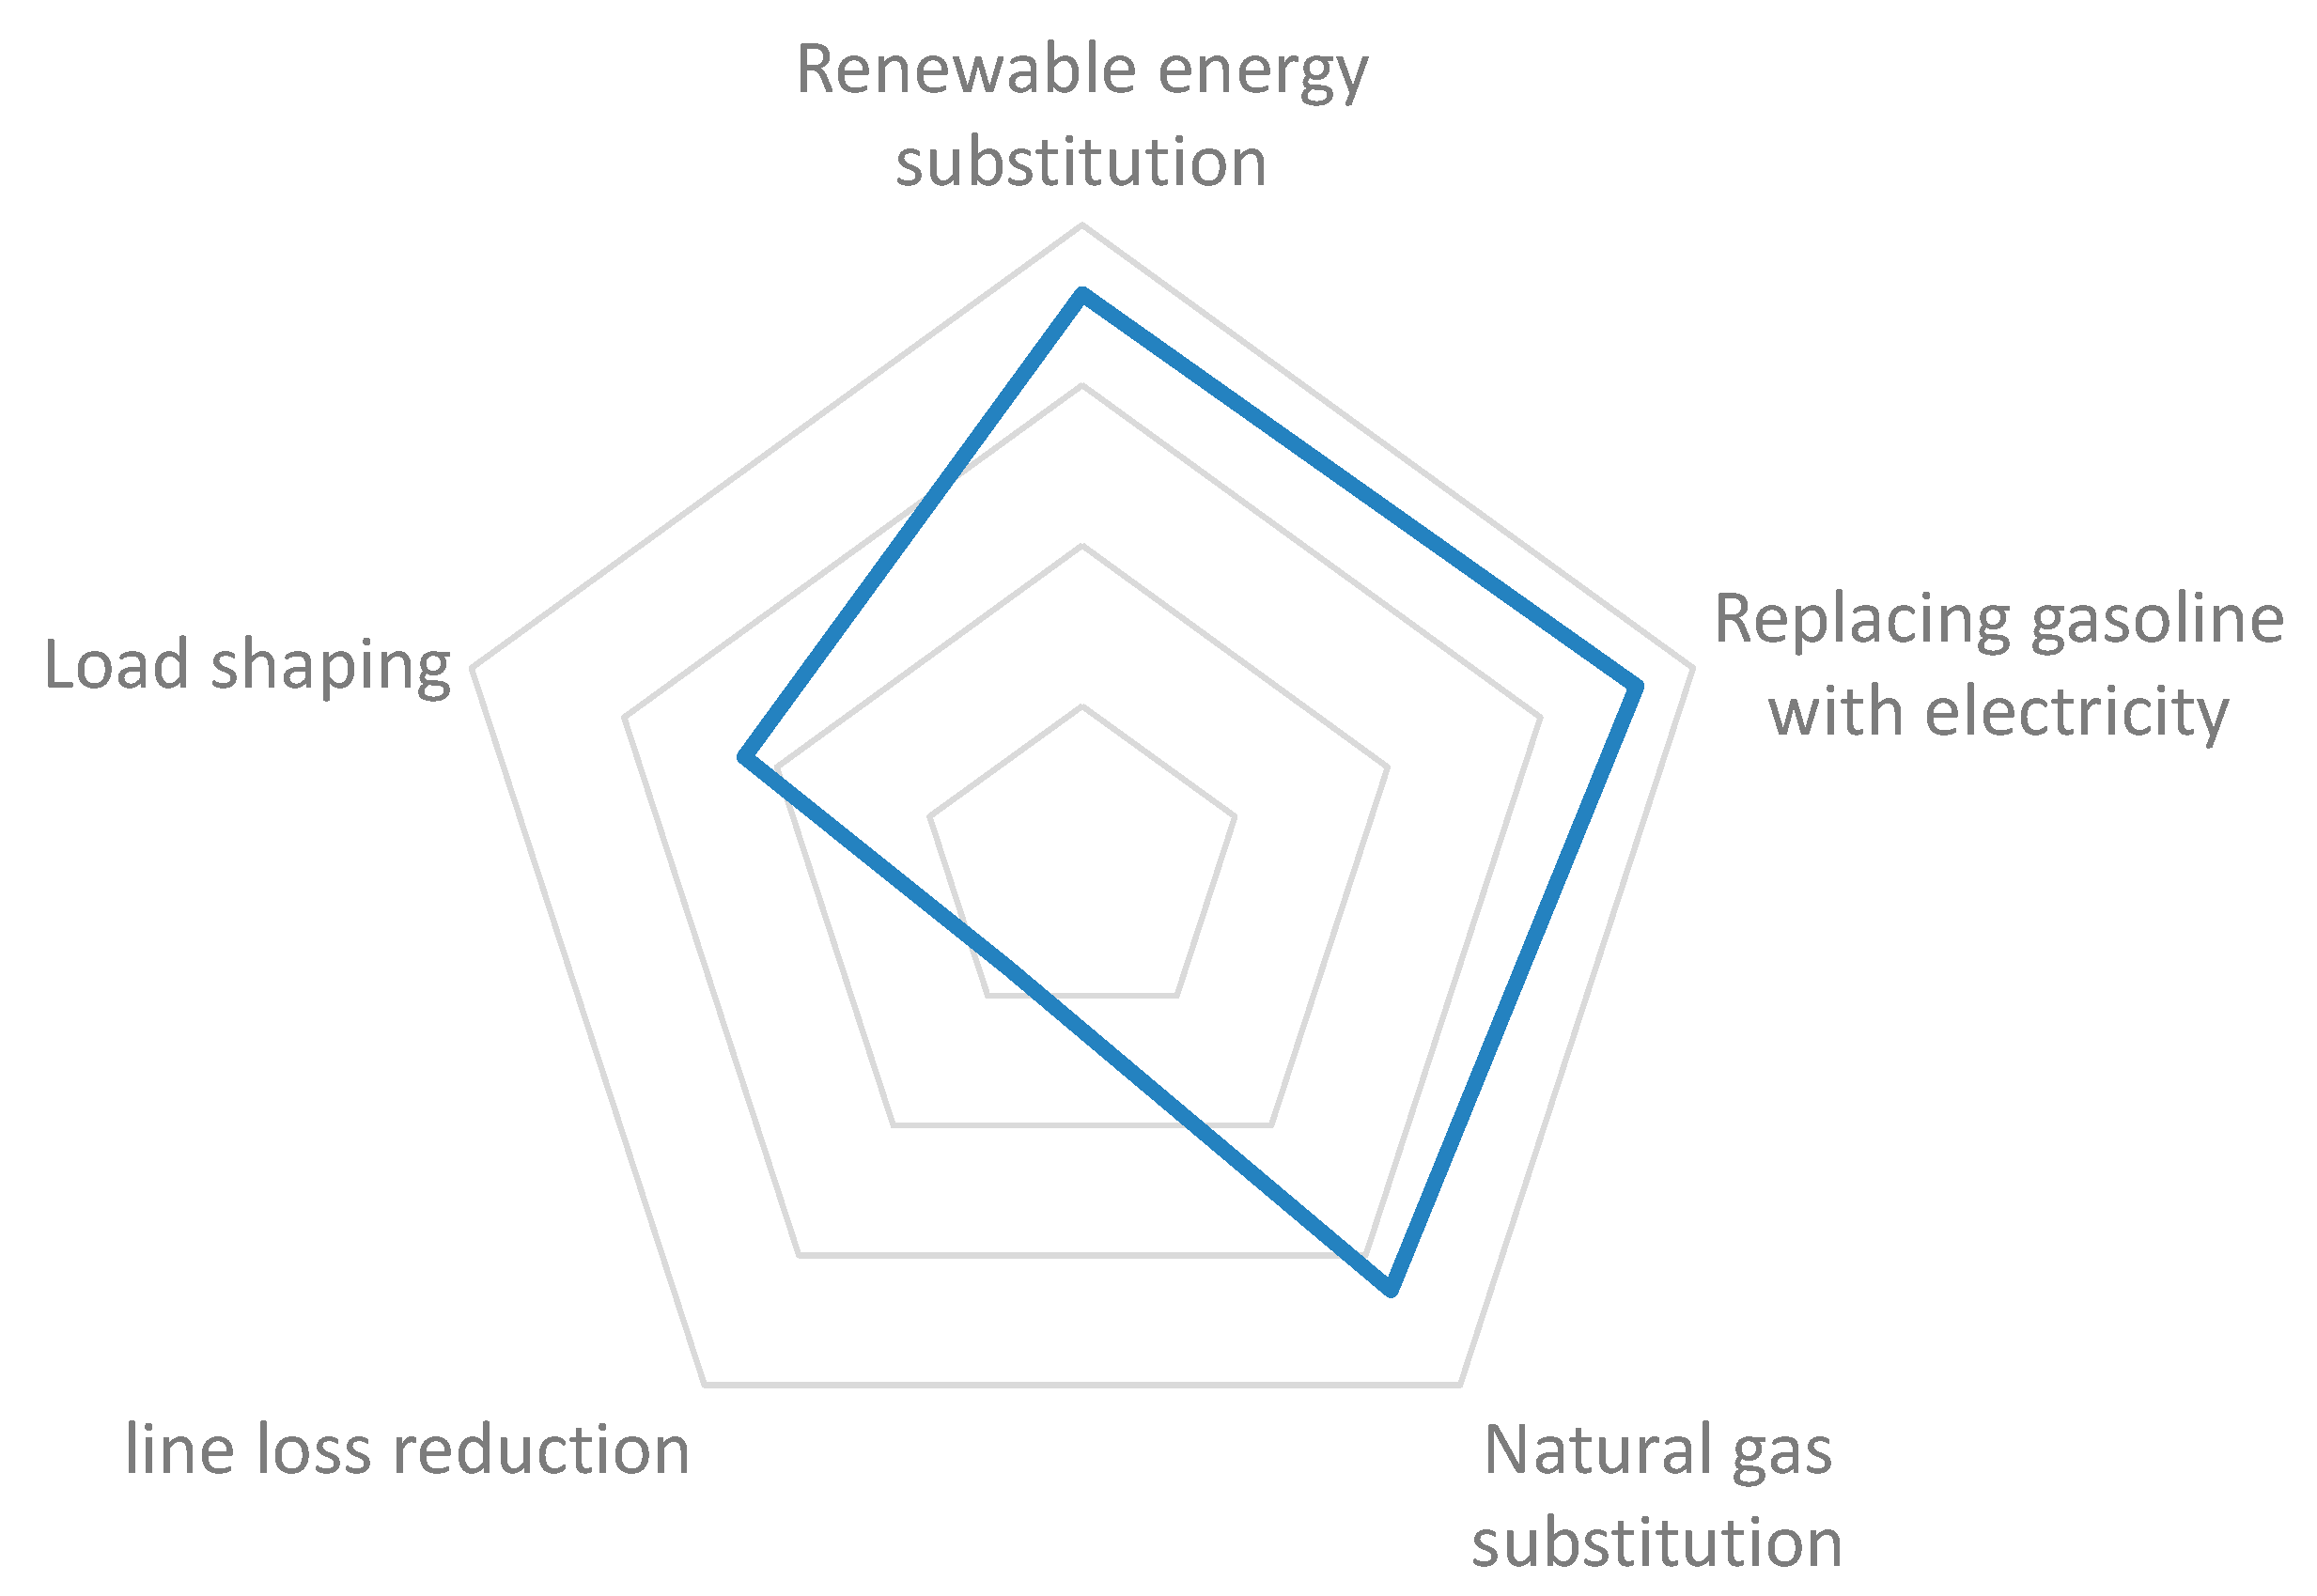
It is estimated that the amount of CO2 emissions reduction generated by the Yanqing Energy Internet will reach 14,093.19 tons in 2025. The value of energy saving is negative and the remaining factors are positive. “Renewable energy substitution”, “natural gas substitution”, “line loss reduction”, “load shaping”, and “replacement of gasoline with electricity” all play a positive role in energy saving and emissions reduction. With the large-scale promotion of EVs in the demonstration area, the electricity consumption increased, which shows a negative energy-saving effect on electricity consumption. Negative values only offset the parts that may be repeated, ensuring computational rigor. Based on the results shown above, a statistical analysis chart of carbon emissions reduction contribution rate was made. Because energy saving shows a negative energy-saving effect, it is not analyzed for its contribution rate. The composite pie chart and radar chart are shown in Figure 3 and Figure 4:
As can be seen from Figure 3 and Figure 4, “replacement of gasoline with electricity” has the highest contribution rate to the energy-saving and emission-reducing effects of the energy internet, with a value of 42.62%, followed by “renewable energy substitution” (37.13%). It can be seen that in future development, the abilities of the energy internet to promote energy conservation and emissions reduction mainly lie in the power supply side and the demand side, that is, mainly due to the development and application of power electronics technology and the microgrid which promotes local consumption of renewable energy.

4. Discussion

4.1. CO2 Emissions Reduction of Energy Internet

Taking the Yanqing Energy Internet Demonstration Zone in China as an example, this paper used the model established to predict that the demonstration area would reduce CO2 emissions by 14,093.19 tons. Until now, there is no literature on the calculation of energy saving and emissions reduction in the energy internet. Only a small amount of literature has studied the role of the energy internet in energy structure adjustment and carbon emissions reduction from a qualitative point of view [54], but carbon emissions reduction has not been quantitatively analyzed. In addition, according to the factors affecting the carbon emissions of China’s power industry, scholars represented by Wang [9] and Song [55] adopted a scenario analysis and IPAT (I = Human Impact, P = Population, A = Affluence, T = Technology) model to study the carbon emissions of the power system. From the perspective of research content, this paper is a major innovation in the quantitative research on the energy-saving and emission reduction effects of the energy internet.

4.2. Contribution of Each Capability to Carbon Emission Reduction

After analyzing the contribution rate of all low-carbon capabilities, this paper found that in the Yanqing Energy Internet Demonstration Zone, the contribution rate of “replacement of gasoline by electricity” is the largest, with a value of 42.62%, followed by “renewable energy substitution” (with a contribution rate of 37.13%). In the study of the environmental benefits of the energy internet or smart grids, Liu [42] and Chen et al. [56] have proved that power optimization is the most important reason to achieve energy saving and emission reduction through quantitative analysis. This is basically consistent with the conclusion of this paper. Luo et al. believed that energy storage and energy-saving technologies would play an important role in the energy internet as a means of mitigating the energy crisis [57]. The factors of energy storage and energy saving technology are also considered in this paper. Regardless of the research on energy-saving and emissions reduction of smart grids or energy internet, the existing literature almost did not consider the emissions reduction caused by the electrification of EVs. The research in this paper showed that the contribution rate of “replacement of gasoline by electricity” is the highest, which indicates that the related technologies of EVs have great energy-saving potential. This is another innovation of this paper.

4.3. Model Rationality

Energy internet is a huge and complex system. Functional overlap will lead to calculation overlap, so eliminating overlap is a difficult problem to be solved when calculating carbon emissions reduction. The calculation model in this paper combined the logical integration method and the mathematical decomposition method to decompose the comprehensive emissions reduction capacity into seven single parts. Both Li [34] and Cai [37] have noticed that overlapping effects should be eliminated when establishing a comprehensive model, but they were all theoretically qualitatively classified. Also, there was no guarantee that the overlapping calculations would be completely eliminated. This paper adopted the method of scientific quantitative decomposition to split the total energy saving and emissions reduction of the energy internet, which ensured the comprehensiveness and rationality of the calculation.

4.4. Dimension of the Calculation Model

This paper innovated the calculation dimension for carbon emissions reduction of the energy internet. In terms of the low-carbon benefits of the optimization of power supply structure, Cao et al. mainly calculated the substitution benefits of renewable energy generation for thermal power, and selected the power generation capacity and the proportion of clean energy generation as variables. In this paper, the increased amount of power generation corresponding to different types of renewable energy was calculated, and the contribution rate of the energy internet to the increase of renewable energy power generation was considered as well. In addition, this paper also calculated the emission reductions generated by natural gas substitution. This is an innovation in the calculation dimension in power supply optimization.
In terms of the low-carbon benefits of improving grid efficiency, Cao et al. [32] and Chen et al. [42] considered the low-carbon benefits of increasing microgrid permeability and establishing different grades of UHV grids, respectively. Based on their modeling method and the characteristics of the energy internet, this paper established a comprehensive calculation model for CO2 emissions reduction by improving grid efficiency.
Regarding the low-carbon benefit calculation about energy conservation, Cao et al. obtained the comprehensive capability factor of energy-saving by introducing the energy-saving factor of user interaction and the negative energy-saving factor of the EV [32]. Compared with the smart grid, the energy internet has stronger user-side interaction capabilities and the amount of EVs is larger. But this does not affect the consistency of the calculation method.
In terms of the low-carbon benefit calculation of load shaping, Cao et al. and Cai et al. both considered the peak-shifting capability of user interaction and the load-lifting ability of EVs [32,37]. In addition to these two capabilities, the peak-shifting capacity of energy storage facilities in the energy internet should also be considered. Therefore, this paper comprehensively considered these three aspects to establish a computational model of the load shaping complex factor.

4.5. Model Suitability

The model given in this paper is the calculation model of CO2 emissions reduction under the regional energy internet. The overall model includes seven capabilities, while the energy internet in different localities may not fully include all the above factors. At this time, the calculation model of corresponding single low-carbon capacity should be selected according to the specific situation, and finally the cumulative model should be formed.

5. Conclusions

(1)
The model given in this paper was the calculation model for CO2 emissions reduction under the regional energy internet. The model has strong versatility and could quantitatively calculate carbon emissions reduction for any built or planned energy internet.
(2)
The mathematical decomposition method and logical integration method were combined to study energy saving and emissions reduction of the energy internet. The total low-carbon capability of the energy internet was classified into seven single low-carbon capabilities. This method of processing reasonably avoided any overlap in calculation.
(3)
The Yanqing energy internet can reduce CO2 emissions by 14093.19 tons after completion, which shows that the energy internet has a good effect in energy saving and emissions reduction. The national and local governments should introduce relevant policies to speed up the construction of energy internet.
(4)
Taking the Yanqing energy internet as an example, it was found that among the seven low-carbon capabilities, “replacing gasoline with electricity” had the highest contribution rate, followed by “renewable energy substitution”. Therefore, in the construction and operation of the energy internet, we should focus on the development and application of power electronics technology related to electric vehicles. At the same time, the government should actively take various measures to promote the sales of electric vehicles on the user side.
(5)
Among the seven low-carbon capabilities, the contribution rate of renewable energy substitution ranks second, which indicates that the optimization of the power supply structure is very important in the energy internet. In view of the characteristics of decentralization and randomness of renewable energy, the government should strengthen the construction of the micro-grid for local energy consumption, so that more renewable energy can be connected to the grid.

Author Contributions

Conceptualization, S.Y.; Data curation, D.Z. and D.L.; Formal analysis, S.Y. and D.Z.; Methodology, D.Z. and D.L.; Writing—original draft, S.Y. and D.Z.; Writing—review & editing, D.Z. and D.L.

Funding

The research was funded by National Social Science Foundation of China (grant number is 16BJY055).

Conflicts of Interest

The authors declare no conflict of interest.

Abbreviations

EVElectric vehicle
LANLocal area network
UHVUltra-high voltage
DCDirect current
ZCE-MEIZero-carbon emission micro Energy Internet
NSF-CAESNon-supplementary fired compressed air energy storage
SDNSoftware defined network
FREEDMFuture renewable electric energy delivery and management
CCSCarbon capture and storage
REPGTRenewable energy power generation technology
P2GPower-to-gas
V2GVehicle-to-grid
CCHPCombined cooling heating and power
ICTInformation and communication technologies
IoTInternet of Things
DSRDistribution system reconfiguration
EDEconomic dispatch
DREDDistributionally robust optimization (DRO) ED framework
Symbols
Power supply side
x 0 / x j The amount of coal-fired power generation in the base/j-th year (kW∙h)
y 0 / y j The amount of clean energy power generation in the base/j-th year (kW∙h)
p 0 / p j Total amount of power generation in the base/j-th year (kW∙h)
q 0 / q j The amount of total electricity consumption in the base/j-th year (kW∙h)
α 0 / α j The average CO2 emission coefficient of the thermal power unit in the base/j-th year
S j , 1 The amount of CO2 emission reduction by renewable energy substitution (ton)
σCO2 emission coefficient of coal (tco2/tce)
ε Coal consumption rate of thermal power unit (g/(kW∙h))
Δ Q i r e n e w The increase in the amount of electricity generated by the i-th renewable energy (kW∙h)
ρ i A ratio that the increased renewable energy power generation can be attributed to the Energy Internet
Δ Q g a s The increase in natural gas power generation during the calculation period (kW∙h)
ρ g a s A ratio that the increased natural gas power generation can be attributed to the Energy Internet
Power grid side
Δ δ m p g The line loss rate that can be reduced when the microgrid permeability is 100%
Δ δ i , e h v The line loss rate that can be reduced by UHV grids of different voltage levels
θ 0 , i , e h v The permeability of the UHV grid at different voltage levels in the base year
Q j p The predicted amount of power generation in the j-th year (kW∙h)
Demand side
χ i , j The proportion of the i-th industry in the electricity structure in the j-th year
υ i The interactive energy-saving potential of the i-th industry
ϕ i , j The permeability of smart meters in the i-th industry in the j-th year
δ The average line loss rate under the non Energy Internet
The power consumption of an EV per 100 kilometers (kW∙h/100 km)
Δ Q j car The increased number of EVs during the calculation period
χ i , j The proportion of the i-th industry in the electricity consumption structure in the j-th year
γ i Peak-load shifting potential of the i-th industry based on smart meters
P j h i g h Load scale in the peak period under the non Energy Internet in the j-th year (kW)
N j Total number of EVs in the j-th year
κ Proportion of EVs participating in charging in peak period
ρ The average charging power of EVs in peak period (kW)
Δ ω j The proportion of the system load rate being increased in the j-th year
P j max Maximum load in the j-year under the non Energy Internet (kW)
Δ Q j elec The increased amount of EVs during the calculation period
β The average annual mileage of an EV (km)
μ The amount of fuel consumption of the vehicle ( μ liters of fuel per 100 kilometers)
φ CO2 emission coefficient of the fuel
Δ Q j g a s The increased number of gas vehicles during the calculation period
b Average annual mileage of a gas vehicle (km)

References

  1. Tarroja, B.; Shaffer, B.; Samuelsen, S. The importance of grid integration for achievable greenhouse gas emissions reductions from alternative vehicle technologies. Energy 2015, 87, 504–519. [Google Scholar] [CrossRef]
  2. Mi, Z.F.; Zhang, Y.K.; Guan, D.B.; Shan, Y.L.; Liu, Z.; Cong, R.G.; Yuan, X.C.; Wei, Y.M. Consumption-based emission accounting for Chinese cities. Appl. Energy 2016, 184, 1073–1081. [Google Scholar] [CrossRef] [Green Version]
  3. Mi, Z.; Wei, Y.M.; Wang, B.; Meng, J.; Liu, Z.; Shan, Y.L.; Liu, J.R.; Guan, D.B. Socioeconomic impact assessment of China’ s CO2 emissions peak prior to 2030. J. Clean. Prod. 2016, 142, 2227–2236. [Google Scholar] [CrossRef]
  4. Lehmann, S. Low carbon districts: Mitigating the urban heat island with green roof infrastructure. City Cult. Soc. 2014, 5, 1–8. [Google Scholar] [CrossRef] [Green Version]
  5. Lasseter, R.H.; Paigi, P. Microgrid: A conceptual solution. In Proceedings of the 2004 IEEE 35th Annual Power Electronics Specialists Conference (IEEE Cat. No.04CH37551), Aachen, Germany, 20–25 June 2004; pp. 4285–4290. [Google Scholar]
  6. Liu, L.N.; Chen, X.; Lu, Z.M.; Wang, L.H.; Wen, X.M. Mobile-edge computing framework with data compression for wireless network in energy internet. Tsinghua Sci. Technol. 2019, 24, 271–280. [Google Scholar] [CrossRef]
  7. Ma, T.; Wu, J.; Hao, L. Energy Flow Modeling and Optimal Operation Analysis of Micro Energy Grid Based on Energy Hub. Energy Convers. Manag. 2017, 133, 292–306. [Google Scholar] [CrossRef]
  8. Yan, Z.; Tao, Z.; Rui, W.; Liu, Y.; Bo, G. A Model Predictive Control Based Distributed Coordination of Multi-microgrids in Energy Interne. Acta Autom. Sin. 2017, 43, 1443–1456. (In Chinese) [Google Scholar]
  9. Wang, Y.M. The concept and prospects of global energy internet. China Power 2016, 49, 1–5. [Google Scholar]
  10. Coster, E.J.; Myrzik, J.M.A.; Kruimer, B.; Kling, W.L. Integration Issues of Distributed Generation in Distribution Grids. Proc. IEEE 2011, 99, 28–39. [Google Scholar] [CrossRef]
  11. Shukla, J.; Das, B.; Pant, V. Stability constrained optimal distribution system reconfiguration considering uncertainties in correlated loads and distributed generations. Int. J. Electr. Power Energy Syst. 2018, 99, 121–133. [Google Scholar] [CrossRef]
  12. Yao, W.; Zhao, J.; Wen, F.; Xue, Y.; Ledwich, G. A hierarchical decomposition approach for coordinated dispatch of plug-in electric vehicles. IEEE Trans. Power Syst. 2013, 28, 2768–2778. [Google Scholar] [CrossRef]
  13. Huang, A.Q.; Crow, M.L.; Heydt, G.T.; Zheng, J.P.; Dale, S.J. The Future Renewable Electric Energy Delivery and Management (FREEDM) System: The Energy Internet. Proc. IEEE 2011, 99, 133–148. [Google Scholar] [CrossRef]
  14. Yang, H.; Yi, D.; Zhao, J.; Dong, Z.Y. Distributed optimal dispatch of virtual power plant via limited communication | NOVA. The University of Newcastle Digital Repository. IEEE Trans. Power Syst. 2013, 28, 3511–3512. [Google Scholar] [CrossRef]
  15. Deng, X. Study on Insulation Coordination of Converter Stations in UHV DC and Flexible HVDC Transmission Systems. Master’s Thesis, Zhejiang University, Zhejiang, China, 2014. [Google Scholar]
  16. Li, R.; Chen, L.; Yuan, T.; Li, C. Optimal dispatch of zero-carbon-emission micro Energy Internet integrated with non-supplementary fired compressed air energy storage system. J. Mod. Power Syst. Clean Energy 2016, 4, 566–580. [Google Scholar] [CrossRef] [Green Version]
  17. Hou, W.; Tian, G.; Guo, L.; Wang, X.; Zhang, X.; Ning, Z. Cooperative Mechanism for Energy Transportation and Storage in Internet of Energy. IEEE Access 2017, 5, 1363–1375. [Google Scholar] [CrossRef]
  18. Tong, X.; Sun, H.; Luo, X.; Zheng, Q. Distributionally robust chance constrained optimization for economic dispatch in renewable energy integrated systems. J. Glob. Optim. 2018, 70, 131–158. [Google Scholar] [CrossRef]
  19. Zhou, Z.; Xiong, F.; Xu, C.; Zhou, S.; Gong, J. Energy Management for Energy Internet: A Combination of Game Theory and Big Data-Based Renewable Power Forecasting. In Proceedings of the 2017 IEEE International Conference on Energy Internet (ICEI), Beijing, China, 17–21 April 2017. [Google Scholar]
  20. Yi, X.; Zhang, J.; Wang, W.; Juneja, A.; Bhattacharya, S. Energy Router: Architectures and Functionalities toward Energy Internet. In Proceedings of the IEEE International Conference on Smart Grid Communications (SmartGridComm), Brussels, Belgium, 17–20 October 2011. [Google Scholar]
  21. Tapscott, D.; Tapscott, A. How Block Chain Technology can Reinvent the Power Grid. Available online: http://fortune.com/2016/05/15/blockchain-reinvents-power-grid/ (accessed on 15 May 2016).
  22. Wu, L.; Meng, K.; Xu, S.; Li, S.; Ding, M.; Suo, Y. Democratic Centralism: A Hybrid Blockchain Architecture and Its Applications in Energy Internet. In Proceedings of the IEEE International Conference on Energy Internet (ICEI), Beijing, China, 17–21 April 2017. [Google Scholar] [CrossRef]
  23. Pan, J.; Jain, R.; Paul, S.; Vu, T.; Saifullah, A.; Sha, M. An Internet of Things Framework for Smart Energy in Buildings: Designs, Prototype, and Experiments. IEEE Internet Things J. 2015, 2, 527–537. [Google Scholar] [CrossRef]
  24. Huang, A. FREEDM system—A vision for the future grid. In Proceedings of the Power and Energy Society General Meeting, Providence, RI, USA, 25–29 July 2010. [Google Scholar] [CrossRef]
  25. Zhou, K.; Yang, S.; Shao, Z. Energy Internet: The business perspective. Appl. Energy 2016, 178, 212–222. [Google Scholar] [CrossRef]
  26. Zhou, Z.; Liu, Y.; Jin, C. Study on construction of low-carbon featured chlor-alkali industry bases energized by non-grid-connected wind power in offshore Jiangsu province. In Proceedings of the World Non-grid-connected Wind Power & Energy Conference, Nanjing, China, 24–26 September 2009. [Google Scholar] [CrossRef]
  27. Bui, M.; Adjiman, C.S.; Bardow, A.; Anthony, E.J.; Boston, A.; Brown, S.; Fennell, P.S.; Fuss, S.; Galindo, A.; Hackett, L.A.; et al. Carbon capture and storage (CCS): The way forward. Energy Environ. Sci. 2018, 11, 1062–1176. [Google Scholar] [CrossRef]
  28. Jane, T.H. Biomass power as a strategic business investment. In Proceedings of the 1996 International Joint Power Generation Conference, Houston, TX, USA, 13–17 October 1996; Part 1. pp. 355–364. [Google Scholar]
  29. Engül, H.; Theis, T.L. An environmental impact assessment of quantum dot photovoltaics (QDPV) from raw material acquisition through use. J. Clean. Prod. 2011, 19, 21–31. [Google Scholar] [CrossRef]
  30. Zhou, L.S. Research on Key Indicators Selection and Evaluation Model of Smart Grid Low Carbon Benefit; North China Electric Power University: Beijing, China, 2013. [Google Scholar]
  31. Jia, W.Z.; Kang, C.Q.; Liu, C.L.; Li, M. Capability of smart grid to promote low-carbon development and its benefits evaluation model. Autom. Electr. Power Syst. 2011, 35, 7–12. [Google Scholar]
  32. Cao, P.; Wang, M.; Guo, C.X.; Bai, Y.H.; Zhou, H.J. Low-carbon comprehensive benefit analysis of intelligent microgrid operation. Power Grid Technol. 2012, 6, 15–20. (In Chinese) [Google Scholar]
  33. Zhou, T.; Chen, Q.; Zhu, W.; Zhang, L.; Kang, C. A comprehensive low-carbon benefits assessment model for power systems. In Proceedings of the IEEE International Conference on Power System Technology, Auckland, New Zealand, 30 October–2 November 2012. [Google Scholar]
  34. Li, W.F.; Hui, R.Z.; Sen, G. An Analysis on the Low-carbon Benefits of Smart Grid of China. Phys. Procedia 2012, 24, 328–336. [Google Scholar] [Green Version]
  35. Sun, S. Research on Energy Saving and Emission Reduction Path of Chinese Power Industry under the Background of Energy Internet. Master’s Thesis, North China Electric Power University, Beijing, China, 2016. [Google Scholar]
  36. Kang, C.Q.; Zhou, T.R.; Chen, Q.X.; Ge, J. Assessment Model on Low-Carbon Effects of Power Grid and Its Application. Power Syst. Technol. 2009, 33, 1–7. [Google Scholar]
  37. Cai, T.; Song, B.B.; Wei, Z. Low carbon benefit measurement model based on electric load shaping. China Power 2012, 45, 103–108. [Google Scholar]
  38. Feng, Q.D. The status quo and development of Energy Internet. Electr. Ind. 2016, 1. (In Chinese) [Google Scholar]
  39. Li, Z.; Wu, W.; Wang, J.; Zhang, B.; Zheng, T. Transmission-Constrained Unit Commitment Considering Combined Electricity and District Heating Networks. IEEE Trans. Sustain. Energy 2016, 7, 480–492. [Google Scholar] [CrossRef]
  40. Martin-Martínez, F.; Sánchez-Miralles, A.; Rivier, M. A literature review of Microgrids: A functional layer based classification. Renew. Sustain. Energy Rev. 2016, 62, 1133–1153. [Google Scholar] [CrossRef]
  41. Qi, Q.R.; Jiang, W.Y.; Liu, J.Q.; Chang, H.; Zhou, Z. Black start method for UH DC-transmitting island system based on flexible direct current transmission technology. Power Constr. 2017, 10. (In Chinese) [Google Scholar]
  42. Chen, A.W.; Le, Q.M.; Cao, H. Low Carbon Benefit Analysis of Smart Grid in China. Stat. Decis. 2012, 8, 71–74. [Google Scholar]
  43. Microgrid Permeability. Available online: http://www.docin.com/p-225098761.html (accessed on 18 February 2019).
  44. Hobbs, B.F.; Oren, S.S. Three Waves of U.S. Reforms: Following the Path of Wholesale Electricity Market Restructuring. IEEE Power Energy Mag. 2019, 17, 73–81. [Google Scholar] [CrossRef]
  45. Li, Y.; He, L.; Liu, F. Flexible Voltage Control Strategy Considering Distributed Energy Storages for DC Distribution Network. IEEE Trans. Smart Grid 2017, 99, 163–172. [Google Scholar] [CrossRef]
  46. Fensel, A.; Tomic, D.K.; Koller, A. Contributing to appliances’ energy efficiency with Internet of Things, smart data and user engagement. Future Gener. Comput. Syst. 2016, 76, 329–338. [Google Scholar] [CrossRef]
  47. Cai, H.; Chen, Q.; Guan, Z. Day-ahead optimal charging/discharging scheduling for electric vehicles in microgrids. Prot. Control. Mod. Power Syst. 2018, 3, 2–69. [Google Scholar] [CrossRef]
  48. Li, M.; Wu, X.; Zhang, Z.; Yu, G.; Ma, W. A Wireless Charging Facilities Deployment Problem Considering Optimal Traffic Delay and Energy Consumption on Signalized Arterial. IEEE Trans. Intell. Transp. Syst. 2019, 99, 1–12. [Google Scholar] [CrossRef]
  49. Li, P.; Han, Z.; Jia, X.; Mei, Z.; Han, X.; Wang, Z. Comparative analysis of an organic Rankine cycle with different turbine efficiency models based on multi-objective optimization. Energy Convers. Manag. 2019, 185, 130–142. [Google Scholar] [CrossRef]
  50. Shi, X.Q.; Li, X.N.; Yang, J.X. Analysis of Carbon Emission Reduction Potential and Its Influencing Factors of Low Carbon Transportation Electric Vehicles. Environ. Sci. 2013, 1, 385–394. [Google Scholar]
  51. Beijing Municipal Bureau of Statistics Website. Available online: http://www.bjstats.gov.cn/ (accessed on 12 December 2018).
  52. China Carbon Emissions Trading Network. Available online: http://www.tanpaifang.com/ (accessed on 3 November 2018).
  53. Polaris Power Network Website. Available online: http://www.bjx.com.cn/ (accessed on 5 February 2019).
  54. Shi, Y. Analysis of Energy Saving Application under the Background of Energy Internet. J. Harbin Vocat. Tech. Coll. 2017, 5, 92–94. (In Chinese) [Google Scholar]
  55. Song, J.Z.; Feng, Q.; Wang, X.P.; Fu, H.L.; Jiang, W.; Chen, B.Y. Spatial Association and Effect Evaluation of CO2 Emission in the Chengdu-Chongqing Urban Agglomeration: Quantitative Evidence from Social Network Analysis. Sustainability 2018, 11, 1. [Google Scholar] [CrossRef]
  56. Liu, R.X. Research and Application of Regional Optimization Energy Saving Model Based on Energy Internet. Master’s Thesis, North China Electric Power University, Beijing, China, 2017. [Google Scholar]
  57. Luo, Z.W. Development and application of energy storage technology for Energy Internet. Build. Mater. Dev. Orientat. 2017, 15, 117. [Google Scholar]
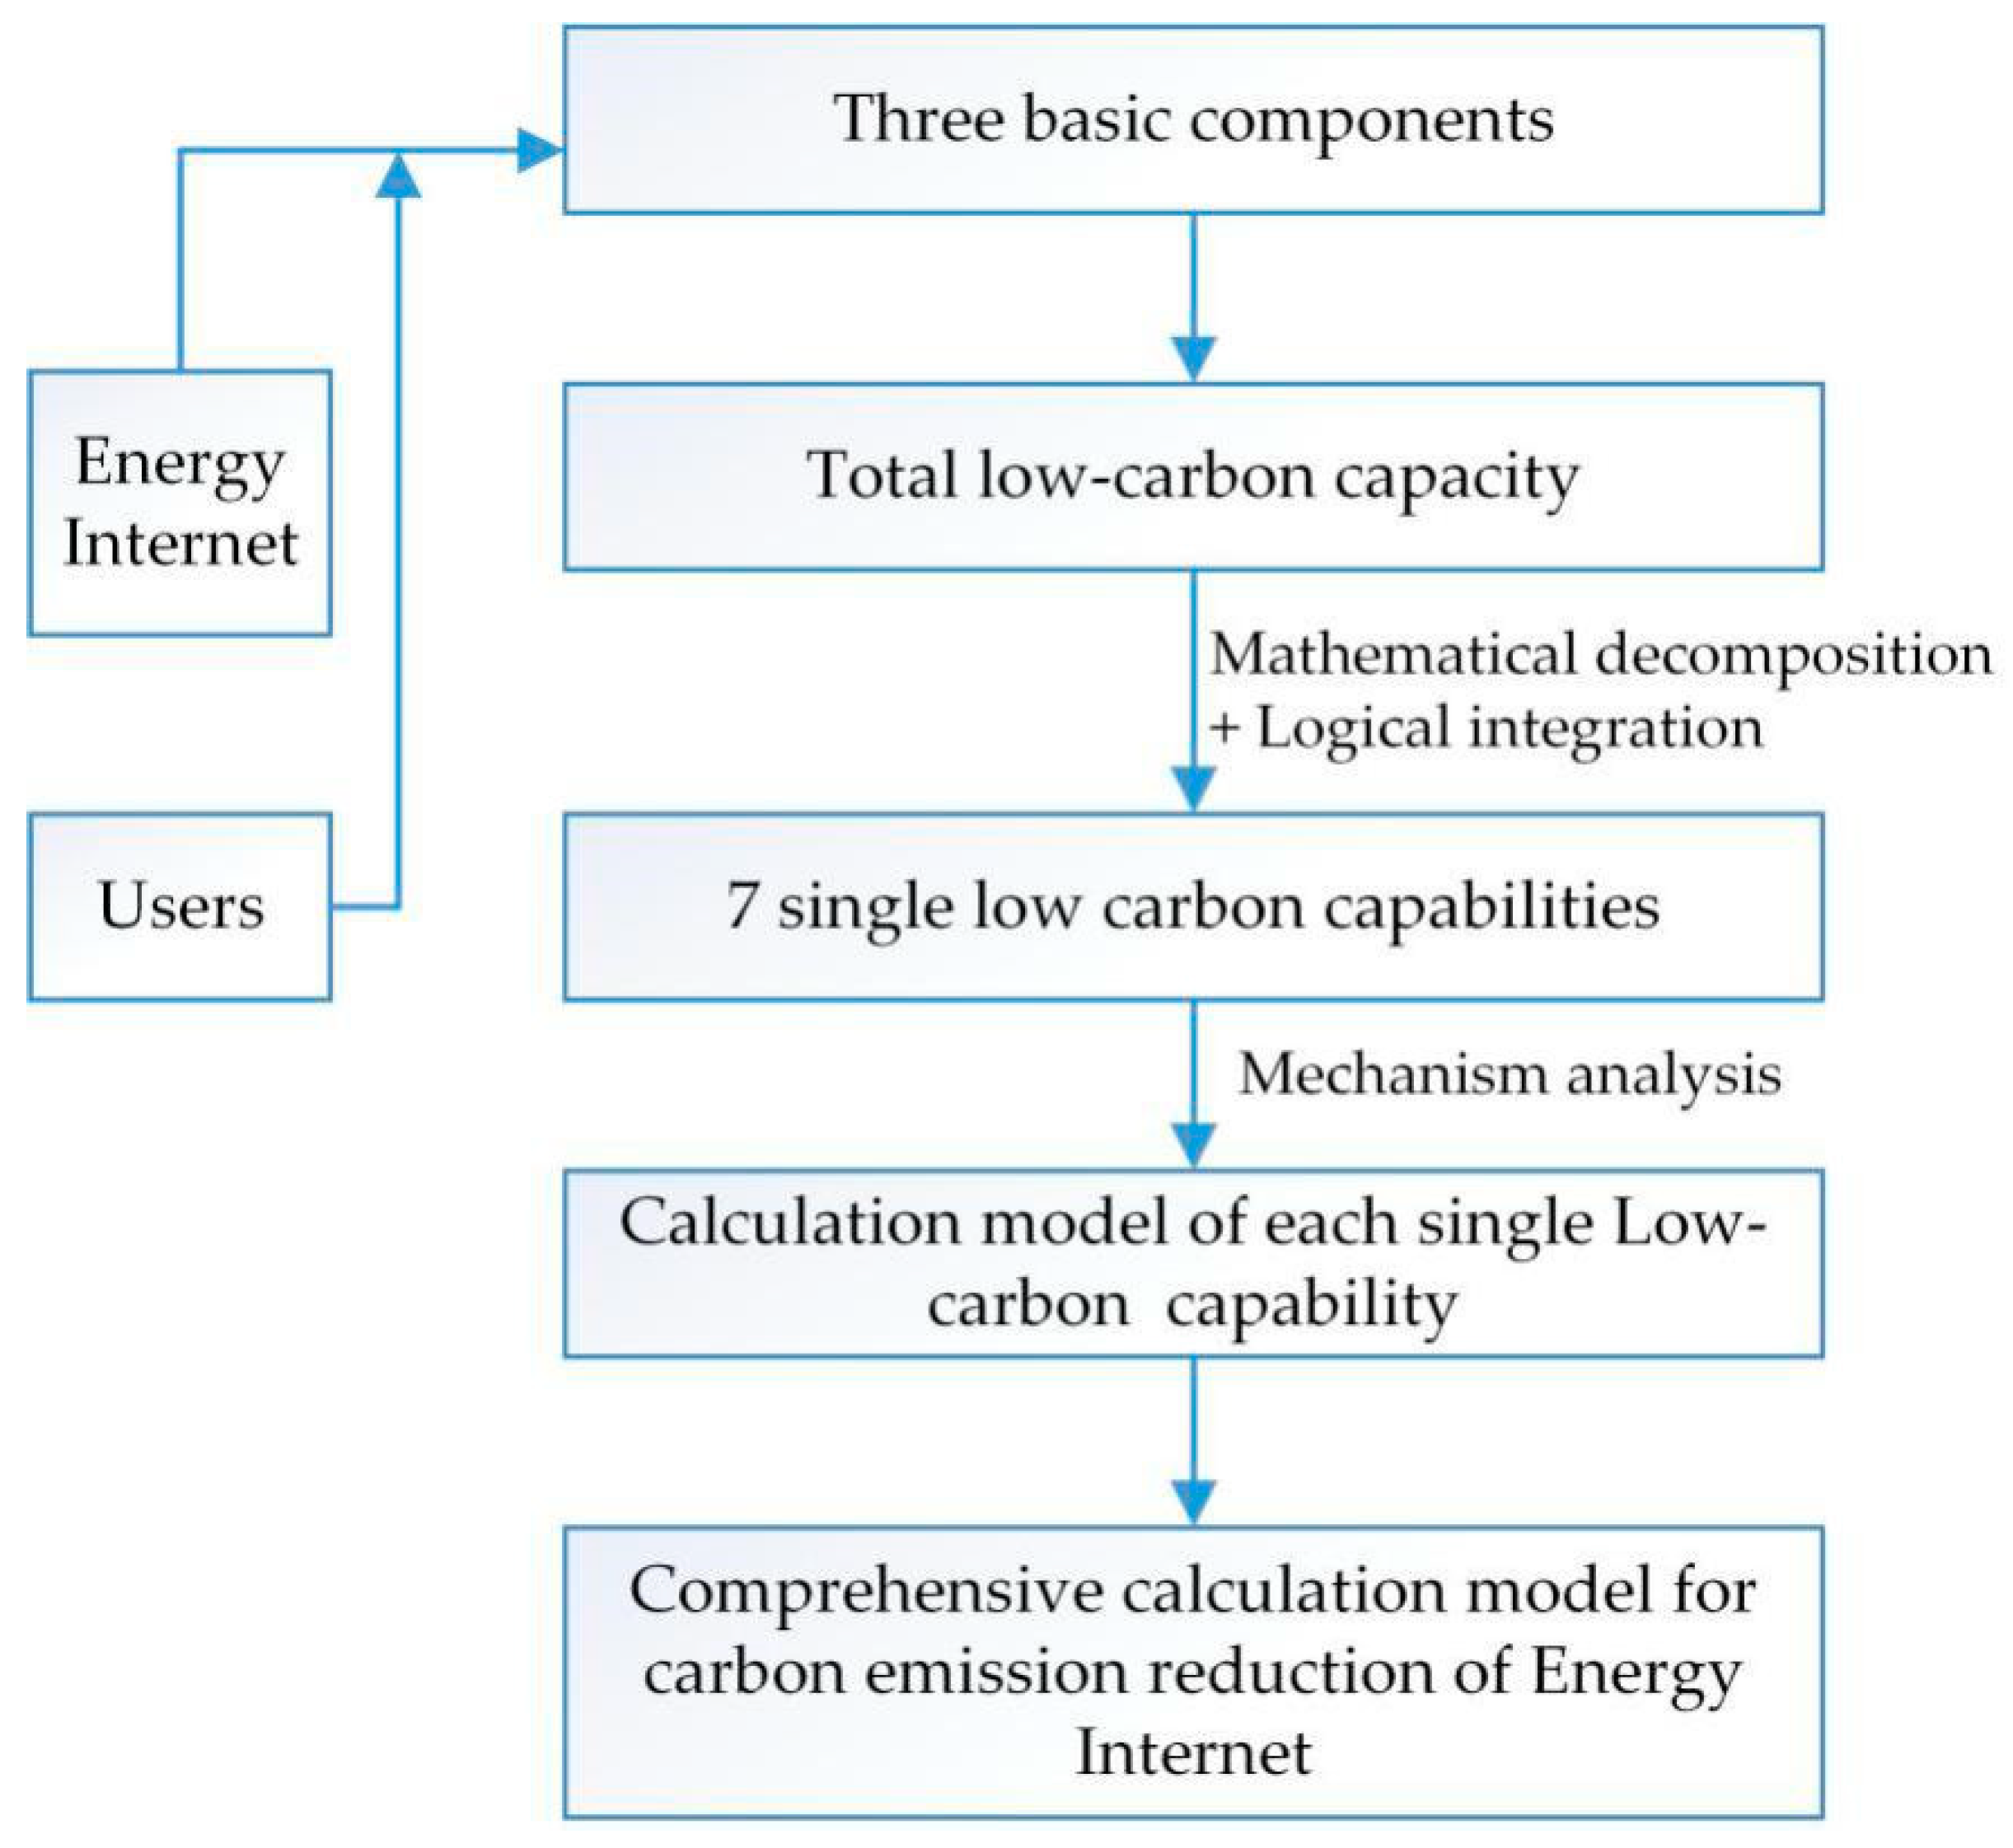
Figure 1. Research ideas of carbon emission reduction on the energy internet.
Sustainability 11 02502 g001
Figure 2. Research model of carbon emission reduction on the energy internet. Renewable energy power generation technology (REPGT); power-to-gas (P2G); vehicle-to-grid (V2G); combined cooling heating and power (CCHP); ultra-high voltage (UHV).
Sustainability 11 02502 g002
Figure 3. Proportion of carbon emissions reduction for each capacity.
Sustainability 11 02502 g003
Figure 4. Radar map of various carbon emission reduction capabilities.
Sustainability 11 02502 g004
Table 1. Calculation data of emissions reduction on power supply side.
ParameterValue
Renewable power generation in 201682,500 MWh
Planned renewable power generation in 202595,030 MWh
CO2 emission coefficient of coal2.62 tco2/tce
Coal consumption of thermal power unit 333 g/(kW∙h)
Increased natural gas power generation12,528 MWh
Data Sources: field survey/Beijing Municipal Bureau of Statistics website/China Carbon Emissions Trading Network [51,52].
Table 2. Calculation data of emission reduction on power grid side.
ParameterValue
Increased permeability of microgrids0.4%
Line loss rate that can be reduced by microgrid0.5%
Power generation of non-energy internet in 2025925 million kW∙h
Data Sources: field survey/Beijing Municipal Bureau of Statistics website [51].
Table 3. Emission reduction capacity of various industries.
IndustryPrimary IndustrySecondary IndustryTertiary IndustryResidential Electricity
Permeability of smart meter70%90%85%90%
Electrical consumption structure2.48%74.92%10.55%12.05%
Energy saving potential0.001%0.002%0.0008%0.003%
Peak-load shifting capacity0.0003%0.0005%0.0007%0.001%
Data Sources: field survey.
Table 4. Data on electric vehicles (EVs) and energy storage equipment.
ParameterValue
Increased number of EVs40,000
Electricity consumed by an EV per 100 kilometers18 kW∙h
Annual average mileage per EV1525 km
Average line loss rate under non-energy internet6.5%
Total number of EVs in 2025100,000
Proportion of EVs participating in charging at peak stage0.005
Average charging power of an EV10 kW
Peak power load scale65 MW
The sum of the total discharge power of energy storage equipment during peak hours0.8 MW
The maximum load in Quanyan under the non-energy internet in 2025986,170 MW
Reduction of coal consumption caused by increase in load rate2.3 g/(kW∙h)
Gasoline consumption per 100 kilometers8.05 L
CO2 emission coefficient of gasoline2.3 kg/L
Data Sources: field survey/Polaris Power Network website [53].
Table 5. Emission reduction for each low-carbon capacity.
Low-Carbon CapacityThe Amount of Total CO2 Emission Reduction
Renewable energy substitution9838.7 tons
Natural gas substitution4918.6 tons
Line loss reduction16.14 tons
Energy saving (negative energy saving)−2566.5 tons
Load shaping430.8 tons
Replacement of gasoline with electricity11,294.15 tons
Overall carbon emission reduction capacity14,093.19 tons