Article

Effectiveness and Sustainability of Grain Price Support Policies in China

1
School of Agricultural Economics and Rural Development, Renmin University of China, Beijing 100872, China
2
College of Economics and Management, Huazhong Agricultural University, Wuhan 430070, China
*
Author to whom correspondence should be addressed.
Sustainability 2019, 11(9), 2478; https://doi.org/10.3390/su11092478
Submission received: 27 February 2019 / Revised: 24 April 2019 / Accepted: 25 April 2019 / Published: 27 April 2019
(This article belongs to the Section Economic and Business Aspects of Sustainability)

Abstract

:
We evaluated the effectiveness and sustainability of the grain price support policies in China using the structural break regime switching model. Based on the rice, wheat, and corn monthly price data from 1987 to 2017, we provide strong evidence that the Chinese grain price support policies have been effective in stabilizing the domestic grain price. A structural change occurred in grain price patterns in 2004 when the price support policies were established. Since then, Chinese grain prices have followed a regime with significantly lower volatility. We documented several problems challenging the sustainability of the Chinese grain price support policies in the future, including high economic costs that can trigger high support prices, high public stock level, and high grain import pressure. Our findings shed new light on the functioning of the grain pricing policies and provide useful implications for the market-oriented reforms in the Chinese grain market.

1. Introduction

Price volatility has been a topic of continuing interest in agricultural markets. High price volatility reflects the market response to changing market conditions, and has different effects on market participants [1]. One prominent example is the grain market, which provides a staple food for human consumption. Hence it gives strong incentive for the government to stabilize the grain prices by implementing various policies. Price support polices were heavily used between 1970 and 1990 in developed countries and are currently used in the developing countries in Asia [2,3]. Although the price support policies contribute to stabilizing the grain market, they usually have negative impacts, such as market distortion and economic costs [4]. Hence, evaluating the effectiveness and sustainability of the grain support price policies is important, especially in large developing countries such as China.
China has achieved remarkable progress in the development of its agricultural market since the 1980s. With the opening up of China’s grain market, the relationship between China’s grain market and the world market has tightened. Thus, the fluctuation of China’s domestic grain prices has a direct influence on the world market. Stabilizing its domestic grain market prices has not only been a task of the Chinese government, but remains a relevant issue for the world market. Since the early 1980s, China has implemented various grain pricing policies to stabilize grain market prices. Whether the Chinese grain pricing policies are effective and sustainable for stabilizing the domestic market remains controversial.
In this paper, we propose a modified structural break regime switching model to investigate the changes in grain price volatility with respect to the support price policies. The classical regime switching model has been widely developed and applied in the literature [5,6,7]. However, a potential problem for the regime switching model is the existence of structural breaks, especially when this model is applied to long-term series data. In this paper, we apply a switching model with structural breaks to investigate the price volatility and price dynamics in the grain market. The usefulness of the approach was verified by applying it to three important Chinese grain markets (rice, wheat, and corn) over 1987 to 2017. In this time frame, China has experienced significant and rapid market reform in its agricultural sector. China has metamorphosed from a country that taxed its agricultural sector to one that subsidizes it. As an important part of this transformation, the price support polices were gradually established in China since 2002. This raises two questions: (1) Were the grain support price policies effective in the stabilization of domestic grain prices? (2) Will the current policy instruments be sustainable in the future?
Our empirical analysis provides useful information on the characteristics of the price volatility in the Chinese grain market. First, we investigated the grain price volatility characteristics in China since 1987 using the structural break regime switching model. We found that China’s grain price has significantly stabilized since the establishment of the price support policies in 2004 with a structural change in grain price patterns. Since then, Chinese grain prices have followed a regime with significantly lower volatility. Second, we documented the challenges to the sustainability of the policy instruments in the future. We found that the grain price support programs have high economic costs. These programs entail high economic costs, high support prices, high public stock level, and high grain import pressure. If these programs continue to impose high costs on the taxpayers, excessive subsidies might cause them to collapse. The government needs to reconsider the design and implementation of these price support programs to avoid market distortions. Our findings indicate the Chinese price support policies have been effective in stabilizing its grain market prices since the establishment in 2004, but they are likely to be unsustainable in the future due to the high economic costs. Based on the results above, we shed light on the functioning of the grain pricing policies and provide useful implications for market-oriented reforms in the Chinese grain market.
The rest of this paper is organized as follows. A brief summary of the grain pricing policies is presented in Section 2. The structural break regime switching model is outlined in Section 3. Section 4 provides our investigation into the price stabilization effects of the grain price support policies in the Chinese markets. Section 5 discusses the sustainability of those policies in terms of policy costs. The concluding remarks are presented in Section 6.

2. Brief Summary of the Grain Pricing Policies in China

China is a remarkable example of a developing country that shifted from taxing its agriculture to subsidizing the sector [8,9]. The grain market institutions and policies have experienced considerable changes. At the beginning of 1950s, China implemented the “state monopoly for purchase and marketing system” in its agricultural market. The grain pricing was almost entirely under the control of the government until the end of the 1970s. From the reform in 1978, China started implementing pricing and marketing reforms to liberalize and further develop its agricultural market.

2.1. Dual-Track Grain Pricing Polices

Since the 1978 reform, China has initiated more price and marketing reforms to achieve greater liberalization [10]. This resulted in a dual-track grain pricing system. The grain under the state compulsory quota was still subject to government pricing policies, but the surplus output entered the private grain market and was traded at market prices [11]. The market prices were typically higher than that made by the government, thus, to some extent, providing incentive for farmers to increase their grain production, However, the implementation of the dual-track price policy varied across provinces and across commodities. For instance, the proportion purchased by the government differed in the north and in the south. So did the taxes imposed on the grains traded in the private market. It simulated the rent-seeking behavior and ultimately affected the expectation of producers and private traders. Thus, the grain price signals under the dual-track pricing system were unclear and misleading, which often caused large fluctuations in grain production and prices. With the development of the market economy in the country, the dual-track grain pricing system was gradually eliminated at the province or county level for specific commodities. In the late 1990s, the share of grain compulsory quota procurement in total production was maintained at only about 10% [12]. The private grain agencies expanded their shares in the grain market over time. From 1998 to 2003, the grain price continued dropping, which subsequently decreased national grain production. Together with the rapid growth of Chinese economy, this triggered a new round of reforms of grain pricing policies to maintain food security and increase farmer income.

2.2. Grain Price Support Policies

In 2004, China officially abolished the grain dual-track pricing system and liberalized its grain market [12,13]. As an important part of the grain market reform, price support polices were gradually established in China. The central government established the price support policy for rice in 2004, for wheat in 2006, and for corn in 2008. The policy names for food grain (rice and wheat) and feed grain (corn) are different. The former is called the Minimum Purchasing Price Policy and the latter is called the Temporary Reserve Policy. However, their policy implementation and effects are quite similar. Gale [8] provided a refined introduction to the price support policies in China. Under the price support policies, grain producers are guaranteed a minimum price for the harvested products. The support price is set by the Chinese government according to market conditions on a yearly basis. When market price falls below support price, the state-owned grain enterprises accumulate public reserves from grain producers. The implementation of the public purchases has predetermined conditions: the programs are only valid in main production provinces and in harvest seasons. Before 2008, the minimum support prices were maintained at a relatively low level. Thus, such programs were not activated for many years and the market prices did not fall significantly. However, the international grain prices increased dramatically to historical-high level in 2007–2008, and remained very volatile from 2008 to 2014 [14,15]. This provided a strong incentive for private grain traders to sell grain to the market and threatened the national food security strategy of the Chinese government. Hence, after 2008, China largely increased its reliance on the price support programs to maintain its grain self-sufficiency goals. As a result, the minimum prices have increased every year since 2009 and became constantly higher than the market price. In this case, grain producers had stronger incentive to sell their products to public stockholders than selling them to the private stockholders. This caused a rapid increase in public stocks and challenged the sustainability of such programs. Table 1 reports the support prices for rice, wheat, and corn from 2004 to 2017. As showed, Chinese rice, wheat, and corn support prices kept increasing from 2008 to 2015. From 2016, the Chinese government started to reduce market expense by controlling the support prices for rice and wheat. Furthermore, the price support grogram for corn was suspended in 2016 by the Chinese government due to the high economic costs.
In general, the policy instruments are relatively similar to the buffer stock policies that were widely used in the Western developed countries from the 1970s to 1990s. Currently, most developed countries have suspended their public buffer stock programs, but some developing countries, including China and India, still rely on these policy instruments as a national food security strategy. Next, we investigated the policy effectiveness by studying whether the grain prices significantly stabilized after the establishment of the price support policies and then further examined the policy sustainability by documenting the potential market distortions and economic costs of the policies.

3. Methodology

Long-term series data usually exhibit distinct changes in the regime, which causes renewed interests in literature. For instance, Sumner [17] provides a refined summary of the long-term trends in agricultural prices, showing that there existed at least four volatile periods in US agricultural markets. However, as the largest developing and grain-consuming country, it remains unclear if grain prices experienced similar regime switches and/or structural changes, and how they evolve conditional on intervention policies. In this paper, we propose using the regime switching model to allow for switches in model parameters and variances. We further incorporated structural breaks into the model to evaluate the changes in the pricing mechanism due to the establishment of the price support policy.
Our model was developed based on the work by Hamilton [5]. This regime switching model has been widely used in studies on economic growth and the business cycle in many countries [6,7]. According to the Markov switching theory, an economic index or price index growth can be divided into two regimes: high growth regime and low growth regime. In this study, we focus on the dependent variable y t , and μ t represents the potential price growth rate. We used state variables to describe the two price growth regimes, with the low price growth regime corresponding to St = 0 and the high price growth regime corresponding to St = 1. In each regime, the grain price obeys the q order regression process:
y t = μ S t + ϕ ( L ) ( y t 1 μ S t 1 ) + μ t , μ t N I D ( 0 , σ S t 2 )
ϕ ( L ) = ϕ 1 L + ϕ 2 L 2 + + ϕ q L q
where L represents the lag operator and ϕ is the parameter associated with L. In this study, our choice of the best lag order numbers is determined by the Akaike Information Criterion (AIC). Hence, the potential growth rates and variances corresponding to each respective growth regime are
μ S t = μ 0 ( 1 S t ) + μ 1 S t
σ S t = σ 0 ( 1 S t ) + σ 1 , S t = 0 o r 1
where μ0 and μ1 represent the potential growth rates of two regimes, and μ0 and μ1 represent the variances used to capture the fluctuation range of every regime. The probabilities of transformations associated with two regimes can be written as
( P ( S t = 0 ) P ( S t = 1 ) ) = ( p 00 p 10 p 01 p 11 ) ( P ( S t 1 = 0 ) P ( S t 1 = 1 ) )
( p 00 p 10 p 01 p 11 ) is the conversion probability matrix. The elements of the matrix are
{ p 00 = Pr ( S t = 0 | S t 1 = 0 ) p 10 = Pr ( S t = 0 | S t 1 = 1 ) p 01 = Pr ( S t = 1 | S t 1 = 0 ) p 11 = Pr ( S t = 1 | S t 1 = 1 )
where p00 and p11 represent the associated probabilities of two regimes: p 10 = ( 1 p 11 ) , p 01 = ( 1 p 00 ) . After this, we incorporated the structural breaks into the regime switching model. In the regime switching model above, we assumed that the switching mechanism (two regimes’ potential growth rates and variances) are not changeable. However, as shown in many studies [18,19,20], price index fluctuations may change over time, especially when strong policy shifts occur. Following this, we used the structural binary break index Dt (0 or 1) to represent two fluctuation mechanisms before and after the structural break. We used 1 − d to represent the probability associated with the structural breakpoint. Then, we have
μ S t = { μ 0 ( 1 S t ) + μ t S t , i f D t = 0 μ 0 ( 1 S t ) + μ 1 S t , i f D t = 1
{ Pr [ D t = 1 | D t 1 = 1 ] = 1 Pr [ D t = 0 | D t 1 = 1 ] = 0 Pr [ D t = 0 | D t 1 = 0 ] = d Pr [ D t = 1 | D t 1 = 0 ] = 1 d and { D 0 = 0 D T = 1
Due to the large numbers of undetermined coefficients and computational complexity, we adopted the Gibbs sampling method by Pesaran et al. [21] in order to obtain all parameter estimations. To extract the estimated parameters, we used the Gibbs sampling that utilizes the statistical property that the conditional distribution of a parameter converges to its marginal distribution upon iterated computation. The posterior marginal distributions of the parameters are derived from their posterior conditional distributions.
Next, the model was applied to investigate the effectiveness of the grain price support policies in China and to determine its accuracy. In the structural break regime switching model, the parameters, including shift parameters and variance, were allowed to differ before and after the unknown breakpoint. Hence, the model allowed us to find whether the price support policies are effective in stabilizing the Chinese grain prices by investigating the structural changes under the pricing mechanism over the period of 1987 to 2017.

4. Empirical Analysis

To investigate the price trajectories and volatilities, we collected monthly wholesale price data for the three main Chinese grain commodities—rice, wheat, and corn—from 1987 to 2017. The price data were collected from the Department of Market and Economic Information, Ministry and Rural Affairs of Agriculture of China [22]. To eliminate the seasonal biases in time series data, we made seasonal adjustments to the price sequences using the X-12 seasonal adjustment method and obtained the price growth rate for each commodity. We calculated the average grain price using the mean of the three commodities to represent the price trend in the grain market. Figure 1 shows the trajectories of the price growth rates of rice, wheat, and corn, and average grain prices. We applied our model to investigate the policy effectiveness by studying whether the grain prices significantly stabilized after the establishment of the price support policies. First, we report the estimation results for three grain commodities. Second, we provide our analysis of the effectiveness of the policy on grain price stabilization.

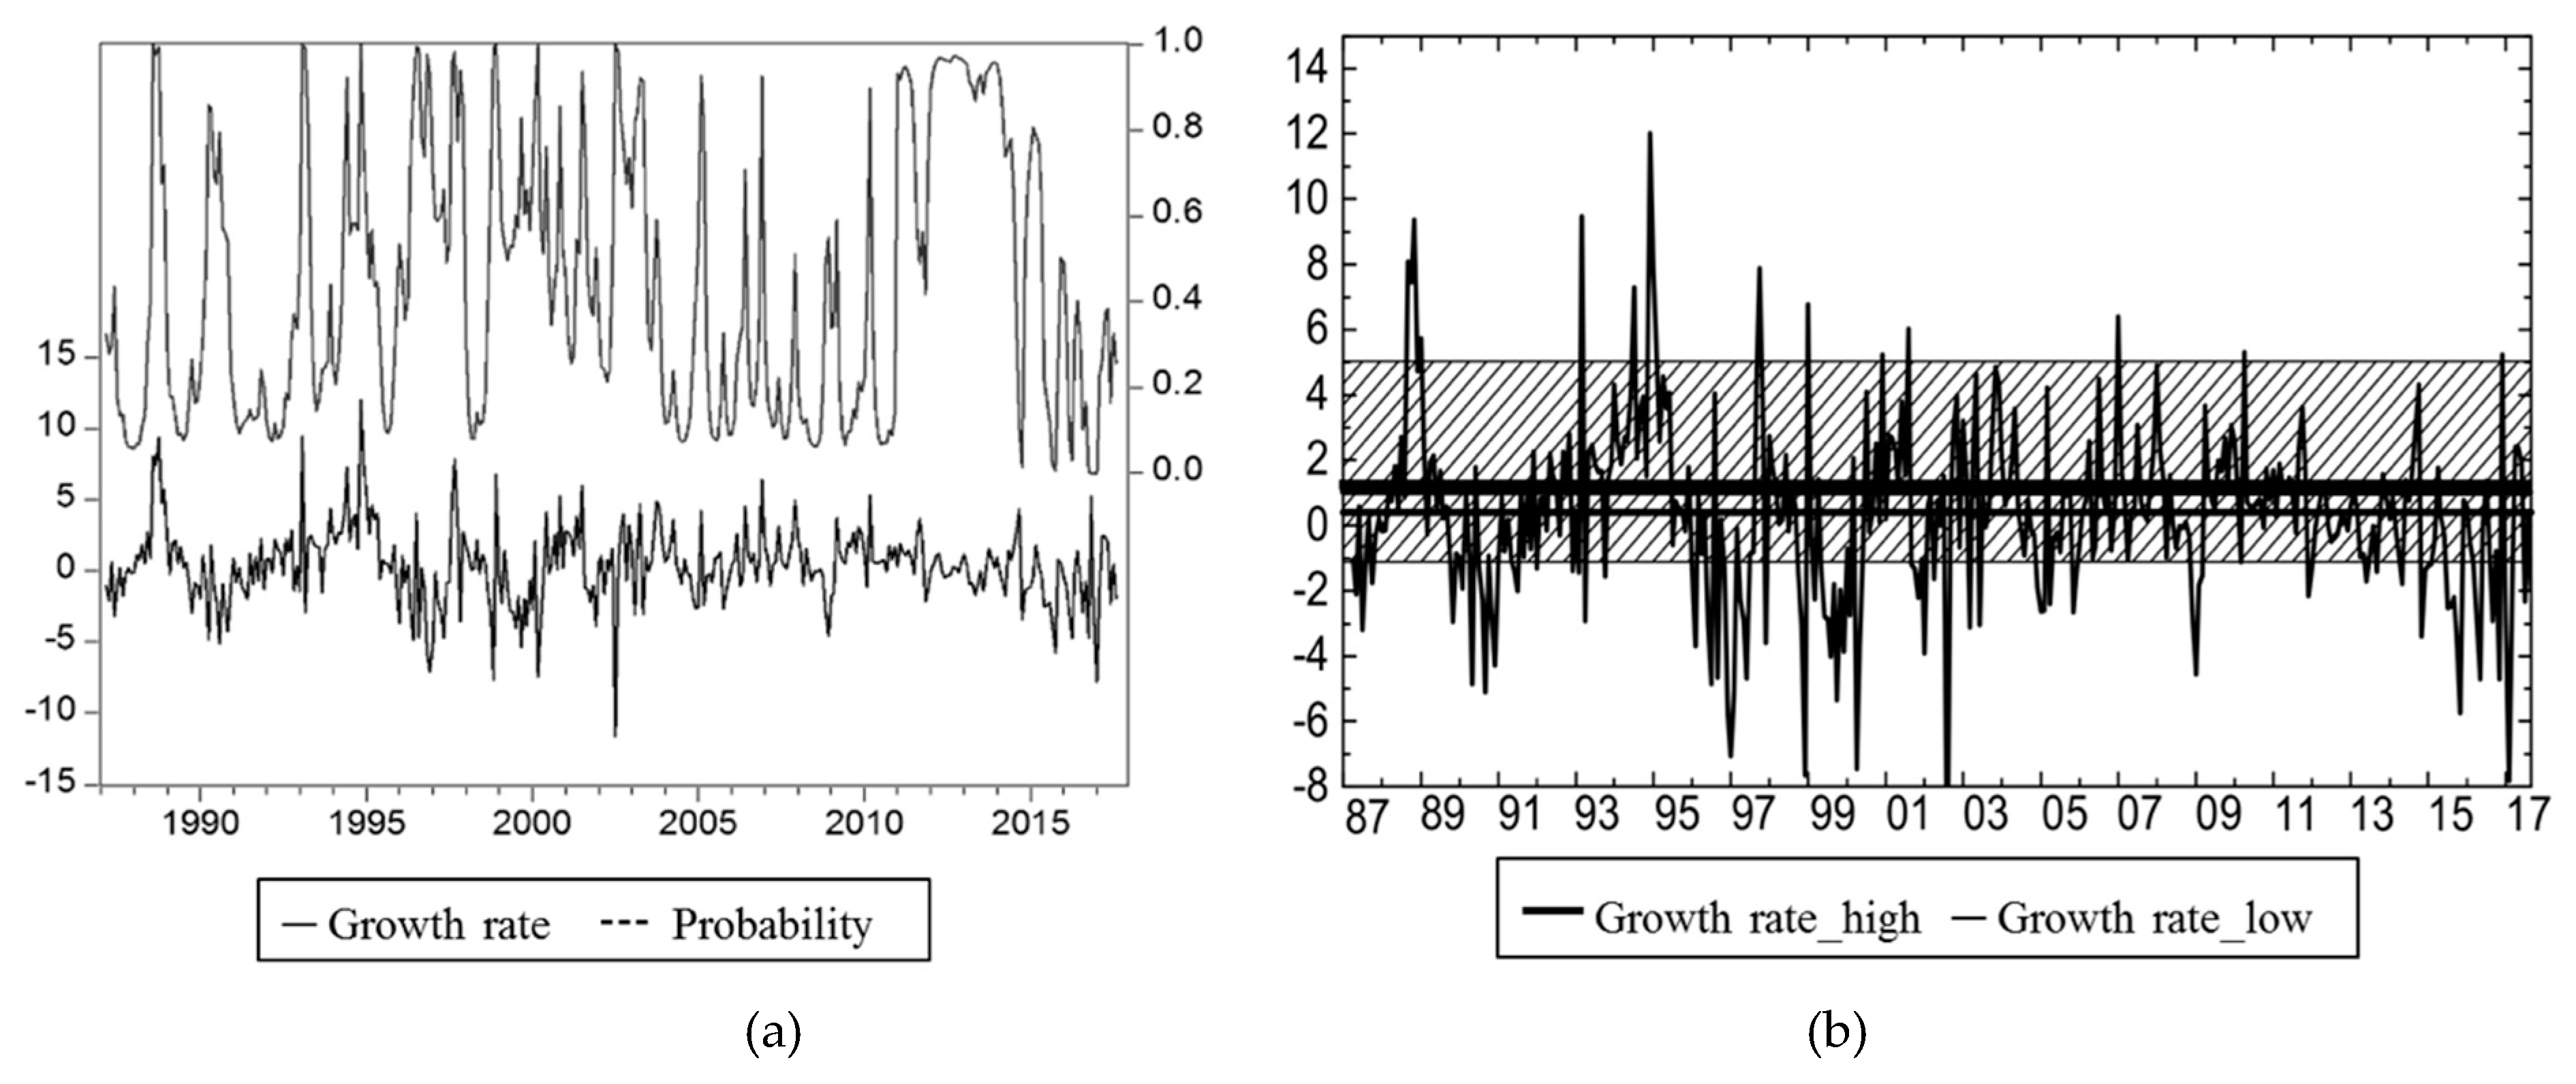
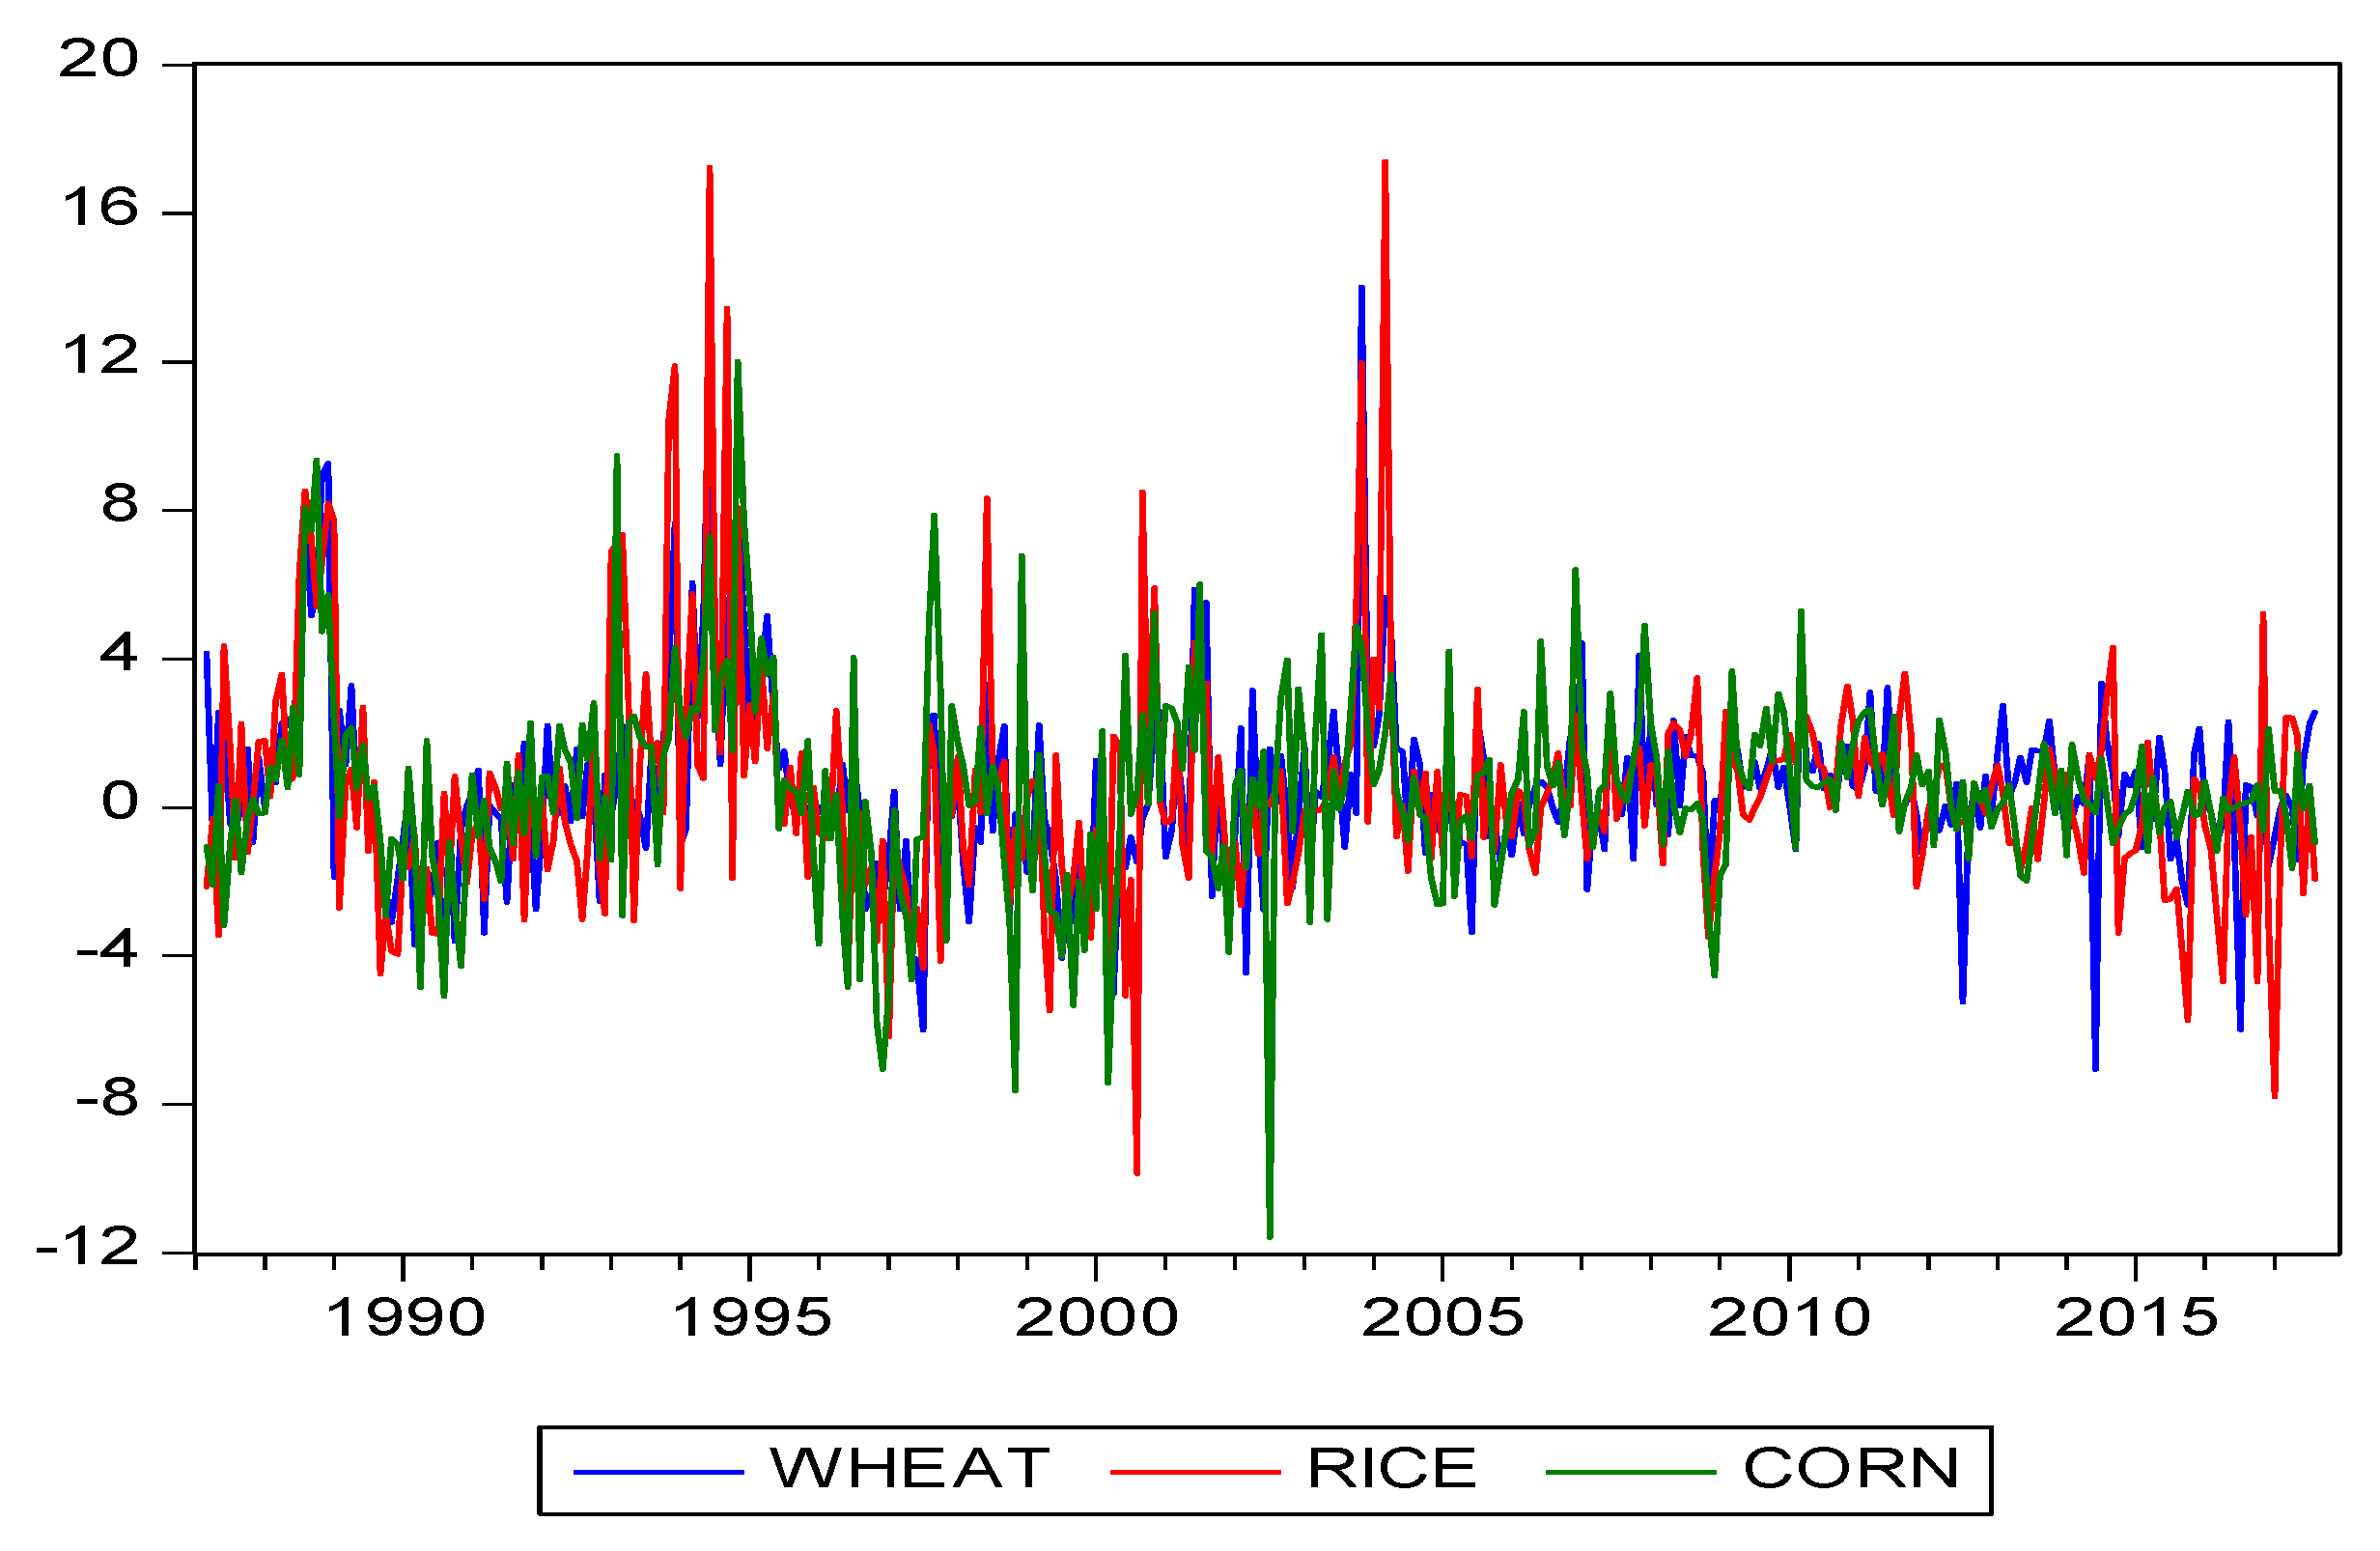
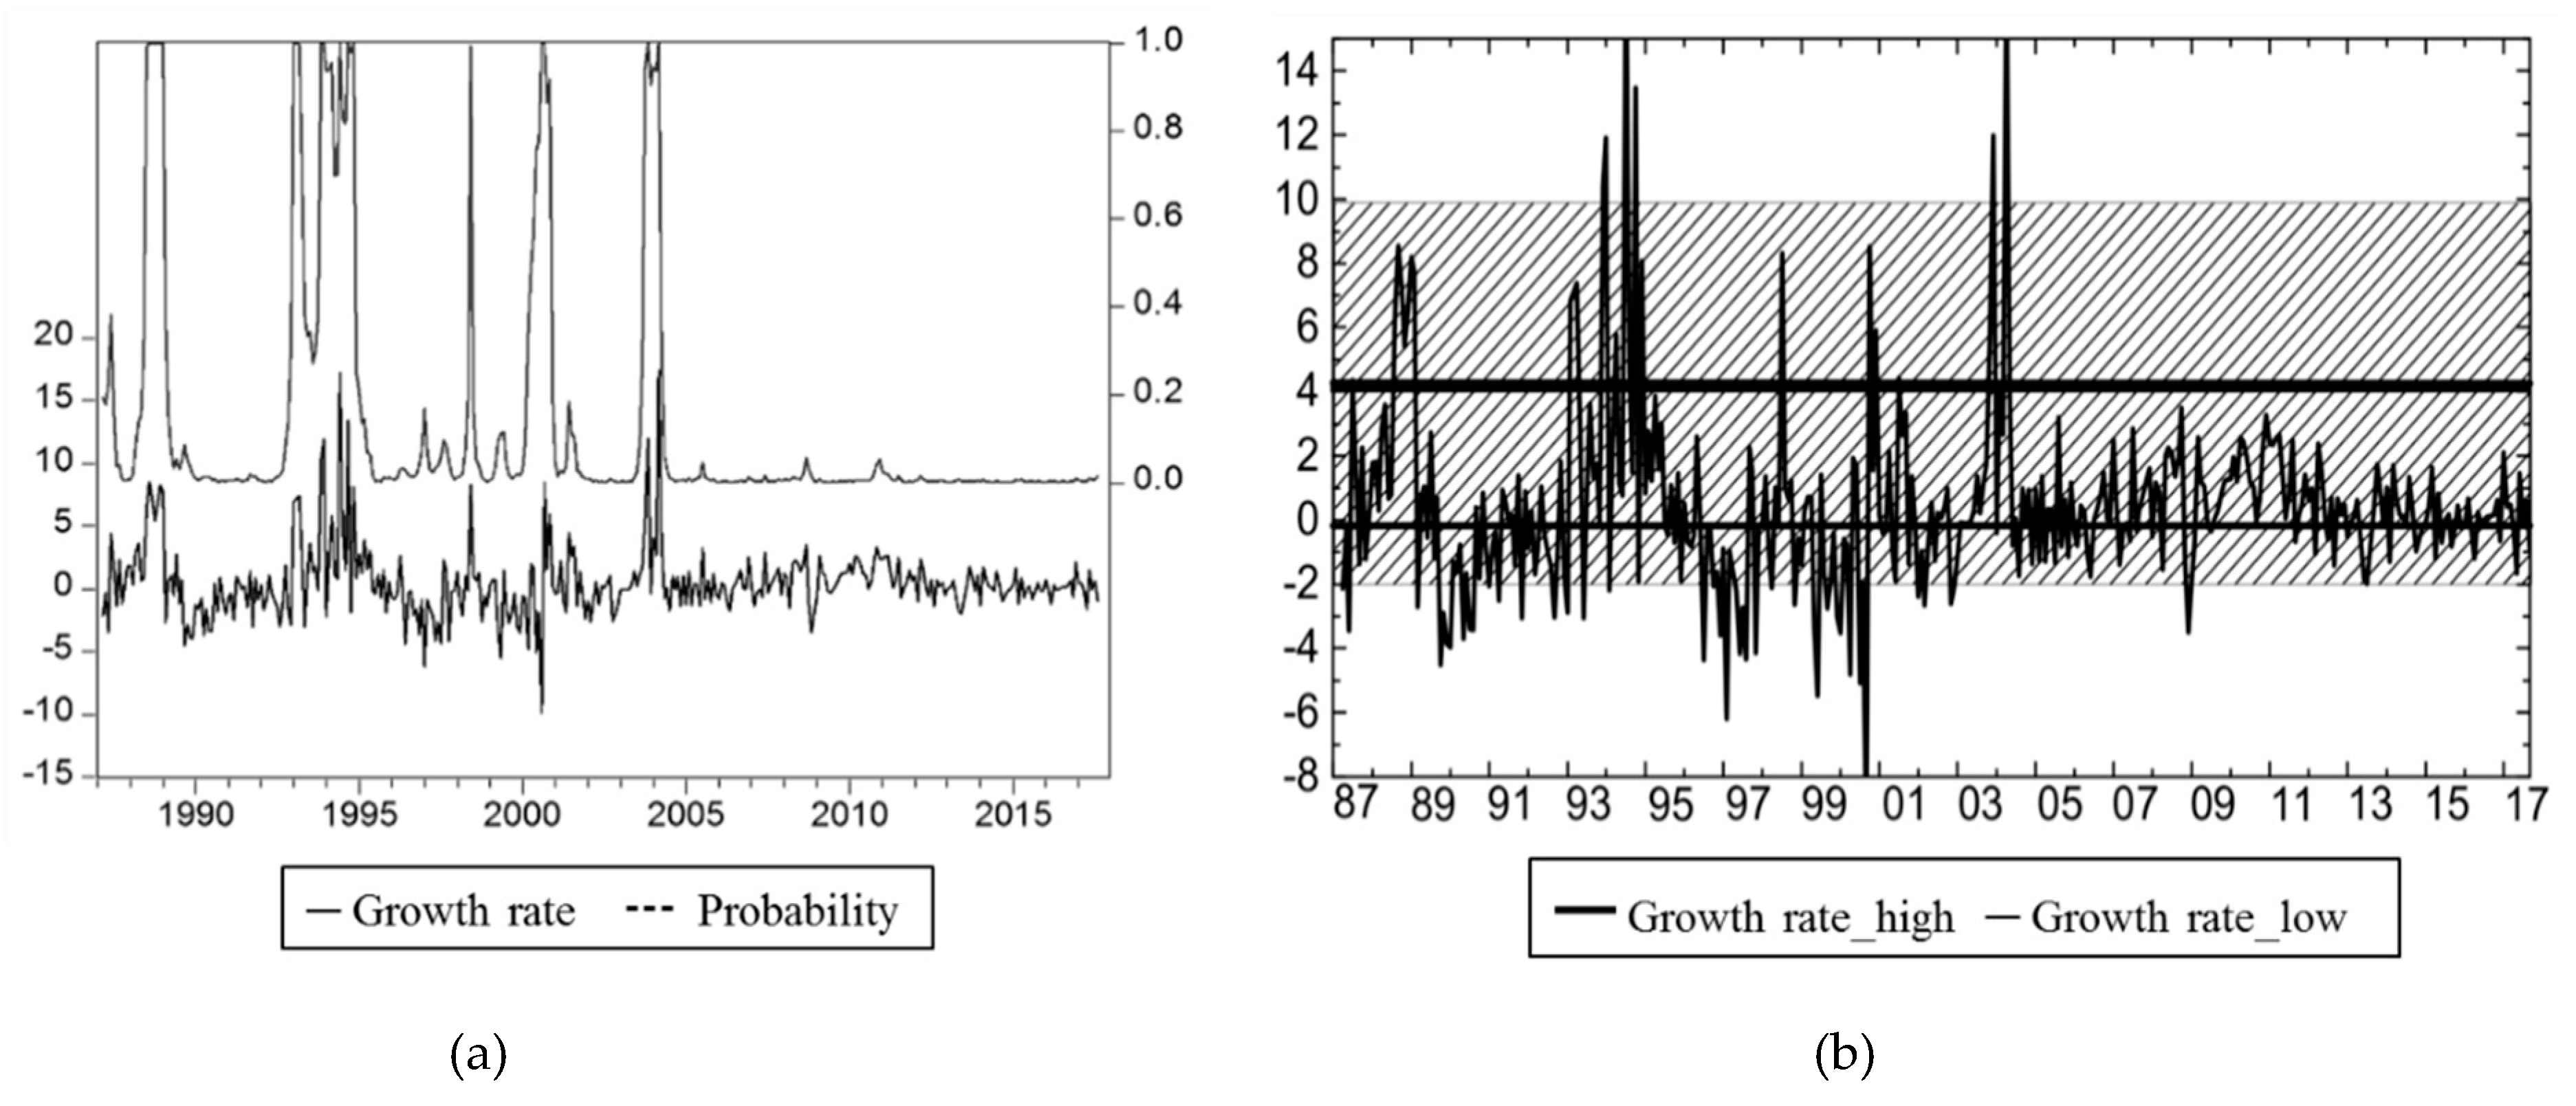
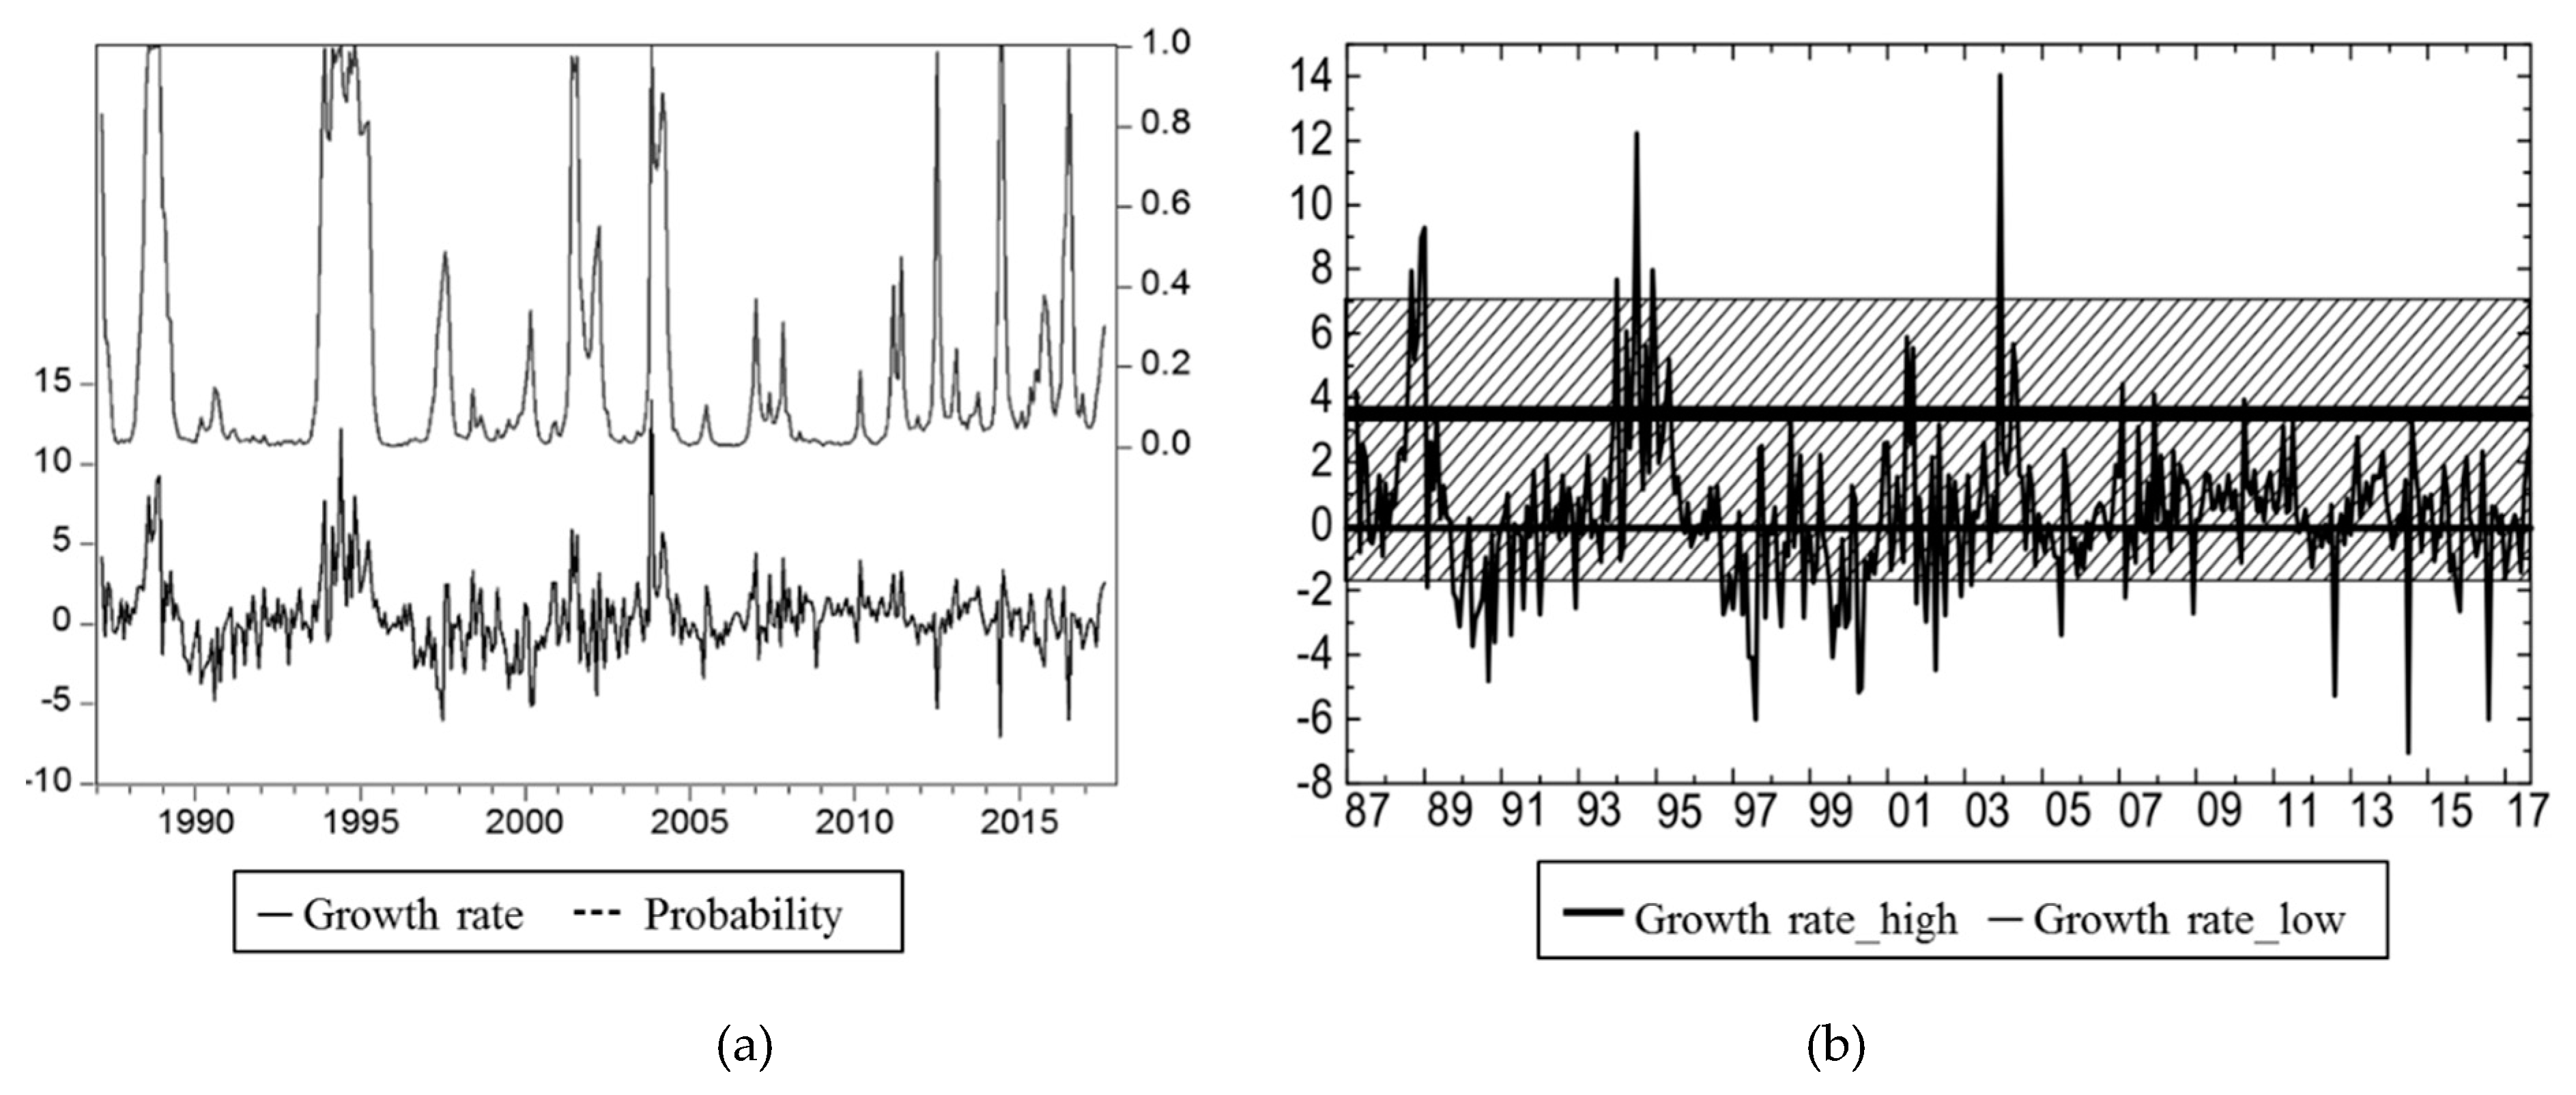
4.1. Estimation Results for Rice, Wheat, and Corn

Using the price data for rice, wheat, and corn over the period of 1987 to 2017, we obtained the parameter estimates of the regime switching model. We started with choosing lag order for the model. After incorporating up to 12 lagged variables, the Akaike Information Criterion (AIC) shows that the model with one lag has the lowest AIC value. Next, we proceed with distinguishing the high price growth regime and low price growth regime before analyzing the periods when the prices fell in these two regimes for each commodity. According to the Section 3, μ 0 and μ 1 measure the potential growth rates of high and low price growth regimes, respectively; σ 0 and σ 1 measure the fluctuation variance of high and low price growth regimes, respectively. Note that the last column “variance” in Table 2 means the variance of the parameters (μ0, μ1, σ0, and σ1), while the last two rows for each product in Table 2 report the variance of the prices in corresponding regimes. Table 2 reports the parameter estimates of the regime switching model for rice, wheat, and corn.
Figure 2 shows the high/low regimes obtained from the regime switching model for rice. In Figure 2a, the solid line represents the monthly price growth rate of rice and the dashed line represents the probability when the rice price is part of the high growth regime. The rice price follows the high growth regime in the years of 1988, 1993, 1994, 2000, 2003, and 2004. In Figure 2b, the thick (thin) line represents the estimated price growth rate in the high (low) growth regime. We also draw the shaded area to show the range of the price volatility in high and low regimes. The lower bond is calculated as u 0 - σ 0 , and the upper bond is calculated as u 1 - σ 1 . According to Table 2, the rice price growth rate in the years that followed the low growth regime ( μ 0 ) was −0.134 and the price growth rate in the years that followed the high growth regime ( μ 1 ) was 3.728. While the former value is not statistically significantly different from 0, the latter one is equal to 3.728 with significance level of 0.05. The price growth rate in high price growth regime is much higher than that in low one. The rice price variance in the years that followed the low growth regime ( σ 0 ) is 1.701 and the price variance in the years that followed the high growth regime ( σ 1 ) is 6.126. Hence, this indicates that both the price growth rate and price variance were higher in 1988, 1993, 1994, 2000, 2003, and 2004 under the high growth regime compared to the other years of low growth regime for rice.
Figure 3 shows the high/low regimes determined using the regime switching model for wheat. In Figure 3a, the solid line represents the monthly price growth rate of wheat and the dashed line represents the probability that the wheat price belongs to the high growth regime. The wheat price follows the high growth regime in 1987, 1989, 1994, 1995, 2002, 2003, 2005, 2010, 2015, and 2017. In Figure 3b, the thick (thin) line represents the estimated price growth rate in the high (low) growth regime and the shaded areas represent the range of the price volatility in high and low regimes. From Table 2, the rice price growth rate in the years that followed the low growth regime ( μ 0 ) was 0.064 and the price growth rate in the years that followed the high growth regime ( μ 1 ) was 3.478. While the former value is not statistically significantly different from 0, the latter one is equal to 3.478 with significance level of 0.01. Consistent with rice, the wheat price growth rate in high price growth regime is much higher than that in low one. The rice price variance in the years that followed the low growth regime ( σ 0 ) is 1.643 and the price variance in the years that followed the high growth regime ( σ 1 ) is 3.585. Hence, both the price growth rate and price variance were higher in the years that followed the high growth regime than the other years that followed the low growth regime for wheat.
Figure 4 shows the high/low regimes obtained from the regime switching model for corn. In Figure 4a, the solid line represents the monthly price growth rate of corn and the dashed line represents the probability that the corn price belongs to the high growth regime. The rice price follows the high growth regime in most years during the sampling period. In Figure 4b, the thick (thin) line represents the estimated price growth rate in the high (low) growth regime and the shaded areas represent the range of the price volatility in high and low regimes. Table 2 shows that the rice price growth rate in the years that followed the low growth regime ( μ 0 ) was 0.401, and the price growth rate in the years that followed the high growth regime ( μ 1 ) was 1.039. While the former value is equal to 0.041, with significance level of 0.1, the latter one is equal to 1.039, with significance level of 0.05. Consistent with rice and wheat, the corn price growth rate in high price growth regime is much higher than that in low one. The rice price variance in the years that followed the low growth regime ( σ 0 ) is 1.523 and the price variance in the years that followed the high growth regime ( σ 1 ) is 3.980. This indicates that both the price growth rate and price variance are higher in the years that followed the high growth regime than the other years that follow the low growth regime for corn.

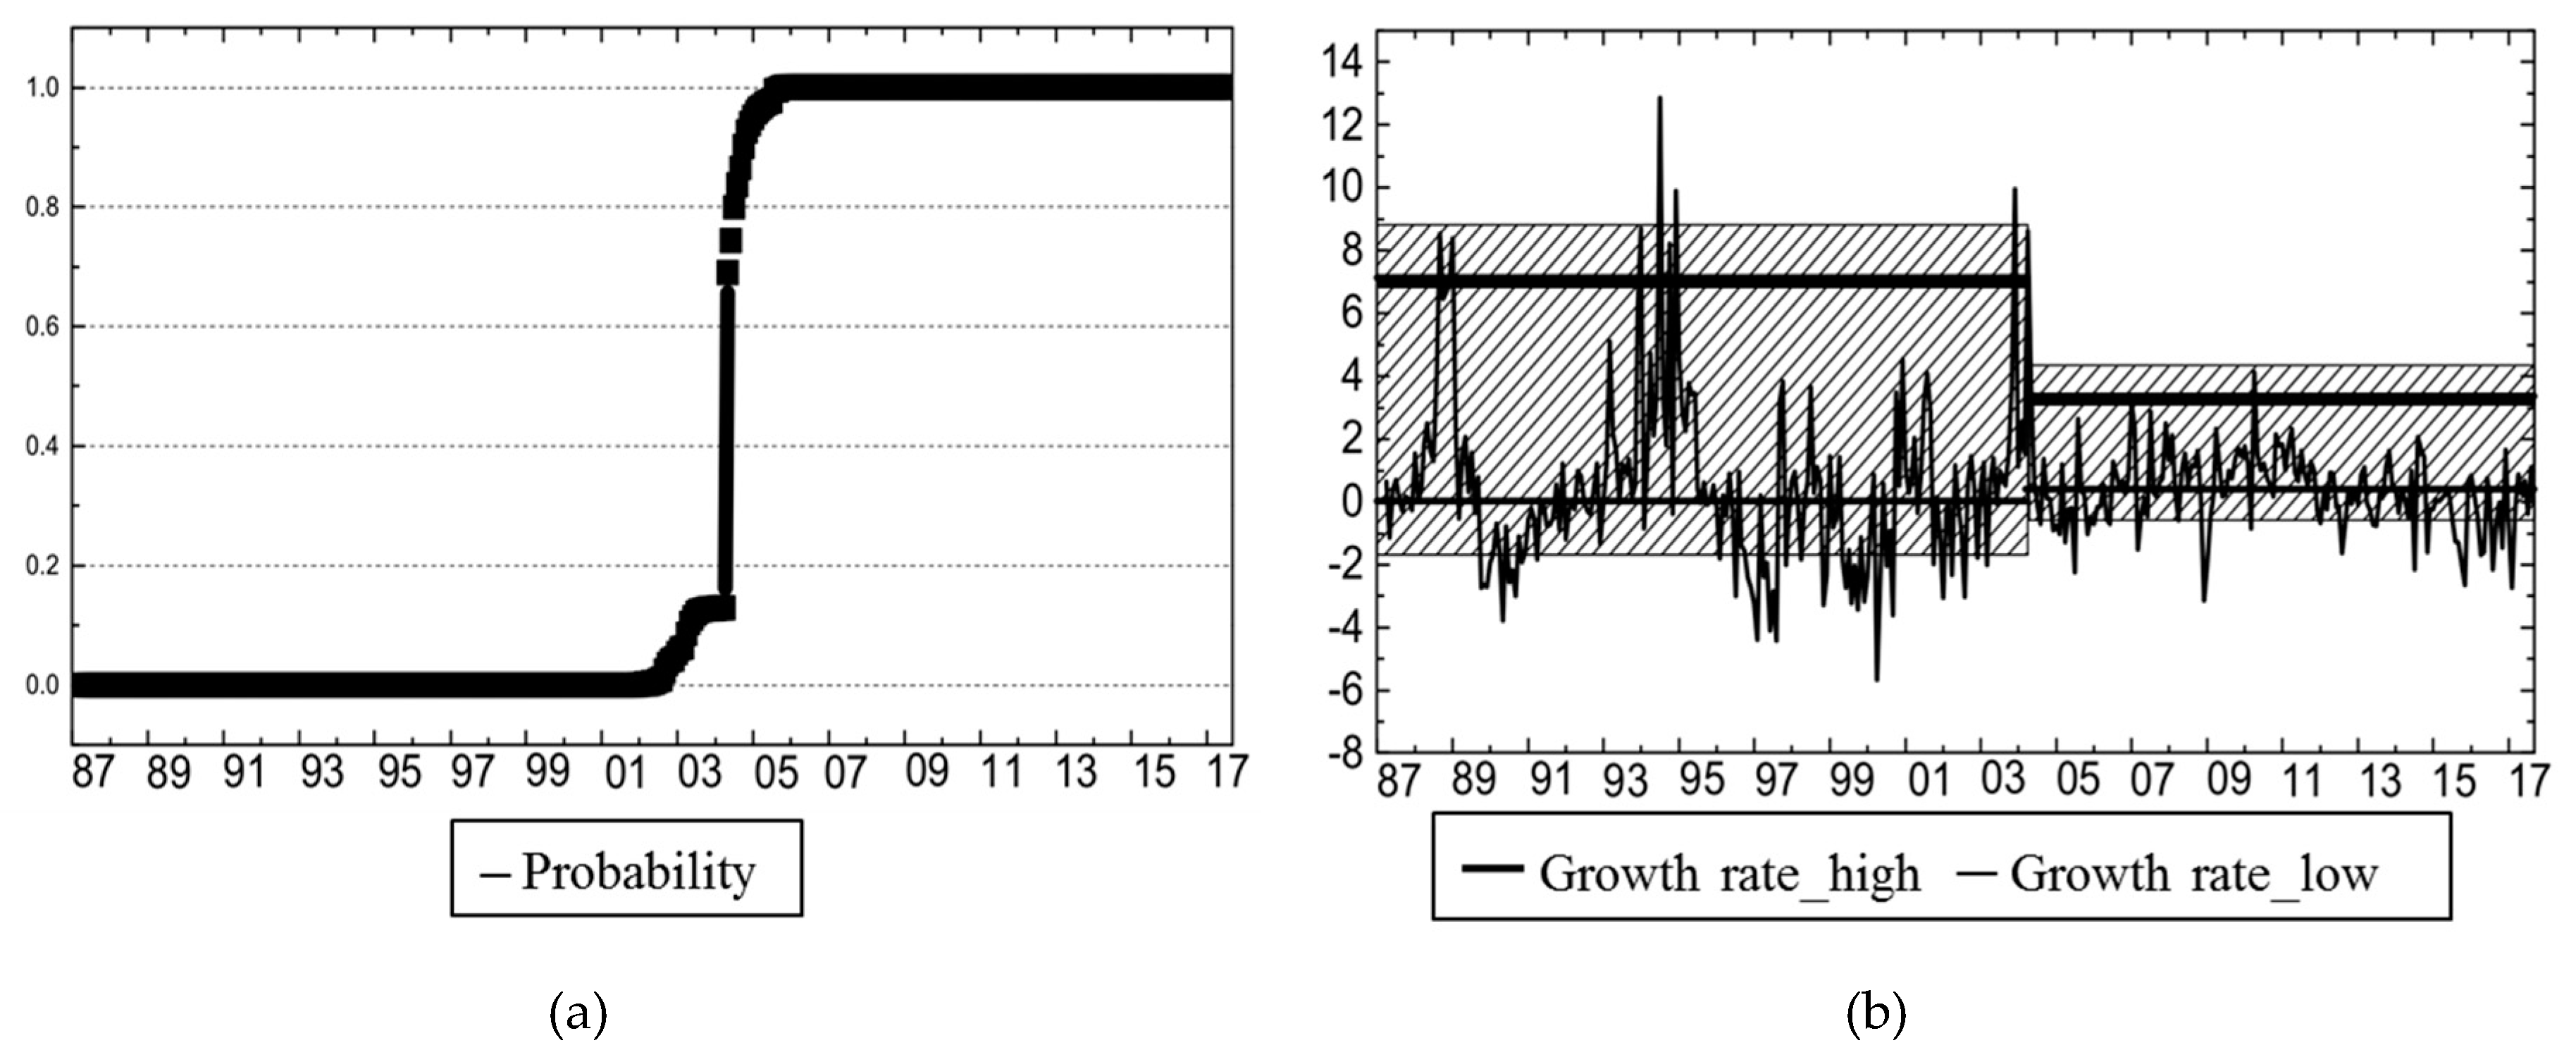
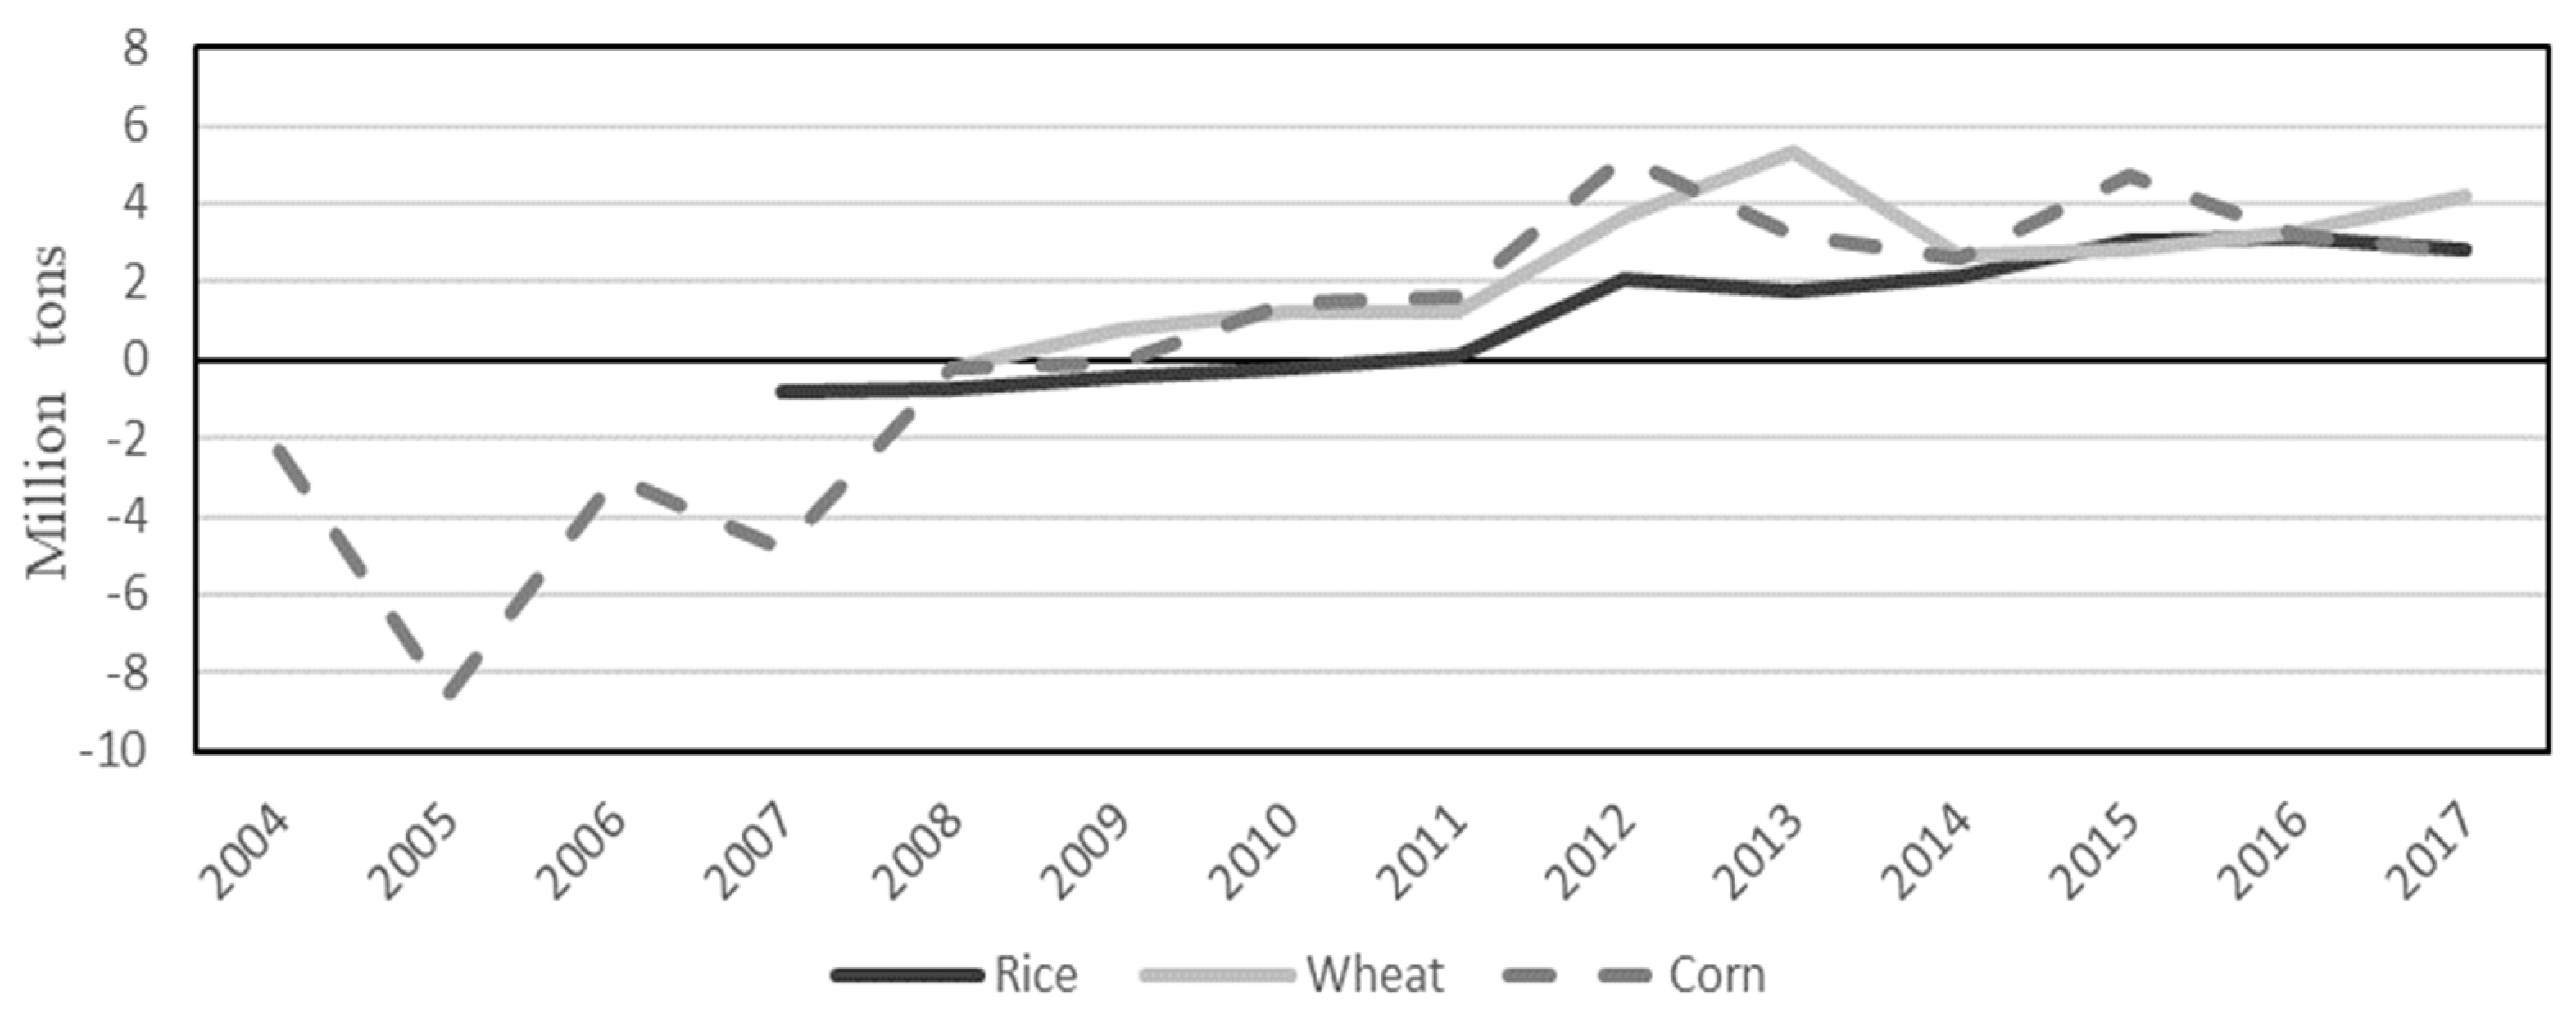
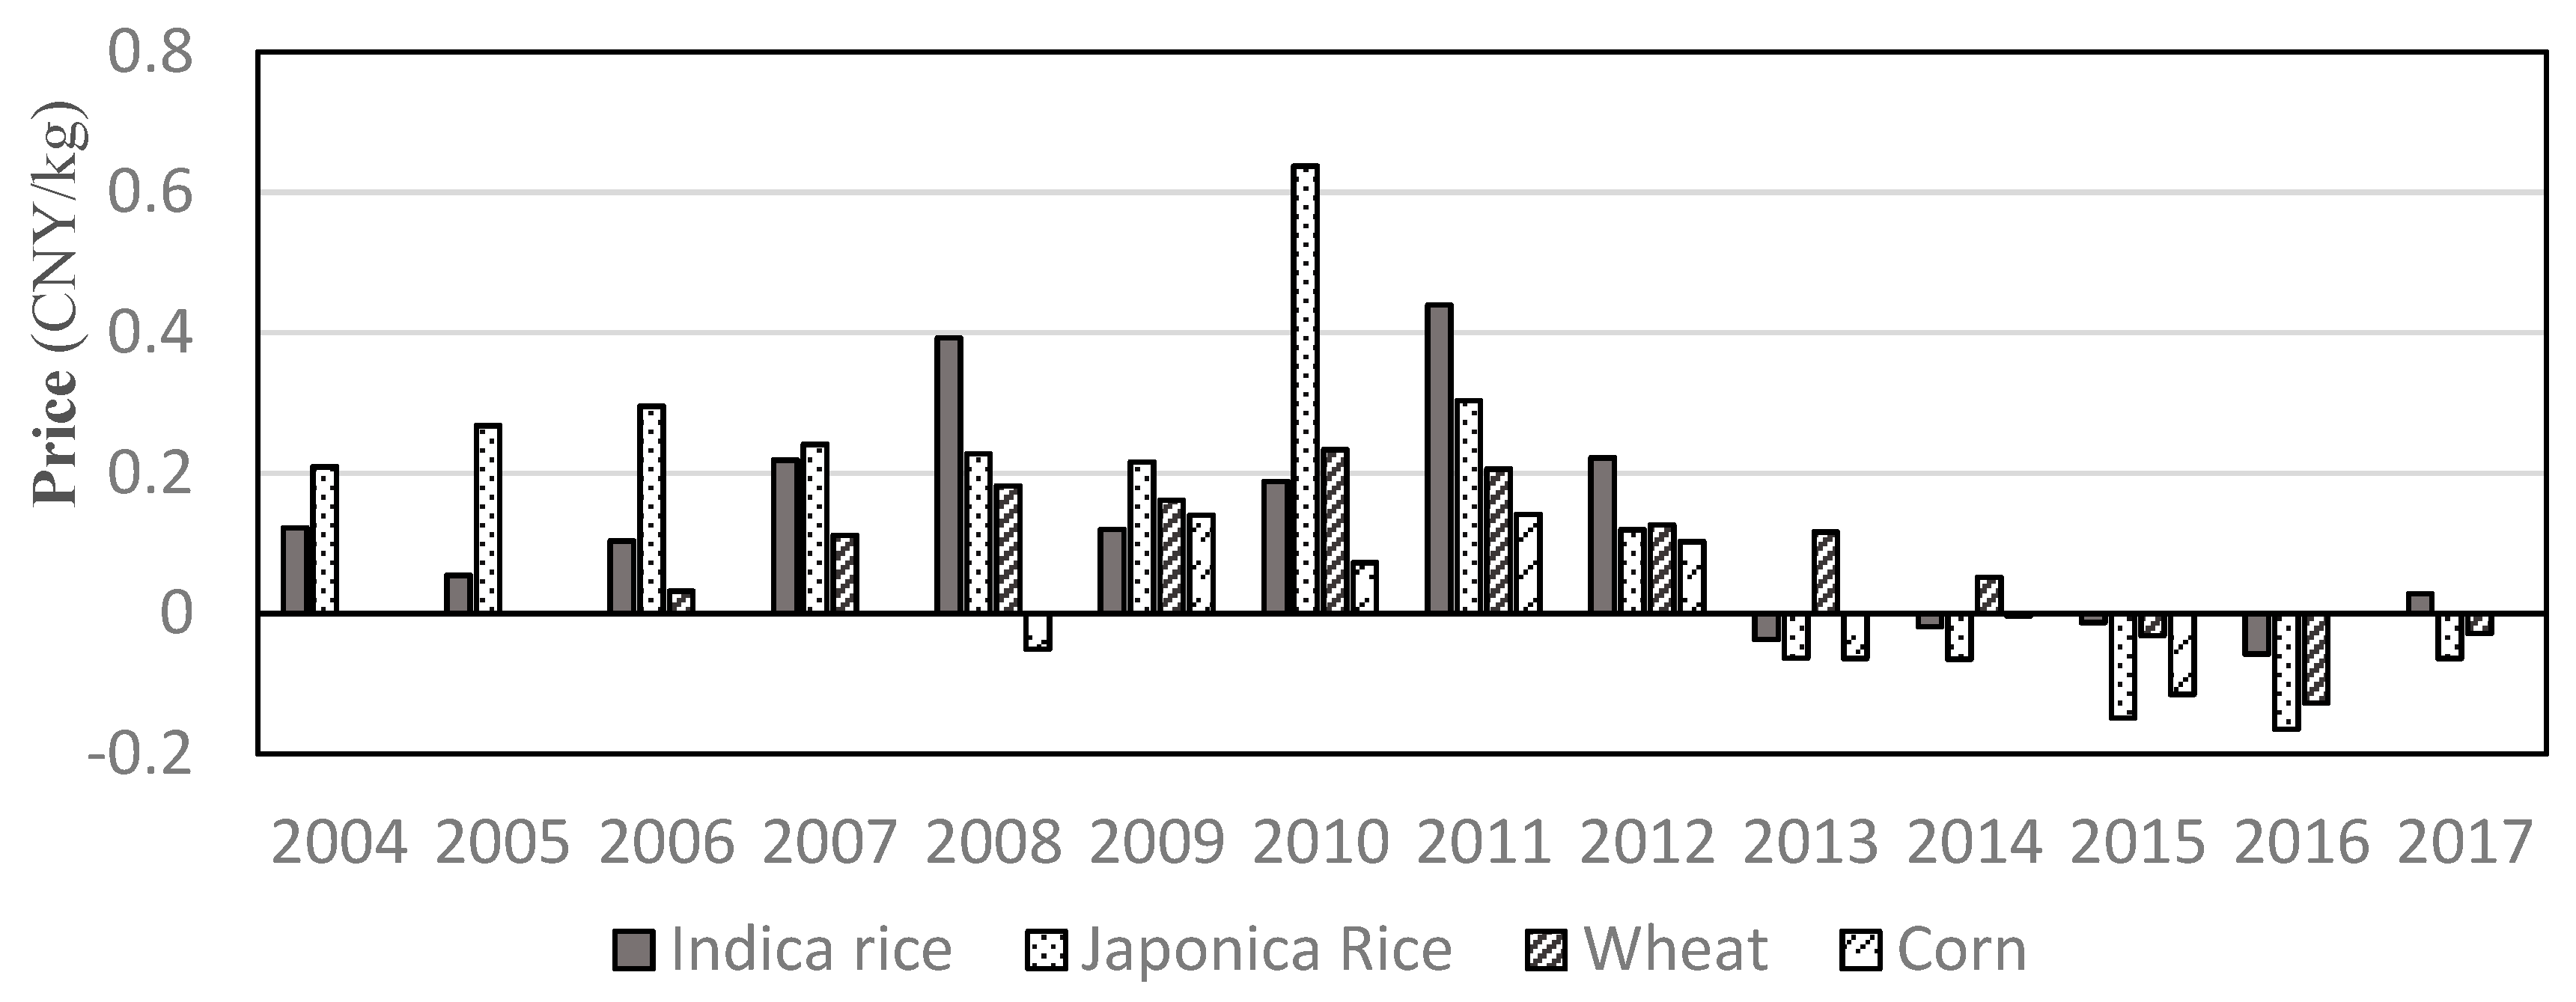
4.2. Policy Effectiveness on Grain Price Stabilization

After analyzing the price growth rates and volatility in different commodity markets, we investigated the effectiveness of the price support polices in stabilizing the Chinese grain market using the regime switching model with structural breaks. More specifically, the policies were considered to be effective if the model showed that the grain prices significantly stabilized after the establishment of the policies in 2004. Otherwise, the policies were considered ineffective in stabilizing the grain market prices. More specifically, the month with the largest increase in the corresponding probability is April 2004. Table 3 reports the model parameter estimation results for the average grain price sequence.
In this study, we use the Gibbs sampling method to detect the unknown structural breakpoint(s). It is a forward-moving testing procedure that keeps calculating the probability of identifying a structural breakpoint at the latest evaluation point (month). Figure 5a depicts the probability associated with the structural breakpoint and Figure 5b shows the potential price growth rates in high and low growth regimes before and after the structural breakpoint. Figure 5a shows the probability of finding a structural breakpoint in 2004 increased significantly. More specifically, the month with the largest increase in the corresponding probability is April 2004. This indicates that the grain price experienced a structural break in early 2004. We found that the price growth rate in the high growth regime before 2004 was significantly higher than that after 2004, whereas the price growth rate in the low growth regime before and after 2004 remained at similar values. The potential growth range shrinks from (7.71%, 0.01%) to (3.37%, 0.36%), with the price variance dropping from 1.7% to 0.98%. This implies that the grain prices significantly stabilized after the establishment of the price support policies in 2004. In other words, we found the price support policies were effective in stabilizing the grain market prices in China.

5. Sustainability Analysis of Grain Price Support Policies

In the previous section, we provided strong evidence that the Chinese grain price support policies were effective in stabilizing the domestic grain prices using the structural break regime switching model. Next, we discuss the sustainability of the grain pricing instruments for the future. Although the price stabilization policies were effective in stabilizing the grain market prices, the policy costs cannot be ignored when comprehensively evaluating the policy [3]. Our investigation regarding the policy sustainability included the economic costs. In general, the implementation of these buffer-stock policies needs government subsidies. Typically, the key factor affecting the sustainability of the buffer stock policies is whether the programs impose a reasonable cost on the taxpayers. Historically, many buffer-stock-based agricultural programs in the U.S. and the EU collapsed due to the relatively high operational costs. Unfortunately, these issues are currently present in China, challenging the sustainability of the policies. In the following sections, we show that the Chinese grain price support policies worked to stabilize the grain market prices but incurred high economic costs. The high costs include three aspects: high support price, high public stock level, and the high import pressure.
In the first few years after the price support programs were established, the support prices were set to be relatively low. Thus, the programs were not used for these years and the market prices did not fall significantly. However, after the 2008 global food crisis, the Chinese government started to increase the support prices. Figure 6 outlines the price difference between the market price and support price. As shown in Figure 6, the support prices were higher than market prices from 2012 to 2017. Hence, these programs were activated every year and a large amount of harvested grain was diverted into public stocks.
The surging support prices triggered excessive public grain stock level in China. Stimulated by the large price difference between the support price and market price, there was strong incentive for the producers to sell their grain to the government grain agencies. In 2015, the state-owned grain reserve enterprises purchased a record-breaking 175 million tons of grain from the producers [23], which accounted for more than 60% of the national grain stocks. The public stocks also resulted in huge holding costs, food waste, and investment for storage construction.
The increasing support prices also widened the gap between domestic prices and international prices. From 2012, the price difference between the domestic prices and import prices surged, thus placing pressure on grain imports. As shown in Figure 7, the net imports of rice, wheat, and corn were positive after 2008 and continued increasing over time. From 2015 to 2017, China imported an average of almost 10 million tons of grains from the world market. Besides, it also triggered imports of grain substitute, such as barley and sorghum, which averaged at more than 15 million tons per year in those three years. This demonstrates the unsustainability of the current Chinese price support policies.
The challenges to the sustainability of price support policy are not incidental in history. Indeed, those similar policy instruments also triggered serious problems in the developed countries [24,25]. As analyzed in Lichtenberg and Zilberman [26] and Gardner [27], the buffer-stock-based price support policies caused large market price distortions and excessive government expenditures, which typically lead to the collapse of these programs. In the case of China, the support prices were constantly higher than the market price, which contributed to rapid increase in public stock accumulation and fiscal expenditure burdens. Moreover, the unsustainable externality of China’s grain support policy on world markets have been highlighted in the recent WTO ruling on China’s agricultural domestic support [28,29,30]. While China kept increasing its domestic support prices, the world grain price significantly dropped after 2014 [31]. This caused a growing price difference between the domestic price and international price, thus going against the WTO trade agreements. In general, the high economic costs and the WTO subsidy limits significantly challenges the sustainability of China’s grain support policies. Starting from 2016, the Chinese government suspended the price support grogram for corn and lowed the support prices for rice and wheat. The grain market reform toward a more market-oriented direction remains an issue in China.

6. Conclusions

We evaluated the effectiveness and sustainability of the grain price support policies in China. Based on the monthly price data for rice, wheat, and corn from 1987 to 2017, we investigated the policy effectiveness by studying whether the grain prices significantly stabilized after the establishment of the price support policies, and further discussed the policy sustainability by documenting the economic costs and WTO restrictions of these policies.
Our empirical analysis provides useful information about the characteristics of the price volatility in Chinese grain market. First, we investigated the grain price volatility characteristics in China for a 30-year period using the structural break regime switching model. We found that China’s grain price significantly stabilized after the establishment of the price support policies in 2004 with a structural change in grain price patterns. Since then, the Chinese grain prices followed a regime with significantly lower volatility. Second, we documented the challenges to the sustainability of the policy instruments in the future. We found that the grain price support programs triggered high economic costs, including high support prices, excessive amounts of publicly-owned stored grain, and high grain import pressure. Based on the findings above, we analyzed the functioning of the grain pricing policies, which has useful implications for market-oriented reforms in the Chinese grain market.
Further research could be undertaken to evaluate the welfare effects of Chinese grain policies on different market participants. There exists intensive literature on the economic welfare effects of commodity stabilization policies in national or global context [32,33,34,35]. Gardner [34] provides a comprehensive analysis on the strategy and implementation of grain price stabilization policies, with a focus on discussing optimal private and public stock rules. Konandreas and Schmitz [32] and Spriggs [35] investigate the welfare effects of price stabilization programs in the US and in Canada, respectively, on producers, consumers, and taxpayers. It is a potential topic to further evaluate the welfare impacts of the Chinese price support programs in future research.

Author Contributions

Conceptualization, J.L. and X.L.; Data Curation, J.L. and X.L.; Formal Analysis, J.L. and X.L.; Methodology, J.L.; Writing—Original Draft, J.L. and X.L.; Writing—Review & Editing, J.L. and X.L.

Funding

This research is funded by the Fundamental Research Funds from Central Universities in China (Grant No. 2662017QD023) and the National Natural Science Foundation of China (Grant No. 71803058).

Conflicts of Interest

The authors declare no conflicts of interest.

References

  1. Tomek, W.G.; Kaiser, H.M. Agricultural Product Prices, 5th ed.; Cornell University Press: Ithaca, NY, USA, 2014. [Google Scholar]
  2. Gupta, N. Government Intervention in Grain Markets in India: Rethinking the Procurement Policy; Working Paper No. 231; Department of Economics, Delhi School of Economics: New Delhi, India, 2013. [Google Scholar]
  3. Li, J.; Li, C.; Chavas, J.P. Food price bubbles and government intervention: Is China different? Can. J. Agric. Econ. 2017, 65, 135–157. [Google Scholar] [CrossRef]
  4. Zilbermann, D.; Hochman, G.; Rajagopal, D.; Sexton, S.; Timilsina, G. The impact of biofuels on commodity food prices: Assessment of findings. Am. J. Agric. Econ. 2013, 95, 275–281. [Google Scholar] [CrossRef]
  5. Hamilton, J.D. A new approach to the economic analysis of nonstationary time series and the business cycle. Econometrica 1989, 57, 357–384. [Google Scholar] [CrossRef]
  6. Simpson, P.W.; Denise, R.O.; Marianne, S. Modeling business cycle movements in the UK economy. Economica 2001, 68, 243–267. [Google Scholar] [CrossRef]
  7. Mills, T.C.; Wang, P. Have output growth rates stabilized? evidence from the G-7 economies. Scott. J. Polit. Econ. 2003, 50, 232–246. [Google Scholar] [CrossRef]
  8. Gale, F.H. Growth and Evolution in China’s Agricultural Support Policies; USDA-ERS Economic Research Report 153; USDA: Washington, DC, USA, 2013.
  9. Rivera-Ferre, M.; Ortega-Cerdà, M.; Baumgärtner, J. Rethinking study and management of agricultural systems for policy design. Sustainability 2013, 5, 3858–3875. [Google Scholar] [CrossRef]
  10. Park, A.; Jin, H.; Rozelle, S.; Huang, J. Market emergence and transition: Arbitrage, transaction costs and autarky in China’s grain markets. Am. J. Agric. Econ. 2002, 84, 67–82. [Google Scholar] [CrossRef]
  11. Putterman, L. Dualism and reform in China. Econ. Dev. Cult. Chang. 1992, 40, 467–493. [Google Scholar] [CrossRef]
  12. Huang, J.; Rozelle, S. The emergence of agricultural commodity markets in China. China Econ. Rev. 2006, 17, 266–280. [Google Scholar] [CrossRef]
  13. Heerink, N.; Kuiper, M.; Shi, X. China’s new rural income support policy: Impacts on grain production and rural income inequality. China World Econ. 2006, 14, 58–69. [Google Scholar] [CrossRef]
  14. Food and Agriculture Organization of the United Nations (FAO). The State of Food Insecurity in the World; FAO: Rome, Italy, 2011. [Google Scholar]
  15. Food and Agriculture Organization of the United Nations (FAO). The State of Agricultural Commodity Markets; FAO: Rome, Italy, 2018. [Google Scholar]
  16. The National Development and Reform Commission of China. Available online: http://www.ndrc.gov.cn/ (accessed on 31 January 2019).
  17. Sumner, D.A. Recent Commodity Price Movements in Historical Perspective. Am. J. Agric. Econ. 2009, 91, 1250–1256. [Google Scholar] [CrossRef]
  18. Sanjuan, A.I.; Dawson, P.J. Price transmission, BSE and structural breaks in the UK meat sector. Eur. Rev. Agric. Econ. 2003, 30, 155–172. [Google Scholar] [CrossRef]
  19. Salisu, A.A.; Fasanya, I.O. Modelling oil price volatility with structural breaks. Energy Policy 2013, 52, 554–562. [Google Scholar] [CrossRef]
  20. Wang, X.; Hui, E.; Sun, J. Population aging, mobility and real estate price: Evidence from cities in China. Sustainability 2018, 10, 3140. [Google Scholar] [CrossRef]
  21. Pesaran, M.H.; Pettenuzzo, D.; Timmermann, A. Forecasting time series subject to multiple structural breaks. Rev. Econ. Stud. 2006, 73, 1057–1084. [Google Scholar] [CrossRef]
  22. The Department of Market and Economic Information, Ministry and Rural Affairs of Agriculture of China. Available online: http://www.moa.gov.cn/zj2017/sj_styj/ (accessed on 31 January 2019).
  23. The Website of the State Council of China. Available online: http://www.ce.cn/cysc/sp/info/201601/05/t20160105_8073502.shtml (accessed on 31 January 2019).
  24. Anderson, K. (Ed.) Distortions to Agricultural Incentives: A Global Perspective, 1955–2007; The World Bank: Washington, DC, USA, 2009. [Google Scholar]
  25. Newbery, D.M.; Stiglitz, J.E. The Theory of Commodity Price Stabilization: A Study in the Economics of Risk; Clarendon Press: Oxford, UK, 1981. [Google Scholar]
  26. Lichtenberg, E.; Zilberman, D. The Econometrics of Damage Control: Why Specification Matters. Am. J. Agric. Econ. 1986, 68, 261–273. [Google Scholar] [CrossRef]
  27. Gardner, B.L. The Economics of Agricultural Policies; Macmillan: New York, NY, USA, 1987. [Google Scholar]
  28. Yu, W. How China’s Farm Policy Reforms Could Affect Trade and Markets: A Focus on Grains and Cotton; Issue Paper; International Centre for Trade and Sustainable Development: Geneva, Switzerland, 2017. [Google Scholar]
  29. Orden, D.; Brink, L. China’s Price Support for Wheat, Rice and Corn under Dispute at the WTO: Compliance and Economic Issues. In Proceedings of the 2018 Agricultural & Applied Economics Association Annual Meeting, Washington, DC, USA, 5–7 August 2018. [Google Scholar]
  30. Brink, L.; Orden, D.; Zulauf, C. WTO Dispute Panel Report on China’s Agricultural Support; Farmdoc Daily (9): 40; Department of Agricultural and Consumer Economics, University of Illinois at Urbana-Champaign: Champaign, IL, USA, 6 March 2019. [Google Scholar]
  31. Yu, W.; Jensen, H.G. Trade policy responses to food price crisis and implications for existing domestic support measures: The case of China in 2008. World Trade Rev. 2014, 13, 651–683. [Google Scholar] [CrossRef]
  32. Konandreas, P.A.; Schmitz, A. Welfare implications of grain price stabilization: Some empirical evidence for the United States. Am. J. Agric. Econ. 1978, 60, 74–84. [Google Scholar] [CrossRef]
  33. Cochrane, W.W. Some nonconformist thoughts on welfare economics and commodity stabilization policy. Am. J. Agric Econ. 1980, 62, 508–511. [Google Scholar] [CrossRef]
  34. Gardner, B.L. Optimal Stockpiling of Grain; Lexington Books: Lanham, MD, USA, 1980. [Google Scholar]
  35. Spriggs, J. Economic analysis of the western grain stabilization program. Can. J. Agric. Econ. 1985, 33, 209–229. [Google Scholar] [CrossRef]
Figure 1. Grain monthly price growth rates from 1987 to 2017.
Sustainability 11 02478 g001
Figure 2. (a) The estimated price growth rate and (b) variance in high/low growth regime for rice.
Sustainability 11 02478 g002
Figure 3. (a) The estimated price growth rate and (b) variance in high/low growth regime for wheat.
Sustainability 11 02478 g003
Figure 4. (a) The estimated price growth rate and (b) variance in high/low growth regime for corn.
Sustainability 11 02478 g004
Figure 5. (a) The structural breakpoint and (b) price changes before and after the breakpoint.
Sustainability 11 02478 g005
Figure 6. The price gaps between market price and support price for rice, wheat, and corn.
Sustainability 11 02478 g006
Figure 7. The net import of rice, wheat, and corn in China from 2004 to 2017.
Sustainability 11 02478 g007
Table 1. The grain minimum support prices in China (2004–2017). Unit: CNY/kg.
YearRiceWheatCorn
Early Indica RiceMid-Late Indica RiceLate Japonica RiceWhite WheatRed WheatMixed WheatCorn
20041.401.441.50----
20051.401.441.50----
20061.401.441.501.441.381.38-
20071.401.441.501.441.381.38-
20081.541.581.641.541.441.441.50
20091.801.841.901.741.661.661.50
20101.861.942.101.801.721.721.80
20112.042.142.561.901.861.861.98
20122.402.502.82.042.042.042.12
20132.642.703.002.242.242.242.24
20142.702.763.102.362.362.362.24
20152.702.763.102.362.362.362.00
20162.662.763.102.362.362.36-
20172.602.723.002.362.362.36-
Source: the official website from National Development and Reform Commission of China [16].
Table 2. The parameter estimates of the regime switching model for rice, wheat, and corn.
CommodityParameterAverageMedian5% Quantile95% QuantileSD
rice μ 0 −0.134−0.140−0.4070.1370.201
μ 1 3.728 **3.6481.4026.2481.475
σ 0 1.701 ***1.7011.5201.8770.109
σ 1 6.126 ***6.0375.0067.5580.795
wheat μ 0 0.0640.069−0.3230.2250.163
μ 1 3.478 ***3.5481.1895.5701.337
σ 0 1.643 ***1.6581.3611.8510.142
σ 1 3.585 ***3.5552.8244.4270.490
corn μ 0 0.401 *0.4060.0170.7730.227
μ 1 1.039 **0.9260.3862.0380.523
σ 0 1.523 ***1.5201.1561.9100.233
σ 1 3.980 ***3.8693.2905.0100.556
Note: (1) μ 0 and μ 1 stand for potential price growth rates of high and low price growth regimes, respectively; σ 0 and σ 1 are the variance of rice, wheat, and corn price in high and low price growth regimes, respectively. (2) SD in the last column represents “standard deviation”, which means the standard deviation of the parameters (μ0, μ1, σ0, and σ1). (3) Asterisks indicate the significance level: * at the 10 percent level, ** at the 5 percent level, and *** at the 1 percent level.
Table 3. The parameter estimation results for the grain price.
ParameterAverageMedian5% Quartile95% QuartileSD
μ 0 0.0080.006−0.4520.4770.274
μ 1 7.173 ***7.1716.1868.1610.597
μ 0 0.3610.358−0.0680.8340.268
μ 1 3.365 ***3.3762.4745.8290.590
σ 0 1.700 ***1.6951.5461.8600.094
σ 1 0.976 ***0.9650.8231.3450.107
Note: (1) μ0 and μ1 stand for potential growth rates of high and low growth regimes before the breakpoint, respectively; μ0* and μ1* stand for potential growth rates of high and low growth regimes after the breakpoint, respectively. (2) SD in the last column represents “standard deviation”, which means the standard deviation of the parameters (μ0, μ1, σ0, and σ1). (3) Asterisks indicate the significance level: * at the 10 percent level, ** at the 5 percent level, and *** at the 1 percent level.

