Article

Bike-Sharing Systems in Poland

by
Tomasz Bieliński
1,*,
Agnieszka Kwapisz
2 and
Agnieszka Ważna
1
1
Faculty of Economics, University of Gdansk; Armii Krajowej 119/121, 81-824 Sopot, Poland
2
Jake Jabs College of Business & Entrepreneurship, Montana State University; Jabs Hall 232, Bozeman, MT 59717, USA
*
Author to whom correspondence should be addressed.
Sustainability 2019, 11(9), 2458; https://doi.org/10.3390/su11092458
Submission received: 28 February 2019 / Revised: 17 April 2019 / Accepted: 17 April 2019 / Published: 26 April 2019
(This article belongs to the Special Issue Sustainable Interdisciplinarity: Human-Nature Relations)

Abstract

:
Bike-sharing is widely recognized as an eco-friendly mode of transportation and seen as one of the solutions to the problem of air pollution and congestion. As there is little research exploring the performance of bicycle-sharing systems (BSS), many municipal authorities invest in their development without knowledge of their effectiveness. Therefore, the aim of this article is to identify factors that correlate with BSS performance. Data related to BSS and urban characteristics were collected for the 56 cities in Poland, which is the population of BSS systems in this country. The Ordinary Least Square regression model was used to estimate the model. Additionally, to support our findings, a survey of 3631 cyclists was conducted. Our main findings show that BSS performance was positively related to cities’ population, tourism, number of bike stations per capita, congestion, bicycle pathways’ length and higher temperature, and negatively related to precipitation. We have also found that one BSS operator was more effective compared to the others.

1. Introduction

Bicycles are an example of an eco-friendly means of transport [1]. Using no fossil fuels and producing no noise or air pollution, bikes help to improve sustainable urban mobility. Moreover, riding bicycles have a positive impact on health, they are relatively inexpensive, and do not cause traffic congestion [2]. The idea of bike-sharing systems (BSSs) makes bicycles more available and used more frequently within urbanised areas, helping to improve urban transport systems [3,4,5]. However, to have such an impact, BSS have to be efficient and attract many users. Recently, de Chardon et al. [6] summarized 75 BSS case studies across the world, examining attributes that correlate with BSS performance. Another stream of literature used surveys to examine the motivating factors associated with a BSS’s use [7]. The aim of this article is to identify factors that correlate with BSS performance in Poland. To achieve this goal, we used a unique approach of combining quantitative data on all 56 existing BBSs in Poland with a survey of Polish BSS users. As this is the first study that uses such extensive and multiple sources of data from Poland, we use exploratory methods. As a measure of BSS performance, we use the number of trips per day per bike (TDB), which is the most common measure of performance (or success) used in previous literature [6,8,9,10,11]. Thus, our first contribution is to examine whether factors found to be effective in BSS performance in other countries relate to the success of BSSs in Poland. Our second contribution is to examine the relationship between tourism and BSS performance, the factor that has not been studied before, but may be an important aspect of BSS performance. Finally, we contribute to the BSS literature by confirming that our exploratory quantitative results match the results from our survey of cyclists.
An increasing number of studies on BSSs has been conducted in recent years, especially since 2010 [12], but only a few studies consider bike-sharing-related issues in Central and Eastern Europe, including Poland, the focus of this study. In Poland, the most popular means of transportation in both urbanised and rural areas is a private car. The car ownership index has been increasing since the 1990s, and in 2016 has reached the level of 571 cars per 1000 inhabitants, according to the Eurostat database [13]. It places Poland among the seven most motorised countries in Europe [14]. Thus, solutions for reducing air pollution and road congestion in Polish cities are urgently needed and this article focuses on one kind of sustainable means of transportation: bike-sharing systems.
Since the 1960s, when the concept of sharing public bicycles first emerged in Europe (The White Bike programme in Amsterdam, Netherlands) [15], many factors of BSSs have changed. First, the coin deposit scheme based on docking stations had been introduced in Copenhagen in 1995. This innovation allowed BSSs to avoid theft and vandalism, which caused the failure of the first generation of BSSs [16]. Second, at the turn of the 1990s and 2000s, BSSs started to be equipped with smart solutions in the form of magnetic stripe cards, electronically locking racks, and bike locks. Finally, telecommunication technology became an inseparable part of contemporary bike rental systems, which made the bike-sharing idea more popular all over the world [17]. The third-generation systems, which are accessible by smart cards or mobile phones and equipped with on-board computers, have been recently upgraded (2015 in China) with Global Positioning System (GPS) tracking and by mobile payment systems via smartphone applications. New, dockless bike-sharing schemes have revolutionized the market, allowing a person to rent and return a bike not at a designated docking station, but at any reasonable location. Dockless systems are also described as free-floating and recognized as the fourth generation of BSSs [18].
Besides technological upgrades, the main difference between the third and the fourth generation of bike-sharing is the funding scheme. For over 50 years of development in Europe, the bike-sharing services’ financing model has been changing, but has always depended on public funds [15]. On the other hand, dockless systems in China were financed by the private sector (the basic sources of funding are investors’ funds, rental fees, loans, revenues from advertising, and users’ deposits). However, many Chinese bike-sharing start-ups bankrupted in 2017–2018. Thus, this model of financing proved to be unsustainable. Despite this, the private sector’s financial contributions had a significant impact on the spread of the fourth-generation systems in China and other countries [19].
Previous studies have tried to identify factors that affect the BSS ridership. In many cases, this kind of analysis requires an analysis of travel patterns [3,18,20,21]. The effects of demographic and built environment characteristics, such as population, job density, or income level, at specific locations were investigated and proved to be positively corelated with ridership [22]. Furthermore, several studies focused on such factors as bicycle infrastructure, land use, seasons of the year, weekdays, weather conditions, and users’ type [23,24,25,26]. Next, we discuss the most impactful papers on this subject in more detail.
Fishman et al. (2014) [7] conducted a survey of members and non-members of BSSs in Melbourne and Brisbane (Australia) and identified two types of barriers affecting BSS usage. The first type of barriers refers to riding a bicycle in general (e.g., distance to overcome, safety perception), and the second refers directly to BSSs’ features (e.g., docking stations density). Regular bike riders are not affected by the first category, thus have fewer barriers to use BSSs in general. The authors concluded that BSSs’ membership depends on convenience and distance to the closest docking station (the shorter the distance, the higher the probability of membership) [7].
Another interesting study by El-Assi et al. [24] was conducted in Toronto (Canada) and was focused on weather conditions, socio-economic and demographic factors, land use, and the built environment. Their results showed a positive correlation between higher temperatures, lower humidity levels, and lower amounts of ground snow with bike ridership. Also, more trips were observed near specific places, such as universities and strategic transit stations. The safety perception was examined, and the study found a positive correlation between the ridership and bicycles’ infrastructure and a negative correlation between the ridership and the number of intersections with main roads [24].
Two Chinese studies conducted using data from Ningbo’s and Nanjing’s BSSs also focused on explaining factors determining the BSS ridership. The first one was based on a survey (986 valid samples) and examined the usage of and satisfaction from BSSs. The cross-equation correlation helped to prove that a higher degree of satisfaction with a BSS increases the probability of bike-sharing usage [27]. The second article presented the results of a survey conducted on a sample of 4939 citizens of Nanjing about a free-floating (dockless) BSS that has been developed there. In the conclusions, the authors presented results for three different travel patterns. They found that college students and employees were more likely to use a dockless BSS when transferring between a bicycle and other means of transport (Transfer Pattern) and when reaching the destination directly (Origin to Destination Pattern) compared to going to the destination and returning (Travel Cycle Pattern). They also showed an inclination to choose Transfer Pattern during the morning peak and choose Origin to Destination Pattern and Transfer Pattern during the evening peak, with the evening peak being overall more significant than the morning peak. Additionally, the authors found that price had an impact on residents’ travel patterns and recommended that prices should be set according to demand and travel distance or riding time of users [3].
In yet another study, a station-level analysis of the Pronto BSS in Seattle showed the causes of its failure. The study investigated factors potentially discouraging citizens from the use of BSSs, including roadway design, land use, bus trips, elevation and weather conditions. The authors identified that elevation and weather conditions were the main causes of system closure in 2017, after three years of operation [28]. However, BSS failures are not very common and, except for the above example, the literature does not describe any other examples. A recent review conducted by de Chardon et al. [6] uses data from 75 case studies across the world. The authors found that one-third of studies reported less than one trips per day per bike (TDB). The authors estimated models with independent variables, such as system attributes and station density, as well as weather, geography and transport infrastructure to examine their correlation with TDB.
The first Polish BSS was introduced in Cracow in 2008. Since then, only a few studies have been conducted to analyse BBSs in Poland. One of them focused on the identification of factors affecting users’ safety in traffic [29]. Another study presented the most important features of bike-sharing schemes by conducting a case study analysis of selected Polish services [30]. Statistical methods, such as network analysis and graph theory, were used in other research to help formulate recommendations for the decision-making process concerning the creation and modification of a bike-sharing network in the Polish city of Bialystok [31].

2. Materials and Methods

2.1. Data Used for Regression Model

To achieve the goal of this article, two kinds of data have been collected. For the first part of the research, data from 56 Polish cities have been collected, which covers all BSSs in Poland. The dataset includes data provided by systems’ operators combined with data published by the Polish Central Statistical Office, Poland’s largest database of the economy, society and the environment: Local Data Bank. This dataset contains information about the number of users registered in bike-sharing systems until the end of 2018, the total number of journeys in every system in 2018 and the duration of the systems’ activity in 2018 (in days). It also includes basic information concerning the bike-sharing infrastructure parameters, information about the built environment and demographic characteristics of each city and settlements equipped with a BSS in the country (including data on tourism and environment, wages and number of registered cars). Historical indicators describing weather were collected from the meteorological services company WeatherOnline Ltd. The data enabled the calculation of indicators used in this study (e.g., bicycle network density, number of cars registered per person, average temperature and number of rainy days during the time the system was functioning). Some of the data on urban characteristics retrieved from the Local Data Bank, such as population, length of bicycle pathways or average wages, were from 2017. However, since such information does not change often, we assumed that we could use it for our research along with the data on BSS characteristics and weather conditions from 2018.

2.2. Survey Data

To support our findings from the regression model, we have used a second type of primary data. The second dataset used in the research is the result of the travel- and bike-sharing-oriented survey collected in nine Polish cities between 1 November 2018 and 5 February 2019. It was conducted on a random sample of 3631 respondents: cyclists and citizens of the following cities: Bydgoszcz, Katowice, Cracow, Lublin, Lodz, Poznań, Szczecin, Warsaw and Wrocław, where the largest BSSs were developed. Data collection has been carried out by the MRC Consulting company using the Computer-Assisted Personal Interviewing technique (CAPI). The survey has been conducted by professional interviewers using electronic devices (a tablet or a smartphone). Interviewers questioned random cyclists on the streets of abovementioned cities. As some of the cyclists did not want to participate in the survey, the rejection rate was 20%. Each interviewed cyclist was provided with a participant information form and consent was implied if the prospective participant chose to proceed. The survey was developed using LimeSurvey software and it is the authors’ own elaboration. A series of preliminary in-depth interviews with cyclists (bike share users and non-users) conducted by the authors helped in developing the survey questions used in this study. Once the survey design was completed and prior to distribution to the sampling frame, a pilot study was undertaken on 21 people. The questionnaire included questions about basic traveller’s features and choices in daily travel around the city. The main purpose of the survey was to identify disincentives for cycling in general and in relation to BSSs. The data was processed using SPSS software.

2.3. Method

We used the ordinary least square (OLS) regression method to estimate the model explaining the association of various factors to performance of bike-sharing schemes measured by TDB. The following model was estimated:
TDBi = β0 + β1 log(Population)i + β2 Nextbikei + β3 log(Years)i + β4 #StationsPerPop10Ki +
+ β5 #CarsPerPersoni + β6 PathsKmPer10KPopi + β7 PaytoAvgi + β8Tempi + β8Raini +
+ β9 TuristsPer1000Popi + εi
where TDBi is the trips per day per bicycle in city i; other variables are clearly defined and described below; βs are coefficients to be determined; and εi is the error term. R software was used to perform the regression analyses.

2.4. Dependent Variable

We used trips per day per bicycle (TDB) in a given city as our measure of BSS effectiveness. The higher the TDB, the more effective the system. This is the most common measure of BSS performance used in previous studies [6,8,9,10,11], including a recent literature review performed by de Chardon et al. [6].

2.5. Independent Variables

Regarding the independent variables, potential factors that might affect BSS performance fall into three major categories: (1) urban features (Population, Congestion, Infrastructure, Income, Tourism); (2) BSS characteristics (Years open, Operator, Stations); and (3) weather (Temperature, Rain).

2.5.1. Urban Features

Population (log(Populaiton)): We control for population of a BSS’s primary city or settlement, since ridership typically rises with the number of people that can use the system. It also controls for the congestion and parking costs of riding a car. For the purpose of our study, we used the population in 2017, which was the latest available data in the Polish Central Statistical Office’s Local Data Bank. We use the logarithm of the population since this variable was heavily skewed. Most of the previous studies controlled for population of the city offering a BSS [23,24,32].
Congestion (#CarsPerPerson): We used the number of cars registered per person in the region to control for congestion. As car ownership statistics in Poland are much higher than the E.U. average, many cities struggle with the problem of congestion. Public bicycles enable commuters to avoid losing time in traffic, so a high number of cars registered in the region should result in a higher ridership of bicycles, including public ones. One limitation connected with this variable is that the data includes all cars registered in the region, not only in the given city or settlement, and some of the cars may not contribute to congestion in the given location. Moreover, cars registered in other regions may appear in the streets of many cities. Car ownership’s influence on BSS ridership as well as the modal split changes between BSS and private cars have been discussed previously by Fishman et al. [8] and Ricci [9].
Infrastructure (PathsKmPer10KPop): We use kilometres of bicycle pathways per 10,000 of population as a measure of bicycle infrastructure density. Many BSS users do not own a bicycle, so they are not experienced cyclists. It is crucial for such people to feel safe when they are using public bicycles, and that is only possible on separate pathways. The importance of pathway density for bicycle ridership was proven in previous studies [23,24].
Income (PaytoAvg): Public bicycles are the most affordable mode of transportation in Polish cities. The majority of BSSs offer the first 15–30 min of usage free of charge. Therefore, public bicycles could be more popular in the regions where salaries are lower compared to other regions. We used an average salary in the region compared to the national average as a measure of income. Other studies that controlled for income include El-Assi et al. [24], Noland et al. [23] and Zhao et al. [10].
Tourism (TuristsPer1000Pop): We believe that the number of tourists visiting a given destination will be positively related to TDB. Some BSSs in Poland function in locations that are important tourist destinations. Tourist information centres usually inform travellers about local BSSs. Many visitors are cyclists that could not bring their own vehicles to their destination, so they are willing to use public ones instead. Therefore, we test if there is a significant positive correlation between tourism and TDB. We used the number of tourists purchasing hotel services in a given city per 1000 population. To our knowledge, this has not been explicitly tested in previous studies.

2.5.2. BSS Characteristics

Operator (Nextbike): Nextbike is a binary variable that takes a value of 1 for systems operated by Nextbike company and 0 otherwise. Since Nextbike operates 80% of BSSs in Poland, we expect that they are more effective and perform better compared to their competition. Other studies controlled for the major operator of the system as summarized by de Chardon et al. [6].
Years Open (log(Years)): Time since the launch of operations was also incorporated into our model because people may initially not know about the existence and functions of BSSs. Operators and municipalities promote their systems, but it takes time before a BBS is accepted as a means of transportation in the collective consciousness. Additionally, with experience, the system may be optimized to the city’s conditions. We used the log of years, as some systems had been operating much longer than others, which made the distribution very skewed. Ricci [9] and Zhao et al. [10] found that, with time, more people register to BSSs and more people are familiar with a BSS’s features.
Stations (#StationsPerPop10K): We use the density of stations defined as the number of stations per 10,000 of population. A BSS with a high density of stations is comfortable to the user, as an average walking distance to the station is shorter. It enables customers to plan their trips more efficiently and reach destinations faster. This variable has also been examined previously [10,22,32].

2.5.3. Weather

Average temperature (Temp) and the number of rainy days (Rain) during the time the system was functioning are the two variables used in the model that control for meteorological conditions. Cyclists are more exposed to elements than public transportation passengers or drivers. Therefore, we expect fewer people to use BSSs in cities and times when temperatures are lower and there are more rainy days. This was also shown in research by El-Assi et al. [24] and Gebhart et al. [33].

3. Results

3.1. General Information and Basic Data on Bike-Sharing Systems in Poland

Table 1 presents definitions and descriptive statistics. The number of bike-sharing systems in operation worldwide increased at the average annual rate of 28.5 percent between 2008 and 2018 [34]. Following that global trend, bike-sharing in Poland grew rapidly in 2018. In 2017, there were 1.3 million users registered in 31 BBSs in Poland. The number of BSSs increased to 56 in 2018, and the number of registered users reached over 1.8 million (39.1% growth). The country’s fleet of shared bicycles has grown by 14.5%, from almost 16,000 to over 18,000. The number of rides increased from 12 to 15.5 million (28.7%). The bike-sharing market in Poland in 2018 was dominated by the company Nextbike Polska, which had an 80% share in the market. Nextbike Polska systems were station-based. Other companies developed BSSs that were hybridized with GPS locks but with preferred parking locations (e.g., Cracow). For the purpose of this study, these locations were counted as stations. All bike-sharing systems in Poland were at least partially financed by local authorities. Only 27% of Nextbike Polska revenues in 2018 were based on sales to private customers. Revenues from private sources included advertising, rental fees and sales of stations financed by corporate clients [35]. In 2018, shared bicycles were available to people living in the settlements of a joint population of 9.9 million, which is 26.2% of the Polish population.
Although most BSSs are managed by the same company, they vary in performance. The mean TDB in Polish bike-sharing systems in 2018 was 1.93. The best performing BSSs were the ones located in relatively big cities: Poznań (4.89 TDB) and Wrocław (4.88 TDB), and the worst performing were the new, small BSSs in Marki and Żory (0.12 TDB). The range of estimated TDB values, 0.12–4.89, is slightly lower than those observed in a review of 75 BSS case studies across the world (0.22–8.4 [6]) and 69 Chinese case studies (0.7–9.5 [10]), and with a lower mean of 1.93 compared to [6] of 2.42 and [10] of 4.2. Exactly matching de Chardon et al. [6] study, 30% of Polish cities had an estimated usage below 1.0 TDB. This indicates that, in one-third of the cities, some bicycles remain unused each day.

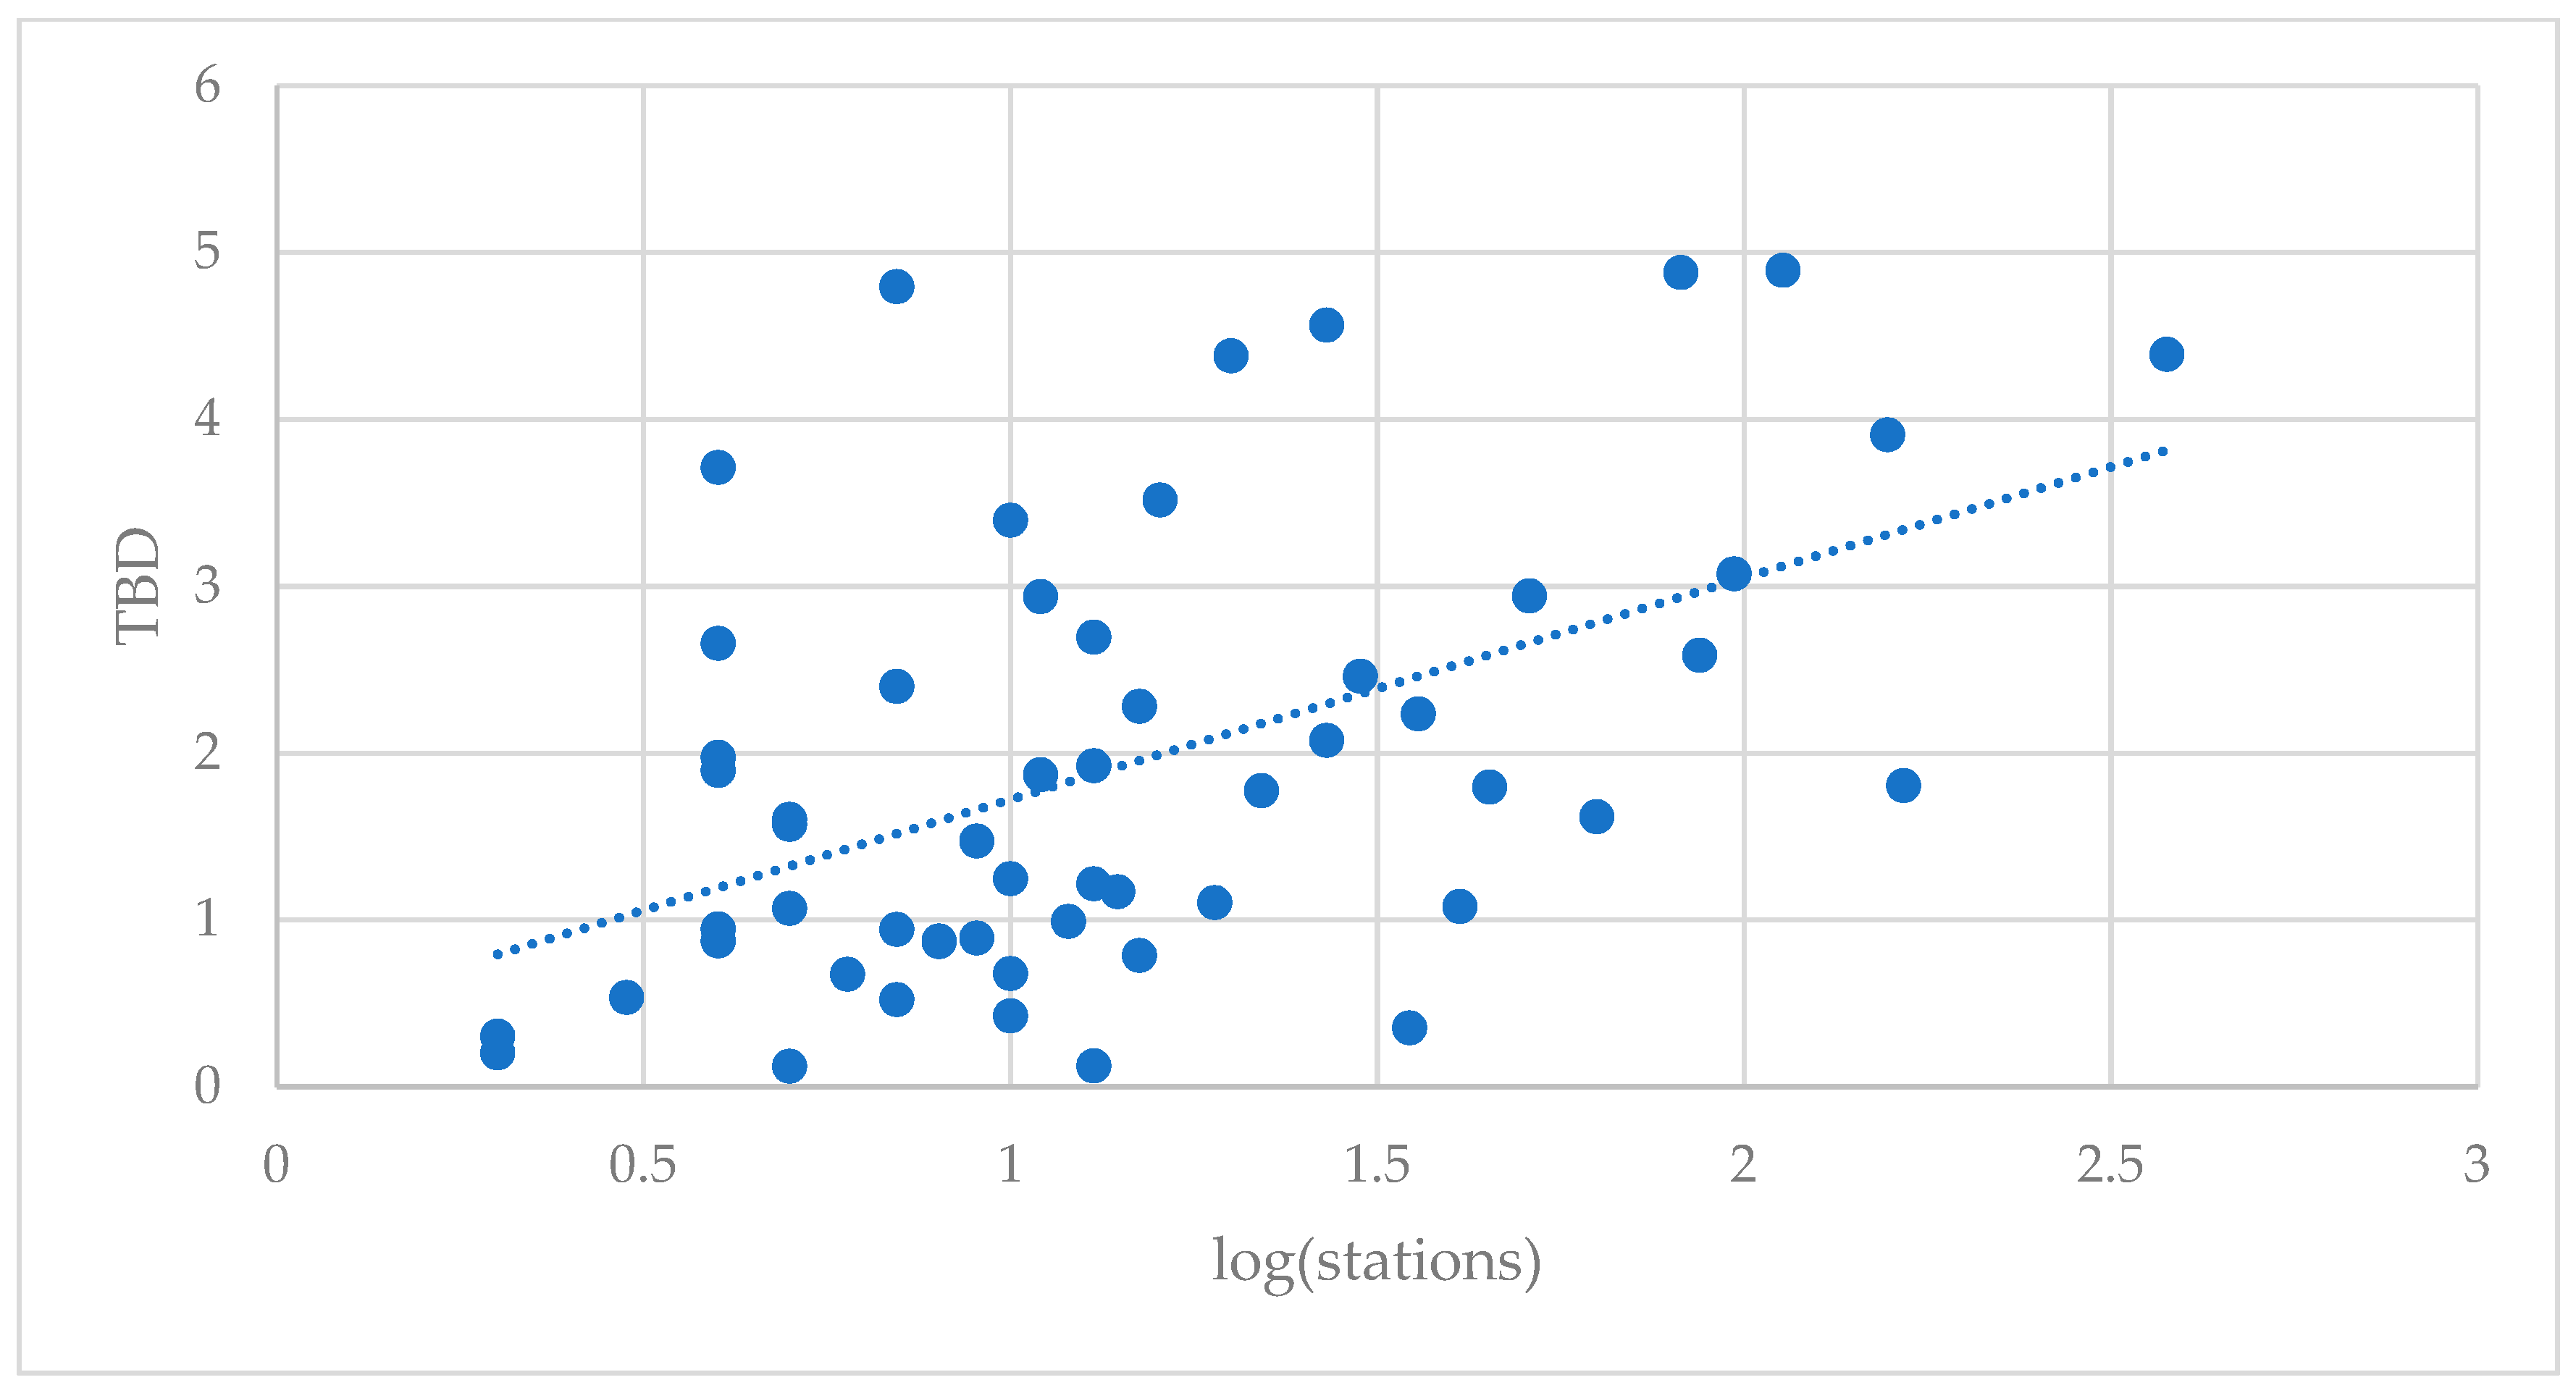
3.2. Regression Analysis of the Factors Influencing BSS Performance

Table 2 presents the estimation results. We were able to explain 55% (Adjusted R squared) of the variation in TDB. The variance inflation factors (VIFs) were analysed to check for multicollinearity. If the (VIF) value is larger than 5, multicollinearity is a problem [36]. As presented in Table 2, multicollinearity was not an issue in our estimation.
Our regression results suggest that tourism is positively related to TDB. No previous research has explicitly examined the effect of tourism on TDB. Intentions to use bike-sharing for holiday cycling were previously investigated with promising results [37]. Some researchers have seen the development of BSSs as an opportunity to develop urban tourism [38], but variables measuring tourism were never included as a factor in studying the efficiency of BSSs. In our survey, we have found that 26.3% of surveyed cyclists have rented a bike or have used a BSS while visiting other cities, and 8.6% of them did that more than once. This percentage is much higher than domestic BSS usage, which is only 4.8% among respondents of our survey.
TDB is also positively related to city population (Table 2). This variable has been previously used by Zhao et al. and de Chardon et al. [6,10]. Our results are consistent with their findings.
Another factor important for BSS success is the number of docking stations (Table 2). Some practitioners argue that the number of stations increases performance (TBD) by creating a so-called “network effect” (expanding the system’s size increases performance). The relationship between the number of stations and TBD is also presented in Figure 1.
This relationship was put into question by de Chardon et al. [6], who claimed that the effect was endogenous: systems that had better performance increase their stations and number of bikes as a result. However, Fishman et al. [7] identified the distance to the nearest docking station as a barrier for BSS membership. According to our survey, some cyclists in Polish cities are discouraged from using BSSs because there are not enough stations (Figure 2). Most of the Polish cyclists that we interviewed were not highly discouraged by the number of available stations; however, for many of them, it was an important factor that stops them from using BSSs: 25.5% ranked this problem as 6 or higher on the scale of 1 to 10. Therefore, we conclude that the number of stations is a factor that influences BSS performance. This finding is important for policy-makers and BSS operators that can influence the development of BSSs in urban areas.
BSS performance was also found to depend on its operator (Table 2). In Poland in 2018, there were six companies operating BSSs. The company Nextbike Polska has a dominant position, operating 45 out of 56 BSSs in the country. The company is a branch of the multinational enterprise Nextbike, operating in 200 cities in 25 counties. We have found that BSSs operated by Nextbike Polska have a higher TDB, which may result from better technology, know-how and support from the mother company.
We found TDB to be positively related to car ownership (cars per person), which was our proxy for car congestion (Table 2). Traffic congestion arises near more populated areas where the car ownership index is higher [39,40]. BSS services are the alternative for car trips, especially in urbanised areas where the travel time loss caused by congestion is significant. This result matches many other studies’ conclusions concerning the BSSs’ role in reducing traffic congestion in cities [5,11]. Well-organised and properly managed bike rental services are the tool to change citizens’ transport behaviour and reduce the consequences of a high car ownership index. In our survey, we asked cyclists to rate on a 10-point Likert scale the importance of using a BSS as a time saver and 54.3% of respondents rated this motivation 6 or higher, while 26.7% rated it 9 and 10. Thus, people use BSSs to generate travel time savings within highly congested urbanised areas.
A positive correlation between TDB and a higher temperature (Table 2) and a negative correlation between TDB and precipitation during the systems’ operation match results presented in the study conducted by El-Assi et al. [24] for a BSS in Toronto. They showed that BSS ridership was positively related to higher temperatures and was intensified when the perceived temperature was between 20 and 30 degrees Celsius. Levels of 0–10 and 10–20 degrees were also positively correlated to ridership, unlike the temperature lower than 0. El‑Assi et al. [24] found precipitation, snow and humidity to be negatively correlated with ridership. Thus, our results confirm that it is reasonable to keep Polish BSSs in operation from spring to autumn when the weather encourages ridership. In our survey, respondents indicated the importance of good weather with the median rate of 6 on a 10-point Likert scale. It is worth noting that weather conditions are related not only to cyclists’ comfort but also to safety [24].
Additionally, our study indicates that the presence of a bicycle infrastructure, such as pathways, is a factor associated with the BSS ridership (Table 2). We used a variable measuring kilometres of paths per 10,000 inhabitants and found it to be positively related to TDB. Respondents of our survey answered two questions concerning the presence of dedicated bicycle pathways, rating them as a motivation, and separately a lack of them as a disincentive for using bicycles. An existing path network was not a significant motivating factor for 50.6% of our respondents, as they marked it with 5 or less points on the 10-point scale. Less than half of cyclists see existing infrastructure as an incentive for riding bicycles. This may suggest that more bicycle pathways could encourage more ridership. Interestingly, for 56.1% of respondent cyclists, a lack of bicycle infrastructure is an important barrier: they rated it at 6 or more with a median of 6 and mode of 8 (18.2% of answers). As Fishman et al. [7] presented in their paper about factors influencing BSS membership, paths are a guarantor of bicycle trip safety. They conducted a survey and asked respondents to rate how safe they would feel in three different bicycle riding environments. In general, people pointed to riding a bike on a road without a bike lane as very unsafe, at the same time choosing riding on a separate path as the safest option [7].
As we showed, cyclists’ road safety perception is related to the weather conditions, as well as to the presence of infrastructure. It is worth mentioning that, in our survey, we asked respondents to rate if feeling unsafe in a road traffic discourages cycling. The median rate for this disincentive was 6, and 52.7% of respondents rated it at 6 or more. Therefore, creating favourable conditions for cycling (building pathways and adequate maintenance) can be perceived as a tool to increase BSS ridership.
As presented in Table 2, years since the system was launched and average pay in the region did not have a statistically significant correlation with TDB.
The literature review suggested that the second most important use of parks in the cities (after walking) is cycling [41]. Accordingly, we have tried to include this measure in our model, but we have found no correlation of percentage of parks and green areas in cities with TDB. This may be explained by the structure of the BSS fee. For most BSSs, the rental fee depends on the time the bike is used, therefore, discouraging leisure cycling in parks.
Finally, we asked participants of our survey for their preference for the dockless BSS. As presented in Figure 3, most of the respondents claimed that the possibility to use a dockless system would motivate them to use shared bicycles (68.30% of respondents answered 6 or more on the 10-point scale). Obviously, the hypothesis that popularisation of dockless BSSs would increase the TDB of the systems can only be verified after their implementation, so we could not include it in our regression.

4. Discussion

4.1. General Discussion

We advance the sustainability literature by examining factors associated with BBS performance in Poland. At times when cities struggle with congestion and pollution, policy-makers and urban planners look into more sustainable transportation strategies. A promising strategy to help relieve these problems is public bike-sharing: a solution that has become particularly popular since the mid-2000s [10]. Correspondingly, research on the BBS topic is growing [12]. However, there are no studies examining the relationship between various factors on BBS effectiveness in Poland, which is the key contribution of this study. Moreover, the unique approach of our analysis is the combination of quantitative data on all BBSs in Poland with a qualitative survey conducted on the subject. The need for understanding the success of BBSs is directly related to being able to design effective policies involving expanding BBSs to other Polish cities and worldwide.
Our findings suggest that tourism is significantly related to the BBS effectiveness: cities with more tourists per capita had higher trips per day per bike. This was confirmed by our survey, where significantly more respondents reported using a BBS while vacationing. This is a unique contribution of this research as, to our knowledge, no previous BBS studies examined the tourism effect.
We also found evidence that bigger Polish cities enjoy a higher TDB, which is consistent with studies for other countries [23,24,32]. We also confirmed the relation of weather conditions to TDB, previously tested by El-Assi [24], Rixey [22] and Gebhart [33]. Higher temperatures and less rain are favourable to BBS effectiveness. We found that Polish cities that provide more bicycle infrastructure (including bike lanes and paths) have a higher TDB, which was also shown by Noland [23], El-Assi [26] and Fishman [7] for other regions. Our findings about station density’s positive relation to ridership are in line with research published by Faghih-Imani [32] and Rixey [22]. The effect of car ownership on TDB was not tested before, but Fishman found that in Beijing, Shanghai and Hangzhou, bike-sharing users have a higher level of car ownership than non-users [8], which is consistent with our results.
Our literature review did not reveal any research that would contradict our findings. Therefore, we can conclude that factors correlated with the effectiveness of Polish BBSs do not differ much from other regions. This is a premise for a conclusion that our finding relating tourism to a higher TDB may also be applicable in other countries.

4.2. Implications

Our research suggests that tourists are actively using BSSs as a tool of transportation. As many BSS stations are located in city centres and points of public interest, it makes this mode of transportation especially convenient for tourists that rarely bring their own bicycles to the cities that they visit. This finding may be important for policy-makers and BSS operators. In Poland, many of the BSSs were not compatible with each other even though the vast majority (80%) were operated by the same company. For example, a person that was already registered in the BSS system in Poznan, with the Nextbike’s application already installed on their mobile phone, could not use the same company’s BSS in Warsaw. That would require a second registration and installation of another application on that person’s mobile device. Making systems compatible would allow for elimination of a potential barrier to use BSS for tourists, for the benefit of both visitors and citizens that would be relieved from additional traffic caused by tourists using cars or taxies. This conclusion is also supported by our survey’s results, in which 50.9% cyclists marked 8 or more on the 10-point Likert scale when asked if using a BSS is complicated (the median rate was 8). In conclusion, as they are popular among visitors, BSSs can become a tool for the transportation policy in cities that are important tourist destinations to fight traffic congestion and air pollution. Our recommendation is to make BSSs across cites compatible with each other to enable easy usage of bicycles by travellers. Additionally, municipal authorities and operators can utilize our research when designing BSS marketing strategies. Such strategies should include well-designed offer information for tourists.
Another consideration for operators and policy-makers is the times BSSs are open. Some BSSs are only open seasonally while others are open year-round. Our results clearly suggest that BSSs that have more months with enjoyable cycling weather will have an advantage as measured by TBD. This suggests that it may not be cost-efficient to keep BSS open for the whole year. However, TBD is only one measure of effectiveness. Being open all year may be beneficial in terms of consistency as only BSSs that operate year-round can become an alternative to a private car. Additionally, there are costs associated with the need to advertise resumed service and repeatedly motivate a modal shift in order to build up usage each spring, as noticed by de Chardon et al. (2017) [6]. Thus, the decision on opening a BSS all year or seasonally may be dependent on local conditions. This trade-off has to be further investigated in future research using different dependent variables.
Overall, the results of our study suggest that if a BSS was to be successful and efficient, it should be implemented in urbanized areas with relatively big populations or prevalent travel destinations. BSS are more popular in urban areas where there are more registered cars per capita. This may suggest that BSSs are becoming an alternative way of transportation in highly congested areas. Also, the performance of a BSS relates to the cycling infrastructure. Thus, a policy of building bicycle pathways may improve ridership of public bicycles. BSSs perform better if there are more stations where the bicycles can be rented. This problem can be overcome by the introduction and popularisation of dockless systems. By 2018, only a few systems in Poland allowed for parking bicycles outside docking stations. Our survey results suggest that dockless systems would motivate more people to use BSSs.

4.3. Limitations and Future Research

We followed most of the previous literature to use TDB as a BSS performance measure (see review by de Chardon et al. [6]). It is a preferred measure as it controls for the variation in the number of bikes and therefore enables comparison of systems that differ in size. Whilst TDB in Poland is the focus of this paper, we do not wish to imply this is the only measure of benefits of bike share. Obviously, TDB has its limitations. For example, it does not take into consideration the time of the trip. Further studies could consider other indicators of performance, i.e., the number of people registered in the system or the cost of bike-sharing as compared to public transportation. This kind of analysis needs to take into consideration different types of BBS financing schemes and costs of infrastructure for each mode of transportation. Also, the performance of a BBS could be measured by reduction in CO2 emissions or air pollution. However, this would require much more complex data and would also need to take into consideration emissions from the production of bicycles, other means of transportation, and the carbon footprint connected with building necessary infrastructure. Another limitation of this study is a lack of comparable data about marketing and BBS prices, the effect of which we leave for future studies.

Author Contributions

Conceptualization, T.B. and A.W.; Formal analysis, A.K. and T.B.; methodology, A.K.; resources, T.B. and A.W.; writing—original draft preparation, T.B. and A.W; writing—review and editing, A.K.; visualization, T.B.; project administration, A.W.; funding acquisition, T.B. and A.W.

Funding

This research was funded by the Faculty of Economics, University of Gdansk, project no. 538-3000-B012-18. The APC was funded by the Faculty of Economics, University of Gdansk.

Conflicts of Interest

The authors declare no conflict of interest.

References

  1. Shaheen, S.A.; Cohen, A.P.; Martin, E.W. Public Bikesharing in North America: Early Operator Understanding and Emerging Trends. Transp. Res. Rec. 2013, 2387, 83–92. [Google Scholar] [CrossRef]
  2. Demaio, P.; Gifford, J. Will Smart Bikes Succeed as Public Transportation in the United States? J. Public Transp. 2004, 7, 1–15. [Google Scholar] [CrossRef]
  3. Du, M.; Cheng, L. Better understanding the characteristics and influential factors of different travel patterns in free-floating bike sharing: Evidence from Nanjing, China. Sustainability 2018, 10, 1244. [Google Scholar] [CrossRef] [Green Version]
  4. Pal, A.; Zhang, Y. Free-floating bike sharing: Solving real-life large-scale static rebalancing problems. Transp. Res. Part C Emerg. Technol. 2017, 80, 92–116. [Google Scholar] [CrossRef]
  5. Bullock, C.; Brereton, F.; Bailey, S. The economic contribution of public bike-share to the sustainability and efficient functioning of cities. Sustain. Cities Soc. 2017, 28, 76–87. [Google Scholar] [CrossRef]
  6. Médard de Chardon, C.; Caruso, G.; Thomas, I. Bicycle sharing system ‘success’ determinants. Transp. Res. Part A Policy Pract. 2017, 100, 202–214. [Google Scholar] [CrossRef]
  7. Fishman, E.; Washington, S.; Haworth, N.; Watson, A. Factors influencing bike share membership: An analysis of Melbourne and Brisbane. Transp. Res. Part A Policy Pract. 2014, 71, 17–30. [Google Scholar] [CrossRef]
  8. Fishman, E.; Washington, S.; Haworth, N. Bike Share: A Synthesis of the Literature. Transp. Rev. 2013, 33, 148–165. [Google Scholar] [CrossRef]
  9. Ricci, M. Bike sharing: A review of evidence on impacts and processes of implementation and operation. Res. Transp. Bus. Manag. 2015, 15, 28–38. [Google Scholar] [CrossRef] [Green Version]
  10. Zhao, J.; Deng, W.; Song, Y. Ridership and effectiveness of bikesharing: The effects of urban features and system characteristics on daily use and turnover rate of public bikes in China. Transp. Policy 2014, 35, 253–264. [Google Scholar] [CrossRef] [Green Version]
  11. Fishman, E.; Washington, S.; Haworth, N. Bike share’s impact on car use: Evidence from the United States, Great Britain, and Australia. Transp. Res. Part D Transp. Environ. 2014, 31, 13–20. [Google Scholar] [CrossRef]
  12. Si, H.; Shi, J.G.; Wu, G.; Chen, J.; Zhao, X. Mapping the bike sharing research published from 2010 to 2018: A scientometric review. J. Clean. Prod. 2019, 213, 415–427. [Google Scholar] [CrossRef] [Green Version]
  13. Eurostat Database, European Commission. Available online: https://ec.europa.eu/eurostat/data/database (accessed on 12 February 2019).
  14. Bartosiewicz, B.; Pielesiak, I. Spatial patterns of travel behaviour in Poland. Travel Behav. Soc. 2019, 15, 113–122. [Google Scholar] [CrossRef]
  15. DeMaio, P. Bike-sharing: History, Impacts, Models of Provision, and Future. J. Public Transp. 2009, 12, 41–56. [Google Scholar] [CrossRef]
  16. Fishman, E. Bikeshare: A Review of Recent Literature. Transp. Rev. 2016, 36, 92–113. [Google Scholar] [CrossRef]
  17. Tran, T.D.; Ovtracht, N. Promoting Sustainable Mobility by Modelling Bike Sharing Usage in Lyon; IOP Conference Series: Earth and Environmental Science; IOP Publishing: Bristol, England, 2018. [Google Scholar]
  18. Li, X.; Zhang, Y.; Sun, L.; Liu, Q. Free-floating bike sharing in jiangsu: Users’ behaviors and influencing factors. Energies 2018, 11, 1664. [Google Scholar] [CrossRef]
  19. Bieliński, T.; Ważna, A. New Generation of Bike-Sharing Systems in China: Lessons for European Cities. J. Manag. Financ. Sci. 2018, 11, 25–42. [Google Scholar]
  20. Jiménez, P.; Nogal, M.; Caulfield, B.; Pilla, F. Perceptually important points of mobility patterns to characterise bike sharing systems: The Dublin case. J. Transp. Geogr. 2016, 54, 228–239. [Google Scholar] [CrossRef]
  21. Kou, Z.; Cai, H. Understanding bike sharing travel patterns: An analysis of trip data from eight cities. Phys. A Stat. Mech. Its Appl. 2019, 515, 785–797. [Google Scholar] [CrossRef]
  22. Rixey, R.A. Station-Level Forecasting of Bike Sharing Ridership: Station Network Effects in Three U.S. Systems. Transp. Res. Rec. J. Transp. Res. Board 2013, 2387, 46–55. [Google Scholar] [CrossRef]
  23. Noland, R.B.; Smart, M.J.; Guo, Z. Bikeshare trip generation in New York City. Transp. Res. Part A Policy Pract. 2016, 94, 164–181. [Google Scholar] [CrossRef]
  24. El-Assi, W.; Salah Mahmoud, M.; Nurul Habib, K. Effects of built environment and weather on bike sharing demand: A station level analysis of commercial bike sharing in Toronto. Transportation 2017, 44, 589–613. [Google Scholar] [CrossRef]
  25. Shen, Y.; Zhang, X.; Zhao, J. Understanding the usage of dockless bike sharing in Singapore. Int. J. Sustain. Transp. 2018, 12, 686–700. [Google Scholar] [CrossRef]
  26. Wang, K.; Akar, G.; Chen, Y.J. Bike sharing differences among Millennials, Gen Xers, and Baby Boomers: Lessons learnt from New York City’s bike share. Transp. Res. Part A Policy Pract. 2018, 12, 686–700. [Google Scholar] [CrossRef]
  27. Guo, Y.; Zhou, J.; Wu, Y.; Li, Z. Identifying the factors affecting bike-sharing usage and degree of satisfaction in Ningbo, China. PLoS ONE 2017, 12, e0185100. [Google Scholar] [CrossRef]
  28. Sun, F.; Chen, P.; Jiao, J. Promoting public bike-sharing: A lesson from the unsuccessful Pronto system. Transp. Res. Part D Transp. Environ. 2018, 63, 533–547. [Google Scholar] [CrossRef]
  29. Turoń, K.; Sierpiński, G. Bike-sharing as a possibility to support Vision Zero. MATEC Web Conf. 2018, 231, 03005. [Google Scholar] [CrossRef] [Green Version]
  30. Czech, P.; Turoń, K.; Urbańczyk, R. Bike-sharing as an element of integrated Urban transport system. In Advances in Intelligent Systems and Computing; Springer: Cham, Switzerland, 2018. [Google Scholar]
  31. Dobrzyńska, E.; Dobrzyński, M. Structure and dynamics of a public bike-sharing system. Case study of the public transport system in Białystok. Eng. Manag. Prod. Serv. 2016, 8, 59–66. [Google Scholar] [CrossRef]
  32. Faghih-Imani, A.; Hampshire, R.; Marla, L.; Eluru, N. An empirical analysis of bike sharing usage and rebalancing: Evidence from Barcelona and Seville. Transp. Res. Part A Policy Pract. 2017, 97, 177–191. [Google Scholar] [CrossRef]
  33. Gebhart, K.; Noland, R.B. The impact of weather conditions on bikeshare trips in Washington, DC. Transportation 2014, 41, 1205–1225. [Google Scholar] [CrossRef]
  34. Richter, F. Bike-Sharing Clicks into Higher Gear. Available online: https://www.statista.com/chart/14542/bike-sharing-programs-worldwide/ (accessed on 12 February 2019).
  35. Sadowska, K. Nextbike Polska Press Release. Available online: https://relacje.nextbike.pl/media/2555/20181115-nextbike-podsumowanie-1-3q2018.docx (accessed on 12 February 2019).
  36. Akinwande, M.O.; Dikko, H.G.; Samson, A. Variance Inflation Factor: As a Condition for the Inclusion of Suppressor Variable(s) in Regression Analysis. Open J. Stat. 2015, 5, 754–767. [Google Scholar] [CrossRef]
  37. Kaplan, S.; Manca, F.; Nielsen, T.A.S.; Prato, C.G. Intentions to use bike-sharing for holiday cycling: An application of the Theory of Planned Behavior. Tour. Manag. 2015, 47, 34–46. [Google Scholar] [CrossRef]
  38. Roman, M.; Roman, M. Bicycle Transport as an Opportunity to Develop Urban Tourism—Warsaw Example. Procedia Soc. Behav. Sci. 2014, 151, 295–301. [Google Scholar] [CrossRef]
  39. Metz, D. Tackling urban traffic congestion: The experience of London, Stockholm and Singapore. Case Stud. Transp. Policy 2018, 6, 494–498. [Google Scholar] [CrossRef]
  40. Yin, C.; Shao, C.; Wang, X.; Yin, C.; Shao, C.; Wang, X. Built Environment and Parking Availability: Impacts on Car Ownership and Use. Sustainability 2018, 10, 2285. [Google Scholar] [CrossRef]
  41. Peters, K.; Elands, B.; Buijs, A. Social interactions in urban parks: Stimulating social cohesion? Urban For. Urban Green. 2010, 9, 93–100. [Google Scholar] [CrossRef]
Figure 1. The TBT and number of stations scatter plot and correlation.
Sustainability 11 02458 g001
Figure 2. The answers to the question of whether the small number of stations in the city is demotivating for BSS usage, 1: it does not discourage me, 10: it discourages me a lot. N = 3631.
Sustainability 11 02458 g002
Figure 3. Answers to the question: Would the possibility of using a public bike that you can leave anywhere (not necessarily at the docking station) motivate you to ride a bike more often? 1: it would not motivate me, 10: it would be a very important motivation. N = 3631.
Sustainability 11 02458 g003
Table 1. Variable definitions and descriptive statistics.
CodeVariable DefinitionMean/ProportionSDMinMax
TDBTrips per day per bicycle1.931.340.124.89
PopulationPopulation of BSS’s primary city or settlement177,666276,21724951,764,615
NextbikeOperator of the BSS (dichotomous variable)0.80-01
YearsNumber of years since the system was launched2.682.70111
#StationsPerPop10KDensity of stations: the number of stations per 10,000 of population2.011.490.348.02
#CarsPerPersonNumber of cars registered per person in the region0.570.070.430.72
PathsKmPer10KPopKilometres of bicycle pathways per 10,000 of population3.762.330.0011.93
Pay to AvgRatio of an average salary in the region to the national average95.4514.1576.10146.00
TempAverage temperature during the time the system was functioning14.292.746.4020.10
RainNumber of rainy days during the time the system was functioning52.1828.3010.00146.00
TouristsPer1000PopNumber of tourists that used hotel services in a given city or settlement per 1000 population.865.081230.72130.228517.22
Table 2. Regression analysis of factors influencing trips per day per bike (TDB) in the given bicycle-sharing system (BSS).
CodeEstimateSEp-ValueSignificance CodeVIF
(Intercept)−15.002.520***
Log(Population)1.080.180***3.37
Nextbike0.840.330.02**1.26
Log(Years)−0.410.250.11 2.71
#StationsPerPop10K0.300.120.02**2.19
#CarsPerPerson3.391.980.09*1.45
PathsKmPer10KPop0.100.060.08*1.26
Pay to Avg00.010.92 2.23
Temp0.110.050.04**1.20
Rain−0.010.010.09*1.76
TuristsPer1000Pop000.09*1.24
Adjusted R squared0.55
Note: Dependent variable: TDB; * significant at the 0.10 level, ** significant at the 0.05 level; *** significant at the 0.01 level. VIF, variance inflation factor.

