1. Introduction
The rapid growth of medical insurance expenditure is a worldwide challenge. According to data from the OECD, expenditure of health insurance in England increased to 154.68 billion pounds in 2017, from 81.24 billion pounds in 2005. Similarly, in China, since the establishment of the social medical insurance system for urban workers in 1998, the coverage area and the guarantee level of social medical insurance are increasingly improved, and its expenditure has skyrocketed. For the new rural cooperative medical system (hereinafter referred to as NCMS), the expenditure of the NCMS was increased to 293.341 billion Chinese yuan (hereinafter referred to as RMB) in 2015 from 2.637 billion RMB in 2004 according to the data from “Statistical Yearbook of Health and Family Planning of China of 2016”.
There are many factors that influence the expenditure of medical insurance funds, such as population structure, medical technology and medical service demands. Population aging leads to the risk of “structure aging” [
1,
2], which results in increases these funds’ expenditure [
3,
4,
5,
6,
7,
8]. In addition, population aging impacts the expenditure of such funds because demands for medical services increase [
9,
10,
11]. And income-related inequalities also impact medical spending through medical service [
12]. However, over long periods of time, the primary determinant of medical cost growth is medical technology [
13,
14,
15].
However, the fact that social medical insurance is managed by local governments is ignored in most research. In China, the central government formulates the fundamental policy for social medical insurance macroscopically. In combination with local conditions, local governments materialize the policy of the central government as operable implementation schemes that control the financing and payment affairs of social medical insurance. In addition, on the condition that the income cannot cover the expenditure of medical insurance funds, local finance is also responsible for compensating for the deficit of the funds. It is necessary to consider the influence of local government behavior on this expenditure when investigating the problems of such expenditure. According to related research, local government behavior indeed influences the sustainability of social insurance funds. There is a problem of comparison on medical insurance financing among local governments [
16]. For the sake of improving political performance, when adjacent regions improve the financing of medical insurance, local governments will also improve the financing of local residents. Based on investigations of endowment insurance fund collection systems, Peng et al. found that local governments “race to the bottom” with respect to endowment insurance fund collection in order to attract more foreign capital flow, which competitively reduces the level of such collection [
17]. And in terms of international competition, globalization will force governments to cut medical cost, which helps to lower medical spending growth [
18]. In terms of local competition, local government behavior with respect to the improvement or reduction of financing are significant with respect to the sustainability of social insurance funds.
Local competition is an important entry point for understanding local government behavior. GDP competition is key to local government competition. GDP and its ranking are the most important indicators in the assessment of local officials since China’s reform and opening-up [
19,
20,
21,
22]. Although China is a unitary state, the fiscal decentralization between the central government and local governments assimilates local government outcomes to those of the federal structure [
23], which motivates local governments to develop the local economy [
24,
25]. Under the fiscal decentralization system, local governments tend to increase the fiscal expenditure on infrastructure which contributes to attracting capital inflow, leading to insufficient financial investment in public goods [
26,
27,
28]. The “promotion tournament” among local governments further intensifies their expenditure tendencies [
19,
20,
21,
22]. There are also problems with respect to the excessive and quick construction of infrastructure as well as redundant construction [
28,
29]. What will influence the expenditure of medical insurance funds, the sustainability of funds, and the competition behavior that local governments pursue for a higher GDP ranking?
Existing studies of the influences on medical health by fiscal decentralization mainly investigate the influence of fiscal decentralization on medical fund raising [
16], infant mortality rates [
30,
31,
32], government health expenditure [
33,
34], and local health expenditure efficiency [
35]. Few studies have explored the influence of fiscal decentralization on the expenditure of the NCMS, which is what this paper attempt to investigate.
The results of this study show, firstly, that a higher fiscal decentralization degree indicates less per capita expenditure of the NCMS. Specifically, the per capita expenditure of the NCMS is reduced by 1.5–1.6 units for a 1% increase of fiscal decentralization. Secondly, when taking the influence of adjacent provinces into consideration, 1.2–2.9 units will be reduced in per capita expenditure in the NCMS for a 1 unit increase of fiscal decentralization. Thirdly, the financial aid provided to the NCMS by local governments increases with improvement in local financial strength.
The rest of this paper is organized as follows.
Section 2 describes the healthcare system in China.
Section 3 proposes the research hypotheses.
Section 4 describes the research methodology and exhibits the data. In
Section 5, we present the results and discussion, and the conclusions follow (
Section 6).
2. Institutional Context
According to hukou (a census register management policy in China), whether one has a job or not, there are three health insurance policies in China: one for urban employees, established in 1998; a new rural cooperative medical system (NCMS) established in 2003; and a plan for urban unemployed, which began in 2007. The latter two are subsidized by the government, while the former is financed by employers and their employees. In addition to the government’s subsidies, personal payment is also an important source of the NCMS fund and the urban resident’s basic medical insurance fund. Unlike the urban employee basic medical insurance and the urban resident’s basic medical insurance, which are managed by human resources and social security departments, the NCMS is managed by health departments. Health departments also manage medical facilities. In other words, health sectors manage the NCMS and medical facilities at the same time. Generally speaking, the NCMS has the following characteristics.
Firstly, the NCMS is a type of social insurance. Although the NCMS follows the principle of voluntary participation, the NCMS also emphasizes that one family is regarded as one insured unit, which means family members decide together to attend the NCMS or not, which helps to avoid the problem of adverse selection. This is similar to group insurance in the USA, which regards one enterprise as one insured unit.
Secondly, the NCMS implements a financing method combining personal payment, collective support, and government funding. However, the NCMS fund is dominated by government subsidies. This is similar to the financing of social security in Nordic countries. In some Nordic countries such as Norway, half of the social security fund comes from government subsidies, and the second source is employers’ payments. However, in China, employers do not bear the responsibility of financing the NCMS. Insurers’ personal payment is the second source of the NCMS fund.
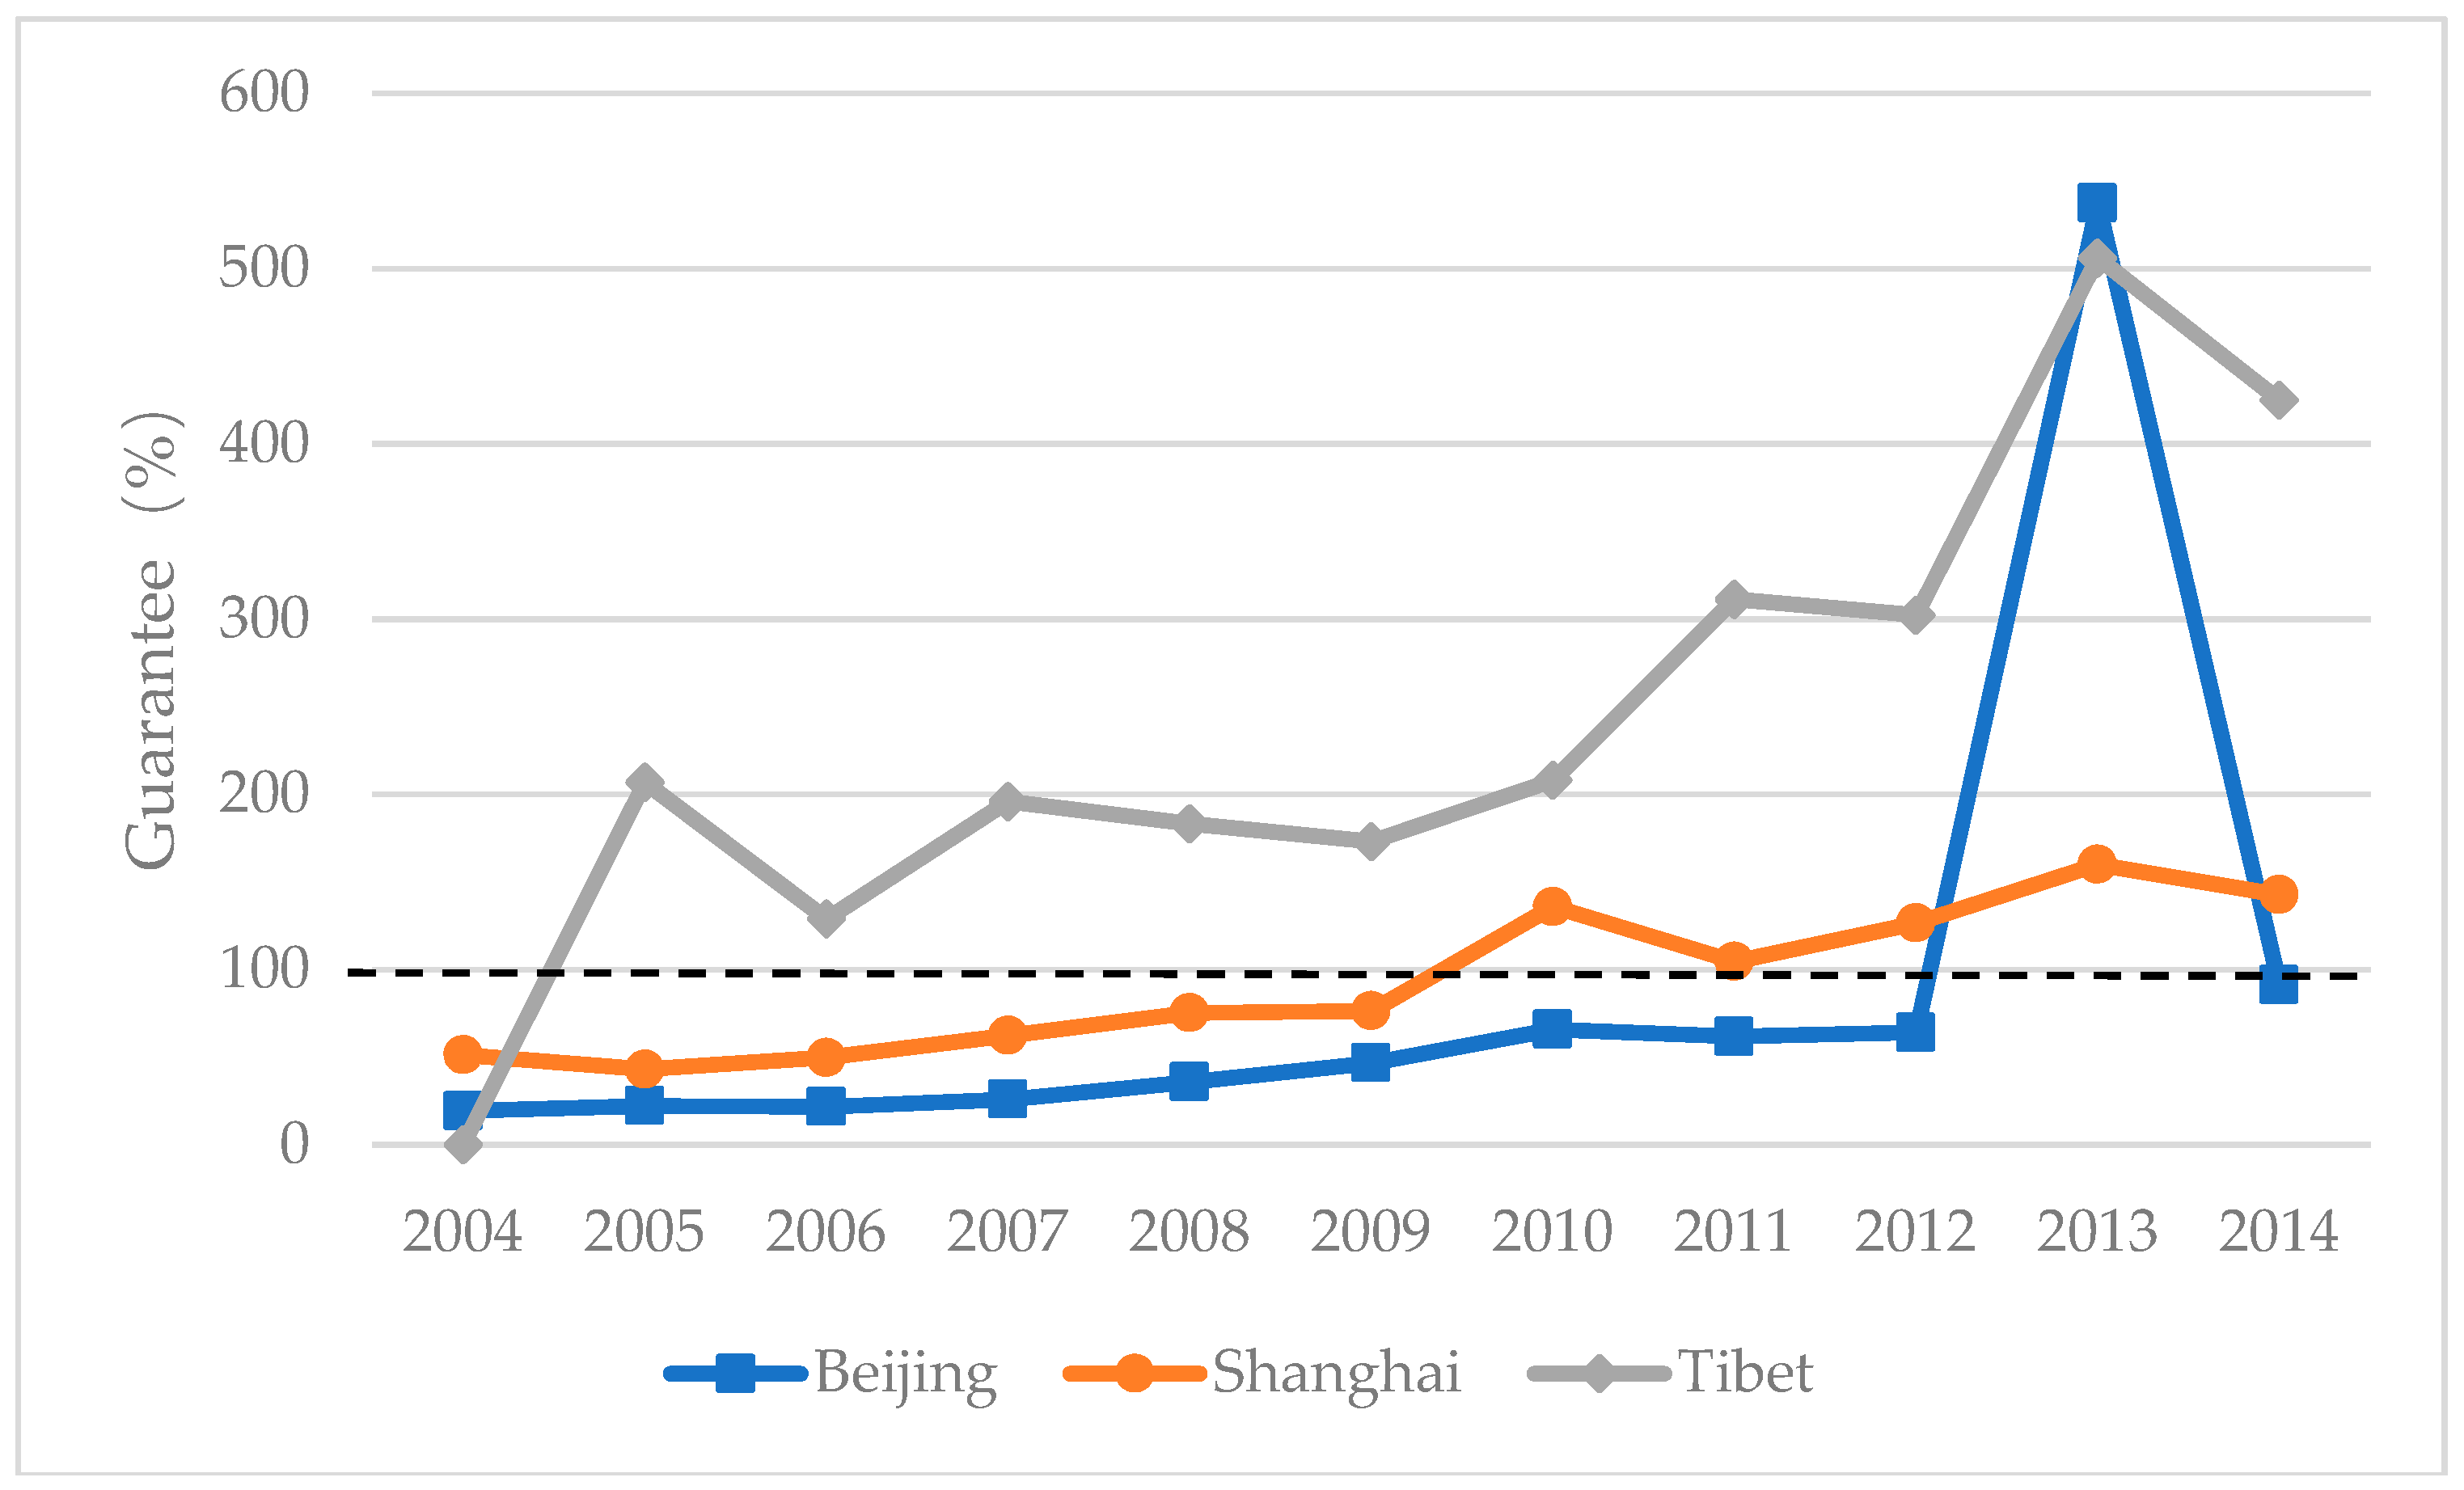
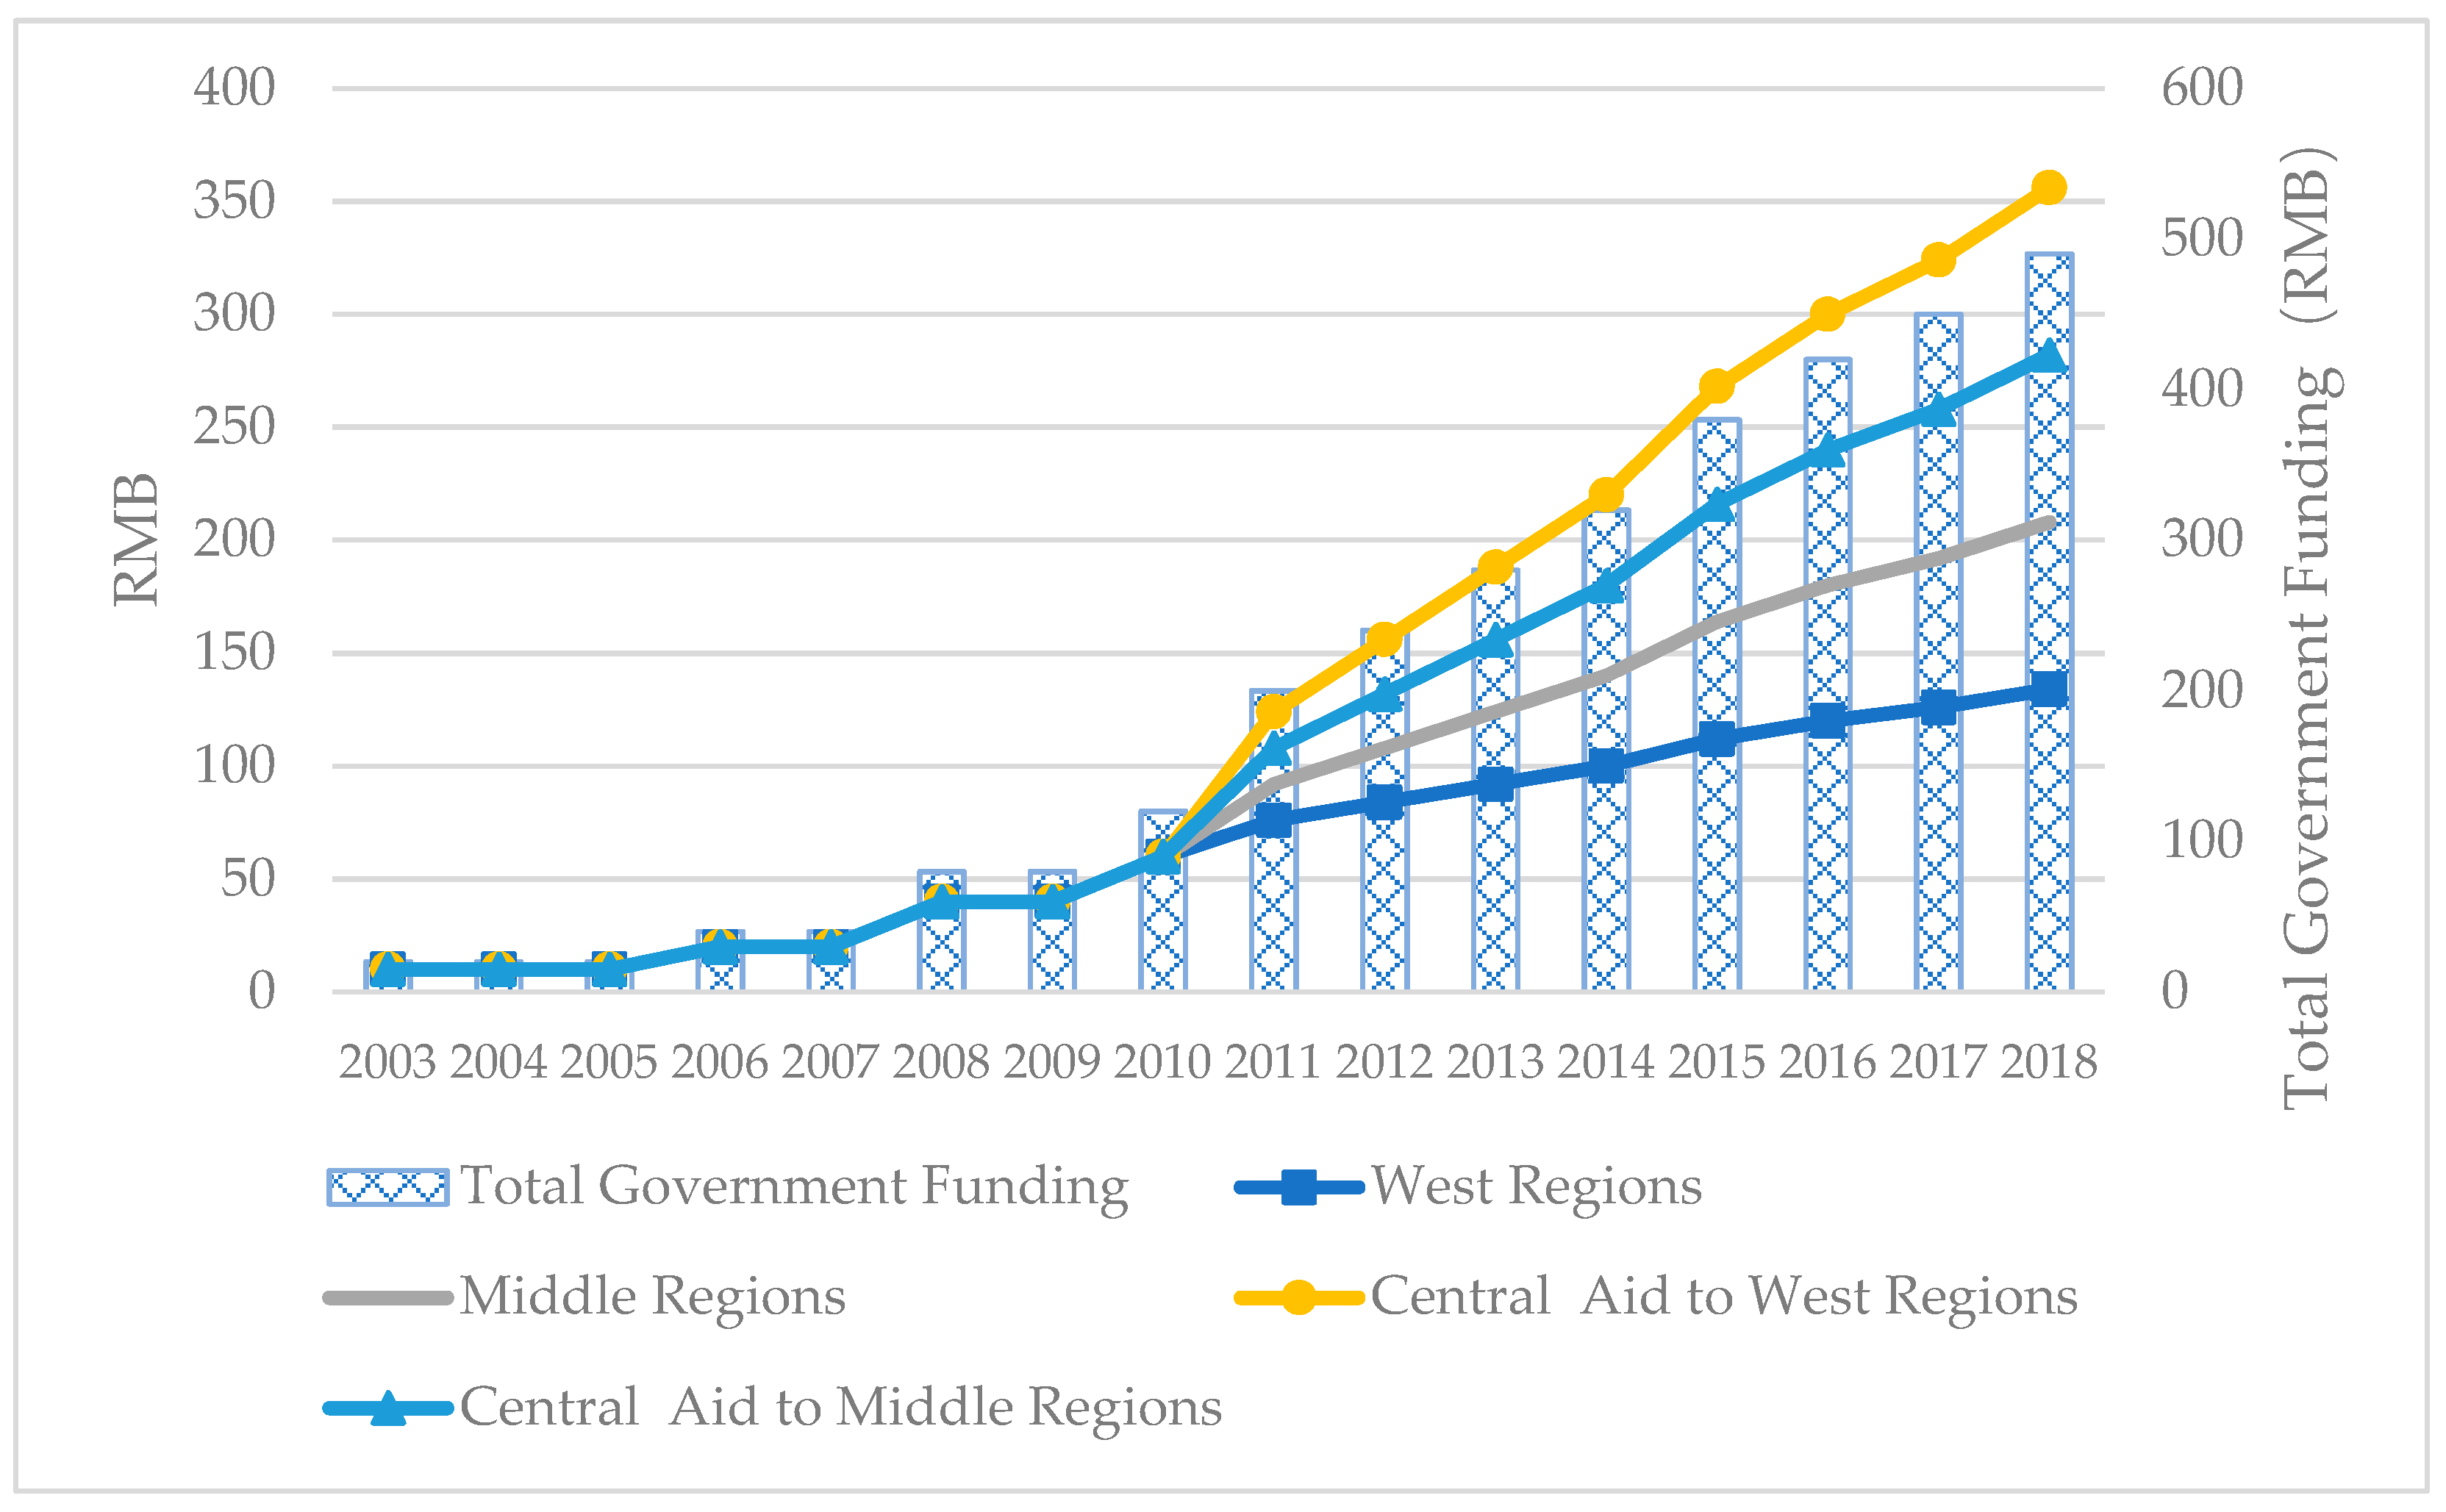
Thirdly, government subsidies are undertaken by the central government and local governments jointly. Regarding NCMS financial aid, local governments of different regions undertake different financial aid responsibilities. On the whole, local governments of east regions, followed by middle regions and west regions, undertake the highest financial aid responsibilities. However, local governments of the middle and west regions in different years have varied in terms of financial aid responsibilities. During 2003–2010, local governments of the middle and west regions provided financial aid to the NCMS according to the same subsidy standard. Since 2011, the central government has adjusted the proportion of financial aid to the NCMS undertaken by the central government and by local governments, and the financial aid to the west regions has been increased by the central government. In other words, local governments of the middle regions have undertaken larger financial aid responsibilities since 2011 when compared with the west regions, as shown in
Figure A1.
At the same time, the local governments’ subsidies have also been undertaken by the provincial government as well as the municipal and county governments, and among these the provincial government has borne the greatest responsibility. For instance, a 556 RMB per capita subsidy was provided to the basic medical insurance of urban and rural residents in 2018, the central government provided 356 RMB per capita, the Qinghai provincial government provided 157 RMB per capita, and the municipal and county governments subsidized 53 RMB per capita [
36]. However, different levels of local governments take on different financial aid responsibilities in different provinces. For example, except for the central and provincial subsidies, subsidies are equally undertaken by the municipal and the county governments in Shaanxi province; however, the municipal governments do not bear the responsibility of financing the NCMS in Baicheng, Jilin province, and the local governments’ subsidies are mainly undertaken by the provincial and county governments.
Fourthly, when the income of the NCMS fund cannot cover the expenditure, local governments take responsibility for the deficient fund. According to the Notification of the Ministry of Finance and Ministry of Health about Printing and Issuing the New Rural Cooperative Medical System Fund Financial Regulations (No. 8 in 2008), when the income of the NCMS fund cannot cover the expenditure of the NCMS, the deficit is to covered first by sequences of deposits of accumulated surpluses of consolidated funds over the years, then by risk funds, and then by other fund channels approved by local governments of the pooling region. With respect to the ultimate responsibility of the NCMS fund, the Social Insurance Law of the People’s Republic of China stipulates the following: “Social insurance fund realizes the balance of payment through a budget. Governments of counties or [of a] higher level shall provide aid in the condition of deficient payments of social insurance funds.” The nature of the aid is stipulated as the ultimate responsibility undertaken by governments in the Interpretation of Social Insurance Law of the People’s Republic of China. The NCMS fund takes a prefecture-level or even county-level overall plan as its main subject. Therefore, local governments under the provincial level undertake the ultimate responsibility of the NCMS if the fund cannot cover the expenditure.
Although the NCMS has been gradually integrated and has become the basic medical insurance for urban and rural residents, local governments still work as managers for the basic medical insurance of them. The analysis results based on the NCMS in this article are also applicable to the basic medical insurance of these residents.
3. Research Hypothesis
Based on the literature and precious studies, we propose the following research hypotheses:
Hypothesis 1: A higher fiscal decentralization degree indicates a stronger power in local governments to control the expenditure of the NCMS and therefore less expenditure.
Hypothesis 2: Higher fiscal strength leads to higher levels of aid to insured citizens by local governments.
Hypothesis 3: The supervision effort degree and the fiscal aid levels of local governments on the NCMS have a spatial spillover effect.
Local governments are facing the dual goals of economic development and increasing investment in people’s livelihood, the latter of which is exemplified by the NCMS. Considering that infrastructure investment has a higher marginal rate of return, fiscal decentralization and the “promotion tournament” emphasize productive fiscal expenditure, such as infrastructure by governments, leading to insufficient fiscal investments in public services such as medical services, environmental improvement and public health [
26,
27,
28,
37,
38,
39,
40]. Moreover, an improved fiscal decentralization degree will further intensify the trend in governments’ fiscal expenditure. In order to win or dominate in local competitions, local governments try to increase fiscal expenditure in infrastructure as well as investments in livelihood. Given that local expenditure is only used for infrastructure investment and aid for recipients of the NCMS [
26], local governments try to reduce the risk of income not covering the expenditure of the NCMS. Thus, local governments have an incentive to control the expenditure of the NCMS. A higher fiscal decentralization degree leads to more fierce fiscal competitions among local governments, which results in a stronger motivation from local governments to control the fund’s expenditure. When local governments control the expenditure of the NCMS, unreasonable fund expenditure will be reduced, which helps to maintain the sustainability of the NCMS.
Theoretically, local governments will provide aid as per the lowest standards undertaken by local governments. However, fiscal aid standards of the NCMS vary among the governments of different regions, and there are substantial differences. A possible explanation for this is that different local governments have varied economic development stages, leading to different degrees of emphasis on basic infrastructure and livelihood investments. Richer regions may pay more attention to livelihood investment, and the richer a region, the more competently fiscal aid may be insured to citizens.
Furthermore, local governments influence each other. The relative GDP ranking among local governments in the “promotion tournament”, as opposed to the absolute ranking, determines the final competition result [
19,
22,
41]. Local economic rankings are related to their economic development levels and are influenced by other local economic development levels. The behavior of one local government influences another in terms of social insurance. Studies have verified this; local governments compete with higher levels in terms of medical insurance financing for residents [
16] and “race to the bottom” in terms of endowment insurance fund collection [
18]. Therefore, it is reasonable to believe that, in the NCMS, the degree of supervision effort degree and the fiscal aid of local governments are influenced by that of other local governments.
4. Method
4.1. Data
Data reported in this article, including the expenditure of the NCMS fund, financial aid data, the number of benefit, and the number of the insured population, mainly originate from the New Rural Co-operative Medical System Information Statistics Manual; in addition, part of the data was adjusted and corrected appropriately according to the Statistical Yearbook of Health and Family Planning of China. Data related to local GDP and urbanization rate originate from the Statistical Year of China; data related to financial income and expenditure originate from the Financial Yearbook of China; data related to the census-registered rural population originate from the Statistical Yearbook of Population and Employment of China; data related to the average medical expense of outpatient patients and per capita medical expense of hospitalized patients originate from the Statistical Yearbook of Health and Family Planning of China. In order to remove the influence of price and inflation, we take 2004 as the benchmark year, taking the price of this year as the base price, to deflate the income and expenditure data. At the same time, to remove the influence of outliers, we conducted a logarithmic transformation to data after deflation. Logarithmic transformation also makes different variables comparable. Additionally, there is no difference between logarithmic transformation and Box–Cox transformation.
The data related to the expenditure of the NCMS fund and the financial aid during 2004–2015 were found in the New Rural Co-operative Medical System Information Statistics Manual. The data of a large number of provinces in 2015 are missing; therefore, 2015 data are not included in the article, and the data of 31 provinces and municipalities directly under the control of the central government (not including Hong Kong, Macao, and Taiwan) of 11 years during 2004–2014 were used in the empirical analysis process. Provinces include Beijing, Tianjin, Hebei, Shanxi, Inner Mongolia, Liaoning, Jilin, Heilongjiang, Shanghai, Jiangsu, Zhejiang, Anhui, Fujian, Jiangxi, Shandong, Henan, Hubei, Hunan, Guangdong, Guangxi, Hainan, Chongqing, Sichuan, Guizhou, Yunnan, Tibet, Shaanxi, Gansu, Qinghai, Ningxia, and Xinjiang. This article first conducts an empirical analysis with the data of 31 provinces. Secondly, considering that large amounts of data of Tianjin are lost and that the data related to the NCMS of Tianjin during 2010–2014 are lost, we dropped the data of Tianjin and adopted the data of 30 provinces for robustness testing. The interested reader can refer to
Table 1 for descriptive statistics of the related variables. (
Table A1 provides panel data description.)
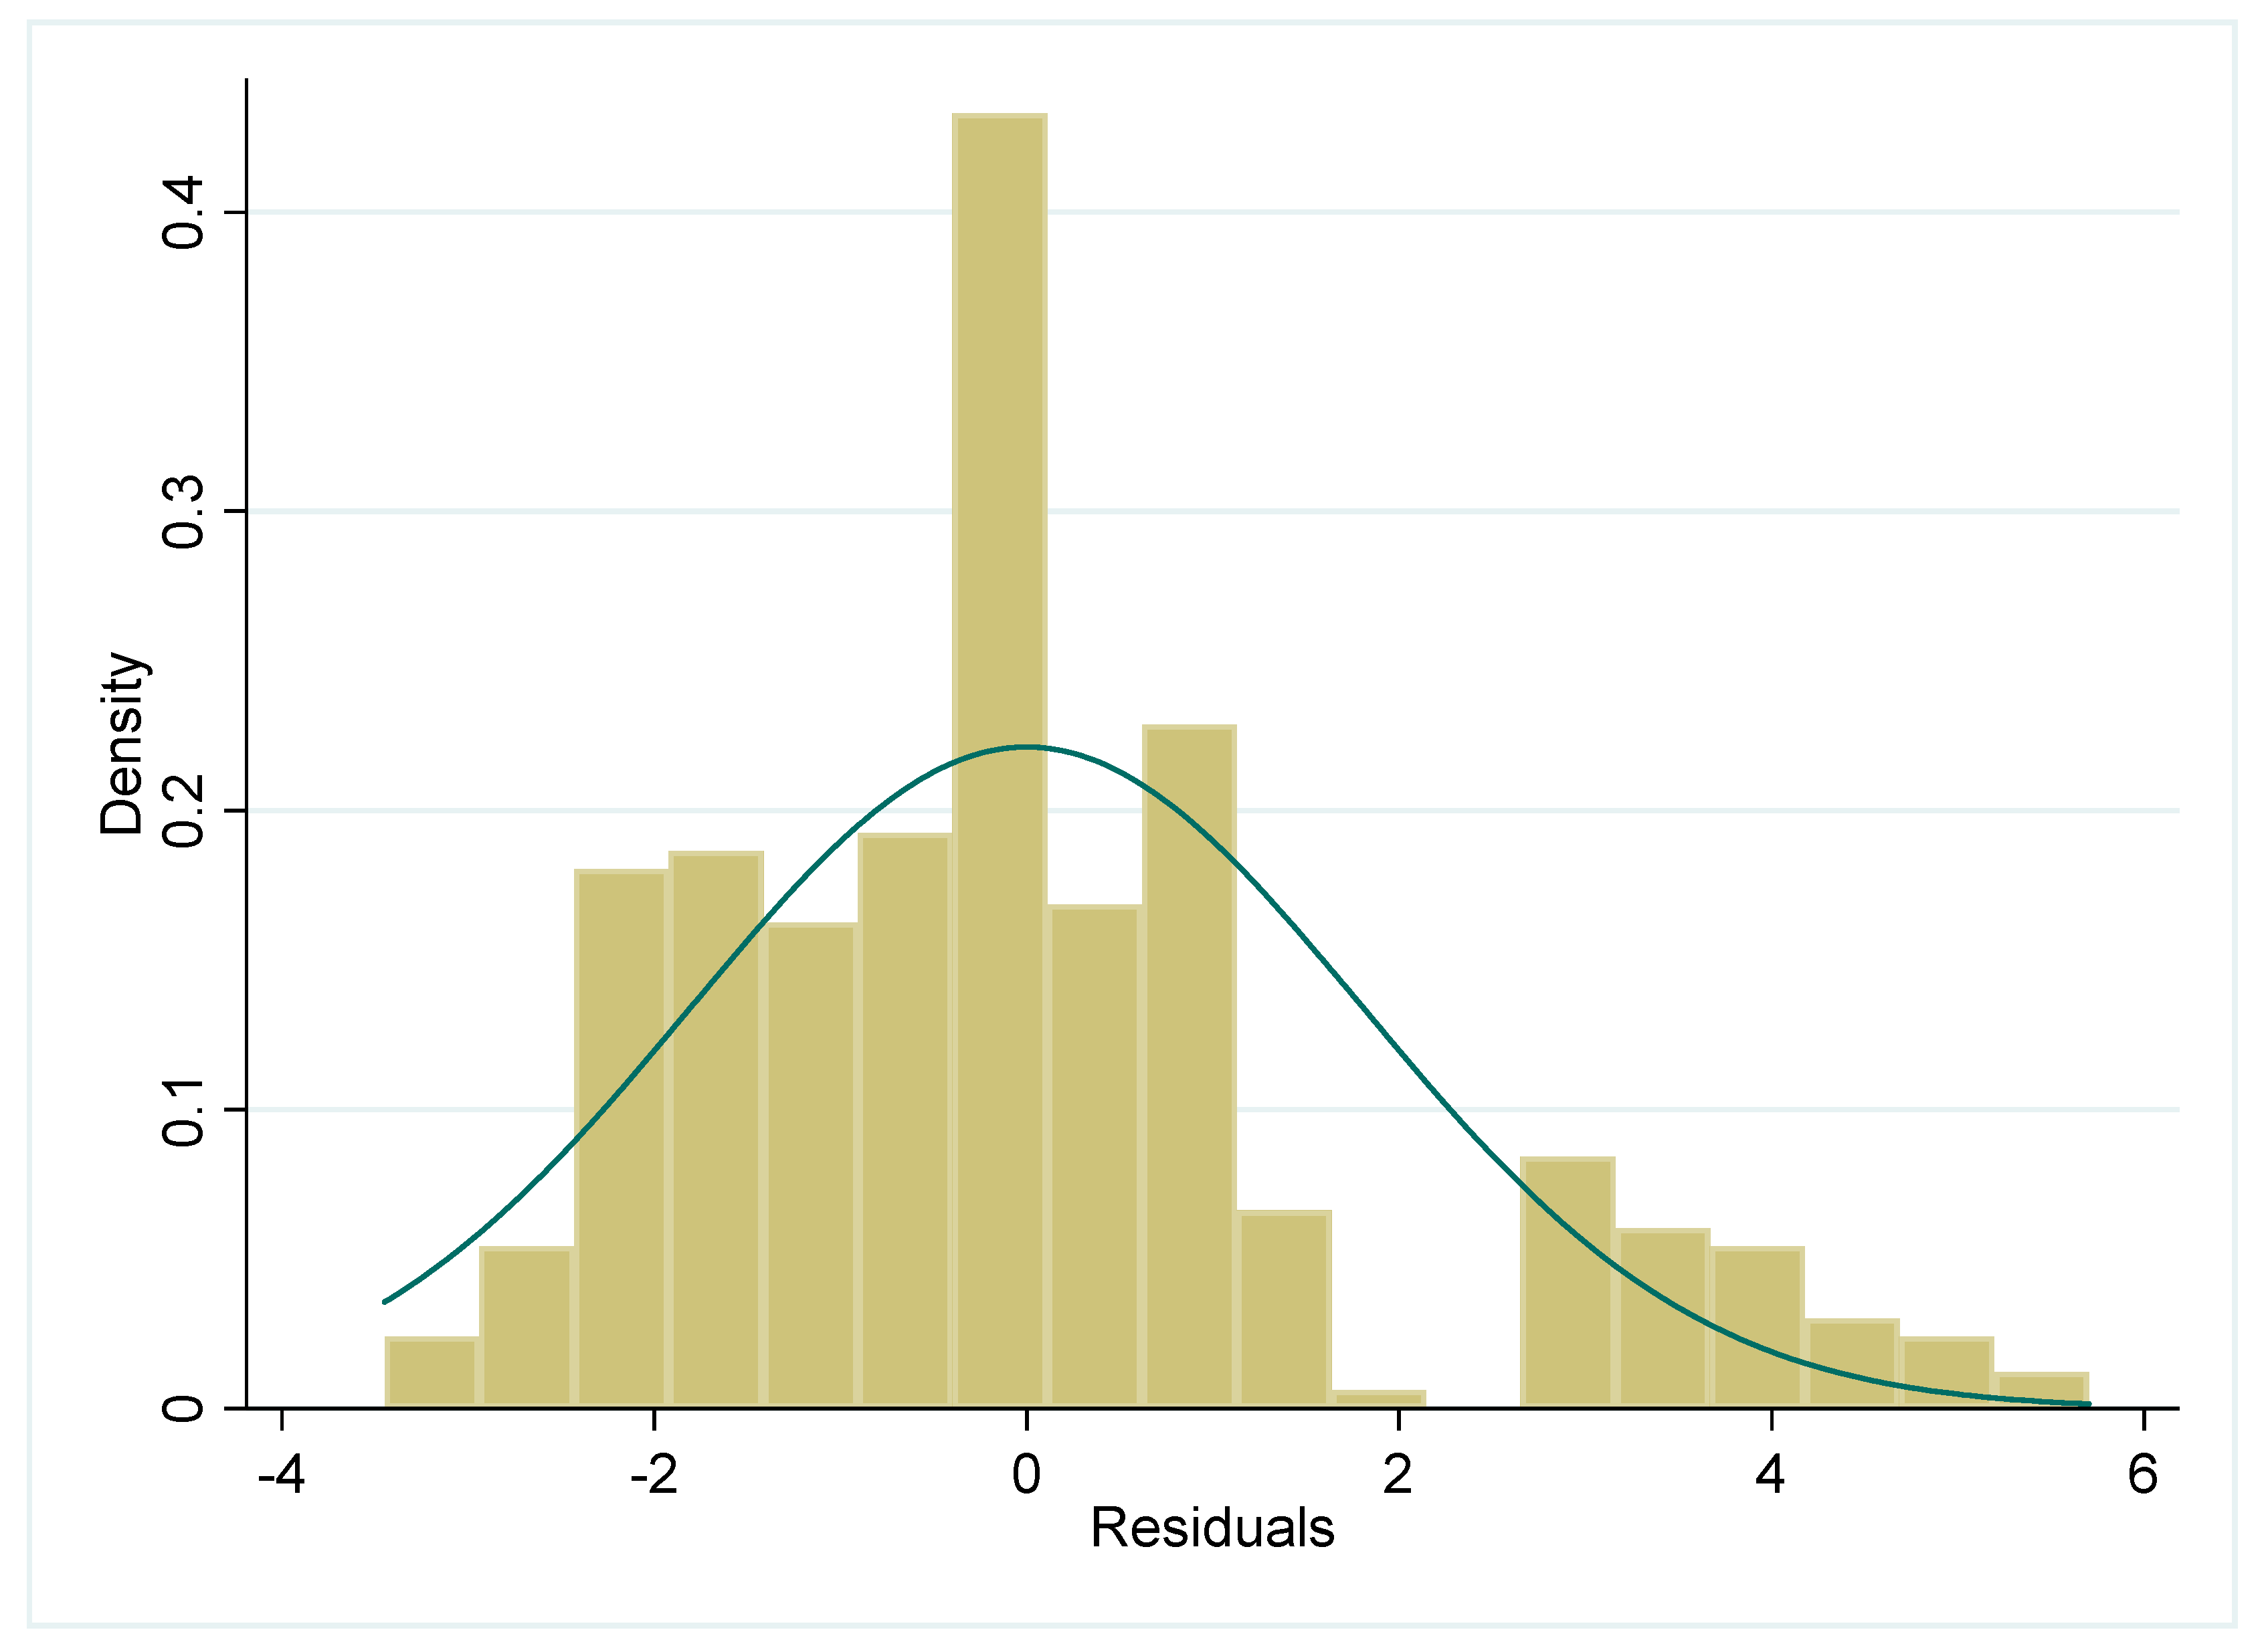
Table 1 reports the descriptive statistic results of the main variables. The minimum values of variables such as the per capita fund expenditure (logarithm), the number of benefit (logarithm), and the guarantee degree are 0, and these values occur in the Tibet Autonomous Region of 2004. The New Rural Co-operative Medical System Information Statistics Manual has data related to the income of the NCMS fund and the number of insured residents in 2004 in the Tibet Autonomous Region; however, the expenditure of the NCMS in this year was zero. Additionally, there are outliers, as shown in
Figure 1. This is a result of a combination of factors, such as a higher local fiscal strength (as is the case in Beijing and Shanghai), policy support (Tibet), lax management, repeated reimbursement, and repeated participation. According to the audit investigation of the NCMS organized by the Auditing Administration, there are problems of embezzlement with respect to the NCMS fund and a lack of strict management, such as “false in bed” and “false medical histories”. And there are prominent problems in false reports of the number of participants. In 2011, six counties including Shucheng had false reports related to 4925 residents. “Up until the end of 2011, 5.4764 million residents were involved in repeated insurance participation among three medical insurance items for residents”.
4.2. Econometric Model
We employed a panel data model to examine the influence of fiscal decentralization on the expenditure of the NCMS (Hypothesis 1) and the influence of local fiscal strength on financial aid provided by local governments to insured citizens (Hypothesis 2). A Hausman test indicated that there is no obvious difference between a fixed effect model and a random effect model, so we mainly used the fixed effect model. We further employed a spatial autoregression model (SAR) to examine the spatial interaction between the expenditure of the NCMS and the local financial aid of different local governments (Hypothesis 3). To control the influence of non-spherical disturbance in terms of error terms, the robust standard error was adopted to correct the estimation result of the panel data fixed effect.
In order to verify Hypothesis 1, i.e., the influence of fiscal decentralization on the expenditure of the NCMS, the following measurement model is introduced:
where subscripts i and t indicate different provinces and years, and the explained variable fund expenditure (log(fundexp)) is the per capita expenditure of the NCMS fund. Generally speaking, the fund surplus can be utilized to reflect the fund expenditure level. There are two reasons for using per capita expenditure to measure this level. Firstly, fund surplus is related to both fund expenditure and fund income. Therefore, compared with fund surplus, per capita expenditure is a more concise indicator. Secondly, there have been multiple changes in fund surplus statistical caliber, with relatively low data quality and higher fund expenditure data quality.
The core explaining variable fiscal decentralization (fd) reflects the fiscal decentralization degree between the central government and local governments. There are more than 20 indicators in the existing literature that measure the fiscal decentralization between the central government and local governments. However, there are disputes regarding these indicators. For example, it is considered by some to be a kind of “misuse” to measure fiscal decentralization in the whole country by the proportion of local fiscal expenditure [
42] and to measure the inconformity between economic growth and public good supply by fiscal income indicators and fiscal expenditure indicators [
43]. In accordance with Chen [
44] and Zhang [
42], we used the proportion of local fiscal net income to local total fiscal expenditure in order to measure fiscal decentralization, in which local total fiscal expenditure is the sum of local net fiscal income and the net transfer income from the central government to a given local government. According to Hypothesis 1, a higher fiscal decentralization degree indicates less per capita expenditure of the NCMS. This is indicated by the negative symbol of α.
Control variables include (1) the average medical expense of outpatient patients (log(fee-out)) and (2) the per capita medical expense of hospitalized patients (log(fee-in)) [
45], reflecting the local medical expense level; (3) the proportion of senior citizens above 65 years old to the total population (old) and (4) the proportion of children under 14 years old to the total population (children) [
46], reflecting the age structure of insured citizens; (5) the number of benefit (log(benefit)), reflecting the number of residents enjoying the treatment; (6) the participating rate (participation), reflecting the participating condition by considering the proportion of the participating number to the total census-registered rural population; (7) the guarantee degree (guarantee) [
9,
47], determined by the ratio between the per capita fund expenditure and the per capita medical and healthcare expenditure of rural residents, reflecting the guarantee level of the NCMS fund; and (8) the per capita GDP (log(gdp)), reflecting the level of economic development [
48].
In order to investigate the spatial spillover effect of the expenditure of the NCMS (Hypothesis 3), based on Model 1, the spatial weight matrix is introduced, expanding Model 1 as follows:
According to Tobler, “[e]verything is related to everything else, but near things are more related to each other.” The spatial weight matrix is introduced to measure the “near,” describing the spatial relationships between different places. There are multiple methods of constructing the spatial weight matrix. This article constructs the spatial weight matrix W according to the adjacency of spatial geographic positions and constructs the spatial weight matrix M based on the reciprocal of the distance between provincial capitals. When constructing the spatial weight matrix based on the adjacency of spatial geographic positions, adjacency is represented by 1, and no adjacency is represented by 0.
In order to verify Hypothesis 2, i.e., the influence of local fiscal strength on financial aid provided by local governments to insured citizens, the following model is introduced:
The explained variable bailout (log(bailout)) is the per capita financial aid to insured citizens by the local government of province i in year t. The core explanatory variable is the ratio of the fiscal revenue (rev-rate), which is measured with the proportion of fiscal income of local governments to the total local fiscal income, reflecting the relative financial strength among local governments.
Additionally, control variables include (1) the local economic development level (log(gdp)), expressed with per capita GDP, reflecting the absolute financial strength of local governments; (2) fiscal decentralization (fd), reflecting the influence of fiscal decentralization between the central government and local governments on local financial aid; (3) the urbanization rate (urban), expressed with the ratio of the permanent resident population in cities to the total local population, reflecting the scale of the urban population; (4) aid standard (stipulated by policies of the central government) (log(standard)), measuring the influence of the aid standard adjustment on aid provided by local governments; (5) the preference of local governments (care), measured by the ratio between medical health and family planning in the local fiscal expenditure, reflecting the degree of attention paid by local governments to the NCMS; (6) the participating rate (participation), measuring the influence of insured citizen conditions on the aid provided by local governments.
Considering that the fiscal aid behavior of adjacent provinces may affect the financial aid of related regions, the spatial weight matrix is introduced here, expanding Model (3) to Model (4). The specific setting of the spatial weight matrix is similar to that in Model (2). Considering the possible heteroscedasticity, the robust standard error is taken in the empirical analysis process in this article.
Table A2 reports the correlation matrix among independent variables. From the perspective of the correlation matrix, the value of some independent variables is relatively high, but we think it does not matter because panel data can lower the hazard of multicollinearity.
5. Results
5.1. Estimation Result of the Fixed Effect Model
Table 2 reports the fixed effect estimation results of the panel data of Model (1) and Model (3). During the regression process, the random effect of the panel data is also taken into consideration of the article. The null hypothesis that there is no significant difference between the fixed effect estimation result and the random effect result is refuted based on the Hausman test result (see
Table A3), indicating that, compared with the random effect estimation result, the fixed effect leads to a better estimation result. Therefore, this article places more emphasis on the fixed effect estimation result in this part; additionally, we report the random effect estimation result so as to make comparisons with the spatial panel model.
Columns (1)–(4) in
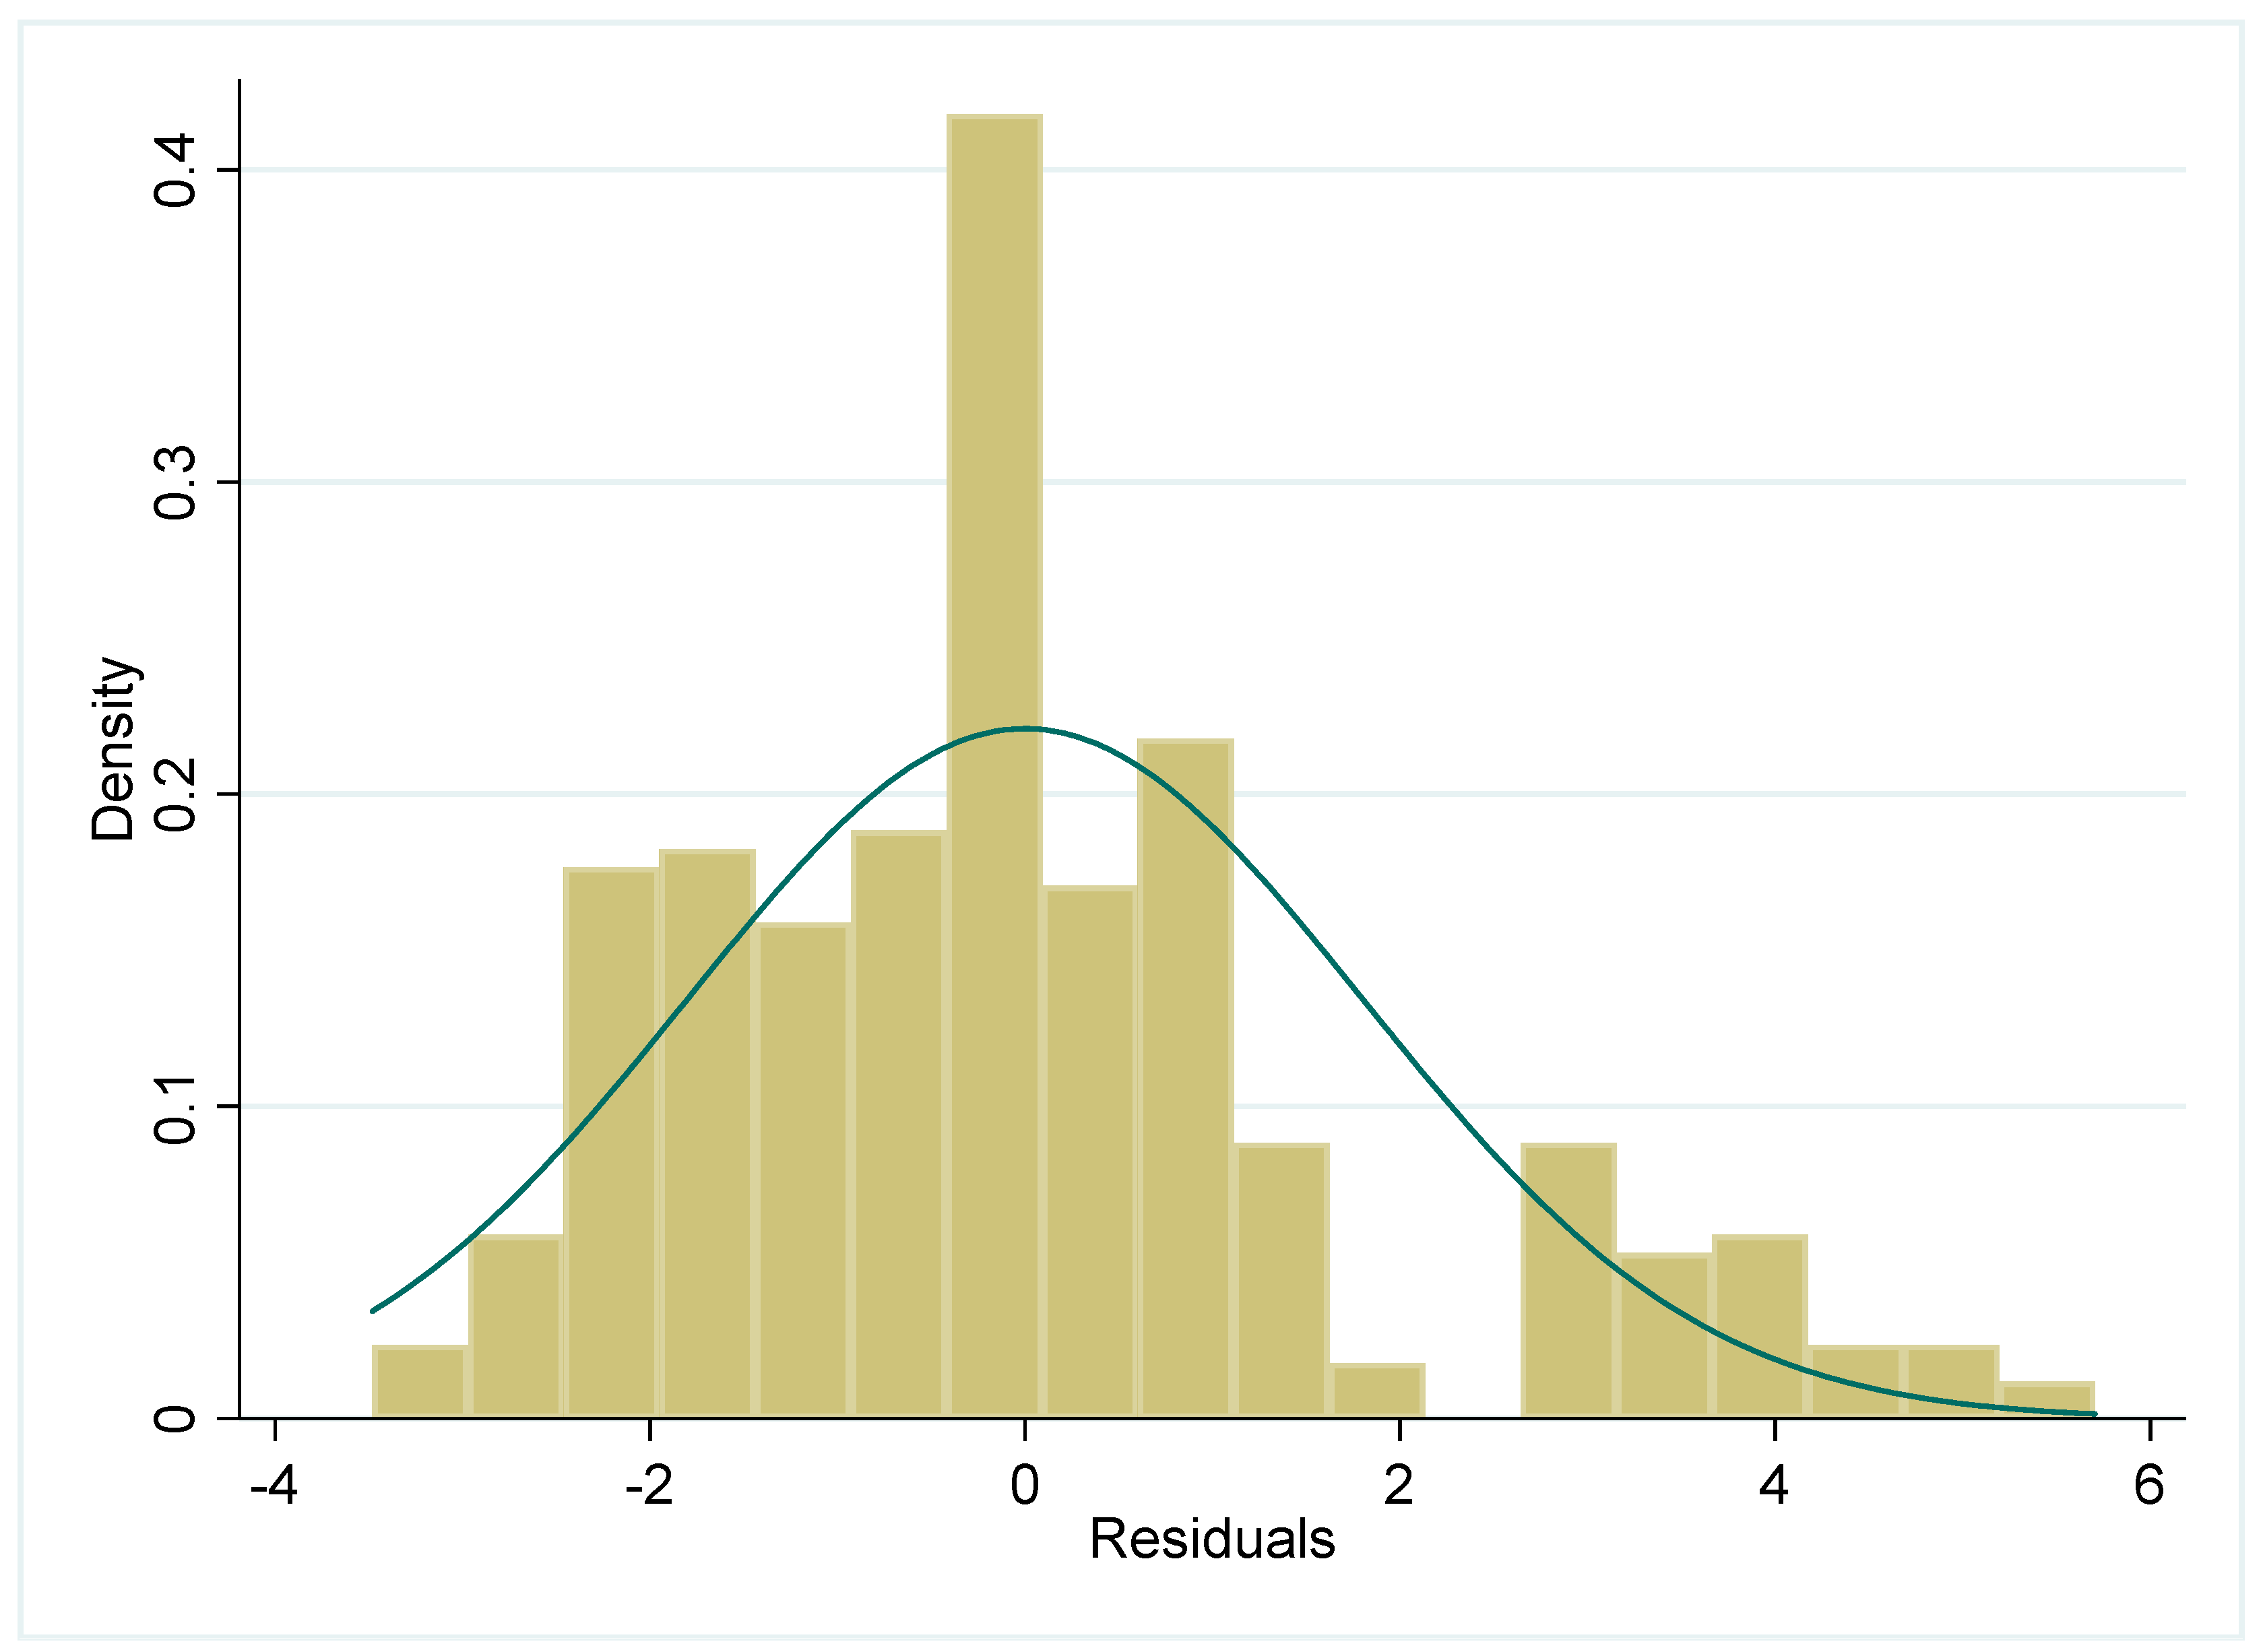
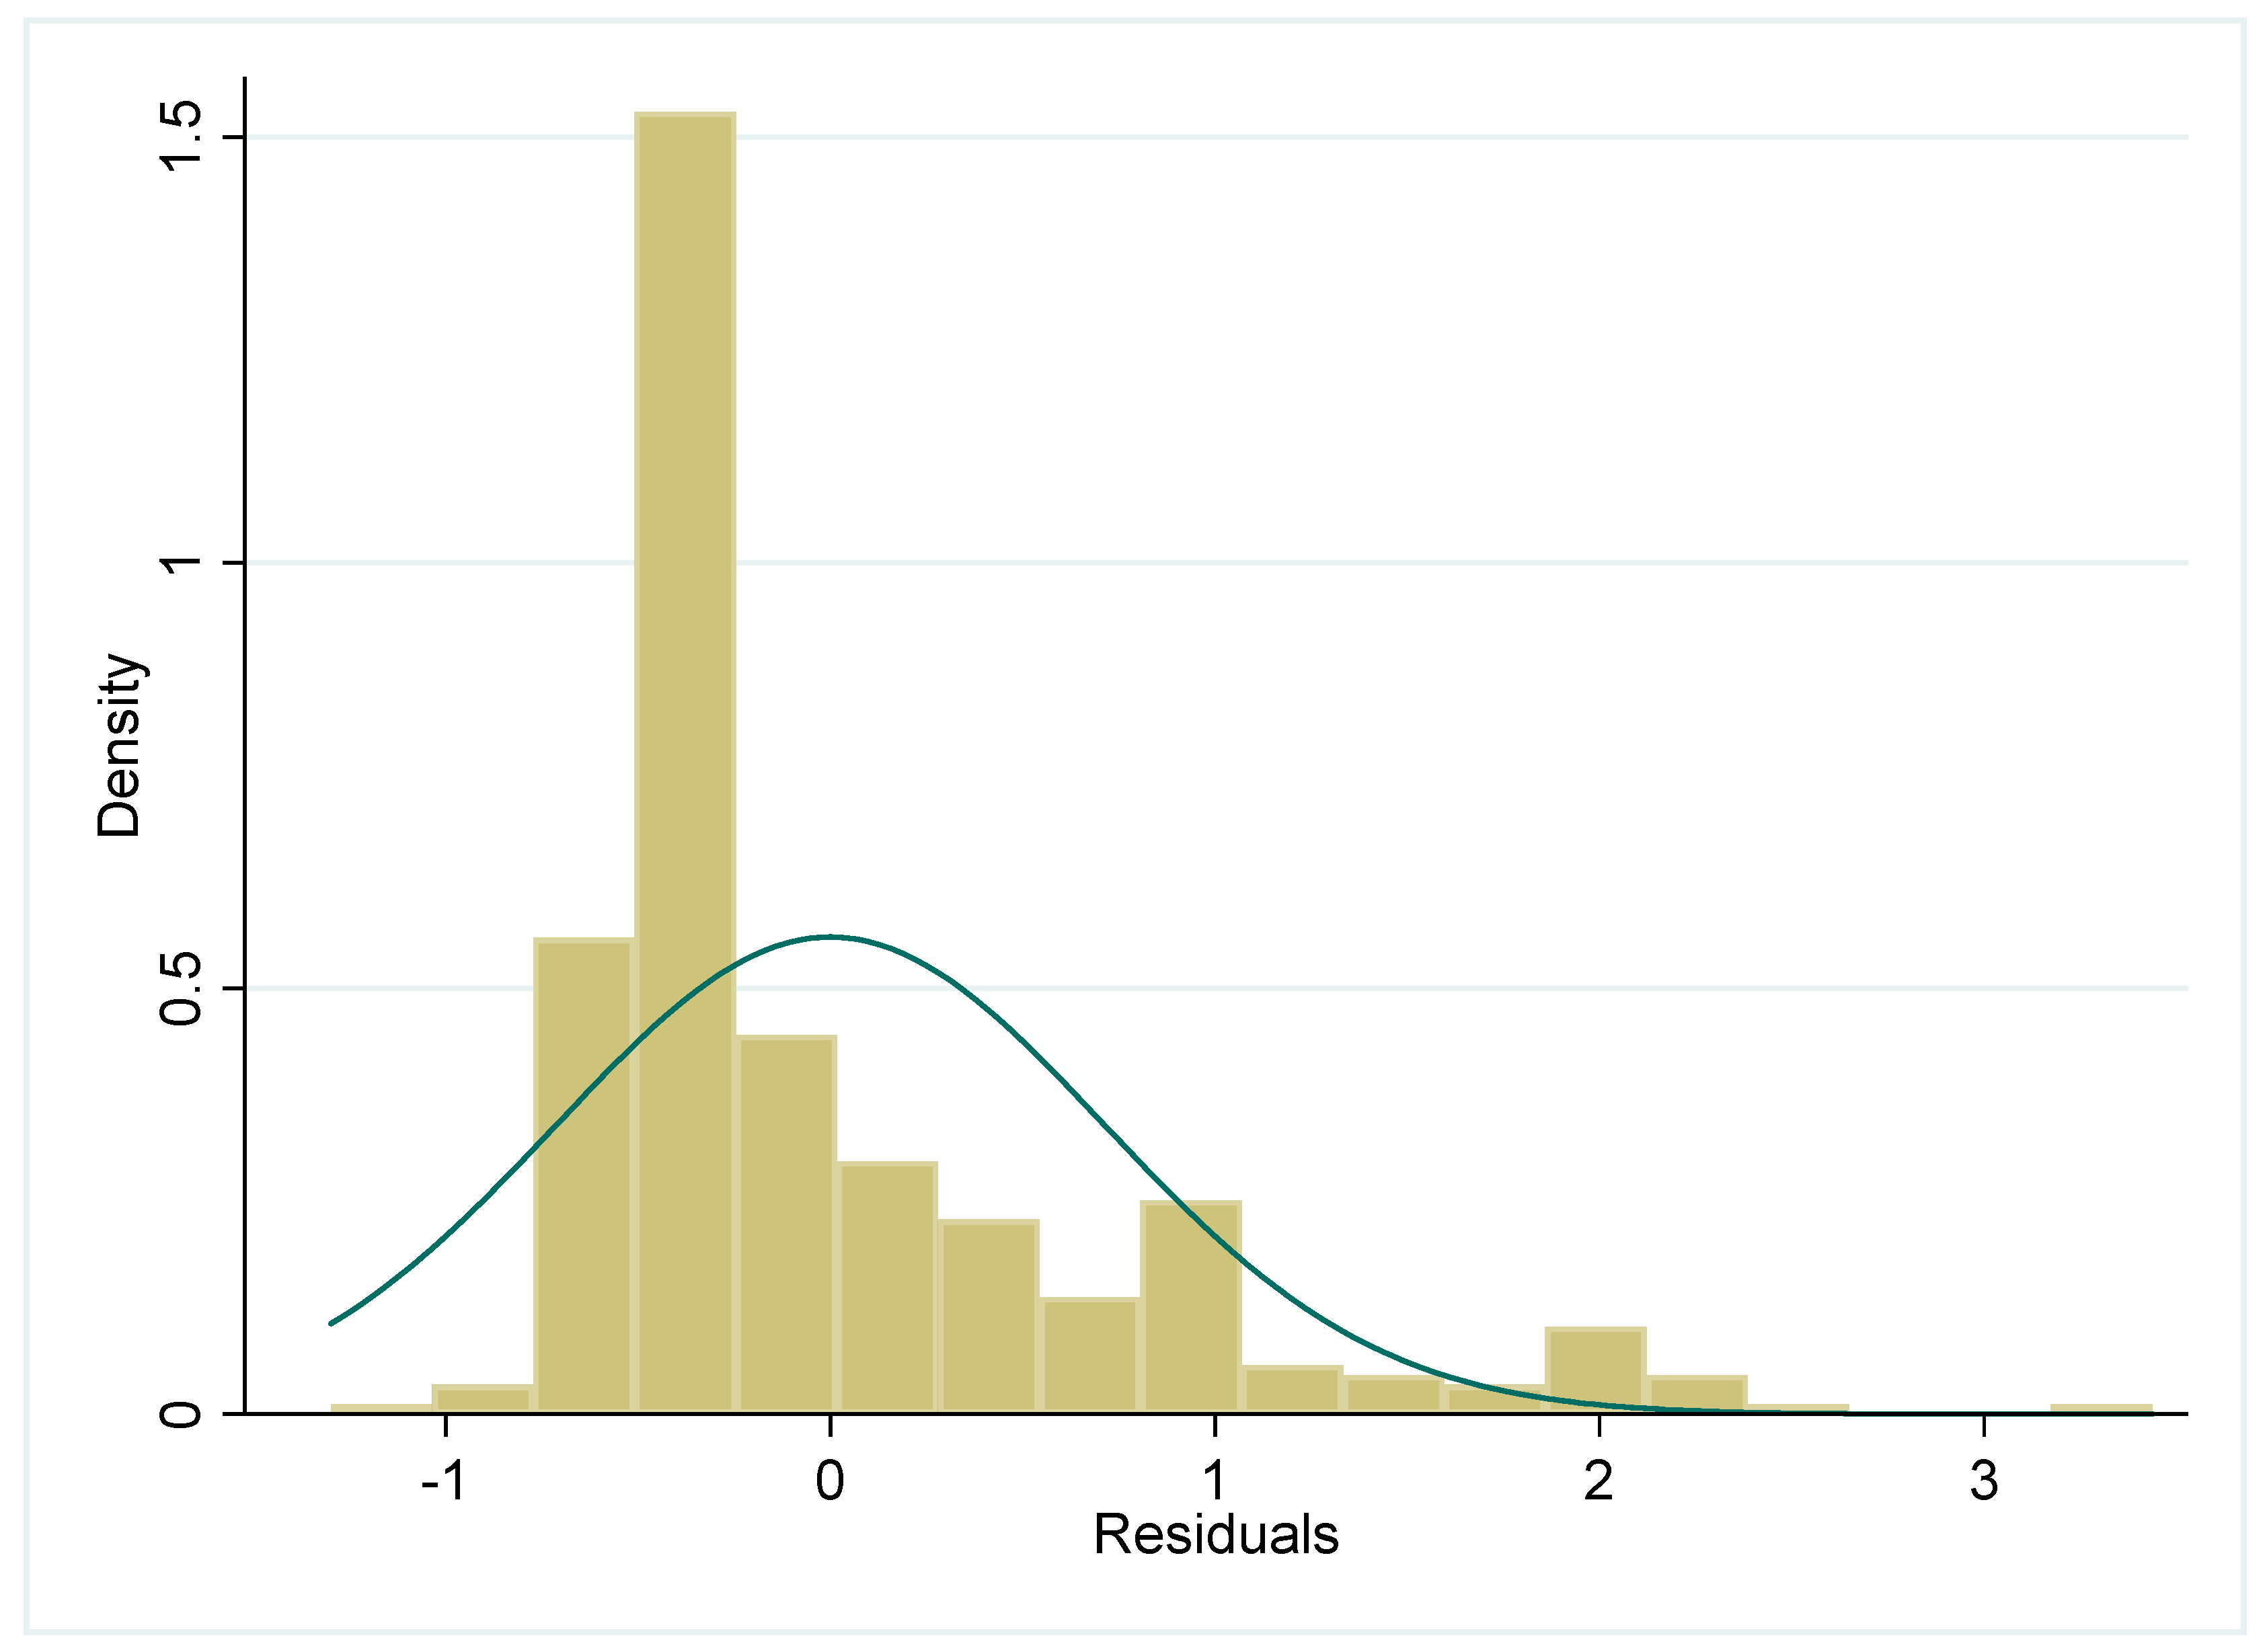
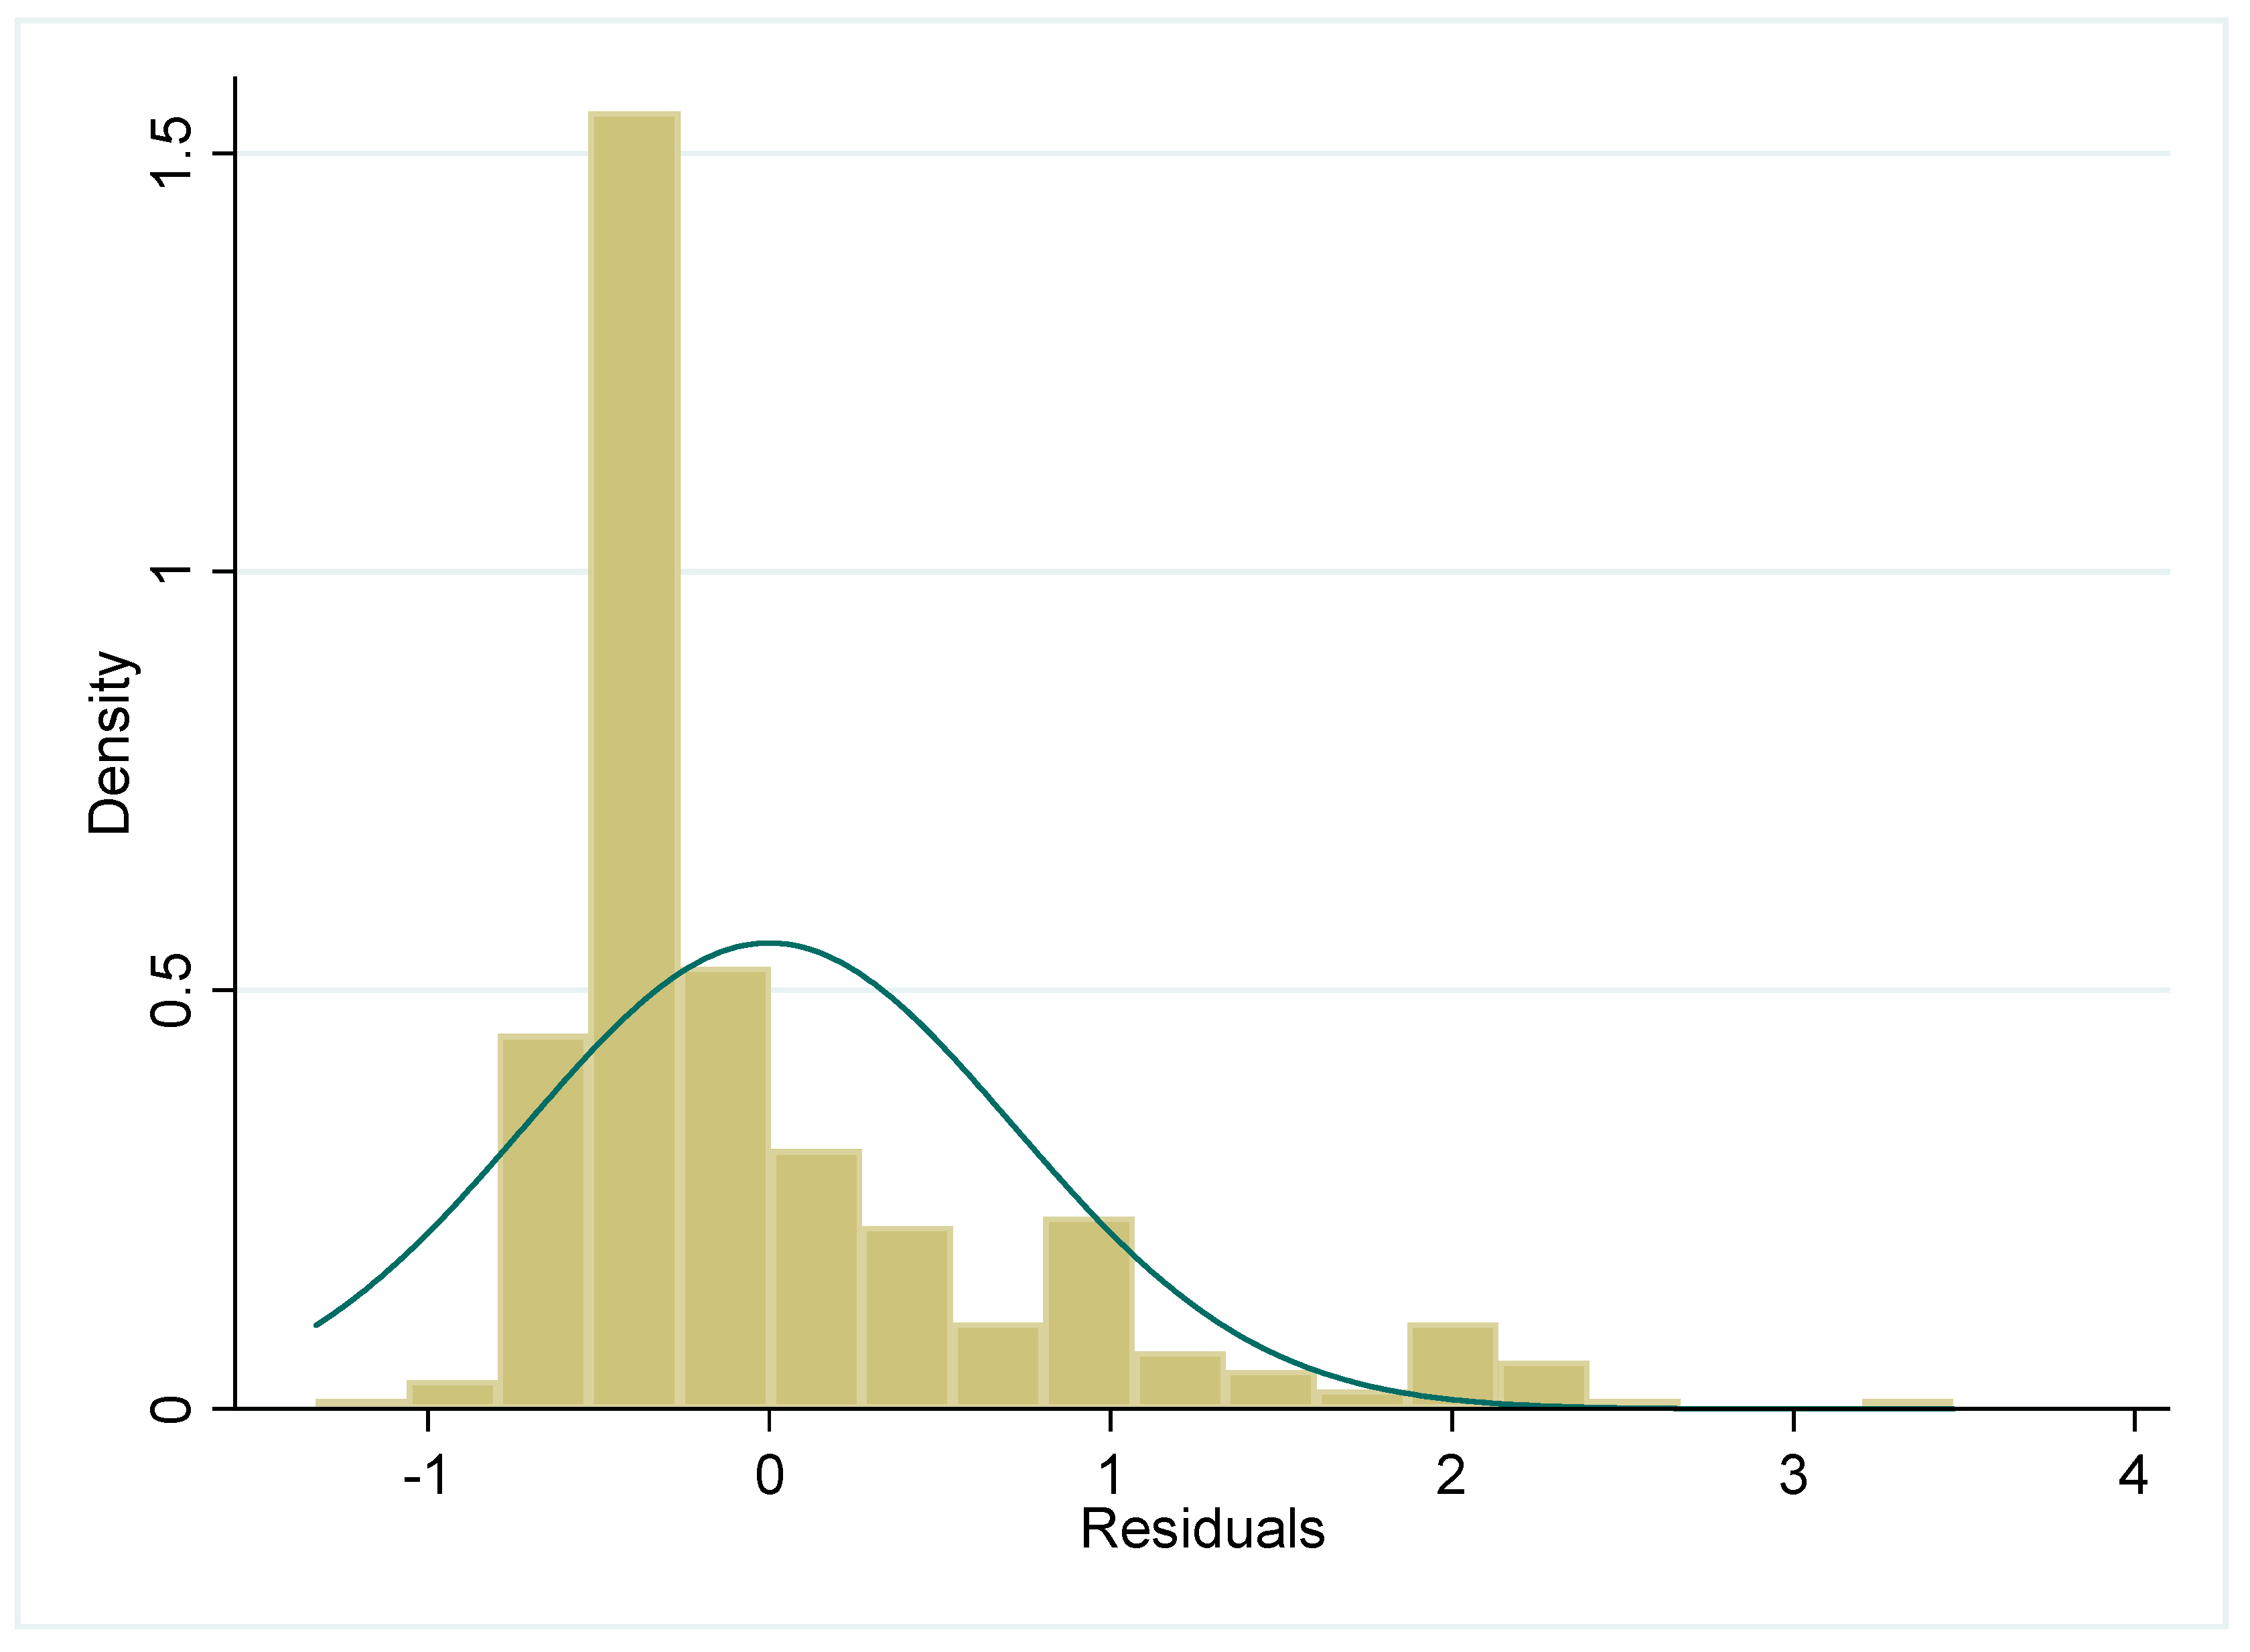
Table 2 show the influence of fiscal decentralization on the per capita expenditure of the NCMS. In the table, Columns (1) and (2) are estimation results acquired based on the data of 31 provinces during 2004–2014. Column (3) and (4) are estimation results acquired based on 30 provinces during 2004–2014. Columns (1) and (3) are fixed effect estimation results; Columns (2) and (4) are random effect estimation results. We also report the residual plot in
Figure A2 and
Figure A4.
According to the regression results, fiscal decentralization has a significant negative influence on the per capita expenditure of the NCMS. A higher fiscal decentralization degree indicates less per capita expenditure of the NCMS, and local governments are more enthusiastic in terms of controlling (unreasonable) expenditure, which verifies Hypothesis 1. On average, the increase by 1% in fiscal decentralization indicates a decrease of 1.5–1.6 units in the per capita expenditure of the NCMS.
The per capita GDP has a significant positive influence on the per capita expenditure of the fund; a higher level of local economic development indicates that local governments have higher competence in terms of improving the guarantee level of the NCMS, leading to a relatively high per capita expenditure. Other variables such as the average medical expense of outpatient patients and the guarantee degree have a positive influence on per capita expenditure. The participating rate has a negative influence on per capita expenditure. However, variables such as the per capita medical expense of hospitalized patients, the proportion of the population above 65 years old, and that of the population under 14 years old have no significant statistical significance with respect to per capita expenditure.
The number of benefiting has a positive influence on the per capita expenditure of the NCMS; an increase in benefiting by 1% leads to an increase in per capita expenditure by 0.25–0.27 units. Generally speaking, with a fixed expenditure, more residents enjoying treatment lead to reduced but not increased per capita expenditure. That is, theoretically, number of benefiting has a negative but not a positive influence on per capita expenditure. Changes in national medical service utilization provide a relatively reasonable explanation. With respect to national medical service utilization conditions, the number of diagnosis and treatment in hospitals is obviously increased, and the medical expenditure in hospitals is far higher than that of basic-level medical institutions. For example, compared with 2014, the number of diagnosis and treatment in hospitals in 2015 increased by 0.11 billion person-times, and the average expense of outpatient patients was 233.9 RMB, far higher than that of basic-level medical institutions, which is 97.7 RMB [
49]. Given the unchanged or even reduced person-times of basic-level medical institutions, the increase in person-times of diagnosis and treatment in hospitals will lead to an increase in per capita expenditure. For instance, the fixed total diagnosis and treatment person-time is 10; the diagnosis and treatment person-time of basic level medical institutions and hospitals are both 5 at first; the diagnosis and treatment expense of basic level medical institutions is 50, and that of hospitals is 150; per capita diagnosis and treatment expense is 100. With the increase in diagnosis and treatment person-time of hospitals (changing to 6) and the decrease in the basic level health institutions to 4, per capita diagnosis and treatment expense is 110, larger than the initial 100.
Columns (5)–(8) in
Table 2 report the influence of fiscal strength on local financial aid. Columns (5) and (6) are regression results based on 31 provinces during 2004-2014. Columns (7) and (8) are estimation results based on the data of 30 provinces collected over a period of 11 years. Columns (5) and (7) are fixed effect estimation results, and Columns (6) and (8) are random effect estimation results. The Hausman test result (see
Table A4) indicated that we should obey the fixed effect model. And we report the residual plot in
Figure A3 and
Figure A5. According to regression results, the proportion of fiscal income has a negative influence on local financial aid. The deletion of Tianjin data has no significant influence on the regression results. The results contradict the hypothesis in the previous paragraphs that higher local fiscal strength indicates higher local financial aid (Hypothesis 2). Generally speaking, a higher local fiscal strength indicates a higher competence of local governments in terms of improving aid for the NCMS; however, a higher local fiscal strength (a higher proportion of fiscal income) leads to less aid provided by local governments. There are two reasons for this. Firstly, the aid standard is stipulated by the central government, and the financial aid between the central government and local governments is distributed as per a fixed standard; therefore, local governments have to undertake their own aid responsibilities whether or not they show high fiscal strength. The regression results of the aid standard (stipulated by the central government) with respect to local financial aid verify this to a certain extent. The aid standard has a significant positive influence on local financial aid, and estimation results are extremely robust. Secondly, when determining the financial aid for the NCMS, local governments may be influenced by the financial aid of other local governments. Therefore, we will later make full use of the autoregression model of the space panel to investigate the influence of the NCMS financial aid level of other local governments.
Additionally, government preference has a negative influence on the financial aid of governments, which is not in accordance with direct impressions. Directly, government preference positively influences government aid. A higher degree of attention paid to the NCMS by governments indicates more financial aid from governments; however, the regression result contradicts the direct impression. One reason for this is that the variable of government preference cannot reflect the degree of attention paid by local governments to the NCMS in a favorable way. In this paper, we use the ratio of local government expenditure on medical health and family planning to total local fiscal expenditure to measure the variable of government preference. However, medical health and family planning expenditure includes not only government aid used for social medical insurance but also medical health management and public health. Therefore, the indicator of government preference constructed based on medical health and family planning overrates the degree of attention paid by governments to the NCMS, which leads to deviation in the estimation results of governments’ financial aid based on the variable of government preference.
5.2. Estimation Result of Spatial Panel Auto-regression Model
The strategic interaction of local governments between the expenditure of the NCMS and financial aid was also investigated. With respect to fixed and random effects, according to Elhorst, large numbers of spatial econometrics literature have adopted random effect models but not fixed effect models [
50]. For this reason, we report the estimation results of random effect models only.
Firstly, the influence of fiscal decentralization on the per capita expenditure of the NCMS is investigated.
Table 3 reports the estimation results of fiscal decentralization with respect to per capita expenditure. Columns (1)–(4) are estimation results based on the adjacent weight matrix; Columns (5)–(8) are estimation results based on the distance reciprocal weight matrix. According to the Wald test of the space items, there is a spatial correlation.
With respect to space items, when excluding the data of Tianjin (with 270 observed values), the space correlation coefficient ρ is significantly positive. Therefore, this article lays emphasis on the estimation results of Columns (3)–(4) and (7)–(8). According to the estimation results of Columns (3)–(4) and (7)–(8), when re-estimating by utilizing the distance reciprocal weight matrix M, there is no significant change in the space correlation coefficient ρ.
After the introduction of the space effect, related variables indicate no significant influence on per capita expenditure of the NCMS. The estimation results of variables such as fiscal decentralization, per capita GDP, the number of benefiting residents, and the guarantee degree are similar to the random effect estimation results in
Table 2. Fiscal decentralization still has a significant negative influence on per capita expenditure; on average, the increase in the degree of fiscal decentralization by each unit leads to a reduction in per capita expenditure by 1.2–2.9 units. Per capita GDP has a significant positive influence on per capita expenditure; after the introduction of the space factor, the increase in per capita GDP by each unit leads to an increase in per capita expenditure by 0.67–1.30 units. The guarantee degree has a significant positive influence on per capita expenditure; the increase in the guarantee degree by each unit leads to an increase in per capita expenditure by 0.9–1.4 units. Outpatient expense and hospitalization expense have a positive but insignificant influence on per capita expenditure. The proportion of the population above 65 years old has a significant positive influence on per capita expenditure, which is in accordance with the current situation. Generally speaking, compared with young adults, senior citizens consume more medical resources. A larger population of senior citizens indicates a higher consumption of medical resources as well as a greater expenditure of medical insurance funds. The influence of the proportion of the population under 14 years old on per capita expenditure is no longer significant. The participating rate still has a significant influence on per capita expenditure.
Secondly, the influence of local fiscal strength on local financial aid was investigated.
Table 4 reports the influence of local fiscal strength on local financial aid after the introduction of the space influence factor. Columns (1)–(4) are estimation results based on the adjacent weight matrix W. Columns (5)–(8) are estimation results based on the distance reciprocal weight matrix M. According to the Wald test of the space term, there is a spatial correlation.
With respect to space term, the space correlation coefficient ρ is significant. However, based on the data of 31 provinces, the space correlation coefficient ρ estimated based on the distance reciprocal weight matrix M is negative. This indicates that the space correlation coefficient ρ after excluding the data of Tianjin is more robust. Therefore, this article places emphasis on the estimation results of Columns (3)–(4) and Columns (7)–(8).
When making comparisons between data in Columns (3)–(4) and Columns (7)–(8), most variables have the same influencing direction with respect to local financial aid. However, some variables such as fiscal decentralization, per capita GDP, and participating rate have opposing influencing directions with respect to local financial aid in the estimation results based on the adjacent weight matrix W and the distance reciprocal weight matrix M. Variables such as fiscal decentralization, per capita GDP, and participating rate appear to have a positive influence on local financial aid in the estimation results acquired by utilizing the adjacent weight matrix W; however, they have negative influences in the estimation results acquired by utilizing the distance reciprocal weight matrix M, with no significant estimation results, and only the estimation result of the variable of the participating rate based on the adjacent weight matrix W has a positive influence on the significance level of 90%. In Column (4), fiscal decentralization has a significant positive influence on local financial aid.
When making comparisons between the random effect estimation results of Columns (6) and (8) in
Table 2, after the introduction of strategic interactions among local governments, the influence of some variables on local financial aid changes significantly. The key explanatory variable, the proportion of fiscal income, has a significant positive influence on local financial aid. According to the estimation result of the random effect in
Table 2, the proportion of fiscal income has a positive influence on local financial aid, but this influence is not significant. When introducing the strategic interaction among local governments, the proportion of fiscal income has a significant positive influence on local financial aid. A higher proportion of fiscal income indicates a higher fiscal strength in local government. Compared with other local governments, the current local government has greater competence in improving financial aid to insured citizens. This result is in accordance with Hypothesis 2.
The urbanization rate has a significant positive influence on local financial aid, in accordance with estimation results of the random effect model in
Table 2. A higher urbanization level leads to more financial aid from local governments to insured citizens. The urbanization rate reflects the proportion of the urban population to the total population. With a fixed total population, a higher urbanization rate indicates a larger proportion of urban citizens and a smaller proportion of rural citizens with respect to the total population. It is assumed that local governments improve financial aid to insured citizens; compared with cities with a low urbanization rate (a high rural population), cities with a high urbanization rate (a low rural population) face less financial pressure. Therefore, cities with a high urbanization rate are more likely to improve financial aid (as they are more competent in doing so). Considering the strategic interaction among local governments, on average, the increase in urbanization rate by each unit leads to an increase in financial aid provided by local governments by 1.9–2.2 units. Compared with the data in
Table 2, the influence of aid standard and government preference on local financial aid are not significantly different.
6. Conclusions
In China, social medical insurance is managed by local governments. On the one hand, local governments bear the responsibilities of financing and compensating for deficits in funds. On the other hand, local governments also have the task of economic development. Thus, it is necessary to consider that the influence of local government behavior on the expenditure of medical insurance. In this study, we evaluate the effect of fiscal decentralization on per capita expenditure of the NCMS.
Our results show that fiscal decentralization indeed has a significance influence on per capita expenditure of the NCMS, and local governments impact each other as well. The expenditure of a province influences, and is influenced by, that of adjacent provinces. The evidence of Italy also indicates that, when the responsibility between the central government and local governments is well-defined, local governments have the incentive to improve the management of medical insurance funds [
51]. And it’s similar with the study of Fervers et al [
18]. In order to gain an advantage in the international competition, governments also have incentive to strength the management of medical insurance and cut down medical spending. However, Peng et al [
17] found in the “tournament promotion”, local governments have the motivation to lower endowment insurance rates in order to attract more FDI, which had negative influence on the balance of endowment insurance fund. In the study of Peng et al, local governments could adjust the endowment insurance rates to attract foreign investment, but in our paper, it’s not worthy for local governments to lower the payment standard because the central government would punish the local government who lower the subsidy standard. It’s the reason of two opposite conclusions between our paper and the study of Peng et al. And we also found that different provinces are correlated with financial aid for the NCMS in certain ways, and the financial aid for the NCMS of a province is influenced by that of other provinces. This result is in line with the findings of Zhu and Li [
16], who found that the behavior of local governments impacts other local governments; when one local government increases subsidies for medical insurance, adjacent local governments will as well.
In sum, our results show that fiscal decentralization from the central government to local governments improves the NCMS fund sustainability by lowering the per capita expenditure and suggest a need to stimulate local governments’ motivation to control this expenditure and to restrain the power of local governments to improve reimbursement proportions and guarantee ranges.
Meanwhile, there are still some limitations of our study. An anonymous reviewer pointed out that municipalities play an important role in managing health insurance funds and that it is best to use municipal data for regression analysis. However, much of the data are unavailable in China, such as municipal subsidy, the central-to-municipal subsidy, numbers of municipal participants, etc., and we had to perform our analysis with provincial data. Even though, the paper based on provincial data could also reflect the impact of local government behavior on the expenditure of NCMS, because from the perspective of provincial governments, there are also “tournament promotion” among provincial governments, and this will inevitable have an influence on the behavior of provincial governments. We will further explore appropriate municipal data to conduct further analysis. Moreover, some variables may interact as both a cause and an effect. We thank this anonymous reviewer for their great insight in rethinking the relationship among variables. We could not solve this problem, due to the shortage of macro data. We will try to find appropriate micro data and consider other variables to solve this problem in the future.


