Article

Designing a User Participation-Based Bike Rebalancing Service

Department of Interior Architecture Design, Hanyang University, Seoul 04763, Korea
*
Author to whom correspondence should be addressed.
Sustainability 2019, 11(8), 2396; https://doi.org/10.3390/su11082396
Submission received: 29 March 2019 / Revised: 17 April 2019 / Accepted: 19 April 2019 / Published: 23 April 2019
(This article belongs to the Section Sustainable Transportation)

Abstract

:
The Bicycle-sharing System (BSS) has been globally adopted as a sustainable transportation system that helps improve air pollution, public health and traffic congestion. The increased usage of BSSs requires an increased number of rebalancing trucks to distribute bikes throughout the city. Operating rebalancing trucks is an expensive venture that requires intensive manpower that is dependent on traffic congestion. In this background, a user participation-based rebalancing service was introduced to solve the problem, but it was difficult to test the impact of the service and the estimated cost in the city. Thus, this research proposes a simulation system that tests user participation-based rebalancing services with different user parameters such as the amount of incentives, the user participation rate and extra walking distances. We conducted an incentive survey on actual BSS users to determine the accurate values of these parameters. We also identified that, among the three parameters, extra walking distance is the most influential element on which to improve the rebalance imbalance metric. We found that the incentive coefficient is an important variable in determining the estimated cost of the service. Thus, any city can utilize the proposed system to design a user participation-based rebalancing service that is suitable for their city.

1. Introduction

A bike-sharing system (BSS) is a public service that provides healthy, enjoyable and emission free commuting to the public by renting out bicycles [1,2]. The service provides bikes so that users can utilize them instead of vehicles that run on fossil fuels. Users of the system can simply rent a bike from any station and return the bike to a station nearest to their destination. In light of this factor, BSS is considered a promising service that can improve environmental and traffic problems. For the past few decades, the advancement and implementation of smart systems, including apps and transportation cards, have improved the security and durability of the BSS [3]. According to Conticelli et al. [3], current BSSs focus on developing self-powered systems to improve the efficiency of bike rebalancing to maximize the service usage rate. As a result of its effectiveness and socioeconomic advantages, large metropolitan cities, such as New York, Paris, London, Tokyo, Beijing and Seoul, are actively expanding and adapting their BSS networks [2,4,5]. However, unlike European cities, the distribution factor of bikes in transportation systems in Seoul is significantly lower (Table 1).
According to Lee et al. [8], South Korean cities are dense and diverse. Therefore, improving access to public transit can be advantageous. Seoul, for example, utilizes over 20,000 bicycles for their BSS and users of the system make approximately 5302 bike rentals daily and use them to commute and ride to public transits [9]. However, despite the large volume of bikes that are in running for the service, the bikes are not well distributed throughout the city. For instance, the BSS usage statistics show a stochastic pattern where the users rent the bikes from various locations and return them to commercial regions during the rush hour. This results in bike congestions in concentrated areas (in red) while there is a shortage of bikes (in blue) in other regions (Figure 1). As a result, potential users of the system face problems when they attempt to rent bikes from the station of their choice.
To solve the problem, BSSs utilize rebalancing trucks that redistribute the bikes to the stations in need. This is seen as a pickup and delivery problem where the service provider needs to consider the instruction of truck drivers, the navigation issues surrounding truck routing and the socioeconomic costs. The current truck operation method is inefficient during traffic congestion. Truck operators have to park the vehicle and manually unload and load the bikes, which is very time-consuming. Rebalancing trucks in Seoul often cause car accidents—there were 24 accidents in 2017 [9]. Such accidents can be critical during rush hour. Furthermore, delivery trucks are prohibited from entering certain areas in the interest of landscape aesthetics and safety in Korea [8]. Another major issue is the economic cost. As of 2018, Seoul City operates 56 rebalancing trucks with 108 designated workers who operate the trucks 24 h a day [9]. This truck-based rebalancing method requires the use of trucks, operators and maintenance fees, which increases fuel emissions. However, unlike the truck-based rebalancing methods, there is the potential of a user participation-based rebalancing method. The user participation-based method utilizes public involvement to distribute the congested bikes to the stations where they are needed by providing incentives to the participants. Citi Bike in New York City operates the ‘Bike Angel’ program, which incentivizes users to kindly move their bikes to stations where they are needed. In this respect, New York City does not necessarily reduce the fixed costs of operating the truck and its team but provides a positive influence on social and public aspects by improving public health and reducing fuel emissions.
To implement the user participation-based rebalancing service, it is important for cities to estimate the number of participants and costs. Unlike the operator-based rebalancing service that utilizes a fixed number of trucks with prescheduled rules, the success of the user participation-based rebalancing service is influenced by both user participation and incentives. Thus, we are proposing a method that simulates a user participation-based rebalancing service. The simulation system proposed in this research evaluates an appropriate budget to utilize a user participation-based rebalancing service in Seoul. For this reason, a survey was conducted with the residents of the city to identify their minimum estimates of incentives per travel distance. In this respect, it is possible to test the real impact of the user participation-based rebalancing service depending on the city’s budget. To do that, we conducted four major tasks: first, we developed a method to calculate the incentive threshold and corresponding incentive; second, we developed an incentive survey to identify city residents’ actual participation rates; third, we developed an agent-based simulation; lastly, we simulated a user participation-based rebalancing service with actual BSS data and evaluated its impact on the city within various budget ranges. Through this study, we make the following contributions to the literature:
(1)
We developed a novel system to simulate the user participation-based rebalancing service.
(2)
We determined three parameters that influence the calculation of the incentives for the user participation-based bike rebalancing service.
(3)
The proposed system allows estimation of the cost of the user participation-based rebalancing service in relation to actual city budgets.
(4)
The proposed system allows cities to adjust the parameters to design a user participation-based rebalancing service that is most suitable to them.
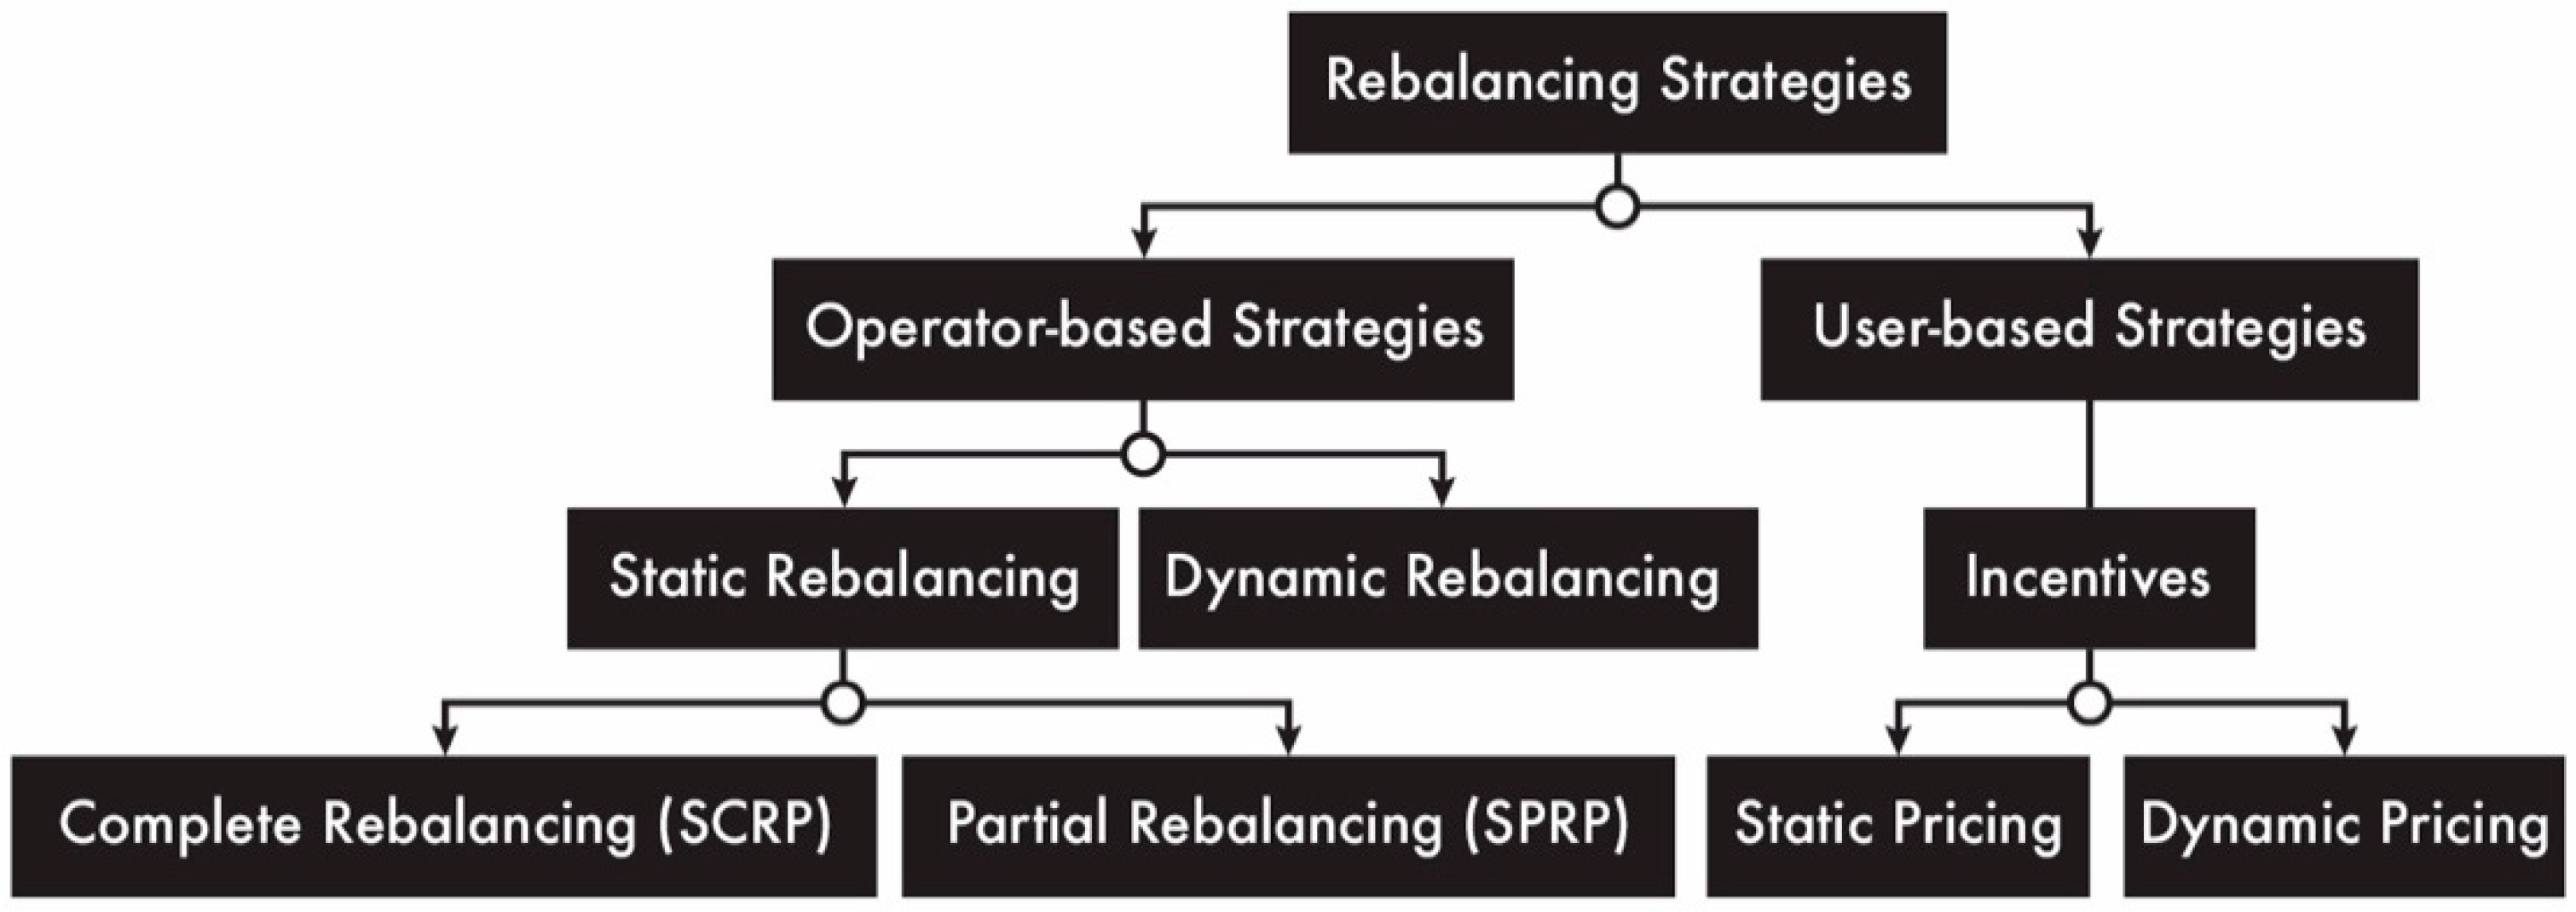
2. Related Works

As illustrated in Figure 2, bicycle rebalancing is an active research area that can be divided into two large groups [1]: (1) operator-based rebalancing and (2) user participation-based rebalancing. The former utilizes rebalancing operators (i.e., trucks) to redistribute bikes from congested bike stations to depleted stations. Therefore, research on operator-based rebalancing strategy concentrates on optimizing the computational costs of pick-up and delivery problems [10]. However, unlike bike rebalancing systems based on operators, a user participation-based strategy is a way of replacing the truck operator’s role by incentivizing users and encouraging them to relocate the bikes voluntarily. The user participation-based rebalancing strategies have two major incentive strategies: (1) static pricing and (2) dynamic pricing. In the case of static pricing and dynamic pricing studies, the former is a way of incentivizing a fixed amount and the latter is a way of inducing users’ voluntary participation by providing different incentives depending on time and situation. It is important to incorporate dynamic pricing scales to calculate more accurate and effective incentives.
The user participation-based rebalancing service is a recently introduced method in shared transportation. Cities in Europe with bicycle sharing systems are implementing it as an environmentally friendly means of bike redistribution. According to Whitehead [11], Bologna in Italy ran the “Bella Mossa” program, which provides virtual points to public transportation users. The users can use the points to purchase ice creams and souvenirs in designated stores. The program, which lasted only six months, was rated as successful, with more than 10,000 users [11]. The concept of applying the user participation-based rebalancing system to BSSs has been researched and the main focus has been on how incentives should be calculated. Pfrommer et al. [12] proposed a real-time incentive calculation method to efficiently solve the rebalancing problem. The data analysis was based on the Barclays Cycle data in London. According to the authors’ analysis, wherein they used their proposed incentive calculation method in London, existing truck operations on weekends were reported as 87% effective, while the method proved impossible on weekdays. However, they did not use their incentive data from actual users but rather from the estimated model that they suggested. Singla et al. [13] developed a model that dynamically calculates incentives by surveying the distances that bike-sharing system users are willing to move to in order to streamline bike rebalancing. Chung et al. [14] developed a service evaluation metric by analyzing the ‘Bike Angel’ service of Citi Bike in New York City, which utilizes user-involved bike rebalancing. In the case of user-involved bike rebalancing, there is a disadvantage with an offline static incentive, while online has the advantage of being able to dynamically change the incentive. Despite the state-of-the-art research conducted by the above researchers, there are no simulation systems to help predict efficiency and cost estimations for user participation-based rebalancing available to our knowledge. Simulation is critical when solving large-scaled complicated data. A simulation system followed by a data analysis allows one to evaluate information that would be impossible to identify without it. Thus, we defined three major parameters to simulate the user participation-based rebalancing system depending on the city’s budget: (1) the maximum walking distance; (2) the incentive threshold for walking motivation; (3) the user participation rate. By coordinating these three parameters, it is possible to simulate various events in different situations. Therefore, simulations with varying budgets, incentives and user behavior can identify the optimal user participation-based rebalancing service.

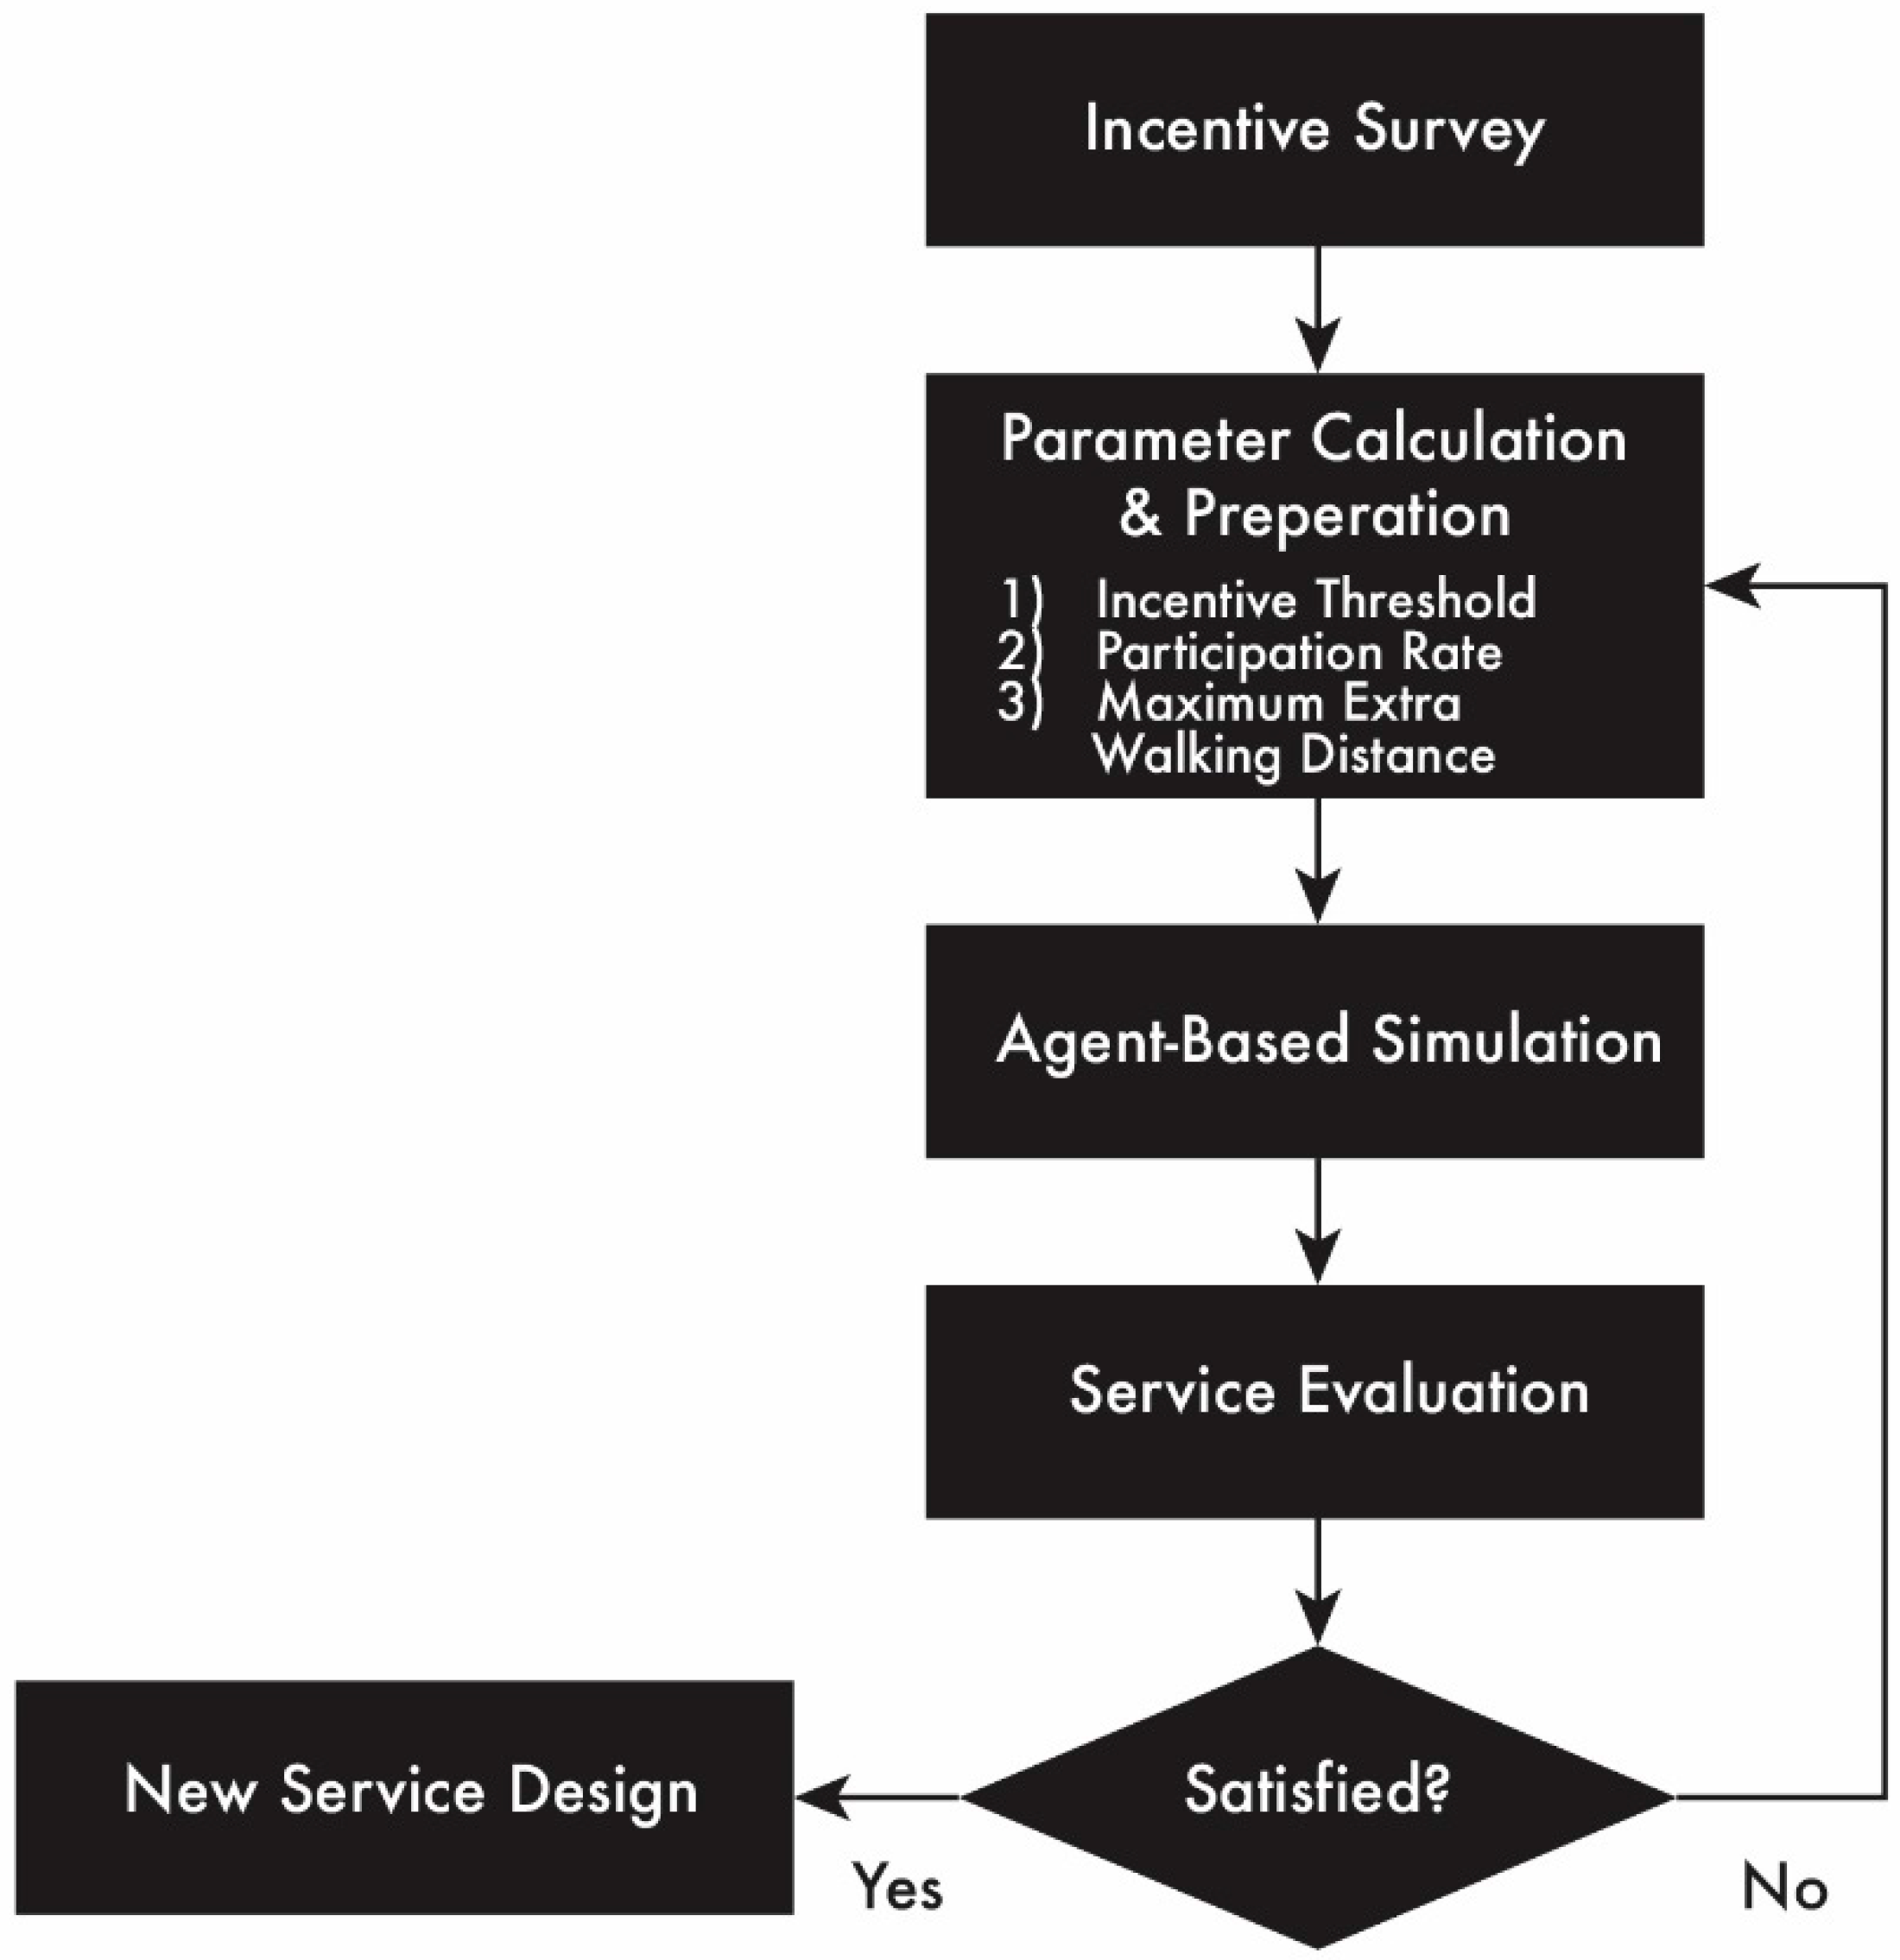
3. Simulation System for User-Participation-Based Bike Rebalancing Service

We designed a dynamic pricing-based simulation system that evaluates the performance of user participation-based rebalancing service depending on different combinations of incentives thresholds, participation rates and extra walking distances. We first need to specify the evaluation metric to measure the bike distribution status in order to simulate the performance of the user participation-based bike rebalancing service. Then, we need to identify which of the three parameters affect the performance of the bike rebalancing the most. We used the rebalance imbalance metric (RIM) proposed by Ban and Hyun [15] to measure the bike distribution status. The RIM stipulates that the bike balance is taken away if the absolute value of the bikes is accumulated (+) or borrowed (-) at each station. Thus, the standard deviation of the insufficient quantity of bikes in each station was used as the evaluation metric for maintaining the balance for bike stations throughout the city [15].
The RIM was calculated throughout the bike usage data in the given time and how low the metric was maintained during that period was analyzed. Maintaining a low RIM is an indicator that the bike rebalancing service has been performed in a stable manner. On the basis of this, we developed a simulation system that evaluates the performance of rebalancing activities based on three user parameters (Figure 3): (1) the amount of incentives; (2) the willingness to participate in the service; and (3) the maximum extra travel distance for rebalancing. The first parameter defines the amount of incentives that is appropriate, depending on the travel distance. The second parameter defines the willingness of the user to participate in the user participation-based rebalancing service. The last parameter defines whether the station recommended by the system for rebalancing is at an acceptable distance for the user. The RIM varies on the basis of the combinations of the three user parameters. Therefore, we applied each user parameter into the agents of the simulation system. The agents move only on the basis of a predefined combination of the three parameters. This makes it possible to identify the hierarchy of the parameters that affect the rebalancing performance through a series of agent-based simulations. An incentive survey of the city’s residents is necessary to simulate the rebalancing performance of the different parameter combinations accurately. Thus, it is possible to identify important parameters to estimate costs for operating the service in a specific city.

3.1. Incentive Calculation

An incentive is an important element that motivates users to participate in rebalancing bikes. We developed an incentive calculation method based on dynamic pricing. The calculation method is based on the hypothesis that the amount of incentives motivating service users (incentive threshold) is proportionate to the extra walking distance Wd. The incentive threshold is defined by dividing the Wd by the maximum extra walking distance, Wd_max and multiplied by the proportionality constant, the incentive coefficient (Table 2). Since the amount of incentive varies on the basis of the performance of rebalancing per bike trip, we measured and compared the bike quantity in each station. To do that, we first quantitatively assessed whether the number of bicycles at each station was sufficient or insufficient. Then we calculated the regional imbalance scale (RIS), which reflects the number of bikes parked at nearby stations, allowing us to identify regional differences of bike quantities. The equation for the RIS was taken from Ban and Hyun [15] and the formula is as follows:
i = 1 N { 0 ( D i R ) ( 1 ( D i R ) 2 ) B i ( D i < R ) ,
The RIS for each station is defined as the sum of the equations for the distance D to each station i for a total of stations N. B is the bike storage variance rate at station i. Depending on the maximum distance of RIS calculation R, the pattern of regional imbalance varies. A low R value can help resolve rebalance imbalances in a small region quickly but may cause regional imbalances over time. However, a high R value can resolve regional imbalances but may be inefficient in rebalancing bikes on a station level. The proposed simulation system then calculated the dRIS to determine the rebalancing status at each station and paid the agents when the dRIS value was greater than the incentive threshold.

3.2. Pseudo Code for the Simulation System

The proposed simulation system incentivizes agents who rebalance bikes, which improves the overall bike balance throughout the city. Bike rebalancing can be conducted either when bikes are rented or when they are returned. Therefore, the system simulates the impact of rebalancing in both cases. We predefined three user behaviors to the agents in the simulation: (1) users will demand more incentives when the extra walking distance is increased; (2) users will be less likely to participate in the rebalancing service when the extra walking distance is increased; and (3) no matter how much incentive is given, users will not walk over a certain distance. We then derived three parameters that define these three user behaviors (Table 2): (1) the incentive coefficient ic; (2) the maximum participation rate mp; and (3) the maximum extra walking distance Wd_max. The ic represents the rate of change in incentives per extra walking distance. mp represents the maximum participation rate when the extra walking distance is at its minimum. Wd_max represents the maximum extra walking distance that users can walk. This study was conducted under the inference that both the amount of incentives and the decrease in participation rates were proportional to the extra walking distance.
When the combinations of Wd_max, ic and mp values are provided, agents in the simulation system start to rebalance bikes on the basis of the parameter settings. For instance, when the users rent bikes, the system calculates and compares the dRIS within the Wd_max for both the starting station (renting station) and the destination station (return station). Each station, however, has a threshold that determines if the incentive is worth the extra walking distance. The agents then select the nearest station from among the stations that exceed the threshold to rebalance bikes. The pseudo code for the proposed simulation system is as follows:
(1) 
Principle
(a)
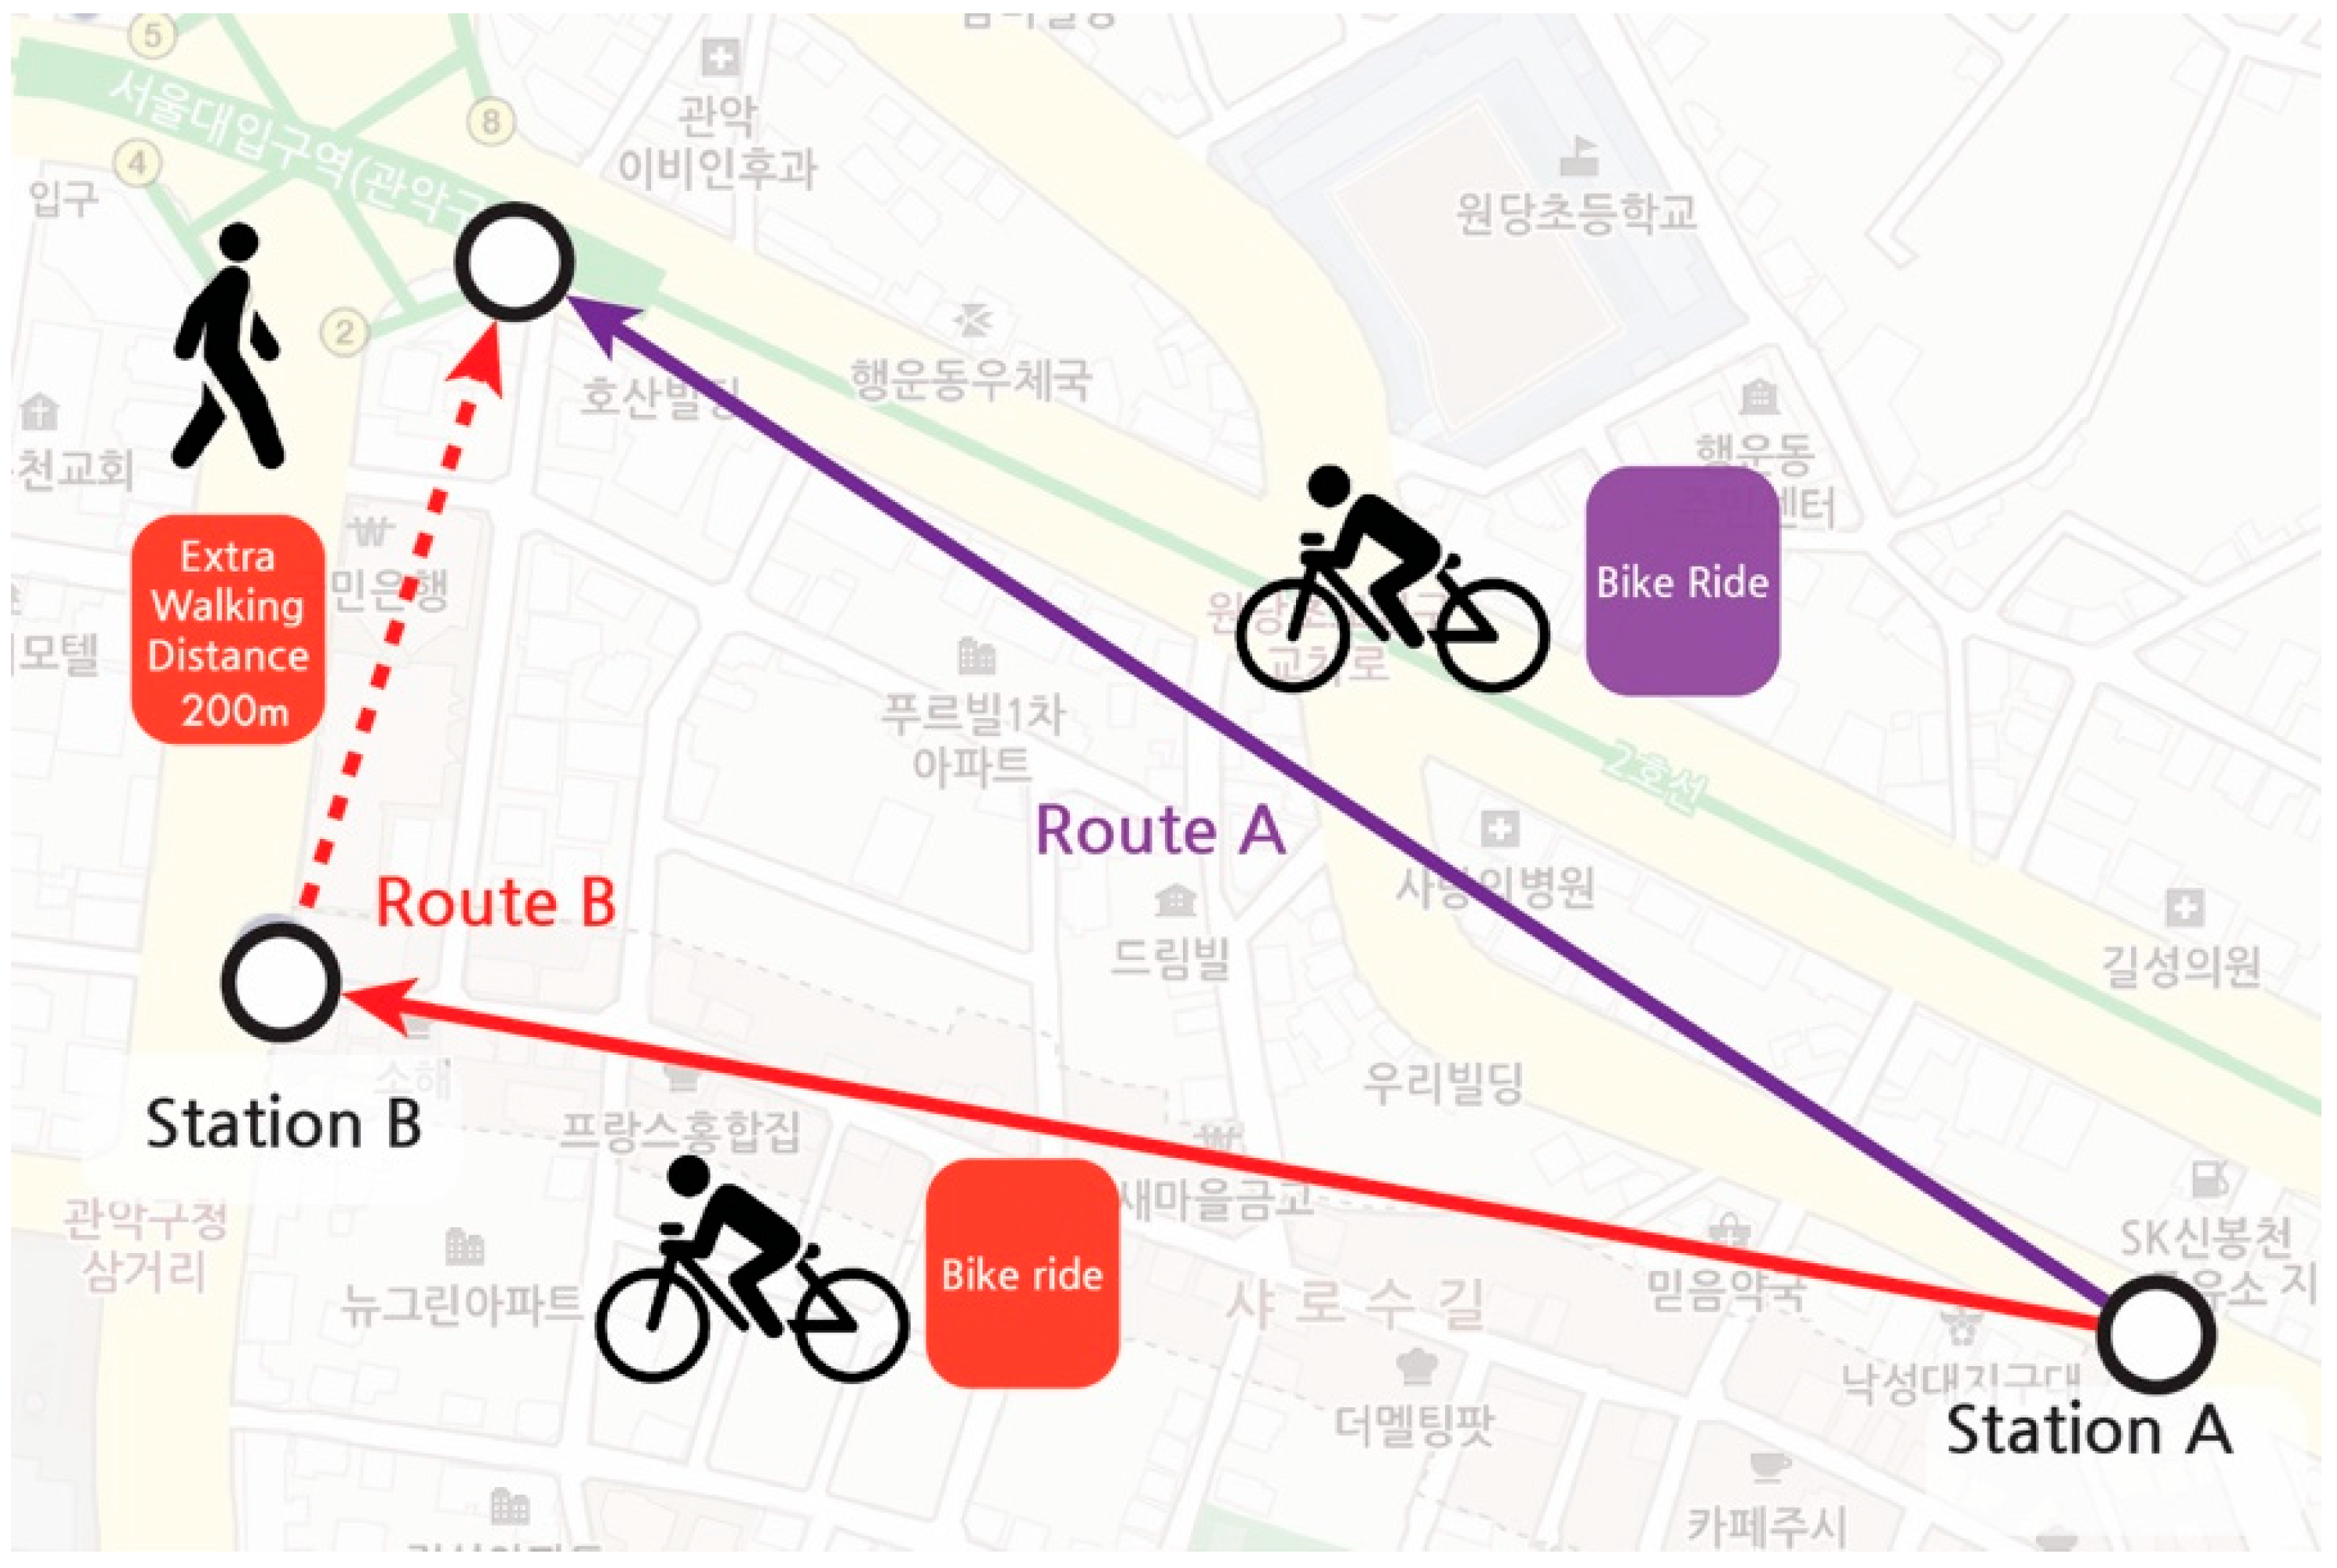
When a user accesses a station to rent or return a bike, our system offers an incentive to the user to relocate to other stations to avail the bike rebalancing service.
(b)
The user accepts the offer only if the incentive exceeds the threshold.
(c)
The system pays an incentive based on the dRIS value when the user’s participation helps in the rebalancing service.
(d)
The system recommends rebalancing the bike at the nearest station within Wd_max that satisfies both (a) and (b).
(e)
The user’s participation rate can be changed depending on the extra walking distance and the simulation is also stochastically performed according to the participation rate.
(2) 
Process
(1)
When the user (agent) accesses the station, the system determines whether the user is about to rent or return a bike.
(2)
The system calculates the distances (Wd) between the station and other stations.
(3)
For stations within the Wd_max range, the system calculates the dRIS value of the access station.
(4)
(Renting Bike) If stations meet the condition of (dRIS > incentive threshold), include the stations with the recommendable station list.
(5)
(Returning Bike) If stations meet the condition of (-dRIS > incentive threshold), include the stations with the recommendable station list.
(6)
The closest station in the recommendable station list is set as the retargeted station.
(7)
The system calculates the participation rate based on the retargeted station (0~1).
(8)
Depending on the participation rate, the users rent or return bikes at the retargeted station instead of at the accessed station.
(3) 
Code
  • //when the user accesses the station
    If the user’s purpose is to rent a bike:
      For other station in every station:
        Wd = distance between other station and accessed station
        If Wd <= Wd_max:
         dRIS = RIS of other station − RIS of accessed station
         If dRIS > Incentive threshold:
           recommendable station list.add(other station)
      If recommendable station list is not empty:
          retargeted station = closest in recommendable station list
          if random (0,1) < participation rate for retargeted station:
            Do rent a bike from the retargeted station
          else:
            Do rent a bike from the accessed station
          else:
            Do rent a bike from the accessed station
    Else if user’s purpose is returning:
      For other station in every station:
           Wd = distance between other station and accessed station
           If Wd <= Wd_max:
            dRIS = RIS of other station − RIS of accessed station
            If -dRIS > Incentive threshold :
              recommendable station list.add(other station)
      If the recommendable station list is not empty:
          retargeted station = closest in recommendable station list
          if random (0, 1) < participation rate for retargeted station:
            Do return the bike to the retargeted station
          else:
            Do return the bike to the accessed station
          else:
            Do return the bike to the accessed station

4. Implementation and Discussion

We conducted a series of two experiments to simulate the impact of the user participation-based rebalancing service with different combinations of the three parameters (ic, mp and Wd_max) in Seoul City. In experiment A, a survey of actual BSS users in Seoul City was conducted to find the appropriate levels of each parameter for user participation-based rebalancing. Experiment B was conducted to analyze the impact of user participation-based rebalancing with the actual parameter values of the city residents identified from the first experiment through a series of simulations. Ultimately, we determined whether it is possible to operate user participation-based rebalancing services with real-life budget and operating data from Seoul City.

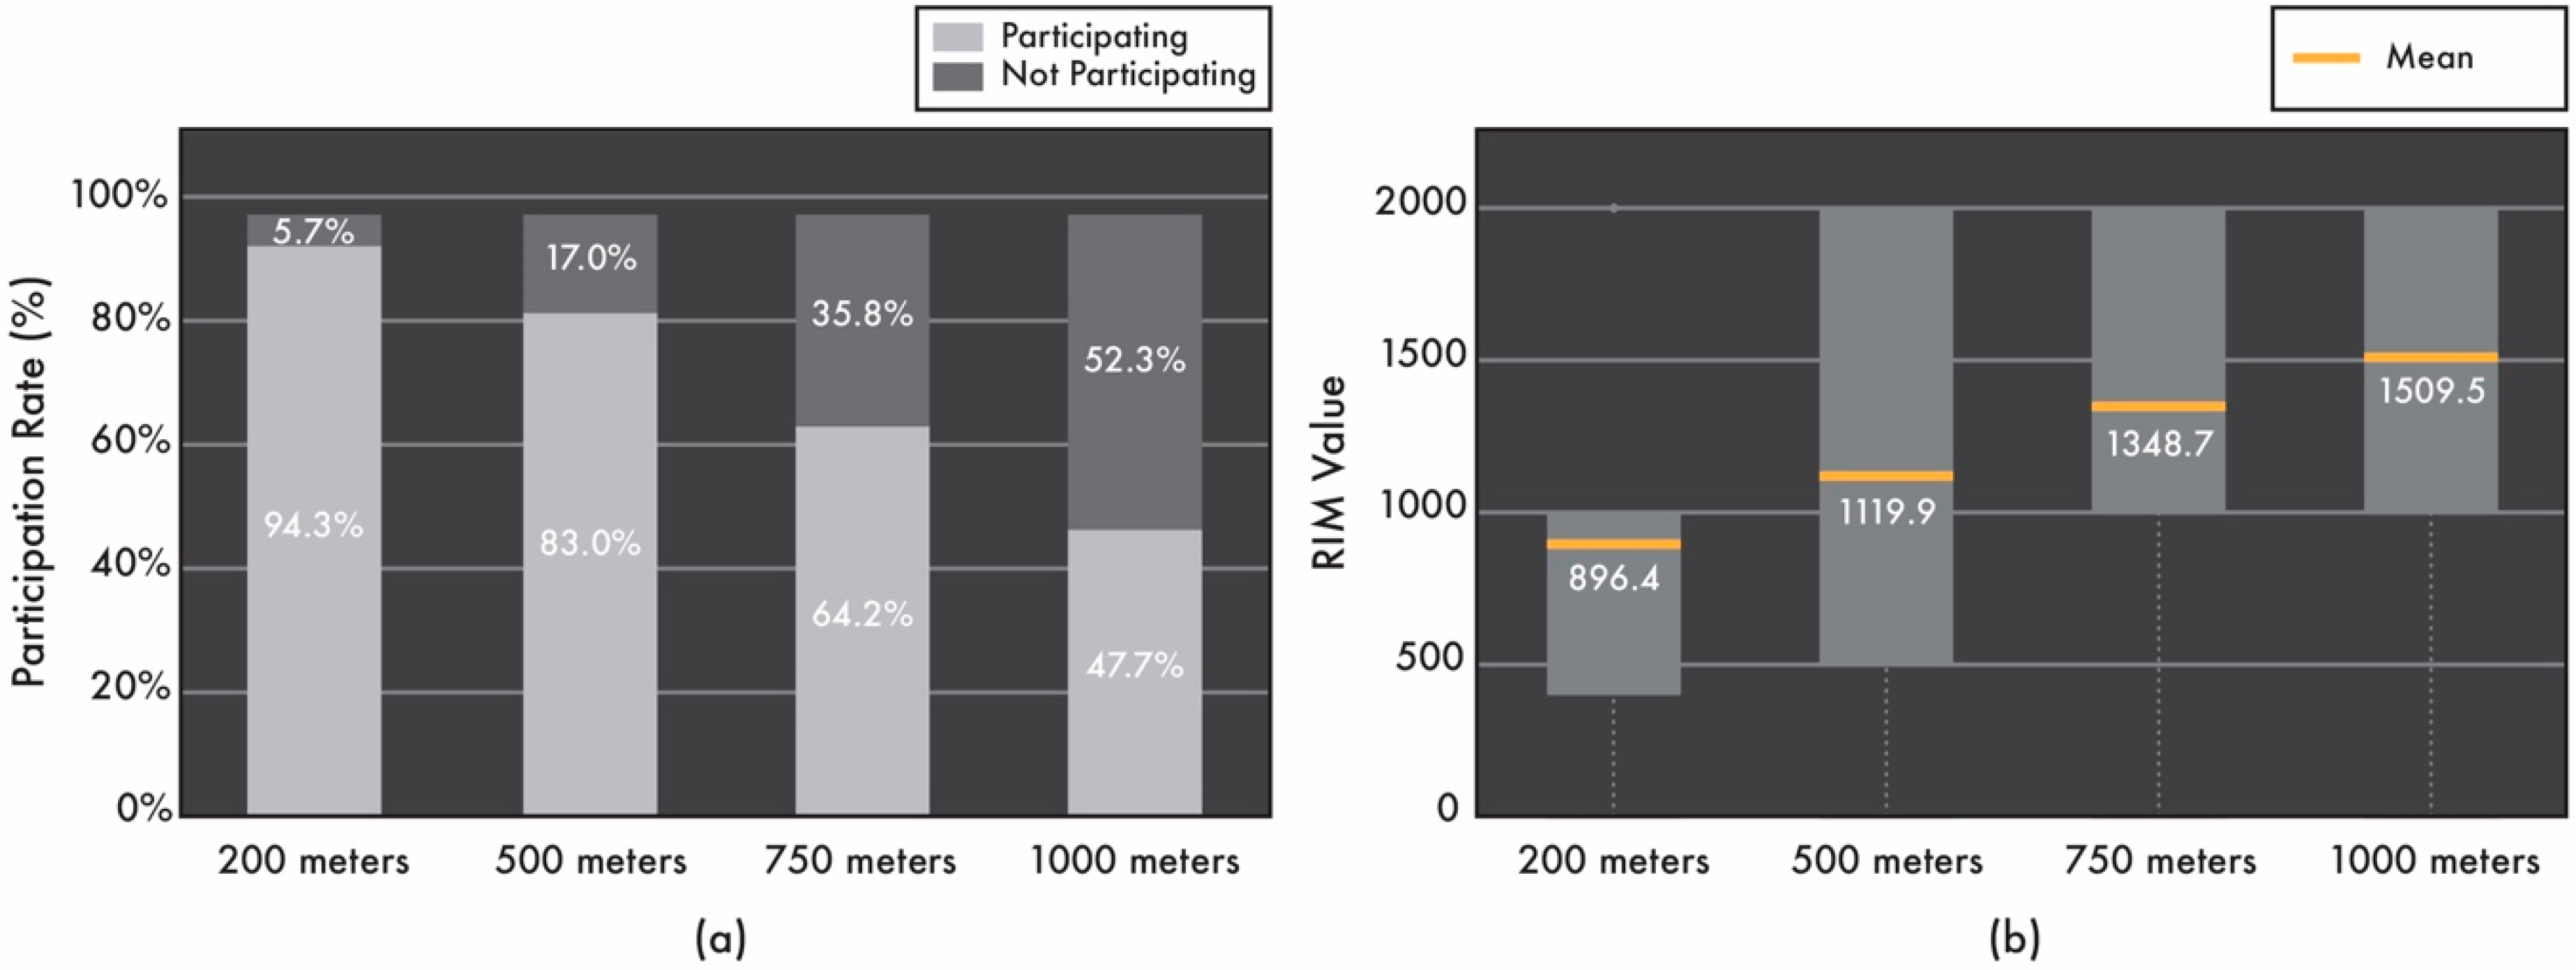
4.1. Experiment A: Incentive Survey

We conducted an experiment on human subjects to identify the incentive threshold to participate in a bike rebalancing service. The subjects were recruited from a pool of both students and residents near Seoul National University via e-mail and flyers. We recruited a total of 174 subjects (male = 90; female = 84) with an average age of 24.489 (min = 19; max = 35). The subject recruit result revealed that the user samples of BSS in a specific region of Seoul City are young. However, the Department of Public Bicycle Operation in Seoul City supports this result since 82.1% of the BSS user age in Seoul is between 10 to 30 [16]. The subjects came from various occupations that included students and professional workers. Each subject was asked to participate in the incentive threshold experiment. After that, a survey questionnaire on the primary uses of BSSs was provided to the subjects. An overall 55% of the subjects reported that they use the BSS for “leisure”, 27% for “transportation”, 8% for “exercise” and 10% did not provide a specific purpose. The subjects received payment for their participation. The incentive threshold experiment consisted of four questionnaires with different Wd_max (200 m; 500 m; 750 m; 1000 m) values with a corresponding image (Figure 4). The sample questionnaire is as follows: “You are going from station A to station C using a shared bike. If you choose route B, you will have to walk 200 m, but you will be given a monetary reward. Which of the following is the minimum monetary reward you must choose for route B?” Then the subjects were given 10 multiple choice options to select the minimum monetary reward (unit: Korean Won; “I can participate without rewards”, “50”, “100”, “200”, “300”, “400”, “500”, “1000”, “2000” and “I will not participate with the above rewards”). The subjects were familiar with the stimuli since the stimuli were created on the basis of an actual map near the Seoul National University subway station.
The result of the experiment indicated that the Wd_max (maximum extra walking distance) and amount of incentives are positively correlated (Figure 5a). The BSS users wanted more incentives if they traveled farther to rebalance the bike (Mean 200 m = 896.4; Mean 500 m = 1119.9; Mean 750 m = 1348.7; Mean 1000 m = 1509.5). We also identified that the extra travel distance and the rate of user-participation have a negative correlation (Figure 5b). The farther the extra walking distance, the more significant the reduction in the rate of user participation (200 m = 94.3%; 500 m = 83.0%; 750 m = 64.2%; 1000 m = 47.7%).

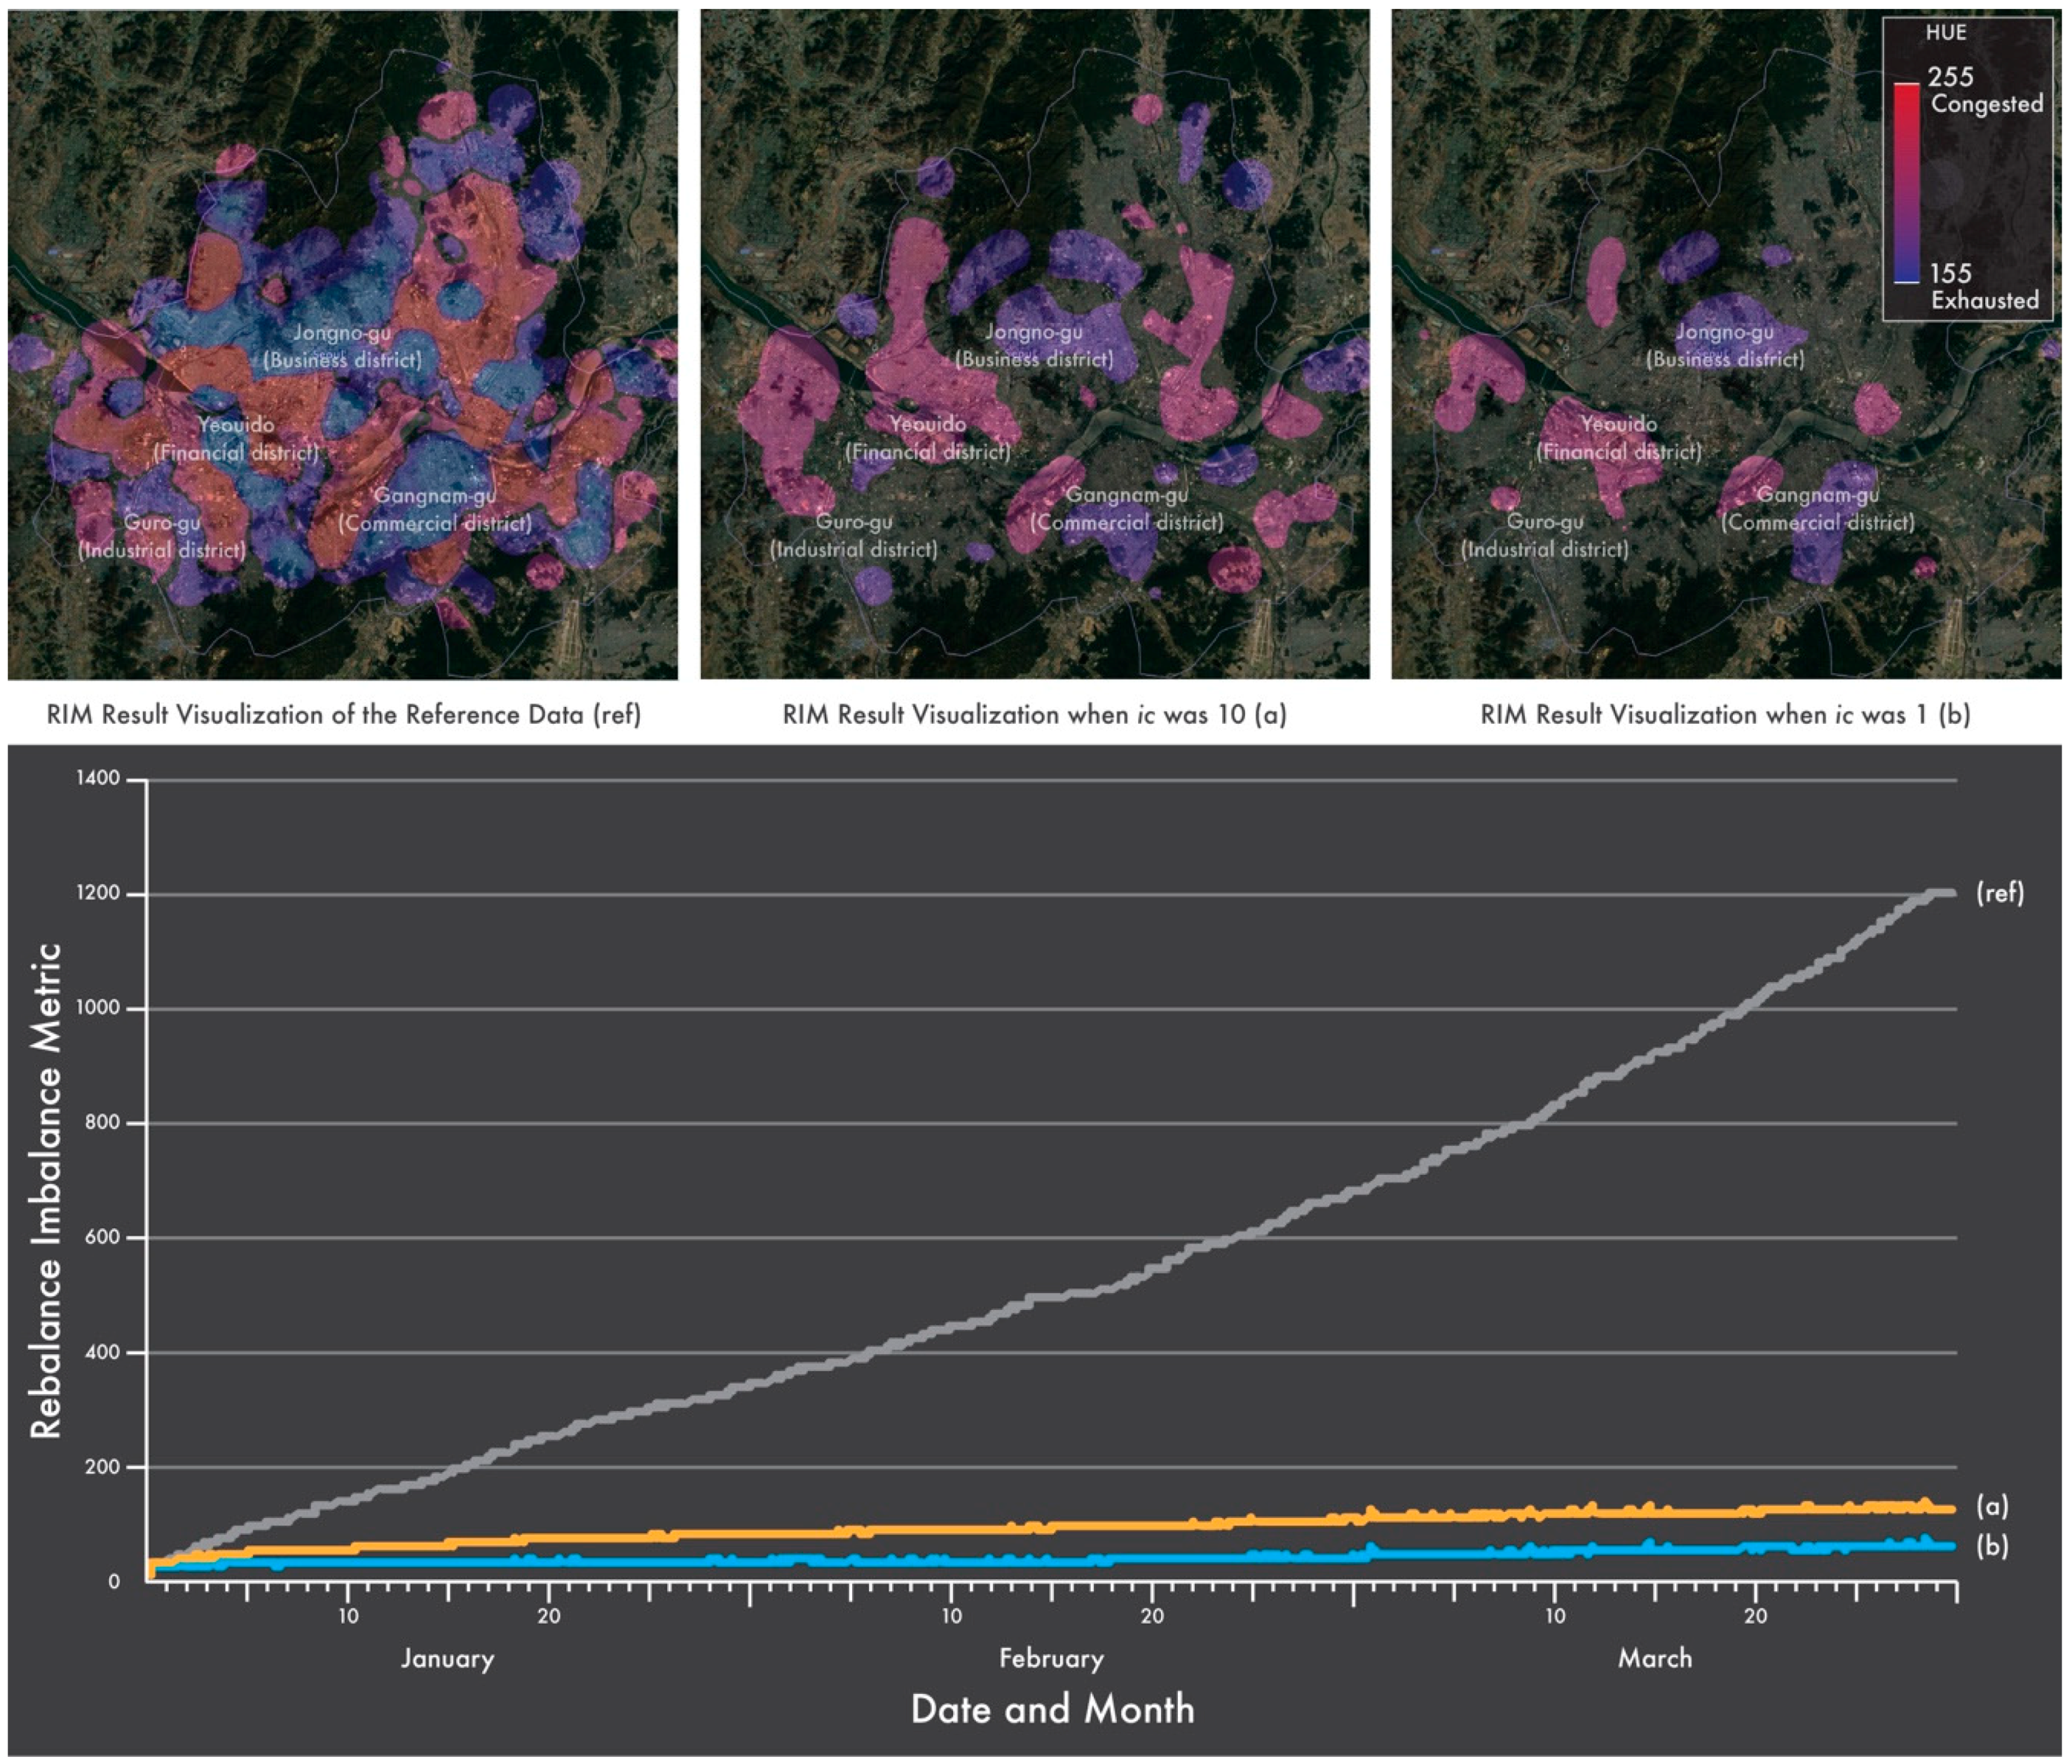
4.2. Experiment B: Service Optimization with the Actual Operating Budget

The result of experiment A indicated that Seoul City residents are willing to walk up to 1829 m if the appropriate incentive—2173.1 KRW, which is approximately 1.9 USD—is given. Every participant in the experiment responded saying that they would walk up to 154.9 m if an incentive of 738.3 KRW (approximately 0.7 USD) was provided. On the basis of the inference that there are participants who are satisfied with these conditions, we have simulated how well the bikes can be redistributed without the use of rebalancing trucks. To do that, we conducted a series of agent-based simulations with actual BSS usage data. We collected usage data of Seoul City’s BSS (from 2018.01.01 to 2018.03.31) through the city’s official database [17]. The usage data contain two data types: station data and trip data. The station data consist of the following: station ID; station address; location (longitude and latitude); and bike holding capacity. The trip data consists of the following: bike ID; rent date; rent station ID; rent station name; return date; return station ID; return station name; trip duration (in minutes); and trip distance (in m). We used a total of 784,735 observations for this study.
In the proposed system, the mp (maximum participation rate) and Wd_max (maximum extra walking distance) data that were collected from experiment A can be directly implemented into the simulation but the incentive threshold needs to undergo an additional data modification process. In the proposed system, the incentive is calculated on the basis of the RIS with neighboring stations. This is because a conversion between the incentive value and the real currency is necessary. The system sets the agents to move only when the RIS difference is greater than a certain amount and adjusts the exchange rate between the incentive and the real currency. In this experiment, we first compared the difference in performance when the incentive coefficient (ic) was 1.0 and 10.0. ic is a parameter for determining the influence of rebalancing service at the station level. Thus, the simulation with a higher ic value input will selectively offer incentives only when the rebalancing service at a specific station is more impactful from among the bike rebalancing services across the city.
The result of the simulation shows that the proposed system can successfully maintain low RIM values for three months (Figure 6). Both simulations with ic value 1.0 and ic value 10.0 can balance bikes significantly better than the actual bike usage of Seoul City (reference data). The RIM value after three months is 1201.0 for the reference data and the RIM value is 48.4 and 109.8 when ic is 1.0 (Figure 6b) and 10.0 (Figure 6a), respectively. When the ic is low, the system enables agents to participate with low dRIS values, thus inviting more service participants. However, a higher ic indicates a more selective tendency to offer the service by suggesting it only in stations with high dRIS. We also recorded how far the agents traveled in the simulation and how much incentive the agents received. As illustrated in Table 3, both the simulation results with ic value of 1.0 and ic value of 10.0 received incentives of about 600 KRW (approximately 0.5 USD) for an average distance of 500 to 600 m (about 10 min on foot). Despite increasing the ic parameter by 10 times, the simulation demonstrated the capability of identifying and responding to urgent stations for bike rebalancing. Thus, while a user participation-based rebalancing service with an increased ic can perform as well as a service with a low ic, it requires less average incentive payments (Table 3).
Next, we substituted the incentive survey results as a parameter for the simulation. The result of the simulation showed that when the ic was 1.0, the operation cost was an estimated 0.4M USD; it was 0.2M USD when the ic was 10.0 (Table 4). The operating budget of the BSS in Seoul City is approximately 4 million USD per year [9]. Thus, the budget estimation of the simulation with 3-month data is within the city’s annual budget and thus user participation-based rebalancing can be implemented in real-life.
The simulation was based on the incentive survey results of the actual BSS users with 174 participants. However, in a real-life situation, it is possible that users may not walk a long distance because of low participation rates and the amount of incentives. Still, the simulation was conducted to ascertain how well the service can work with the current ic, mp and Wd_max values.
We also analyzed how the three parameters affect the performance of the service. To do so, we conducted a series of simulations with different combinations of the parameters and evaluated their performances. Figure 7 illustrates the simulation results of the reference data and the two clusters of simulation results. The six results in cluster B (Figure 7e~j) share Wd_max of 1000 m and the four results in cluster A (Figure 7a~d) share Wd_max of 2000 m. The simulation results revealed that the agents’ average travel distance was between 400 and 600 m in the both Wd_max of 1000 and 2000 m’ cases. A lower Wd_max means that people are reluctant to walk long distances, which leads to a lower participation rate and a rise in RIM values. The parameter of the two simulation results of the highest RIM value for both cluster A (Figure 7a,b) and cluster B (Figure 7e,f), the mp parameter, was set at 0.5, so that only up to 50% of the agents participated in the rebalancing service.
We also tested whether the service works well when the Wd_max is set to 1000 m and the participation rate is fixed to a constant. Figure 8 shows the graph when the Wd_max is set to 1000 m and the participation rate is fixed at a constant of 0.1 (Figure 8a), 0.2 (Figure 8b), 0.3 (Figure 8c) and 0.4 (Figure 8d), regardless of distance. In the case of a participation rate of 20% or more, the RIM values are relatively stable at about 100–150. Thus, the participation rate of the service will not lead to a rapid decrease in the bike balance even if the Wd_max is low. Thus, we identified that the Wd_max is the most influential parameter that affects the performance of the bike rebalancing service. Since the major target audience for shared bikes in Seoul City are people who care about leisure and health, walking about 1000 m (about 15 min on foot) is an acceptable distance for extra travel.

5. Conclusions

BSS has been globally adopted as a sustainable transportation system that helps to improve air pollution, public health and traffic congestion. The increased usage of BSSs requires an increased number of rebalancing trucks that are necessary to distribute bikes throughout the city. Operation of rebalancing trucks is an expensive venture that requires intensive manpower. It is also sensitive to traffic congestions. In light of this, a user participation-based rebalancing service was introduced to solve the problem but it was difficult to test the impact of the service and its estimated cost in the city. Thus, this research proposes a simulation system that tests user participation-based rebalancing services with different user parameters such as the amount of incentives, the user participation rate and extra walking distances. We conducted an incentive survey on actual BSS users to determine the accurate values of these parameters. We also identified that, among the three parameters, the extra walking distance is the most influential element on which to improve the RIM. We found that the incentive coefficient is an important variable in determining the estimated cost of the service. Thus, cities can utilize the proposed system to balance the parameters to design a user participation-based rebalancing service that is suitable to their city. The simulation results of the proposed system showed that the bike can be rebalanced well with the user participation-based rebalancing service. According to the appropriation budget of Seoul City, a total of 3.6M US dollars were spent on general operating expenses, including truck maintenance costs for the BSS [9]. The total estimated cost of the service of the optimal RIM result was 0.2M US dollars for three months. The cost may increase during the summer because of increased BSS usage but the year-long estimated cost of service will be cheaper than the current appropriation budget of Seoul City. In addition to the financial benefits, the user participation-based rebalancing service provides sustainable benefits as well. According to Lee et al [18], 1 liter of diesel emits 2.6 kg of carbon dioxide (CO2) and the efficiency of a 1-ton truck is 7.5 kilometers per liter, resulting in 0.34 kg of CO2 per kilometer. Assuming that 36 1-ton trucks travel about 200 km a day for 24 h, 900 tons of CO2 are generated annually. Compared to the truck-based rebalancing service, the user participation-based rebalancing service is significantly more environmentally friendly, while also encouraging a healthy atmosphere for exercise. It also functions as a welfare benefit by being returned to bike service users whose budgets are readily available to everyone. Thus, Seoul City can benefit from the user participation-based rebalancing service.
We identified important research areas during the study. First, the size of the city can be an important factor in the user participation-based rebalancing service. BSSs can be influential in smaller cities when the public transportation system is not as developed as in metropolitan cities. Furthermore, bike riding activities are strongly connected to urban atmospheres with compact urban forms and safe cycling environments [19]. Thus, research on the relationship between city size and user participation-based rebalancing service can expand our knowledge on bike rebalancing. Second, there are different types of BSSs, including the station-based system and the dockless system. The users of the station-based system can rent and return bikes from preinstalled stations and users of the dockless system can pick up any visible bike and place it anywhere they desire. Despite the different types of systems, BSSs will require a rebalancing method. Thus, it is important to analyze the impact of a user participation-based rebalancing system in various BSS types. Lastly, applying the proposed system to a real-world case can be a significant contribution to both the academic and professional fields. We are planning to use the simulation results in a small area of Seoul City as a test bed to improve the accuracy of the system.

Author Contributions

Conceptualization, S.B. and K.H.H.; Data curation, S.B. and K.H.H.; Formal analysis, S.B. and K.H.H.; Funding acquisition, K.H.H.; Investigation, K.H.H.; Methodology, K.H.H.; Project administration, K.H.H.; Resources, K.H.H.; Software, S.B.; Supervision, K.H.H.; Validation, S.B. and K.H.H.; Visualization, S.B. and K.H.H.; Writing—original draft, K.H.H.; Writing—review & editing, S.B. and K.H.H.

Funding

This work was supported by the National Research Foundation of Korea (NRF) grant funded by the Korea government (MSIP; Ministry of Science, ICT & Future Planning) (NRF-2017R1C1B5018240).

Conflicts of Interest

The authors declare no conflict of interest.

References

  1. Pal, A.; Zhang, Y. Free-floating bike sharing: Solving Real-Life Large-Scale Static Rebalancing Problems. Transp. Res. Part C Emerg. Technol. 2017, 80, 92–116. [Google Scholar] [CrossRef]
  2. Wang, J.; Huang, J.; Dunford, M. Rethinking the Utility of Public Bicycles: The Development and Challenges of Station-Less Bike Sharing in China. Sustainability 2019, 11, 1539. [Google Scholar] [CrossRef]
  3. Conticelli, E.; Santangelo, A.S.; Tondelli, S. Innovations in Cycling Mobility for Sustainable Cities. In Town and Infrastructure Planning for Safety and Urban Quality, Proceedings of the XXIII International Conference on Living and Walking in Cities (LWC 2017), Brescia, Italy, 15–16 June 2017; CRC Press: Boca Raton, FL, USA, 2018. [Google Scholar]
  4. Yang, T.; Li, Y.; Zhou, S. System Dynamics Modeling of Dockless Bike-Sharing Program Operations: A Case Study of Mobike in Beijing, China. Sustainability 2019, 11, 1601. [Google Scholar] [CrossRef]
  5. O’Brien, O. Social Benefits from Public Bike Share Data 2017. Available online: http://oobrien.com/2017/10/social-benefits-from-public-bike-share-data/ (accessed on 22 March 2019).
  6. Public Bicycle Acquisition Group. Acquisition and Operation of Public Bicycles. Seoul Facilities Corporation 2015. Available online: https://www.sisul.or.kr/open_content/main/bbs/bbsMsgFileDown.do;jsessionid=yxaEIPciDr0UK085qnD5lTNxFwLWu8RFl7RQaZLXzv5Y0OcyQv0FU1qBZp0MNasT.etisw2_servlet_user?bcd=meetingdoc&msg_seq=65&fileno=1 (accessed on 5 November 2018).
  7. VCÖ. VCÖ: Austria’s Cities Have to Catch up in Cycling Compared to other EU Countries 2016. Available online: https://www.vcoe.at/news/details/vcoe-oesterreichs-staedte-haben-beim-radverkehr-im-eu-vergleich-aufzuholen (accessed on 17 April 2019).
  8. Lee, G.; Jeong, Y.; Kim, S. Impact of Individual Traits, Urban Form and Urban Character on Selecting Cars as Transportation Mode Using the Hierarchical Generalized Linear Model. J. Asian Archit. Build. Eng. 2016, 15, 223–230. [Google Scholar] [CrossRef]
  9. Department of Public Bicycle Operation. Public Bicycle Status. Seoul Facilities Corporation 2018. Available online: https://www.sisul.or.kr/open_content/main/bbs/bbsMsgDetail.do?bcd=branchbiz&msg_seq=731&FILE_CONTEXT=&FILE_NAME=&ORG_FILE_NAME= (accessed on 25 March 2019).
  10. Regue, R.; Recker, W. Proactive Vehicle Routing with Inferred Demand to Solve the Bikesharing Rebalancing Problem. Transp. Res. E Logist. Transp. Rev. 2014, 72, 192–209. [Google Scholar] [CrossRef]
  11. Whitehead, J. Bologna: The City That Rewards You with Free Beer and Ice Cream for Riding Your Bike. Independent. Available online: https://www.independent.co.uk/travel/news-and-advice/bologna-bike-riding-free-beer-ice-cream-cycling-cinema-tickets-italy-sustainable-travel-a8618756.html (accessed on 20 March 2019).
  12. Pfrommer, J.; Warrington, J.; Schildbach, G.; Morari, M. Dynamic vehicle redistribution and online price incentives in shared mobility systems. IEEE Trans. Intell. Transp. Syst. 2014, 15, 1567–1578. [Google Scholar] [CrossRef]
  13. Singla, A.; Santoni, M.; Bartók, G.; Mukerji, P.; Meenen, M.; Krause, A. Incentivizing Users for Balancing Bike Sharing Systems; AAAI: Menlo Park, CA, USA, 2015. [Google Scholar]
  14. Chung, H.; Freund, D.; Shmoys, D.B. Bike Angels: An analysis of Citi Bike’s incentive program. In Proceedings of the 1st ACM SIGCAS Conference on Computing and Sustainable Societies, Menlo Park and San Jose, CA, USA, 20–22 June 2018; ACM: New York, NY, USA, 2018. [Google Scholar]
  15. Ban, S.; Hyun, K.H. Curvature-based distribution algorithm: Rebalancing bike-sharing system with agent-based simulation. J. Visual. 2018, 1–22. [Google Scholar] [CrossRef]
  16. Department of Public Bicycle Operation. Public Bicycle Status. Seoul Facilities Corporation 2016. Available online: https://www.sisul.or.kr/open_content/main/bbs/bbsMsgFileDown.do;jsessionid=VRqzREqCA8UB5jm0oxwhNMmX4TBZuJCm6fP1utqYDTTXJDtpgeaRdzc9blvcRixc.etisw1_servlet_user?bcd=branchbiz&msg_seq=473&fileno=1 (accessed on 16 April 2019).
  17. Seoul Data. Available online: http://Data.seoul.go.kr. (accessed on 12 January 2019).
  18. Lee, K.; Chae, J.; Kim, J. A Courier Service with Electric Bicycles in an Urban Area: The Case in Seoul. Sustainability 2019, 11, 1255. [Google Scholar] [CrossRef]
  19. Zhang, Y.; Li, C.; Ding, C.; Zhao, C.; Huang, J. The built environment and the frequency of cycling trips by urban elderly: Insights from Zhongshan, China. J. Asian Archit. Build. Eng. 2016, 15, 511–518. [Google Scholar] [CrossRef]
Figure 1. Bicycle distribution visualization focusing on major business districts in Seoul City (red indicates bike congestion; blue indicates bike exhaustion).
Sustainability 11 02396 g001
Figure 2. The Rebalancing Strategy Research Tree as reinterpreted from Pal and Zhang [1].
Sustainability 11 02396 g002
Figure 3. Conceptual framework for the user participation-based rebalancing simulation system.
Sustainability 11 02396 g003
Figure 4. Stimuli for 200 m distance (red indicates incentivized route B; purple indicates the shortest path to the target station).
Sustainability 11 02396 g004
Figure 5. Correlation between participation rate and distance (a); correlation between distance and the incentive threshold (b).
Sustainability 11 02396 g005
Figure 6. Rebalance imbalance metric (RIM) value differences per simulation results: (ref) RIM result with the reference data; (a) RIM results when ic was 10; (b) RIM results when ic was 1.
Sustainability 11 02396 g006
Figure 7. Simulation results of different combinations of the three parameters (mp, ic and Wd_max): (a) 0.5, 10, 1000; (b) 0.5, 1, 1000; (c) 1, 1, 1000; (d) 1, 10, 1000; (e) 0.5, 10, 2000; (f) 0.5, 1, 2000; (g) user_ survey_result with ic = 10; (h) 1, 10, 2000; (i) user_survey_result with ic = 1; (j) 1, 1, 2000.
Sustainability 11 02396 g007
Figure 8. Simulation results of the constant participation rate with Wd_max = 1000, ic = 1 and fixed participant rate: (a) 0.1; (b) 0.2; (c) 0.3; (d) 0.4.
Sustainability 11 02396 g008
Table 1. Proportion of bike usage among transportation modes per city with over 500,000 inhabitants [6,7].
Seoul,
Korea
Copenhagen,
Denmark
Amsterdam,
Netherlands
Munich,
Germany
Antwerp,
Belgium
Helsinki,
Finland
Bike Usage Rate2.5%30%32%14%23%11%
Table 2. Parameters for the Simulation System.
ParametersNotation
dRISSubtraction of RIS between stations
WdExtra walking distance
Wd_maxMaximum extra walking distance
icIncentive coefficient
mpMaximum participation rate
Incentive thresholdic * (Wd/Wd_max)
Participation ratemp * (Wd_max- Wd)/Wd_max
Table 3. Operating budget and simulation results.
Simulation A
(ic = 1)
Simulation B
(ic = 10)
Reference Data
Average RIM27.378.9529.6
Average Travel Distance (meter)564.9513.8
Average Incentive Payments (KRW)671.5589.0
(0.6 USD)(0.5)
Total Incentive Payments (KRW)513,820,168.8
(452,637.0 USD)
255,188,788.3
(224,802.2 USD)
1,284,750,000
(1,131,768.4 USD)
Table 4. Simulation results of Experiment B.
(ic = 1)(ic = 10)
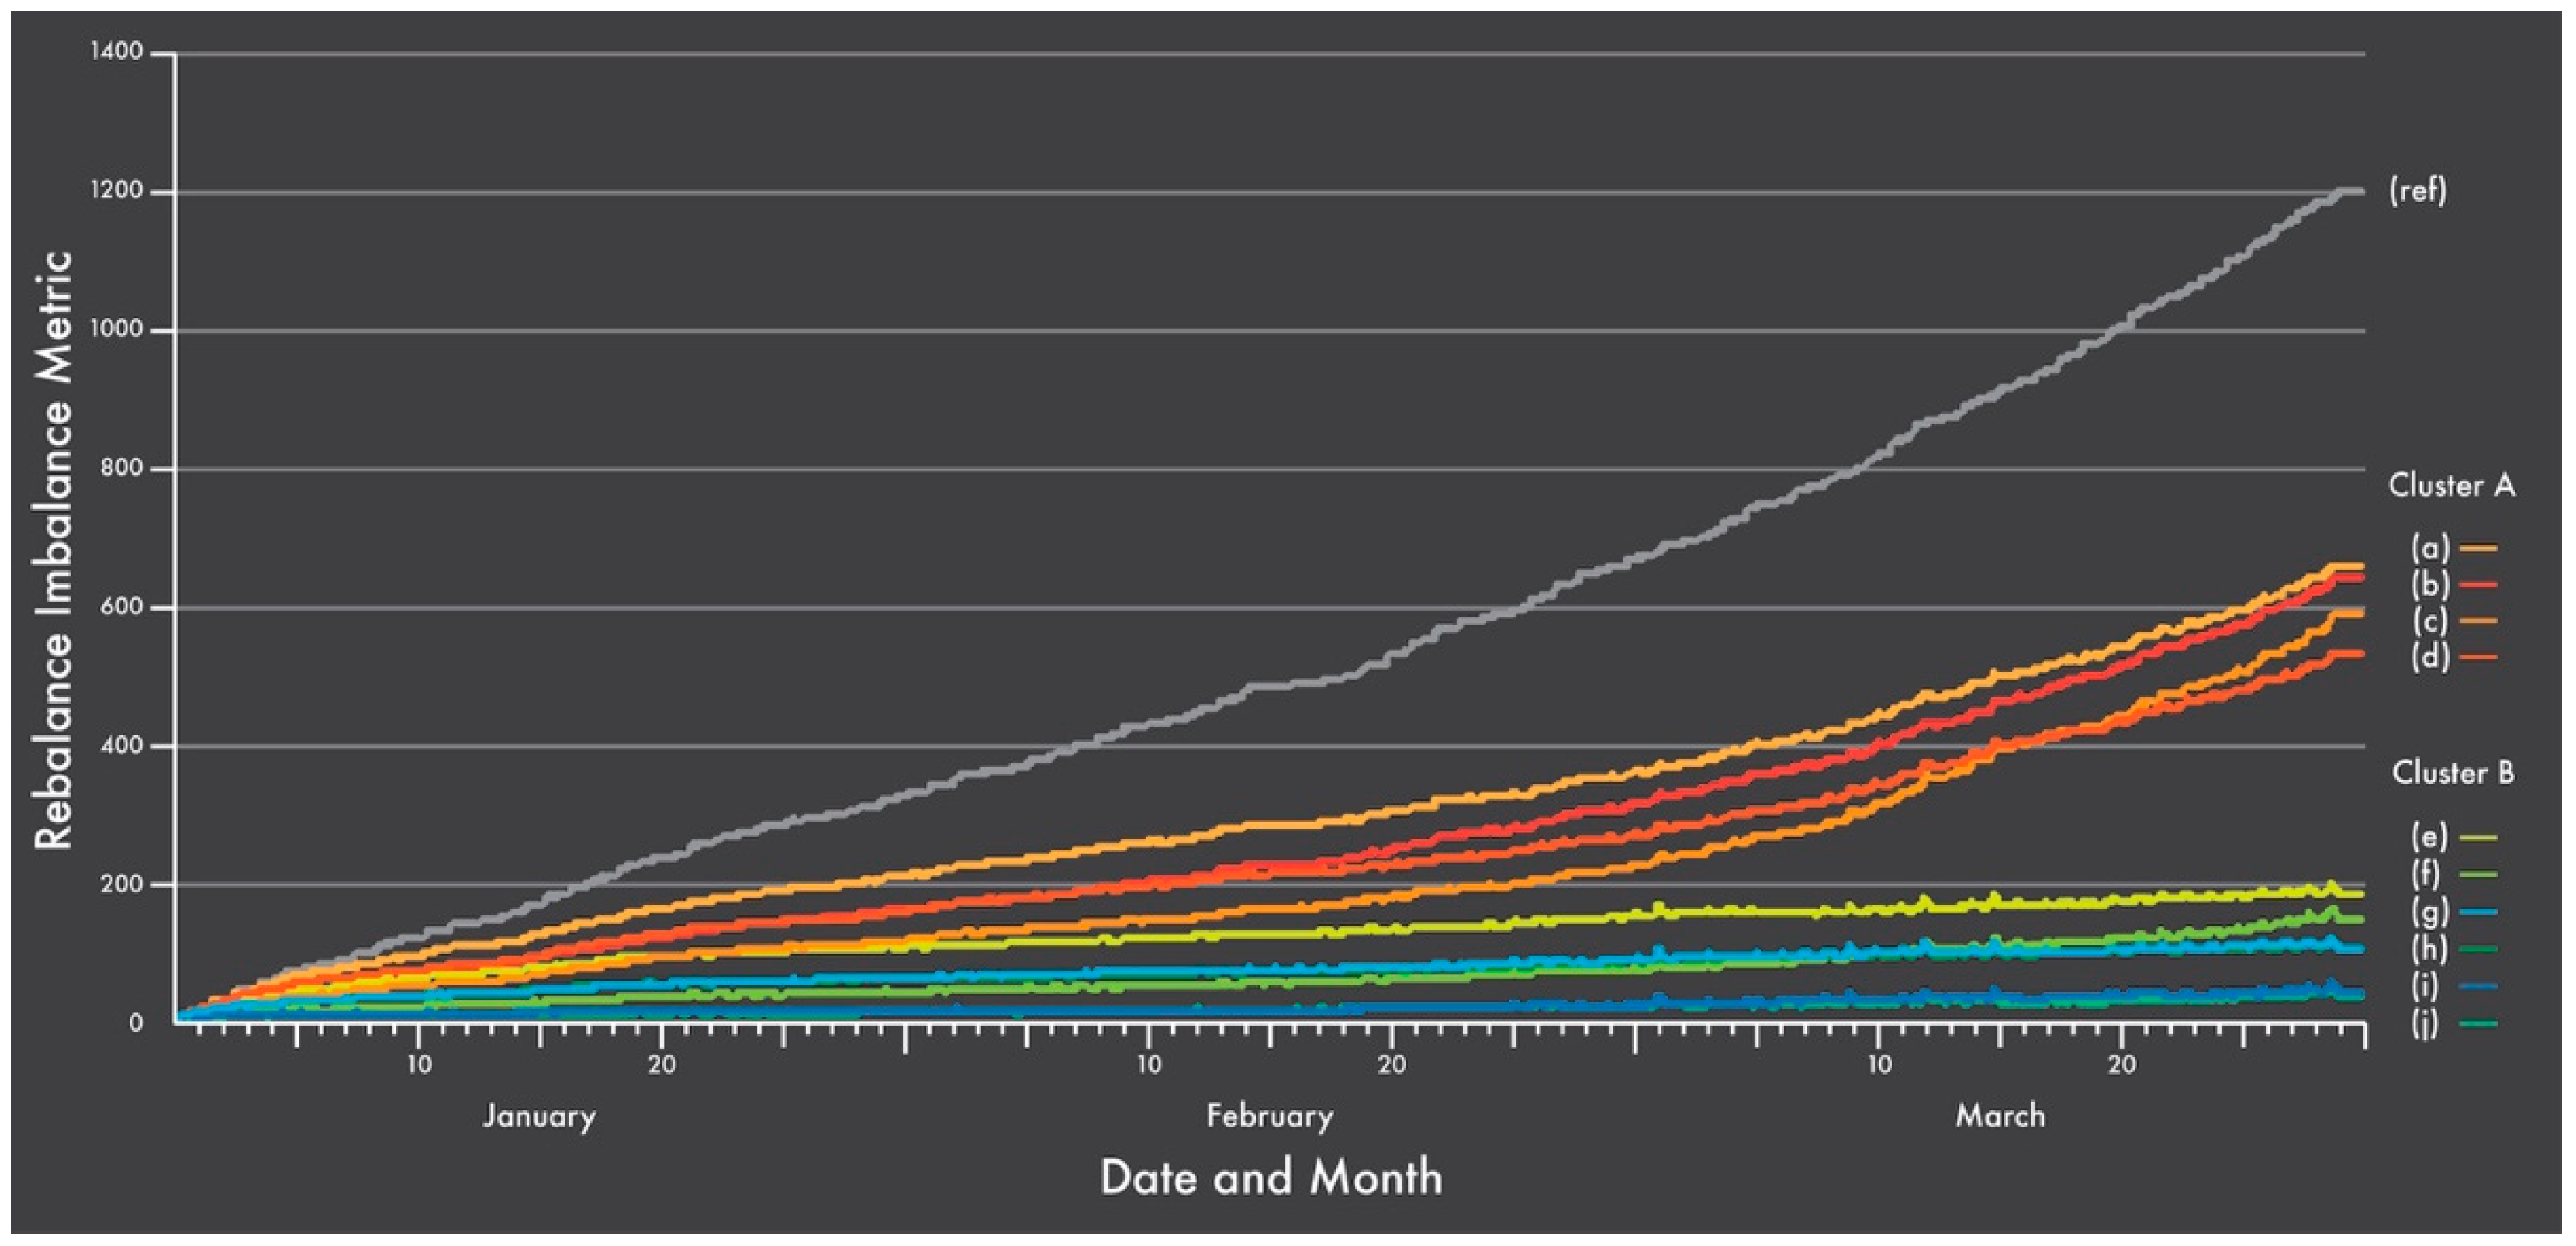
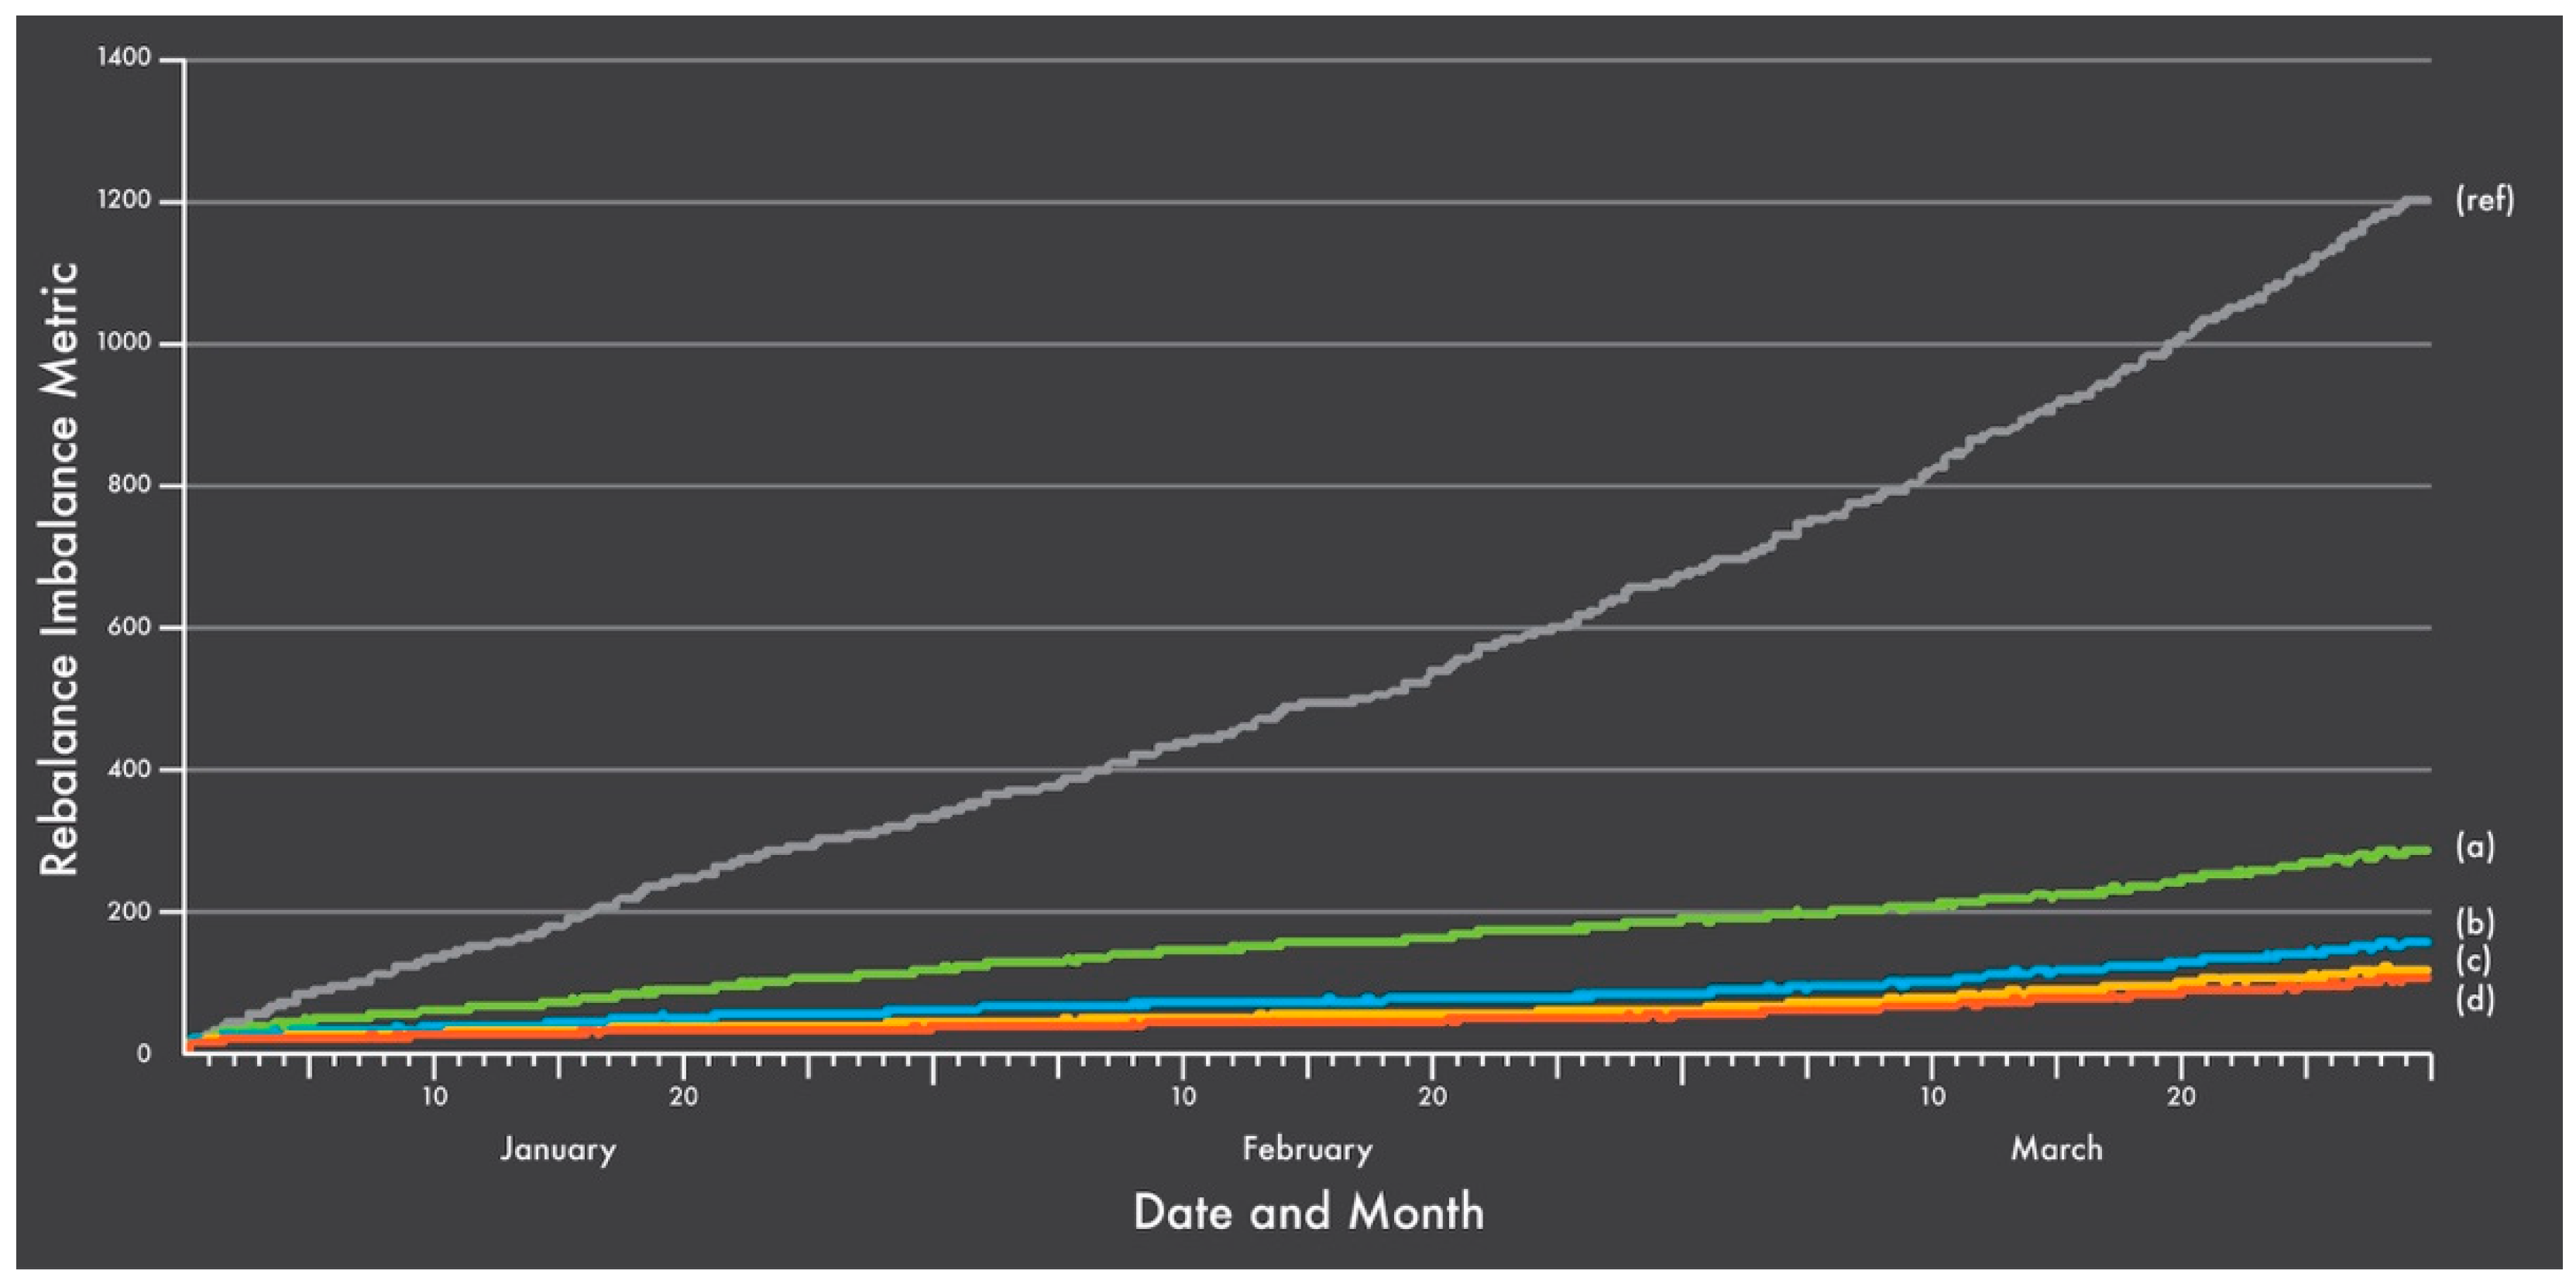
Average RIM (Rebalance Imbalance Metric)Ref529.6
Wd_max1000266.3305.7(mp = 0.5)
212.2238.7(mp = 1)
200070.4128.5(mp = 0.5)
24.977.6(mp = 1)
Survey based27.378.9
Average Travel Distance (meter)Wd_max1000454.8445.2(mp = 0.5)
452.9442.6(mp = 1)
2000626.3559.1(mp = 0.5)
584.5524.2(mp = 1)
Survey based564.9513.8
Average Incentive Payments (USD)Wd_max10000.90.9(mp = 0.5)
0.90.9(mp = 1)
20000.60.5(mp = 0.5)
0.60.5(mp = 1)
Survey based0.60.5
Total Incentive Payments (USD)Wd_max1000176.5 k (15.6%)137.1 k (12.1%)(mp = 0.5)
333.9 k (29.5%)220.2 k (19.4%)(mp = 1)
2000209.2 k (18.5%)113.6 k (11.8%)(mp = 0.5)
419.8 k (37.1%)211.0 k (18.6%)(mp = 1)
Survey based453.1 k (40.0%)225.1 k (19.9%)

