Article

Avian Influenza, Public Opinion, and Risk Spillover: Measurement, Theory, and Evidence from China’s Broiler Market

1
College of Economics & Management, Huazhong Agricultural University, Wuhan 430070, China
2
Hubei Rural Development Research Center, Huazhong Agricultural University, Wuhan 430070, China
*
Author to whom correspondence should be addressed.
Sustainability 2019, 11(8), 2358; https://doi.org/10.3390/su11082358
Submission received: 24 March 2019 / Revised: 10 April 2019 / Accepted: 17 April 2019 / Published: 19 April 2019
(This article belongs to the Section Sustainable Agriculture)

Abstract

:
Animal disease is a major threat to the sustainability of the global livestock market. We explore the price risk spillover of avian influenza to the broiler market, from the perspective of public opinion. Unlike in previous work, where avian influenza is measured as a whole, we decompose an avian influenza epidemic into avian influenza outbreak and public opinion, measured by infection cases and Baidu and Google search volume. Theoretically, by introducing the theory of limited attention and two-step flow of communication, we develop an analytical framework to capture the causal mechanism of avian influenza outbreak, public opinion, and broiler price risk spillover, arguing that it is actually public opinion, not avian influenza outbreak alone, that directly causes broiler price risk. Empirically, using a long panel from China spanning from November 2004–November 2017, we examine the causal mechanism and analyse the nonlinear spatial spillover of public opinion to broiler price risk. We find that: (i) neither poultry nor human infection with avian influenza outbreak has a significant spillover to broiler price; (ii) on average, public opinion has a negative spillover to broiler price; in general, spillover of public opinion to broiler price is inverse U-shaped; (iii) on average, public opinion has a negative direct effect on local broiler price and a three times larger negative spatial spillover effect on nearby broiler price; in general, direct and spatial spillover effects are inverse U-shaped. Our research highlights the importance of studying public opinion in amplifying price risk when analysing spillover of animal disease to the global livestock market.

1. Introduction

Since the beginning of the new century, there has been a constant outbreak of major epidemic animal diseases around the world, such as avian influenza in East Asia in 2004 [1,2], swine flu (H1N1) in North America in 2009 [3] and African swine fever in 2018 [4], which pose a major threat to the sustainability of global livestock and poultry industry safety, food quality safety and public health safety [5].
Prices in the global poultry market fluctuate greatly and frequently, which means every link of the poultry industry chain face great risks [6,7,8,9]. Avian influenza epidemic is the main cause of price fluctuation in poultry industry chain [10,11,12]: (i) in the short-run, when avian influenza epidemic breaks out, the market demand of poultry products becomes insufficient and the market price of poultry drops sharply, resulting in short-run negative price pressure; (ii) while in the long-run, after avian influenza epidemic, the market demand of poultry products recovers and the market price of poultry rises in retaliation, forming a long-run price reversal; (iii) therefore, in general, the market price of poultry tends to be V-shaped [13].
Public opinion in the era of big data makes global incidents easier for the public to pay attention to and enlarges the impact of incidents [14]. The rapid spread of epidemic information in the full glare of news and social media brings about drastic fluctuations in market prices of poultry products and seriously hinders the sustainable development of global poultry industry [15]. The price risk spillover of an avian influenza epidemic along with public opinion to the poultry market in the age of big data deserves the special attention of global academia and authorities.
In recent years, global researchers have shown an increased interest in the spillover of an avian influenza epidemic to poultry price risk, where we restrict our attention to the literature on the measurement, theory and empirical analysis of the price risk spillover of avian influenza to the global poultry market, which will be discussed below.
First, in measurement, there are two types of indicators of an avian influenza epidemic—objective indicators and subjective indicators: (i) Objective indicators: Huang and Wang [16] use no. of avian influenza cases to evaluate the economic impact of an avian influenza epidemic on broiler industry in China; Liu and Lu [17] use no. of poultry destroyed to analyse farmers’ productive recovery behaviour in avian-infected area under the shocks of avian influenza; and Zhou and Liu [18] use dummies for poultry infection and human infection with avian influenza cases, respectively, to analyse vertical and horizontal transmission of broiler industry price under avian influenza risk; (ii) Subjective indicators: Hassouneh et al. [12] use the avian influenza food scare information index to reflect consumer awareness of the crisis, so as to analyse the impact of an avian influenza epidemic on vertical price transmission in the Egyptian poultry sector; Mutlu, Serra and Gil [19] use an avian influenza information index variable to determine regime-switching, so as to analyse the vertical price transmission in the Turkish poultry market under an avian influenza epidemic; Zheng and Ma [20] use the Baidu index to reflect variance and intensity of the epidemic, so as to analyse the dynamic impacts of avian influenza on livestock and poultry prices based on the TVP-VAR model. However, the prior literature in measurement typically measures avian influenza epidemic simply as a whole and does not distinguish between its components (i.e., avian influenza outbreak and public opinion), which may overestimate the impact of avian influenza outbreak and underestimate the impact of public opinion.
Second, in theory, the existing literature focuses mainly on consumers’ risk perceptions and behavioural biases. (i) Wang, Weldegebriel and Rayner [21] maintain that the herding effect of the decline in consumer confidence and purchasing behaviour triggers panic in the broiler market and the lack of market demand leads to the decline of broiler market prices; (ii) Turvey et al. [22] maintain that consumers’ risk perception [23] of an avian influenza epidemic and the panic emotion it brings have a significant impact on consumers’ behaviour; consumers’ perception is largely guided by consumers’ emotion and the panic emotion will not be eliminated immediately after avian influenza epidemic is relieved; (iii) Zhou and Liu [18] maintain that the occurrence of avian influenza enhances consumers’ risk perception of purchasing broiler products, which directly affects consumers’ purchase confidence; (iv) Zhou et al. [24] maintain that under the risk of an avian influenza epidemic, panic over the spread of avian influenza and distrust of the government aggravate the deviation between consumers’ behaviour and willingness to pay; any information about avian influenza epidemic, whether positive or negative, worsens consumers’ behaviour and risk perception. However, the prior literature in theory typically characterizes the price risk spillover of an avian influenza epidemic to poultry market with the risk perceptions and behavioural biases of individual consumers and does not take into account the clustering of consumers’ opinion (i.e., public opinion), which may not explain well the sharp decline in poultry price right after intensive news and social media coverage.
Finally, with empirical analysis, previous studies focus mainly on market supply and demand and price transmission and some preliminary studies relate to spatial relationships: (i) Market supply and demand—Huang, Dong and Wang [25] analyse the impact of an avian influenza epidemic on poultry farming and farmers’ income in 2004 by developing a farmer’s income model for livestock and poultry production, who found that an avian influenza epidemic lowered poultry price by 10% in 2004; based on the investigation of Korean meat market, Park, Jin and Bessler [26] found that foot-and-mouth disease causes the purchase, wholesale and retail prices of pork and beef to fall in varying degrees, while the prices of all sectors of the broiler market rise; they also found that avian influenza epidemic and mad cow disease cause the prices of all sectors of the pork market to continue to rise, while the prices of broiler and beef markets fall in varying degrees; (ii) Price transmission: using VAR model, Liu and Lu [27] found that the negative impact of an avian influenza epidemic on egg price in Xinjiang lasts for one year, increases gradually after one month, reaches the maximum in the fifth month after the outbreak and decreases gradually after five months and the price of eggs returns to stable after 10 months; using the X-12 seasonal adjustment method, Dai, Hu and Yu [28] found that incidents such as avian influenza epidemic lead to a sharp drop in the price of broilers, loss of farming and stagnation of feeding; when the epidemic is lifted, demand gradually recovers and supply gap emerges and the price of broiler rises sharply after a sharp fall; (iii) Spatial relationships: Using correlation and Granger causality test, Zhou and Liu [18] maintain that broiler price is autocorrelated among provinces in China; using probit regressions, Liu and Ying [29] found that the impact of avian influenza on poultry households exhibits spatial heterogeneity. However, the prior literature in empirical analysis typically uses cross-sectional data or single regional time-series data to characterize the price variation, price fluctuation and price transmission, which may potentially suffer from omitted variable bias and cannot capture the spatial relationships between areas; although some preliminary studies explore spatial relationships, they do not account for the spatial spillover effects across regions.
As discussed above, although the spillover of avian influenza to the global poultry market is studied extensively in a massive body of literature, there may still exist gaps in current knowledge and methods, in measurement, theory and empirical analysis, which are crucial to better understand the price risk spillover.
In this article we attempt to fill these knowledge gaps in the literature, in measurement, theory and empirical analysis, respectively. We set out to unveil the mechanism of price risk spillover of avian influenza to broiler market, from the perspective of public opinion, using big data techniques. Specifically, the following three research questions are addressed. (i) How do avian influenza outbreak and public opinion respectively affect broiler price risk, say, is the impact of avian influenza outbreak overestimated and is the impact of public opinion underestimated? (ii) How can the causal mechanism be interpreted in an era of big data, say, using the theory of information and communication? (iii) How does the price risk of avian influenza spill over, say, is the marginal effect nonlinear and does it spill over to nearby regions?
To answer these questions: (i) Unlike previous work, where an avian influenza epidemic is measured as a whole, we decompose avian influenza epidemic into two components, that is, avian influenza outbreak (incident component) and public opinion on avian influenza (information and communication component); by further decomposing avian influenza outbreak into poultry infection with avian influenza outbreak and human infection with avian influenza outbreak, we measure poultry infection with avian influenza outbreak (incident component) with hand-collected data from Official Veterinary Bulletin, measure human infection with avian influenza outbreak (incident component) with hand-collected data from Disease Surveillance and measure public opinion on avian influenza (information and communication component) with hand-collected data from Baidu Search and Google Search using big data; our work complements concurrent research in measurement; (ii) Theoretically, following Hong and Stein [30] and Li et al. [31], by introducing the theory of limited attention and two-step flow of communication, we develop a new analytical framework to capture the causal mechanism of avian influenza outbreak, public opinion, and broiler price risk spillover, and formulate the related theoretical hypotheses, arguing that it is actually public opinion on avian influenza that directly causes broiler price risk, not avian influenza outbreak itself; thus, it is crucial to differentiate between these two components since they differ in terms of their spillovers to broiler price risk; our work complements concurrent research in theory: (iii) Empirically, using a long panel data set covering China’s 30 provinces spanning November 2004–November 2017, we derive the baseline model from the analytical framework developed and the theoretical hypotheses formulated, perform the exploratory baseline data analysis and identify the causal mechanism of avian influenza outbreak, public opinion, and broiler price risk spillover; further, we develop 5 types of spatial models based on the baseline model, conduct the exploratory spatial data analysis and analyse the nonlinear spatial spillover of public opinion to broiler price risk; our spatial estimates are robust to alternative spatial weighting matrix and alternative measurement of public opinion; our work complements concurrent research in empirical analysis.
We fill the knowledge gaps stated above, theoretically by developing the new analytical framework based on the theory of limited attention and two-step flow of communication, arguing that avian influenza epidemic influences broiler price through actually public opinion on avian influenza during second-step flow of communication, whereas avian influenza outbreak itself does not directly cause broiler price risk; and empirically by documenting four stylized facts: (i) Neither poultry infection nor human infection with avian influenza outbreak has a significant spillover to broiler price; public opinion on avian influenza has a negative spillover to broiler price and the effect size of public opinion on broiler price is 1/4 of the effect size of poultry meat consumption in cities and towns, 1/5 of chick price, 1/10 of live chicken price and 1/3 of pork price; (ii) There is an inverse U-shaped relationship between broiler price and public opinion; mean and median public opinion are both on the right-hand side of the turning point of the inverse U-shape; therefore, on average, public opinion exerts negative price pressure on broiler market and the marginal effect increases; but when public opinion is weaker than the turning point, it increases broiler price instead and the marginal effect decreases; (iii) The spatial coefficients of broiler price are significantly positive, indicating positive spatial clustering of broiler price, implying that the overall price risk of China’s broiler market is positively spatially autocorrelated across regions; the temporal coefficients of broiler price are significantly positive, indicating positive temporal path dependence in broiler price; the spatiotemporal coefficients of broiler price are significantly negative, indicating negative spatiotemporal spillover of neighbouring broiler price in the previous period to local broiler price in the current period; (iv) Overall, whether direct or spatial spillover, long-run effects of public opinion on broiler price are larger than short-run effects; on average, public opinion on avian influenza has a negative direct effect on local broiler price and an even larger negative spatial spillover effect on nearby broiler price, which is three times as large as the direct effect; while in general, direct and spatial spillover effects of public opinion on broiler price are all inverse U-shaped.
Our findings are significant in that departing from previous work, we contribute to the literature on the price risk spillover of avian influenza to global poultry market in several ways. (i) In measurement, the existing papers measure avian influenza epidemic as a whole and ignore its components, therefore they actually estimate the mixed effects of an avian influenza epidemic [12,19]; whereas we decompose avian influenza epidemic into avian influenza outbreak (incident component) and public opinion on avian influenza (information and communication component) and distinguish between the impacts of these two components, showing that it is actually public opinion, not avian influenza outbreak, that directly broiler price risk, not avian influenza outbreak itself, implying that in the existing literature, the impact of avian influenza outbreak may have been overestimated and the impact of public opinion may have been underestimated in prior work; (ii) In theory, the existing papers characterize the price risk spillover mainly by the theory of individual consumers’ risk perceptions and behavioural biases [22,24] and neglect the clustering of consumers’ opinion, thus they may be insufficient to interpret the particular large price risk along with intensive news and social media coverage in the age of big data; whereas we follow Hong and Stein [30] and Li et al. [31] in introducing the theory of limited attention and two-step flow of communication and develop a new analytical framework to capture the causal mechanism, arguing that avian influenza outbreak itself only attracts limited attention if not intensively covered by media, while public opinion on avian influenza attracts excessive attention, which triggers price risk, implying that the role of public opinion in amplifying price risk should not have been ignored when analysing the price risk spillover in prior work. (iii) In empirical analysis, although preliminary empirical evidence attempts to explore the spatial distribution of the impact of avian influenza to broiler market [29,32,33], the existing papers seldom consider the spatial spillover effect of avian influenza on poultry market, which may overlook the spatial relationships between areas; whereas we develop static and dynamic spatial economic models to capture the spatial spillover effects and find that whether short-run or long-run, public opinion on avian influenza has an even three times larger spatial spillover effect on nearby broiler price, compared to the direct effect on local broiler price, implying that spatial spillover should not have been omitted in prior work.
More broadly, our analysis has several significant implications, in theory and in practice, from a global perspective. First, in theory, our research sheds new light on the mechanism of price risk spillover of animal disease to global livestock and poultry market, by highlighting the importance of studying public opinion in amplifying price risk during second-step flow of communication. Second, in practice, our research suggests that: (i) facing global epidemic animal disease, official media should shoulder the responsibility of being the “opinion leader”, leading public opinion on global epidemic animal disease to behave more rationally, so as to mitigate the negative spillover of public opinion to livestock and poultry price; (ii) authorities should closely monitor public opinion on global epidemic animal disease when it is approaching or exceeding the “turning point”, in case of the increasing negative marginal effect of public opinion on livestock and poultry price on the right-hand side of the inverse U-shape; (iii) agricultural insurance companies may design targeted livestock and poultry price insurance products, by accounting for public opinion on epidemic animal disease in neighbouring areas or countries and thus, by forecasting local price risk, given the “spatial spillover” of public opinion to livestock and poultry price globally.
The article is organized as follows. (i) Section 2 develops an analytical framework of the causal mechanism of price risk spillover and formulates theoretical hypotheses; (ii) Section 3 describes the data set, measures indicators and presents summary statistics and stationarity tests from the sample; (iii) Section 4 identifies the causal mechanism empirically; (iv) Section 5 further analyses the nonlinear spatial spillover of public opinion to broiler price risk; (v) Section 6 performs robustness checks; (vi) Section 7 provides discussion on the results; (vii) Section 8 concludes.
Note that throughout this article: (i) “price risk spillover” refers to the phenomenon that avian influenza epidemic spills over to poultry market and leads to its price risk [34], either locally or spatially; (ii) “avian influenza epidemic” refers to the disease epidemic as a whole, consisting of avian influenza outbreak (incident component) and public opinion on avian influenza (information and communication component); (iii) “avian influenza outbreak” refers to the incident component of the disease epidemic; (iv) “public opinion” refers to the information and communication component of the disease epidemic; (v) “on average” refers to estimates based on the mean of the level terms of independent variables, so as to capture the linearity; (vi) “in general” refers to estimates based on the whole distribution of level terms of independent variables, that is, the quadratic terms, so as to capture the nonlinearity.

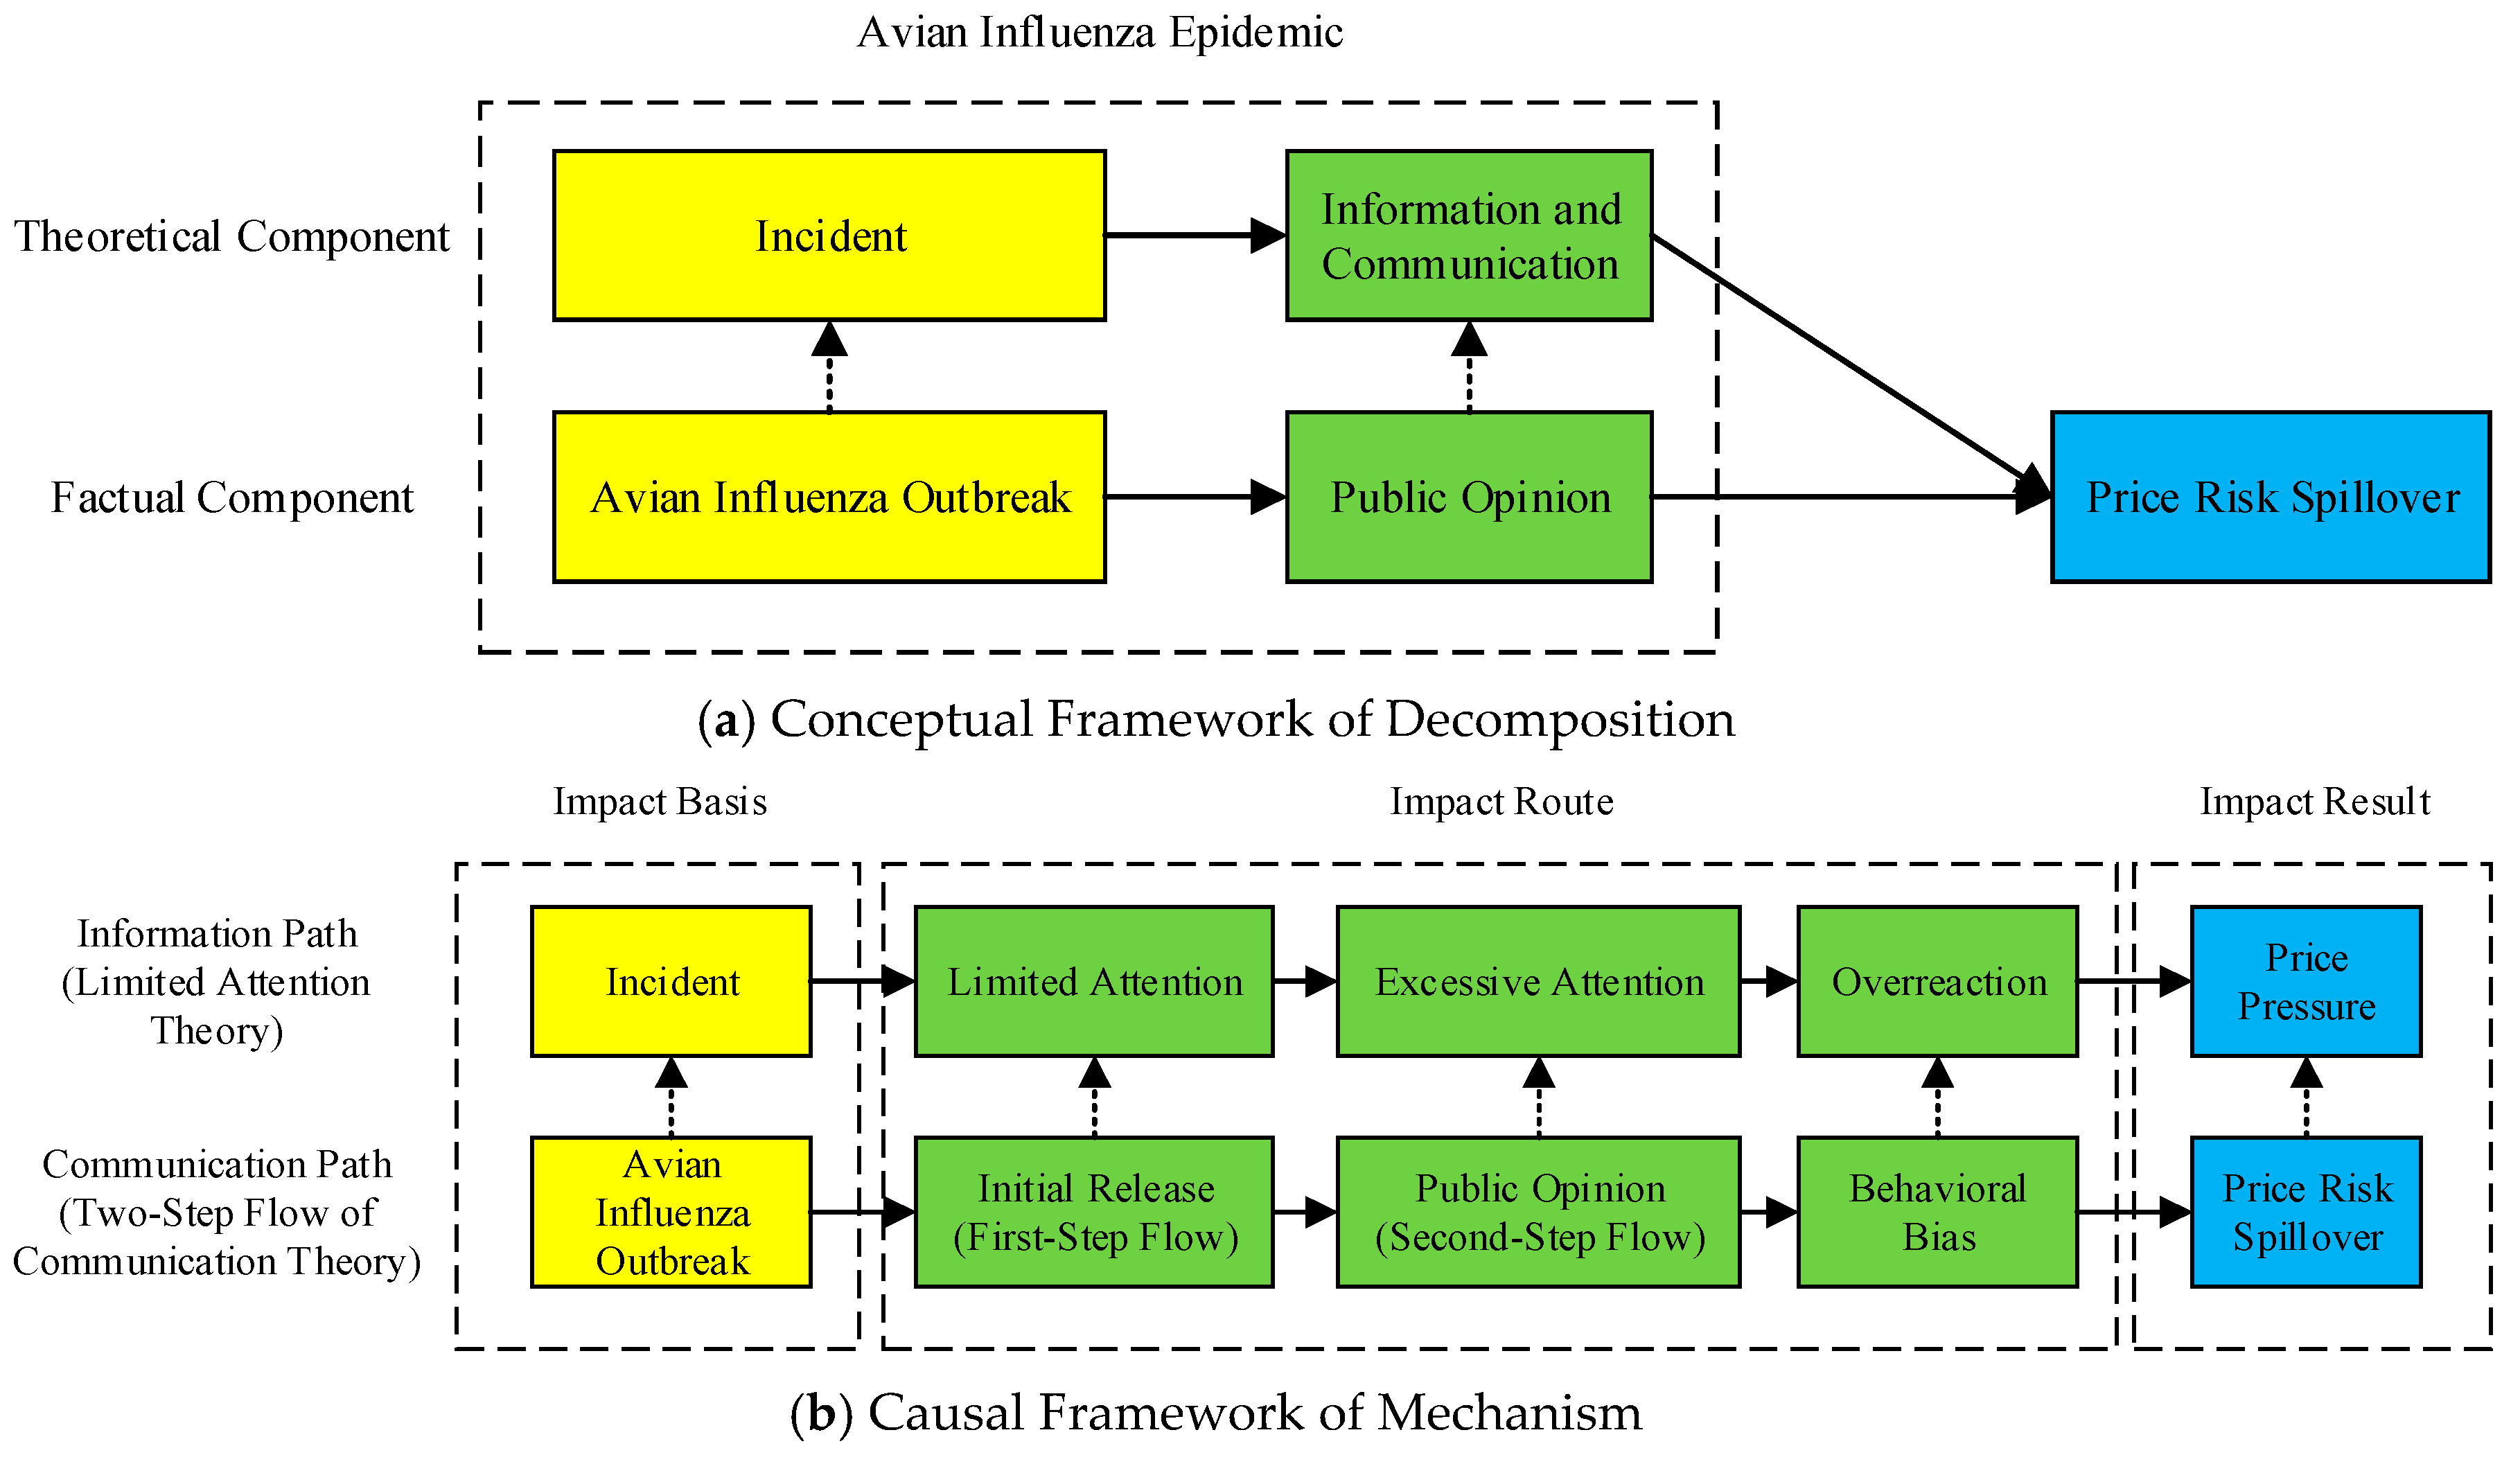
2. Theoretical Framework

In this section, we develop an analytical framework and formulate theoretical hypotheses.

2.1. Analytical Framework

In this subsection, we aim to develop a new analytical framework by introducing the theory of limited attention [35] and two-step flow of communication [36], to capture the causal mechanism of avian influenza outbreak, public opinion, and broiler price risk spillover.
Kahneman [35] proposes the theory of limited attention, who regards the attention of market participants as limited psychological resources that people use to perform tasks [37], arguing that the attention and information processing ability of decision-makers are limited and the information processing efficiency is affected by many factors. In the era of big data, facing huge amount of information with limited information processing ability, market participants can hardly pay attention to and understand all the information due to limited time and energy [38], which leads to incomplete understanding of information and deviation of economic behaviour. Limited attention has a significant impact on market participants’ decision-making [39]. Market participants’ knowledge and understanding of market information directly affect their economic decision-making and behaviour and thus affect the economic market.
Lazarsfeld, Berelson and Gaudet [36] propose the theory of two-step flow of communication, who explore the process of opinion from the media to the opinion leader and then to the audience, stating that information goes through two steps from the media to the audience: first, from the media to opinion leader, which is the step of mass communication; second, from opinion leader to the public, which is the step of interpersonal communication. As the core of two-step of communication, opinion leaders are rooted in complex social network and play a role in this group [40].
Behavioural finance studies show that media information has an impact on the price of financial assets [41]. Due to certain psychological bias, boundedly rational market participants pay limited or excessive attention to information, which is related to the phenomenon of insufficient or excessive market response to information [42]; as an intermediate link of information transmission [43], media transmits incident information to market participants through media reports and influences the attention of market participants with bounded rationality, leading to behavioural bias of market participants in underreacting or overreacting to information, which has an impact on asset prices. Combing the price response model of capital market [30], the theory of limited attention [35] and the theory of two-step flow of communication [36], Li et al. [31] examine how information dissemination and boundedly rational investor attention affect stock prices together, arguing that the attention of boundedly rational investors is limited [44]; limited attention lengthens the process of information entering price and strengthens the phenomenon of insufficient market reaction involved in behavioural finance; media plays the role of opinion leader in two-step flow of communication theory, who releases information that is not different from the source information and lags behind, arousing investors’ attention; media’s influence of public opinion accelerates the process of information integration into the market, causes market overreaction and brings forward price pressure to stock [45].
Inspired by recent work by Hong and Stein [30] and Li et al. [31], we develop a new analytical framework (Figure 1), by introducing the theory of limited attention [35] and two-step flow of communication [36], to illustrate our conceptual framework of decomposition of an avian influenza epidemic into avian influenza outbreak and public opinion (Panel (a) of Figure 1) and causal framework of mechanism of avian influenza outbreak, public opinion, and broiler price risk spillover (Panel (b) of Figure 1).
First, in Panel (a) of Figure 1, we present our conceptual framework of decomposition of an avian influenza epidemic into avian influenza outbreak and public opinion. Unlike previous work, where avian influenza epidemic is measured as a whole, we decompose avian influenza epidemic into two components, that is, avian influenza outbreak (incident component) and public opinion on avian influenza (information and communication component); so as to distinguish between the spillovers of these two components on broiler price. We define incident and information and communication as theoretical components; while we define avian influenza outbreak and public opinion as factual components. To illustrate this, consider two paths related to these components: (i) the path related to theoretical components: incident → information and communication → price risk spillover; (ii) the path related to factual components: avian influenza outbreak → public opinion → price risk spillover. According to our conceptual framework of decomposition, we argue that it is actually public opinion on avian influenza (information and communication component), not avian influenza outbreak (incident component) itself, that directly causes broiler price risk.
Second, in Panel (b) of Figure 1, we present our causal framework of mechanism of avian influenza outbreak, public opinion, and broiler price risk spillover. We capture the causal mechanism of avian influenza outbreak, public opinion, and broiler price risk spillover. To illustrate this, consider two paths, the information path (limited attention theory) and the communication patch (two-step flow of communication theory): (i) the information path based on limited attention theory: incident → limited attention → excessive attention → overreaction → price pressure; (ii) the communication path based on two-step flow of communication theory: avian influenza outbreak → initial release (first-step flow) → public opinion (second-step flow) → behavioural bias → price risk spillover. The causal mechanism is as follows: (i) avian influenza outbreak, as an incident [46], is initially released by authorities during first-step flow [47] and becomes source information [48] on avian influenza, which may only attract limited public attention [49]; (ii) when source information on avian influenza is intensively covered by news and social media, who act as opinion leader [50], the source information becomes public opinion [51] on avian influenza during second-step flow [52], which may attract excessive pubic attention [35]; (iii) excessive attention on avian influenza brings about public behavioural bias [53], leading to public overreaction [54] to avian influenza; (iv) the clustering of public behavioural bias and public overreaction to avian influenza result in negative price pressure [55] on poultry market, causing poultry price risk spillover [56].
The following baseline analysis and spatial analysis provide empirical evidence in favour of our analytical framework.

2.2. Theoretical Hypotheses

In this subsection, we formulate theoretical hypotheses based on our analytical framework.

2.2.1. Spillover of Avian Influenza Outbreak to Broiler Price Risk

As an incident, avian influenza has an impact on the poultry market at two sides: supply side and demand side. (i) on the supply side of the market, avian influenza outbreak results in a compulsory destroying of poultry within 3 km and a compulsory immunization of poultry within 5 km around the epidemic site, implemented by the government [57]; meanwhile, poultry breeding in the epidemic area is forbidden within six months, poultry market is closed and poultry product circulation is restricted, forming a separate unconformity market, resulting in a substantial reduction in poultry product supply [29]. (ii) On the demand side of the market, when avian influenza outbreaks, the incident is released to the public through authoritative sources such as government releases and official media reports, becoming source information; avian influenza source information is often submerged in a large amount of information, while boundedly rational consumers are constrained by limited information processing capabilities and inadequate responses to information on the source information, so they can only maintain limited attention; therefore, although avian influenza risk perception reduces consumers’ purchase motivation of poultry products, the impact is limited. (iii) On both sides of the market, reduced demand for poultry products due to limited consumer attention to information on avian influenza outbreaks, which hedges against reduced supply of poultry products; therefore, there is no significant change in the equilibrium price of poultry market. We propose theoretical hypothesis H1:
H1: 
Controlling for other factors, avian influenza outbreak has no significant spillover to broiler price.
We further decompose avian influenza outbreak into poultry infection and human infection, following the procedure described in Zhou and Liu [18] and propose the sub-hypotheses of the theoretical hypothesis H1:
H1a: 
Controlling for other factors, poultry infection with avian influenza outbreak has no significant spillover to broiler price.
H1b: 
Controlling for other factors, human infection with avian influenza outbreak has no significant spillover to broiler price.

2.2.2. Spillover of Public Opinion to Broiler Price Risk

With the emergence of new media forms such as network and mobile phone, the scope and speed of information generation and dissemination are increasing; public opinion communication is developing from traditional professional media channels to public media and self-media and the social and economic impact of public opinion is also growing; its effect is reflected in the rapid dissemination of information and then the formation of aggregated public opinion [58]. (i) When avian influenza outbreaks, the network news media and social media identifies the hot incident, screen the source information of avian influenza from the ocean of information and carry out second-step flow of communication, forming public opinion on avian influenza [59]; (ii) influenced by public opinion on avian influenza, consumers’ attention, confidence and emotions are greatly affected, with increased avian influenza risk perception and consumer’s bounded rationality leading to deviation of the consumption behaviour of poultry products, that is, overreaction to consumption risk of poultry products; (iii) the agglomeration of consumer behavioural deviations leads to mass market panic [60], which has a significant impact on the market demand of poultry industry; (iv) the panic in the consumer market leads to inadequate demand for poultry, thus demand for poultry falls more than supply, which directly leads to the decrease of the equilibrium price in the poultry market [13,21,61]; (v) in turn, it has a great impact on price fluctuations in the poultry market, forming the price risk of poultry market. We propose theoretical hypothesis H2:
H2: 
Controlling for other factors, on average, public opinion on avian influenza has a negative spillover to broiler price.
According to theoretical hypothesis H2, on average, public opinion on avian influenza exerts negative price pressure [55] on the market price of poultry. However, because avian influenza outbreak directly reduces the supply of poultry products and public opinion indirectly reduces poultry product demand by influencing overreaction behaviour of boundedly rational consumers [62], both supply and demand of poultry products decline. Therefore, the change of the equilibrium price of poultry products is uncertain under different levels of public opinion on avian influenza, which means that the direction and marginal effect of different levels of public opinion on poultry price may change, that is, there may be a nonlinear relationship between public opinion on avian influenza and poultry price. (i) When the level of public opinion is particularly low, the quantity and intensity of second-step flow of avian influenza source information by news and social media are limited and consumers have limited attention to the source information of avian influenza; avian influenza outbreak directly reduces poultry production capacity and public opinion on avian influenza also forces poultry breeders and poultry suppliers to reduce the supply of poultry products; therefore, the reduction of consumer demand for poultry products is less than that of supply and poultry price rises on the contrary; as the level of public opinion increases gradually from very low, the impact of public opinion on consumer demand for poultry products increases gradually, so although public opinion still has a positive effect on the market price of poultry, the marginal effect decreases. (ii) When the level of public opinion exceeds a certain turning point, the amount and intensity of second-step flow of avian influenza source information by news and social media are relatively large, where media plays the role of opinion leader, causing consumers to pay excessive attention to the information of avian influenza, thus forming a clustered overreaction of boundedly rational consumers, which greatly reduces or even stops the purchase of poultry products; the decrease in consumer demand for poultry products is greater than the decrease in supply and poultry price falls; with the level of public opinion rising further, the herding effect [63] of irrational behaviour of boundedly rational consumers further aggravates the negative price pressure of poultry market price and the marginal effect of public opinion on poultry price increases. Based on theoretical hypothesis H2, we propose theoretical hypothesis H3:
H3: 
Controlling for other factors, in general, the spillover of public opinion on avian influenza to broiler price is inverse U-shaped.
Furthermore, theoretical hypothesis H2 is a special case of theoretical hypothesis H3 when the level of public opinion is on average and the level of public opinion is on the right-hand side of the turning point of the inverse U-shape.

2.2.3. Spatial Spillover of Public Opinion to Broiler Price Risk

Public opinion enhances the spread scope and speed of avian influenza information and leads to price fluctuations in poultry market by influencing the purchasing behaviour of boundedly rational consumers. The spread of public opinion is cross-regional [64], which blurs the spatial boundary where the incident occurs; public opinion in a certain area is rapidly disseminated through the news and social media without the restriction of regional space; public opinion on avian influenza in a region not only raises the attention of consumers and influences local consumers’ buying behaviour but also enhances consumers’ risk perception of poultry products in nearby areas, causing negative price pressure across regions. In other words, public opinion on avian influenza may lead to cross-regional impact on poultry price, resulting in a negative spatial spillover effect. Based on theoretical hypothesis H2, we propose theoretical hypothesis H4:
H4: 
Controlling for other factors, on average, public opinion on avian influenza has a negative spatial spillover to broiler price.
Based on theoretical hypotheses H3–H4, we expect that the spatial spillover effect [65] of public opinion on avian influenza on poultry price in neighbouring areas is also not linear but an inverted U-shaped relationship. (i) When public opinion on avian influenza is particularly weak, it has a positive spatial spillover to poultry price in neighbouring areas and the marginal effect decreases; (ii) when public opinion on avian influenza exceeds a certain turning point, it has a negative spatial spillover to poultry price in neighbouring areas and the marginal effect increases. Based on theoretical hypotheses H3–H4, we propose theoretical hypothesis H5:
H5: 
Controlling for other factors, in general, the spatial spillover of public opinion on avian influenza to broiler price is inverse U-shaped.
Furthermore, theoretical hypothesis H4 is a special case of theoretical hypothesis H5 when the level of public opinion is on average and the level of public opinion is on the right-hand side of the turning point of the inverse U-shape.

3. Materials and Methods

In this section, we describe the data set and measure indicators and present summary statistics and stationarity tests from the sample.

3.1. Sample Definitions

We use 5 types of monthly provincial panel data: (i) price data, collected from China Animal Agriculture Association (http://www.caaa.cn); (ii) search engine data, hand-collected from Baidu Search (https://www.baidu.com) and Google Search (https://www.google.com); (iii) journal data, hand-collected from monthly journal Official Veterinary Bulletin published by Ministry of Agriculture and Rural Affairs of China (http://www.cadc.net.cn/sites/MainSite/tzgg/sygb) and monthly journal Disease Surveillance published by China’s Centre for Disease Control and Prevention (http://www.jbjc.org/indexen.htm); (iv) broiler supply and demand data, collected from EPS China Data (http://www.epschinadata.com); (v) China provinces shapefile (map), used for spatial analysis, collected from GADM data (https://www.gadm.org/download_country_v3.html).
The data sample includes China’s 30 provinces spanning November 2004–November 2017 (Tibet, Hong Kong, Macao and Taiwan are excluded due to the lack of comprehensive data), where November 2004 is the first month which Official Veterinary Bulletin covers and November 2017 is the latest month in which our data source is available.

3.2. Indicator Measurement

3.2.1. Dependent Variable

Our dependent variable is broiler price. Following Zheng and Ma [66] and Lu and Xu [67], we use dressed broiler price to measure broiler price, for the following reasons: (i) dressed broiler can be produced on a large scale and standardized basis and it is safer to eat than live chicken; dressed broiler is the core supply mode of chicken sales in major developed countries and also the main development direction of the supply mode of broiler industry; dressed broiler has become the main consumption mode of poultry meat for urban residents [68]; (ii) dressed broiler is the terminal product of broiler industry and the main direct consumer goods in broiler market [13]; (iii) dressed broiler is in the downstream of the broiler industry chain and dressed broiler price is at the end of the price conduction chain in the broiler market [66].

3.2.2. Independent Variables of Interest

Our independent variables of interest are public opinion on avian influenza and avian influenza outbreak. As discussed above, unlike previous studies, where avian influenza epidemic is measured as a whole, we decompose avian influenza epidemic into two components: avian influenza outbreak (incident component) and public opinion on avian influenza (information and communication component).
(i) Public opinion on avian influenza. Currently, in the age of big data, along with the steady development of network technology and smart phones, news and social media is playing increasingly crucial functions in affecting the general public [69]. In this article, public opinion on avian influenza indicates the public opinion of the network media and netizens on the information of an avian influenza epidemic.
We do not use Baidu index to measure public opinion on avian influenza as Zheng and Ma [20] do, because the data of Baidu index is only available from January 2011 and provincial data is not provided.
Following the procedure described in Zheng et al. [70,71], Xu [72] and Li, Yang and Cao [69], we use Baidu search volume to measure public opinion on avian influenza, for the following reasons: (i) Baidu Search is the world’s largest Chinese search engine, with the world’s largest Chinese web database, may have more detailed news reports on avian influenza in China; (ii) avian influenza epidemic first appeared in China in January 2004 and Baidu Search began to collect web information in January 2000, which meets the time requirement for data collection of an avian influenza epidemic; (iii) Baidu search volume can comprehensively reflect the attention of China’s network media and netizens to avian influenza.
The data collection process is as follows: (i) input keywords “avian influenza” and the corresponding province in Baidu Search, such as “avian influenza Beijing” (in Chinese); (ii) click “search tool” and set the search time span to November 2004; (iii) check the source code and count the number of search results; (iv) set the search time span to December 2004, January 2005, ..., until November 2017 and count the number of search results, respectively; (v) After Beijing, search for “avian influenza Tianjin”…until “avian influenza Xinjiang” and count the number of search results, respectively, altogether 30 provinces spanning November 2004–November 2017.
Moreover, we include the quadratic term of public opinion on avian influenza, to examine the nonlinear spillover of public opinion on avian influenza to broiler price.
Alternatively, we use Google search volume to measure public opinion on avian influenza in robustness checks; similarly, we include the quadratic term of Google opinion.
We expect the signs of level terms and quadratic terms of public opinion and Google opinion to be all negative.
(ii) Avian influenza outbreak. We further decompose avian influenza outbreak into poultry infection with avian influenza outbreak and human infection with avian influenza outbreak, following Zhou and Liu [18]. We measure poultry infection with avian influenza by dummy for poultry infection with avian influenza cases (taking 1 for outbreaks), using hand-collected journal data from monthly journal Official Veterinary Bulletin published by Ministry of Agriculture and Rural Affairs of China; and measure human infection with avian influenza by dummy for human infection with avian influenza cases (taking 1 for outbreaks), using hand-collected journal data monthly journal Disease Surveillance published by China’s Centre for Disease Control and Prevention.
We expect the signs of poultry infection and human infection with avian influenza outbreak to be both negative.

3.2.3. Control Variables

Our control variables include price determinants and supply and demand determinants.
(i) Price control variables. We control for potential price determinants, such as broiler compound feed price, broiler chick price, live chicken price and pork price; where broiler compound feed price and broiler chick price represent upstream products of broiler industry chain, live chicken price represents midstream product of broiler industry chain, dressed broiler price represents downstream products of broiler industry chain and pork price represents poultry meat alternative.
We expect the signs of feed price, chick price, live chicken price and pork price to be all positive.
(ii) Supply and demand control variables. We control for potential supply and demand determinants, such as poultry meat output, poultry meat consumption in cities and towns and poultry meat consumption in rural areas. We do not include income variable as some papers do, because provincial urban and rural income data are only available in yearly and quarterly panel data, without provincial monthly panel data.
We expect the sign of poultry output to be negative and the signs of urban and rural poultry consumption to be both positive.

3.3. Variable Definitions and Data Sources

Table 1 provides detailed variable definitions and data sources. Table 1 consists of four panels: (i) Panel A of Table 1 presents definition and data source of dependent variable, that is, broiler price (lnbroiler); (ii) Panel B of Table 1 presents definitions and data sources of independent variables of interest, that is, public opinion (lnbaidu), squared public opinion (lnbaidu2), Google opinion (lngoogle), squared Google opinion (lngoogle2), poultry infection (pai) and human infection (hai); (iii) Panel C of Table 1 presents definitions and data sources of price control variables, that is, feed price (lnforage), chick price (lnchick), live chicken price (lnlive) and pork price (lnpork); and (iv) Panel D of Table 1 presents definitions and data sources of supply and demand control variables, that is, poultry output (lnoutput), urban poultry consumption (lnurban) and rural poultry consumption (lnrural).

3.4. Summary Statistics and Stationarity Tests

Table 2 describes our data and presents summary statistics. Our data sample is processed as follows: (i) We use multiple imputation to handle missing data [73]; (ii) All price variables are deflated using the provincial consumer price indices to January 2004 yuan to adjust for inflation [74]; (iii) Following Ponticelli and Alencar [75], we first take logarithms of all continuous variables to reduce heteroskedasticity, then winsorize all continuous variables at the 1st and 99th percentile to trim outliers [76] and finally standardize them by province to be mean 0 and standard deviation 1 to avoid multicollinearity [77] and for ease of interpretation [78]; (iv) Since the raw values of public opinion (baidu) can take on the value 0, we actually use ln(1+baidu) instead [79]; yet this variable is, however, still written as lnbaidu; and (v) Quadratic terms, namely, lnbaidu2 and lngoogle2, are constructed after standardization of level terms, namely, lnbaidu and lngoogle, respectively.
We use a long panel data set covering 30 provinces spanning 157 months, therefore, panel-data unit-root tests of continuous variables should be carried out before empirical analysis to address the potential concern about spurious correlation. We perform the LLC [80], IPS [81] and Fisher-ADF [82] tests for unit roots (or stationarity). The test results in Table 3 suggest that, we reject the null that all the panels contain a unit root at the 1% level and 5% level and the data are stationary.

4. Baseline Analysis of Price Risk Spillover and Results

In this section, we derive the baseline model, conduct the exploratory baseline data analysis and perform the baseline estimation.

4.1. Baseline Model

First, we consider the linear relationships between broiler price and its potential determinants. To analyse the spillover of public opinion and avian influenza outbreak to broiler price risk (i.e., to verify theoretical hypotheses H1–H2), we start by considering the following function:
b r o i l e r i t = f ( b a i d u i t , p a i i t , h a i i t , X i t ) = α b a i d u i t β 1 e β 2 p a i i t e β 3 h a i i t e β 4 X i t
where i is province, t is month, broilerit is broiler price, baiduit is public opinion, and paiit and haiit are dummies for poultry and human infections with avian influenza outbreak, respectively. Equation (1) indicates that broiler price is a function of public opinion and avian influenza outbreak. α is a constant term and Xit is a vector of other factors affecting broiler price. Taking logarithms of Equation (1) gives the following reduced-form equation:
ln b r o i l e r i t = ln α + β 1 ln b a i d u i t + β 2 p a i i t + β 3 h a i i t + β 4 X i t + λ t + u i + ε i t
where λt and ui are month and province fixed effects, respectively; εit is the error term. As we use a long panel data set spanning 157 months, including month dummies may lead to substantial losses in degrees of freedom, resulting in larger standard errors for estimates. Therefore, we include a linear time trend instead of month dummies:
ln b r o i l e r i t = ln α + β 1 ln b a i d u i t + β 2 p a i i t + β 3 h a i i t + β 4 X i t + γ m o n t h t + u i + ε i t
where montht is a linear time trend.
Second, more generally, we consider two extensions of Equation (3) for a more general case:
(i) we introduce lnbaidu2it (squared public opinion) to capture possible nonlinearities in the relationship between broiler price and public opinion (i.e., to verify theoretical hypothesis H3).
(ii) In view of the related literature, we allow for other determinants of broiler price, such as price of broiler industry chain and related products and output and consumption of poultry, by including a control function:
X i t = β 1 ln f o r a g e i t + β 2 ln c h i c k i t + β 3 ln l i v e i t + β 4 ln p o r k i t + β 5 ln o u t p u t i t + β 6 ln u r b a n i t + β 7 ln r u r a l i t
where lnforageit is feed price, lnchickit is chick price, lnliveit is live chicken price, lnporkit is pork price, lnoutputit is poultry meat production and lnurbanit and lnruralit are poultry meat consumption in cities and towns and rural areas, respectively.
Finally, we incorporate the above two extensions and rewrite Equation (3) as the following baseline model:
ln b r o i l e r i t = ln α + β 1 ln b a i d u i t + β 2 ln b a i d u 2 i t + β 3 p a i i t + β 4 h a i i t + β 5 X i t + γ m o n t h t + u i + ε i t
where Xit is a vector of control variables. Incorporating Equation (4) into Equation (5), the baseline model can be rewritten as:
ln b r o i l e r i t = ln α + β 1 ln b a i d u i t + β 2 ln b a i d u 2 i t + β 3 p a i i t + β 4 h a i i t Independent   variables   of   interest + β 5 ln f o r a g e i t + β 6 ln c h i c k i t + β 7 ln l i v e i t + β 8 ln p o r k i t Price   control   variables + β 9 ln o u t p u t i t + β 10 ln u r b a n i t + β 11 ln r u r a l i t Supply   and   demand   control   variables + γ m o n t h t + u i + ε i t

4.2. Exploratory Baseline Data Analysis

To provide an intuitive illustration of the difference in impacts between avian influenza outbreak and public opinion on avian influenza, Figure 2 plots the time series of public opinion, poultry infection and human infection with avian influenza outbreak, in Liaoning, Anhui, Guangdong and Xinjiang, respectively, spanning November 2004–November 2017, as a preliminary exploration of the data. The selection of provinces is based on the Zhou and Liu [18] narrative account of avian influenza high incidence areas in China.
From Figure 2 we see that: (i) trend in broiler price is seemingly negatively correlated with trend in public opinion; (ii) neither trend in poultry infection nor trend in human infection is seemingly significantly correlated with trend in public opinion. It implies that avian influenza outbreak may not necessarily lead to strong public opinion and strong public opinion may not necessarily follow avian influenza outbreak. One possible explanation is that if avian influenza outbreak is not intensively covered by news and social media, it may not attract sufficient public attention [83,84], which may result in insignificant public opinion [51,85], lending support to our conceptual framework of decomposition of an avian influenza epidemic into avian influenza outbreak and public opinion, in Panel (a) of Figure 1.
We present scatterplots of broiler price (lnbroiler) against (a) Public Opinion (lnbaidu), (b) Poultry Infection (pai) and (c) Human Infection (hai), respectively, with pointwise 95% confidence intervals, in Figure 3: (i) in Panel (a) of Figure 3 we see an overall inverse U-shaped pattern, which provides preliminary evidence on the nonlinear relationship between broiler price and public opinion, consistent with theoretical hypothesis H3; (ii) in Panel (b) of Figure 3 there seems no significant correlation between broiler price and poultry infection and in Panel (c) of Figure 3 there seems no significant correlation between broiler price and human infection, both of which coincide with theoretical hypothesis H1.

4.3. Baseline Specification Tests

Before turning to our baseline estimates, we perform a series of baseline specification tests, as reported in Table 4. Table 4 consists of two panels: (i) Panel A of Table 4 presents regression coefficients of baseline model (β1–β11); and (ii) Panel B of Table 4 presents specification tests, including adjusted R2, within R2, between R2, log likelihood, AIC, BIC, p-value of RESET (RESET_p), p-value of LR test (LR_p), p-value of Wald test (Wald_p), p-value of Hausman test (Hausman_p), p-value of heteroskedasticity test (heteroske_p) and p-value of autocorrelation test (autocorr_p). We estimate the baseline model in Equation (5) using various estimators, including pooled OLS (OLS) estimator in columns (1)–(2), between-effects (BE) estimator in columns (3)–(4), random-effects (RE) estimator in columns (5)–(6) and fixed-effects (FE) estimator in columns (7)–(8). For each estimator, the first column reports the estimates including only the level term of public opinion, while the second column reports the estimates including both the level and quadratic terms of public opinion.
First, multicollinearity diagnostics. We test for potential multicollinearity in pooled OLS models (columns (1)–(2)) using variance inflation factor (VIF) [79], by testing if VIFj is above a cut-off value. VIF test results show that none of the VIFs for the independent variables is above 10, indicating that multicollinearity is not a problem [79].
Second, general functional form misspecification test. We test for potential general functional form misspecification in pooled OLS models (columns (1)–(2)) using Ramsey’s regression specification error test (RESET) [86], by fitting y = xb + zt + u and then testing if t = 0. RESET results show that the null that model has no omitted variables cannot be rejected (p > 0.10), indicating that our baseline model passes the functional form test.
Third, model selection between pooled OLS (OLS) models and random-effects (RE) models. We conduct the model selection exercises between column (1) and column (5) and between column (2) and column (6), respectively, using likelihood ratio (LR) test [79], by testing if Var(u) = 0. LR test results show that the null is strongly rejected (p < 0.001), indicating that RE fits better than OLS.
Fourth, model selection between pooled OLS (OLS) models and fixed-effects (FE) models. We conduct the model selection exercises between column (1) and column (7) and between column (2) and column (8), respectively, using Wald test [79], by testing if all ui = 0. Wald test results show that the null is strongly rejected (p < 0.001), indicating that FE fits better than OLS.
Fifth, model selection between random-effects (RE) models and fixed-effects (FE) models. We conduct the model selection exercises between column (5) and column (7) and between column (6) and column (8), respectively, using Hausman’s specification test [87], by estimating the variance var(b-B) of the difference of the estimators by the difference var(b)-var(B) of the variances. Hausman test results show that the null of difference in coefficients not systematic is strongly rejected (p < 0.001), indicating that FE fits better than RE.
Sixth, model selection between between-effects (BE) models and fixed-effects (FE) models. Since FE is selected compared with RE in Hausman test, combined with the fact that BE is consistent if and only if the appropriate model is RE, BE estimator may be inconsistent here. Therefore, we infer that FE fits better than BE.
Seventh, model selection between first-differencing (FD) models and fixed-effects (FE) models. We do not report FD estimates here. Given that when T = 2, FD and FE estimates are identical; and when T > 2 and uit are serially uncorrelated, FE estimator is more efficient than FD estimator [79,88]; therefore, we infer that FE fits better than FD.
Eighth, heteroskedasticity test. We test for potential heteroskedasticity in fixed-effects (FE) models (columns (7)–(8)) using modified Wald statistic for groupwise heteroskedasticity in fixed effect model [89], by testing if sigma(i)^2 = sigma^2 for all i. Heteroskedasticity test results show that the null of homoskedasticity is strongly rejected (p < 0.001), indicating that there exists heteroskedasticity in FE models.
Finally, autocorrelation test. We test for potential autocorrelation in between-effects (BE) models (columns (3)–(4)), random-effects (RE) models (columns (5)–(6)) and fixed-effects (FE) models (columns (7)–(8)), respectively, using Wooldridge test for serial correlation in panel-data models [90,91], by testing for the correlation coefficient between pairs of adjacent observations. Autocorrelation test results show that the null of no first-order autocorrelation is strongly rejected (p < 0.001), indicating that there exists autocorrelation in BE, RE and FE models.
Collectively, we conclude that: (i) our baseline specification passes both multicollinearity diagnostics (VIF test) and general functional form misspecification test (RESET); (ii) FE model fits best among OLS, BE, RE and FE models, so we should select FE model as our primary baseline specification; (iii) although not causing bias or inconsistency in the OLS estimators, there still exists heteroskedasticity and autocorrelation in our baseline specification, however, these issues can be addressed by including heteroskedasticity-robust standard errors clustered at the individual-level [79,88].
In subsequent sections, we use FE with heteroskedasticity-robust standard errors as the primary estimator, for the following reasons. (i) Technically, no matter what the appropriate model is (e.g., pooled OLS (OLS), first-differencing (FD), between-effects (BE), random-effects (RE) or fixed-effects (FE)), FE estimator always gives consistent estimates, although it may not be the most efficient [79,88]. (ii) Empirically, all model selection exercises stated above point toward FE, suggesting that FE estimator is also the appropriate model and the most efficient. (iii) Theoretically, the hypothesis of FE is more in line with economic reality and FE can alleviate concerns about omitted variable bias [79,88].

4.4. Baseline Estimates

More formally, we estimate variants of the baseline model in Equation (5), where we include the additional controls one by one, as reported in Table 5. Table 5 consists of two panels: (i) Panel A of Table 5 presents regression coefficients of baseline model (β1–β11); and (ii) Panel B of Table 5 presents specification tests, including adjusted R2, log likelihood, AIC and BIC. As discussed above, we select FE model as our primary specification and include heteroskedasticity-robust standard errors clustered at the province-level to address the heteroskedasticity and autocorrelation issues [79,88].
First, in column (1) of Table 5, only poultry infection and human infection are included, whose coefficients are significantly negative; in column (2), public opinion is added and all coefficients are significantly negative.
Second, in columns (3)–(7), control variables are added gradually and poultry infection and human infection keep insignificant, while public opinion keeps significantly negative, implying that neither poultry infection nor human infection with avian influenza outbreak has a significant spillover to broiler price and public opinion on avian influenza has a negative spillover to broiler price, lending support to theoretical hypotheses H1–H2. In columns (6)–(7), all coefficients are more stable, which suggests that the omitted variable bias is small [92].
Third, in column (7), the effect size of public opinion on broiler price (−0.04) is 1/4 of the effect size of poultry meat consumption in cities and towns (0.16), 1/5 of chick price (0.21), 1/10 of live chicken price (0.38) and 1/3 of pork price (0.14).
Fourth, in column (8), squared public opinion is further added. Following the model selection criteria (R2, log likelihood, AIC and BIC), described in Elhorst [93] and Belotti, Hughes and Mortari [94], column (8) fits better than column (7). Squared public opinion in column (8) is still significantly negative and other coefficients remain similar to column (7), reflecting the fact that there is an inverse U-shaped relationship between broiler price and public opinion, lending support to theoretical hypothesis H3.
Finally, in column (8), we calculate the turning point of the inverse U-shaped relationship between broiler price and public opinion [79,95]:
turning _ ln b a i d u = β ^ 1 2 β ^ 2
where β ^ 1 and β ^ 2 are estimated values of lnbaidu and lnbaidu2, respectively; turning_lnbaidu, the turning point value for lnbaidu, equals −1.57, which is well within the range of the observed data on lnbaidu ranging from 6.42 to 4.77, according to the summary statistics in Table 2, indicating that this is not a spurious inverse U-shape. The mean and median lnbaidu, both of which equal 0.00, are on the right-hand side of the turning point of the inverse U-shape, combined with the fact that β ^ 1 and β ^ 2 are both significantly negative, lending further support to theoretical hypothesis H2 that, on average, public opinion on avian influenza has a negative spillover to broiler price, which is a special case of theoretical hypothesis H3 when public opinion is on average.
To illustrate this, consider Figure 4: (i) Panel (a) of Figure 4 plots the regression coefficients (linear) from column (7) of Table 5 and Panel (b) of Figure 4 plots the regression coefficients (nonlinear) from column (8) of Table 5, which shows that both public opinion and squared public opinion have negative spillovers to broiler price, lending support to theoretical hypotheses H2–H3. (ii) Panel (c) of Figure 4 plots the marginal effect of public opinion on avian influenza on broiler price with a pointwise 95% confidence interval based on the estimates in column (8) of Table 5, which follows a strong inverse U-shaped pattern in general, lending further support to theoretical hypothesis H3; and the mean lnbaidu (0.00) is on the right-hand side of the turning point of the inverse U-shape (−1.57), indicating a negative spillover to broiler price on average, lending further support to theoretical hypothesis H2.
Collectively, we draw our main conclusions from this section. (i) Neither poultry infection nor human infection with avian influenza outbreak has a significant spillover to broiler price, in accordance with theoretical hypothesis H1. (ii) Public opinion on avian influenza has a negative spillover to broiler price and the effect size of public opinion on broiler price (−0.04) is 1/4 of the effect size of poultry meat consumption in cities and towns (0.16), 1/5 of chick price (0.21), 1/10 of live chicken price (0.38) and 1/3 of pork price (0.14) (column (7) of Table 5), in accordance with theoretical hypothesis H2. (iii) There is an inverse U-shaped relationship between broiler price and public opinion; mean public opinion (0.00) and median public opinion (0.00) are both on the right-hand side of the turning point (−1.57) of the inverse U-shape (column (8) of Table 5); therefore, on average, public opinion exerts negative price pressure on broiler market and the marginal effect increases; but when public opinion is weaker than the turning point, it increases broiler price instead and the marginal effect decreases, in accordance with theoretical hypothesis H3.

5. Spatial Analysis of Price Risk Spillover and Results

In this section, we derive the spatial models, conduct the exploratory spatial data analysis and perform the spatial estimation.

5.1. Spatial Models

The baseline model (Equation (5)) may produce biased estimates for neglecting the spatial autocorrelation in the variables. Therefore, we further include spatial effects to capture possible nonlinear spatial spillover of public opinion on avian influenza to broiler price (i.e., to verify theoretical hypotheses H4–H5). Altogether we develop 5 types of spatial models, including spatial Durbin model (SDM), dynamic spatial Durbin model (dynamic SDM), spatial autoregressive (SAR) model, dynamic spatial autoregressive (dynamic SAR) model and spatial autocorrelation (SAC) model. Following the procedure described in Elhorst [93] and Belotti, Hughes and Mortari [94], we start with the SDM as a general specification and derive the others.
First, in Equation (5) (fixed effects model), we add the spatially lagged dependent variable (lnbroiler) and spatially lagged independent variables of interest (lnbaidu, lnbaidu2, pai and hai) to capture the spatially lagged effects of broiler price, public opinion, and avian influenza outbreak; and the baseline model is extended to SDM:
ln b r o i l e r i t = ln α + ρ j = 1 n w i j ln b r o i l e r j t + β 1 ln b a i d u i t + β 2 ln b a i d u 2 i t + β 3 p a i i t + β 4 h a i i t + β 5 X i t + θ 1 j = 1 n w i j ln b a i d u i t + θ 2 j = 1 n w i j ln b a i d u 2 i t + θ 3 j = 1 n w i j p a i i t + θ 4 j = 1 n w i j h a i i t + γ m o n t h t + u i + ε i t
Second, in Equation (8) (SDM), we add the temporally lagged dependent variable and spatiotemporally lagged dependent variable, to capture the temporally lagged effects and spatiotemporally lagged effects of broiler price; and the SDM is extended to dynamic SDM:
ln b r o i l e r i t = ln α + τ ln b r o i l e r i t 1 + ψ j = 1 n w i j ln b r o i l e r j t 1 + ρ j = 1 n w i j ln b r o i l e r j t + β 1 ln b a i d u i t + β 2 ln b a i d u 2 i t + β 3 p a i i t + β 4 h a i i t + β 5 X i t + θ 1 j = 1 n w i j ln b a i d u i t + θ 2 j = 1 n w i j ln b a i d u 2 i t + θ 3 j = 1 n w i j p a i i t + θ 4 j = 1 n w i j h a i i t + γ m o n t h t + u i + ε i t
Third, in Equation (8) (SDM), when the spatially lagged independent variables of interest can be omitted (i.e., θi = 0 (I = 1 2, 3, 4)), the SDM is transformed into SAR model:
ln b r o i l e r i t = ln α + ρ j = 1 n w i j ln b r o i l e r j t + β 1 ln b a i d u i t + β 2 ln b a i d u 2 i t + β 3 p a i i t + β 4 h a i i t + β 5 X i t + γ m o n t h t + u i + ε i t
Fourth, in Equation (10) (SAR), we add the temporally lagged dependent variable and spatiotemporally lagged dependent variable and the SAR is extended to dynamic SAR model:
ln b r o i l e r i t = ln α + τ ln b r o i l e r i t 1 + ψ j = 1 n w i j ln b r o i l e r j t 1 + ρ j = 1 n w i j ln b r o i l e r j t + β 1 ln b a i d u i t + β 2 ln b a i d u 2 i t + β 3 p a i i t + β 4 h a i i t + β 5 X i t + γ m o n t h t + u i + ε i t
Finally, in Equation (10) (SAR), we allow for a spatially autocorrelated error and the SAR is extended to SAC model:
ln b r o i l e r i t = ln α + ρ j = 1 n w i j ln b r o i l e r j t + β 1 ln b a i d u i t + β 2 ln b a i d u 2 i t + β 3 p a i i t + β 4 h a i i t + β 5 X i t + γ m o n t h t + u i + ν i t ν i t = λ j = 1 n w i j ν i t + ε i t
We mainly use squared inverse-distance spatial weighting matrix W(1) to characterize the spatial relationships between provinces [96]. W(1) and its row-standardized form is defined as:
W ( 1 ) : w i j d = { 1 d 2 , i j 0 , i = j w i j d = { w i j d j = 1 n w i j d , i j 0 , i = j
where d is the distance between provinces.
We also use queen contiguity spatial weighting matrix W(2) in robustness checks [97]. As Hainan is an island, to address this neighbourless issue, we calculate the distances between Hainan and Guangdong and between Hainan and Guangxi, using the spdistance command in Stata/MP 15.1; and manually set Guangxi, which is closer to Hainan, as a neighbour of Hainan. W(2) and its row-standardized form is defined as:
W ( 2 ) : w i j c = { 1 , share   a   border   or   a   vertex 0 , else w i j c = { w i j d j = 1 n w i j d , share   a   border   or   a   vertex 0 , else

5.2. Exploratory Spatial Data Analysis

To detect global spatial autocorrelation (GSA) in broiler price, before estimating spatial models, we calculate Moran’s global index of spatial autocorrelation I (Moran’s I, hereinafter referred to as MI) [98]:
M I = n i = 1 n j = 1 n w i j ( ln b r o i l e r i ln b r o i l e r ¯ ) ( ln b r o i l e r j ln b r o i l e r ¯ ) i = 1 n j = 1 n w i j i = 1 n ( ln b r o i l e r i ln b r o i l e r ¯ ) 2 = i = 1 n j = 1 n w i j ( ln b r o i l e r i ln b r o i l e r ¯ ) ( ln b r o i l e r j ln b r o i l e r ¯ ) S 2 i = 1 n j = 1 n w i j
where n is sample size; lnbroileri and lnbroilerj are broiler price in provinces i and j, respectively; S 2 = 1 n i = 1 n ( ln b r o i l e r i ln b r o i l e r ¯ ) 2 is variance of lnbroileri or lnbroilerj; ln b r o i l e r ¯ = 1 n i = 1 n ln b r o i l e r i is mean of lnbroileri or lnbroilerj; and each entry wijW represents the spatial weight associated to provinces i and j. MI takes values on the interval [−1,1]: MI > 0 indicates positive spatial autocorrelation—nearby regions tend to exhibit similar values of lnbroiler, that is, high value adjacent to high value, low value adjacent to low value; MI < 0 indicates negative spatial autocorrelation—nearby regions tend to exhibit dissimilar values of lnbroiler, that is, high value adjacent to low value; and MI = 0 indicates spatial randomness—nearby regions tend to exhibit random values of lnbroiler, that is, no spatial autocorrelation. We also calculate Z, the standardized form of MI:
Z = M I E ( M I ) V a r ( M I ) N ( 0 , 1 )
where Z follows an asymptotic standard normal distribution; E(MI) is expected value; and Var(MI) is variance.
Table 6 reports global spatial autocorrelation (GSA) in lnbroiler spanning November 2004–November 2017. MI that are significant at 10% or better are all positive. This shows that there is positive spatial autocorrelation in broiler price across provinces, namely, broiler prices in nearby provinces are similar to each other, which coincides with Han and Xu [99] based on annual spatial panel data, implying that spatial effects should not be ignored and the overall price risk of China’s broiler market is positively spatially autocorrelated across regions.
To further detect local spatial autocorrelation (LSA) in broiler price, public opinion, poultry infection and human infection, Figure 5 displays the Moran scatterplots [100] of lnbroiler, lnbaidu, pai and hai in May 2017, using Moran’s local index of spatial autocorrelation Ii (Moran’s Ii) [101] and Table 7 reports the corresponding local spatial autocorrelation (LSA) in lnbroiler, lnbaidu, pai and hai in May 2017. Table 7 consists of four panels: (i) Panel A of Table 7 presents LSA in broiler price (lnbroiler); (ii) Panel B of Table 7 presents LSA in public opinion (lnbaidu); (iii) Panel C of Table 7 presents LSA in dummy for poultry infection with avian influenza cases (pai); and (iv) Panel D of Table 7 presents LSA in dummy for human infection with avian influenza cases (hai). Moran’s Ii, the decomposition of Moran’s I into the contribution of each observation, is defined as follows:
I i = j = 1 N w i j s t d ( ln b r o i l e r i ln b r o i l e r ¯ σ ln b r o i l e r ) ( ln b r o i l e r j ln b r o i l e r ¯ σ ln b r o i l e r )
where σlnbroiler denotes the standard deviation of lnbroiler; and w i j s t d denotes the elements of a row-standardized spatial weights matrix, with w i i s t d = 0 . We choose May 2017 as the sample month because a major avian influenza epidemic, with both poultry and human infection, hit China in the first half of 2017 [20,60,66,67], which offers an ideal case for examining local spatial autocorrelation (LSA) in broiler price, public opinion, poultry infection and human infection.
First, according to Panel (a) Broiler Price of Figure 5 and Table 7, in May 2017, globally, Moran’s I of broiler price is significantly positive at 5%. Locally, Guangdong, Hainan, Guizhou and Yunnan are in the upper right quadrant (High-High), indicating spatial clustering of high broiler price (hot spot); Hubei is in the upper left quadrant (Low-High), indicating low broiler price surrounded by high neighbouring broiler price; Beijing, Tianjin, Hebei, Shandong, Henan and Shaanxi are in the lower left quadrant (Low-Low), indicating spatial clustering of low broiler price (cold spot); Shanxi and Jiangxi are in the lower right quadrant (High-Low), indicating high broiler price surrounded by low broiler price.
Second, according to Panel (b) Public Opinion of Figure 5 and Table 7, in May 2017, globally, Moran’s I of public opinion is significantly positive at 5%. Locally, Hebei, Shanxi and Shaanxi are in the upper right quadrant (High-High), indicating spatial clustering of high public opinion (hot spot); Inner Mongolia is in the upper left quadrant (Low-High), indicating low public opinion surrounded by high neighbouring public opinion.
Third, according to Panel (c) Poultry Infection of Figure 5 and Table 7, in May 2017, globally, Moran’s I of poultry infection is statistically insignificant at 10%. Locally, Hebei, Henan and Shaanxi are in the upper right quadrant (High-High), indicating spatial clustering of outbreak of poultry infection (hot spot); Shanxi and Shandong are in the upper left quadrant (Low-High), indicating no outbreak of poultry infection surrounded by outbreak of neighbouring poultry infection.
Finally, according to Panel (d) Human Infection of Figure 5 and Table 7, in May 2017, globally, Moran’s I of human infection is statistically insignificant at 10%. Locally, Shanxi, Henan and Shaanxi are in the upper right quadrant (High-High), indicating spatial clustering of outbreak of human infection (hot spot); Shanghai, Jiangxi and Ningxia are in the upper left quadrant (Low-High), indicating no outbreak of human infection surrounded by outbreak of neighbouring human infection; Liaoning, Jilin and Heilongjiang are in the lower left quadrant (Low–Low), indicating spatial clustering of no outbreak of human infection (cold spot); Guangxi is in the lower right quadrant (High-Low), indicating outbreak of human infection surrounded by no outbreak of human infection.
The test of local spatial autocorrelation (LSA) further implies that spatial effects should be considered.

5.3. Spatial Specification Tests

Before turning to our spatial estimates, we perform a series of spatial specification tests, as reported in Table 8. Table 8 consists of four panels: (i) Panel A of Table 8 presents regression coefficients of spatial models (β1–β11); (ii) Panel B of Table 8 presents spatial coefficients of spatial models (ρ and λ), temporal coefficients of spatial models (τ) and spatiotemporal coefficients of spatial models (ψ); (iii) Panel C of Table 8 presents direct and indirect marginal effects, including long-run direct effects, long-run spatial spillover effects, short-run direct effects and short-run spatial spillover effects of public opinion (lnbaidu) and squared public opinion (lnbaidu2) on broiler price (lnbroiler), respectively; and (iv) Panel D of Table 8 presents specification tests, including R2, log likelihood, AIC, BIC, p-value of Hausman test (Hausman_p) and p-value of Wald test (testSAR_p). Following Belotti, Hughes and Mortari [94], we estimate 5 types of spatial models, including SDM in Equation (8) (columns (1)–(2)), dynamic SDM in Equation (9) (columns (3)–(4)), SAR in Equation (10) (columns (5)–(6)), dynamic SAR in Equation (11) (columns (7)–(8)) and SAC in Equation (12) (columns (9)–(10)), by quasi-maximum likelihood (QML) estimators [102]. For each model, the first column reports the estimates including only the level term of public opinion, while the second column reports the estimates including both the level and quadratic terms of public opinion. Following the spatial model selection strategy described in LeSage and Pace [103], Elhorst [93] and Belotti, Hughes and Mortari [94], we conduct the following model selection exercises.
First, we conduct the model selection exercises between spatial models and non-spatial models using spatial coefficients [103,104], by testing if ρ = 0 and/or λ = 0 [94]. Test results show that both ρ and λ are significant statistically (p < 0.01) and economically, indicating that spatial models fit better than non-spatial models.
Second, we conducte model selection between fixed-effects (FE) spatial models and random-effects (RE) spatial models. We conduct the model selection exercises between FE and RE in SDM (columns (1)–(2)) and SAR (columns (5)–(6)), respectively, using Hausman’s specification test [87,94], by estimating the variance var(b-B) of the difference of the estimators by the difference var(b)-var(B) of the variances. Test results show that the null of difference in coefficients not systematic is strongly rejected (p < 0.001), indicating that FE fits better than RE in SDM and SAR.
Third, model selection between SDM and SAR. We conduct the model selection exercises between column (1) and column (5) and between column (2) and column (6), respectively, using Wald test [79], by testing if θ1 = θ2 = θ3 = θ4 = 0 given that ρ ≠ 0 [94]. Test results show that the null of θ = 0 is strongly rejected (p < 0.001), indicating that SDM fits better than SAR.
Fourth, model selection between dynamic spatial models and static spatial models. We conduct the model selection exercises between dynamic spatial models and static spatial models using temporal coefficients and spatiotemporal coefficients [103,104], by testing if τ = 0 and/or ψ = 0 [94]. Test results show that both τ and ψ are significant statistically (p < 0.01) and economically, indicating that dynamic spatial models fit better than static spatial models.
Finally, model selection between dynamic SDM and dynamic SAR. We conduct the model selection exercises between column (3) and column (7) and between column (4) and column (8), respectively, using certain criteria, by estimating R2 (larger is better), log likelihood (larger is better), Akaike’s information criteria (AIC) (smaller is better) and Schwarz’s Bayesian information criteria (BIC) (smaller is better) [88,94]. All test results except BIC point toward dynamic SDM, combined with the fact that SDM fits better than SAR, indicating that dynamic SDM fits better than dynamic SAR.
Collectively, we conclude that: (i) spatial models fit better than non-spatial models, further indicating that spatial effects should not be ignored; (ii) dynamic FE SDM fits first-best and dynamic FE SAR fits second-best, so we should select dynamic FE SDM as our primary spatial specification and dynamic FE SAR as an alternative spatial specification.

5.4. Spatial Estimates

More formally, we report spatial estimates also in Table 8. As discussed above, we focus on describing estimation results for dynamic FE SDM (columns (3)–(4)) and dynamic FE SAR (columns (7)–(8)) and where the estimates for dynamic FE SDM in columns (3)–(4) are the main concerns. Moreover, we include heteroskedasticity-robust standard errors clustered at the province-level to address the potential heteroskedasticity and autocorrelation issues [79,88,94].
First, in columns (3)–(4) and (7)–(8) of Table 8, poultry infection and human infection are both statistically insignificant, indicating that neither poultry infection nor human infection with avian influenza has a significant spillover to broiler price, consistent with that of Table 5; in columns (3) and (7), public opinion is significantly negative, indicating that public opinion has a negative spillover to broiler price (e.g., in column(3), with effect size of −0.01, which equals 1/2 of feed price (0.02), 1/5 of chick price (0.05), 1/12 of live chicken price (0.12), 1/3 of pork price (0.03) and 1/2 of poultry output (−0.02)), also consistent with that of Table 5. This lends further support to theoretical hypotheses H1–H2.
Second, in columns (4) and (8) of Table 8, squared public opinion is also significantly negative, indicating that the spillover of public opinion to broiler price is inverse U-shaped, consistent with that of Table 5; and the turning point values for lnbaidu in Table 8 (e.g., −1.61 in column (4)) are similar to that of Table 5 (−1.57 in column (8)). It implies that when public opinion is weaker than the turning point (e.g., −1.61 in column (4)), the marginal effect of public opinion on broiler price is positive and decreasing; and when public opinion is stronger than the turning point (e.g., −1.61 in column (4)), the marginal effect is negative and increasing. This lends further support to theoretical hypothesis H3.
Third, in columns (4) and (8) of Table 8, the mean lnbaidu (0.00) and median lnbaidu (0.00) are both on the right-hand side of the turning point of the inverse U-shape (e.g., −1.61 in column (4)), consistent with that of Table 5, combined with the fact that public opinion is significantly negative in columns (3)–(4) and (7)–(8). This lends further support to theoretical hypothesis H2 that, on average, public opinion on avian influenza has a negative spillover to broiler price, which is a special case of theoretical hypothesis H3 when public opinion is on average.
Fourth, in columns (4) and (8) of Table 8, it is worth noting that although squared public opinion is statistically significant, squared public opinion is seemingly economically insignificant (e.g., −0.00 in column (4)). However, following LeSage and Pace [103], Elhorst [104] and Shao and Su [105], investigators should use the estimated direct effects of the independent variables to test the hypothesis as to whether or not local spillovers exist, rather than the coefficient estimates of the independent variables (β); investigators should use the estimated indirect effects of the independent variables to test the hypothesis as to whether or not spatial spillovers exist, rather than the coefficient estimate of spatially lagged dependent variable (ρ) and/or the coefficients estimates of spatially lagged independent variables (θ). We will discuss this below.
Fifth, in columns (3)–(4) and (7)–(8) of Table 8, we test for the spatially lagged effects (ρ), temporally lagged effects (τ) and spatiotemporally lagged effects (ψ) of broiler price, respectively: (1) the spatial coefficients (ρ) are significantly positive (e.g., with effect size of 0.35 in column (4)), indicating positive spatial clustering of broiler price, which provides further support to the finding of Table 6 that the overall price risk of China’s broiler market is positively spatially autocorrelated across regions; (2) the temporal coefficients (τ) are significantly positive (e.g., with effect size of 0.78 in column (4)), indicating positive temporal path dependence in broiler price; (3) the spatiotemporal coefficients (ψ) are significantly negative (e.g., with effect size of −0.38 in column (4)), indicating negative spatiotemporal spillover of neighbouring broiler price in the previous period to local broiler price in the current period.
Finally, in columns (3)–(4) and (7)–(8) of Table 8, we compute long-run direct, long-run indirect (spatial spillover), short-run direct and short-run indirect (spatial spillover) marginal effects of public opinion on broiler price [94,104]:
Long - run   direct   effect = { [ ( 1 τ ) I ( ρ + ψ ) W ] 1 ( β k I N + θ k W ) } d ¯
Long - run   indirect   effect = { [ ( 1 τ ) I ( ρ + ψ ) W ] 1 ( β k I N + θ k W ) } r s u m ¯
Short - run   direct   effect = [ ( I ρ W ) 1 ( β k I N + θ k W ) ] d ¯
Short - run   indirect   effect = [ ( I ρ W ) 1 ( β k I N + θ k W ) ] r s u m ¯
where I denotes the identity matrix, the superscript d ¯ denotes the operator that calculates the mean diagonal element of a matrix, and the superscript r s u m ¯ denotes the operator that calculates the mean row sum of the non-diagonal elements. (i) Overall, direct and indirect (spatial spillover) effects of public opinion on broiler price that are statistically significant are all negative; and whether direct or indirect (spatial spillover), long-run effects are larger than short-run effects; (ii) On average, public opinion has a negative direct effect on local broiler price and an even larger negative indirect (spatial spillover) effect on nearby broiler price, which is three times as large as the direct effect (e.g., with long-run direct, long-run indirect (spatial spillover), short-run direct and short-run indirect (spatial spillover) effect sizes of −0.05, −0.15, −0.02 and −0.06, respectively, in column (3) of Table 8); (iii) In general, direct and indirect (spatial spillover) effects of squared public opinion on broiler price that are statistically significant are all negative, turning out to be inverse U-shaped; furthermore, it is worth noting that compared with the coefficient estimate of squared public opinion (β2) which is economically insignificant (e.g., −0.00 in column (4)), the estimated direct and indirect (spatial spillover) effects of squared public opinion that are statistically significant are more economically significant (e.g., with long-run direct, long-run indirect (spatial spillover), short-run direct and short-run indirect (spatial spillover) effect sizes of −0.02, −0.04, −0.01 and −0.02, respectively, in column (4)), indicating that the inverse U-shape is not spurious. This lends support to theoretical hypotheses H4–H5.
Collectively, we draw our main conclusions from this section. (i) Overall, whether direct or indirect (spatial spillover), long-run effects of public opinion on broiler price are larger than short-run effects; (ii) On average, public opinion on avian influenza has a negative direct effect on local broiler price and an even larger negative indirect (spatial spillover) effect on nearby broiler price, which is three times as large as the direct effect (e.g., with long-run direct, long-run indirect (spatial spillover), short-run direct and short-run indirect (spatial spillover) effect sizes of −0.05, −0.15, −0.02 and −0.06, respectively, in column (3) of Table 8), in accordance with theoretical hypothesis H4; (iii) In general, direct and indirect (spatial spillover) effects of public opinion on broiler price are all inverse U-shaped, in accordance with theoretical hypothesis H5.

6. Robustness Checks and Results

In this section, we perform robustness checks by using alternative spatial weighting matrix and alternative measurement of public opinion.

6.1. Robustness Checks on Alternative Spatial Weighting Matrix

We mainly use a squared inverse-distance spatial weighting matrix W(1) to characterize the spatial relationships between provinces and here we use queen contiguity spatial weighting matrix W(2) for robustness (Table 9). Table 9 consists of four panels: (i) Panel A of Table 9 presents regression coefficients of spatial models (β1–β11); (ii) Panel B of Table 9 presents spatial coefficients of spatial models (ρ and λ), temporal coefficients of spatial models (τ) and spatiotemporal coefficients of spatial models (ψ); (iii) Panel C of Table 9 presents direct and indirect marginal effects, including long-run direct effects, long-run spatial spillover effects, short-run direct effects and short-run spatial spillover effects of public opinion (lnbaidu) and squared public opinion (lnbaidu2) on broiler price (lnbroiler), respectively; and (iv) Panel D of Table 9 presents specification tests, including R2, log likelihood, AIC, BIC, p-value of Hausman test (Hausman_p) and p-value of Wald test (testSAR_p). We estimate spatial models, including SDM in Equation (8), dynamic SDM in Equation (9), SAR in Equation (10), dynamic SAR in Equation (11) and SAC in Equation (12), respectively, using alternative spatial weighting matrix. Again, following the spatial model selection strategy described in Elhorst [93] and Belotti, Hughes and Mortari [94], dynamic FE SDM (columns (3)–(4) of Table 9) still fits first-best and dynamic FE SAR (columns (7)–(8) of Table 9) still fits second-best, which coincides with that of Table 8. Therefore, we focus on describing estimation results for dynamic FE SDM and dynamic FE SAR and in which the estimates in columns (3)–(4) are the main concern.
First, in columns (3)–(4) and (7)–(8) of Table 9, neither poultry infection nor human infection with avian influenza has a significant spillover to broiler price; in columns (3) and (7), public opinion has a negative spillover to broiler price; both of which are consistent with that of Table 5 and Table 8.
Second, in columns (4) and (8), the spillover of public opinion to broiler price is inverse U-shaped, consistent with that of Table 5 and Table 8; and the turning point values for lnbaidu in columns (4) and (8) of Table 9 are similar to that of Table 5 and Table 8.
Third, in columns (3)–(4) and (7)–(8), the sign, statistical and economic significance of spatially lagged effect (ρ), temporally lagged effect (τ) and spatiotemporally lagged effect (ψ) are consistent with that of Table 8.
Finally, in columns (3)–(4) and (7)–(8), taken together, roughly, whether in the short-run or long-run, the direct effects and spatial spillover effects of public opinion to broiler price, on average, are negative (columns (3) and (7)); while the direct effects and spatial spillover effects, in general, are inverse U-shaped (columns (4) and (8)); all of which are consistent with that of Table 8.
Therefore, our spatial estimates in Table 8 are robust to alternative spatial weighting matrix.

6.2. Robustness Checks on Alternative Measurement of Public Opinion

We mainly use Baidu search volume to measure public opinion and here we use Google search volume for robustness (Table 10). Table 10 consists of four panels: (i) Panel A of Table 10 presents regression coefficients of spatial models (β1–β11); (ii) Panel B of Table 10 presents spatial coefficients of spatial models (ρ and λ), temporal coefficients of spatial models (τ) and spatiotemporal coefficients of spatial models (ψ); (iii) Panel C of Table 10 presents direct and indirect marginal effects, including long-run direct effects, long-run spatial spillover effects, short-run direct effects and short-run spatial spillover effects of Google opinion (lngoogle) and squared Google opinion (lngoogle2) on broiler price (lnbroiler), respectively; and (iv) Panel D of Table 10 presents specification tests, including R2, log likelihood, AIC, BIC, p-value of Hausman test (Hausman_p) and p-value of Wald test (testSAR_p). We estimate spatial models, including SDM in Equation (8), dynamic SDM in Equation (9), SAR in Equation (10), dynamic SAR in Equation (11) and SAC in Equation (12), respectively, using alternative measurement of public opinion. Once again, following the spatial model selection strategy described in Elhorst [93] and Belotti, Hughes and Mortari [94], dynamic FE SDM (columns (3)–(4) of Table 10) still fits first-best and dynamic FE SAR (columns (7)–(8) of Table 10) still fits second-best, which coincides with that of Table 8. Therefore, we focus on describing estimation results for dynamic FE SDM and dynamic FE SAR and in which the estimates in columns (3)–(4) are the main concern.
First, in columns (3)–(4) and (7)–(8) of Table 10, neither poultry infection nor human infection with avian influenza has a significant spillover to broiler price, consistent with that of Table 5 and Table 8; although in column (3) the spillover of public opinion to broiler price is insignificant, in column (7) public opinion does have a negative spillover to broiler price, roughly consistent with that of Table 8.
Second, in columns (4) and (8), the spillover of public opinion to broiler price is inverse U-shaped, consistently with that of Table 5 and Table 8.
Third, in columns (3)–(4) and (7)–(8), the sign, statistical and economic significance of spatially lagged effect (ρ), temporally lagged effect (τ) and spatiotemporally lagged effect (ψ) are consistent with that of Table 8.
Finally, in columns (3)–(4) and (7)–(8), taken together, roughly, whether in the short-run or long-run, the direct effects and spatial spillover effects of public opinion to broiler price, on average, are negative (columns (3) and (7)); while the direct effects and spatial spillover effects, in general, are inverse U-shaped (columns (4) and (8)); all of which are consistent with that of Table 8.
Therefore, our spatial estimates in Table 8 are robust to alternative measurement of public opinion.

7. Discussion

In this section, we provide discussion on our results and findings from the perspective of previous studies and our theoretical hypotheses.

7.1. Avian Influenza Outbreak, Public Opinion, and Broiler Price Risk Spillover: Hypotheses H1–H2

From Table 5 and Table 8 we find that, neither poultry infection nor human infection with avian influenza outbreak has a significant spillover to broiler price; public opinion on avian influenza has a negative spillover to broiler price and the effect size of public opinion on broiler price (−0.04) is 1/4 of the effect size of poultry meat consumption in cities and towns (0.16), 1/5 of chick price (0.21), 1/10 of live chicken price (0.38) and 1/3 of pork price (0.14) (column (7) of Table 5). Our findings are in accordance with theoretical hypotheses H1–H2.
Our finding that neither poultry infection nor human infection with avian influenza outbreak has a significant spillover to broiler price is consistent with very few papers such as Han and Xu [99], finding that avian influenza epidemic has no significant impact on broiler price using annual panel data, whereas we differentiate between poultry infection and human infection using long monthly panel data which captures spillover effects much more accurately; however, our finding appears inconsistent with most previous studies that avian influenza epidemic has a significant impact on broiler price [11,12,106,107,108]. The seemingly inconsistency could be because most previous literature treat avian influenza epidemic as a whole; whereas we decompose avian influenza epidemic into two components: avian influenza outbreak (incident component) and public opinion on avian influenza (information and communication component), to capture the mechanism of avian influenza outbreak, public opinion, and broiler price risk spillover. We find that it is public opinion on avian influenza, not avian influenza outbreak, that directly causes broiler price risk. In this sense, our findings are roughly consistent with the previous literature.
Our finding that public opinion has a spillover to broiler price, is roughly in line with Bing, Chan and Ou [109] that stock price can be predicted based on analysing public opinion as reflected in Twitter data, Zhang and Qi [110] that during corporate crisis public opinion has a negative impact on the stock price of the corporate, Pagolu et al. [111] that a strong correlation exists between the rise and falls in stock prices with the public opinion in tweets and Yu, Wang and Zhang [112] that public opinion has a significant impact on stock price in the short-run, all of which focus on impact of public opinion on stock price in financial economics; whereas we focus on spillover of public opinion to broiler price in agricultural economics.
Further, our finding that public opinion on avian influenza has a negative spillover to broiler price, is consistent with Hassouneh et al. [12] that avian influenza epidemic has a different impact between marketing margins and wholesaler margins on vertical price transmission in the Egyptian poultry sector using avian influenza food scare information index to reflect consumer awareness of the crisis, Mutlu, Serra and Gil [19] that avian influenza epidemic has a different impact between producer and retail levels on vertical price transmission in the Turkish poultry market using avian influenza information index variable to determine regime-switching and Zheng and Ma [20] that avian influenza epidemic has a dynamic negative impact on China broiler price using Baidu index to reflect variance and intensity of the epidemic, all of which use time-series index to represent the magnitude of the influence of an avian influenza epidemic with time series data; whereas we use provincial Baidu search volume to measure public opinion on avian influenza with panel data which can reduce the omitted variable bias, distinguish between avian influenza outbreak (incident component) and public opinion on avian influenza (information and communication component) and compare their impacts on broiler price.
When avian influenza epidemic outbreaks, poultry infection, poultry death, poultry destroying and circulation control result in broiler supply reduction. For broiler demand, we consider two cases: (i) if avian influenza outbreak is not intensively covered by news and social media, after being initially released during first-step flow [47], it may not attract sufficient public attention [35] and limited public attention [49] may lead to public underreaction [113], resulting in limited broiler demand reduction; limited broiler demand reduction offsets broiler supply reduction, therefore, avian influenza outbreak has no significant spillover to broiler price, lending support to theoretical hypothesis H1. (ii) If avian influenza outbreak is intensively covered by news and social media, who act as opinion leader [50] and spreads avian influenza information during second-step flow [52], massive public opinion may attract excessive public attention and clustered public behavioural bias [53] may lead to public overreaction [54], resulting in excessive broiler demand reduction; excessive broiler demand reduction exceeds broiler supply reduction, therefore, on average, public opinion on avian influenza has a negative spillover to broiler price, lending support to theoretical hypothesis H2.

7.2. Nonlinear Spillover of Public Opinion to Broiler Price Risk: Hypothesis H3

From Table 5 and Table 8 we also see that there is an inverse U-shaped relationship between broiler price and public opinion; mean public opinion (0.00) and median public opinion (0.00) are both on the right-hand side of the turning point (−1.57) of the inverse U-shape (column (8) of Table 5); therefore, on average, public opinion exerts negative price pressure on broiler market and the marginal effect increases; but when public opinion is weaker than the turning point, it increases broiler price instead and the marginal effect decreases. Our findings are in accordance with theoretical hypothesis H3.
Our finding, that public opinion on avian influenza has a nonlinear spillover to broiler price, appears roughly consistent with Hassouneh et al. [12] that avian influenza epidemic has a nonlinear impact on price transmission along the Egyptian poultry marketing chain and Mutlu, Serra and Gil [19] that avian influenza epidemic has a nonlinear impact on price transmission at producer and retail levels, both of which develop and use avian influenza food scare information index to reflect consumer awareness of the crisis; whereas we decompose avian influenza epidemic into avian influenza outbreak and public opinion and argue that it is actually public opinion on avian influenza that has a nonlinear inverse U-shaped relationship with broiler price.
Our finding is also consistent with Bollen, Mao and Zeng [114] that measurements of collective mood states derived from large-scale Twitter feeds are correlated nonlinearly to the value of the Dow Jones Industrial Average (DJIA) over time, implying that public opinion has a nonlinear impact on stock price transmission using time-series data; whereas we analyse nonlinear spillover of public opinion to broiler price using long provincial panel data.
Moreover, prior studies focus mainly on the nonlinear price transmission using time-series data, where they explore the nonlinear relationship between price and time, that is, the nonlinear marginal effect of time on price [12,19,114]; however, our study focuses mainly on the nonlinear price risk spillover using long provincial panel data, where we explore the nonlinear relationship between price and public opinion, that is, the nonlinear marginal effect of public opinion on price.
As we use the dressed broiler price to measure broiler price (see Table 1), for the consumption combination of live chicken and dressed broiler, we assume that consumers’ preferences [115] for live chicken and dressed broiler can be substituted for each other. When avian influenza epidemic outbreaks, we consider two cases: (i) if public opinion [51] on avian influenza is not that strong (i.e., weaker than the turning point); consumers reduce consumption demand for live chicken due to high risk perception [116] that live chicken consumption may cause infection with avian influenza; meanwhile, to maintain the same utility level, consumers increase consumption demand for dressed broiler due to low risk perception that dressed boiler may be safer to consume than live chicken, leading to an increase of dressed broiler price; with the gradual increase of public opinion, consumers’ risk perception of dressed broiler increases; although consumption demand for dressed broiler still increases, its growth rate decreases, which results in an increasing but marginal decreasing broiler price; (ii) If public opinion on avian influenza is strong (i.e., stronger than the turning point), second-step flow [52] of public opinion causes high pubic attention, high public attention arouses public overreaction, public overreaction brings about higher public attention and higher public attention gives rise to stronger public overreaction along with herd behaviour [117], leading to positive feedback of increasingly negative pressure of public opinion on dressed broiler price, which results in an decreasing but marginal increasing broiler price. This lends support to theoretical hypothesis H3.

7.3. Nonlinear Spatial Spillover of Public Opinion to Broiler Price Risk: Hypotheses H4–H5

From Table 8 we further find that, overall, whether direct or indirect (spatial spillover), long-run effects of public opinion on broiler price are larger than short-run effects; on average, public opinion on avian influenza has a negative direct effect on local broiler price and an even larger negative indirect (spatial spillover) effect on nearby broiler price, which is three times as large as the direct effect (e.g., with long-run direct, long-run indirect (spatial spillover), short-run direct and short-run indirect (spatial spillover) effect sizes of −0.05, −0.15, −0.02 and −0.06, respectively, in column (3) of Table 8); while in general, direct and indirect (spatial spillover) effects of public opinion on broiler price are all inverse U-shaped. Our findings are in accordance with theoretical hypotheses H4–H5.
Our finding that public opinion on avian influenza has a spatial spillover to broiler price, is roughly in line with You and Diao [33] that the negative impact of an avian influenza epidemic on poultry production is unevenly distributed in Nigeria and Djunaidi and Djunaidi [32] that avian influenza epidemic in the United States, Economic Union and Brazil have a greater impact on world poultry export prices than other countries, both of which show preliminary spatial heterogeneity of the impact of an avian influenza epidemic on poultry production and price; whereas we focus on spatial dependence and explore spatial spillover of public opinion on avian influenza to broiler price.
Given that media coverage [118] and public opinion [51] spread across provinces widely and rapidly, when avian influenza epidemic outbreaks, the epidemic is initially released by authorities during first-step flow [47], during which the epidemic attracts only limited public attention [49]; after being covered by news and social media during second-step flow [52], public opinion on avian influenza attracts excessive public attention [35] locally and nearby, which causes public behavioural bias [53], leading to widespread public overreaction [54], resulting in negative direct pressure on local broiler price and greater negative spatial spillover to nearby broiler price due to rapid spread and agglomeration of public opinion on avian influenza across provinces, both of which are marginal increasing, namely, inverse U-shaped in general. Overall, whether direct effects or spatial spillover effects, long-run effects are greater than short-run effects, reflecting that public opinion on avian influenza has a sustained negative spillover effect and an increasing marginal effect on broiler price in local and nearby provinces, where the negative pressure on broiler price aggravates over time. This lends support to theoretical hypotheses H4–H5.

8. Conclusions and Implications

8.1. Conclusions

In the age of big data, epidemic animal disease poses a real threat to the sustainability of livestock markets worldwide and the threat could be exacerbated with increased intensity of public opinion, which may even exceed the direct impact of the outbreak itself; furthermore, the exacerbated threat associated with public opinion on the epidemic might spill over to neighbouring markets, resulting in global livestock market risk.
In this article, we set out to identify the price risk spillover of avian influenza to broiler market, from the perspective of public opinion, in measurement, theoretically and empirically, using big data techniques. Our article contributes to the literatures on the risk spillover of animal disease to global livestock and poultry market in several ways.
First, in measurement, unlike most of the existing literature, where avian influenza epidemic is measured as a whole, we decompose avian influenza epidemic into two components: avian influenza outbreak (incident component) and public opinion on avian influenza (information and communication component); by further decomposing avian influenza outbreak into poultry infection with avian influenza outbreak and human infection with avian influenza outbreak, we measure poultry infection with avian influenza outbreak (incident component) with hand-collected data from Official Veterinary Bulletin, measure human infection with avian influenza outbreak (incident component) with hand-collected data from Disease Surveillance and measure public opinion on avian influenza (information and communication component) with hand-collected data from Baidu Search and Google Search. In the era of big data, the impact of public opinion on market price risk cannot be neglected and measuring public opinion using search volume techniques facilitates the analysis in a global context.
Second, theoretically, following Hong and Stein [30] and Li et al. [31], we introduce the theory of limited attention and two-step flow of communication and develop a new analytical framework to capture the causal mechanism of avian influenza outbreak, public opinion, and broiler price risk spillover; we show that it is actually public opinion on avian influenza, not avian influenza outbreak itself, that directly causes broiler price risk; therefore, it is important to distinguish between these two components because they differ in terms of their spillovers to broiler price risk. Our new analytical framework extends the existing framework to allow for heterogeneous impacts on global livestock market between outbreak itself and public opinion.
Finally, empirically, using a long panel data set covering 30 China’s provinces spanning November 2004–November 2017, we identify the causal mechanism of avian influenza outbreak, public opinion, and broiler price risk spillover, and further analyse the nonlinear spatial spillover of public opinion on avian influenza to broiler price risk. The spatial estimates are robust to alternative spatial weighting matrix and alternative measurement of public opinion. Our empirical approach could potentially be applied to global research on livestock market risk caused by epidemic animal disease.
Collectively, our research highlights the importance of studying information and communication, particularly the role of public opinion in amplifying price risk during second-step flow of communication, when analysing the impact of avian influenza on global broiler market.
Specifically, we document four stylized facts.
(i) Neither poultry infection nor human infection with avian influenza outbreak has a significant spillover to broiler price; public opinion on avian influenza has a negative spillover to broiler price and the effect size of public opinion on broiler price is 1/4 of the effect size of poultry meat consumption in cities and towns 1/5 of chick price 1/10 of live chicken price and 1/3 of pork price. Our finding speaks to the large empirical literature on the impact of avian influenza on the poultry market [11,12,106,107,108]; however, this literature highlights that public opinion on avian influenza plays a key role in amplifying price risk during second-step flow of communication, whereas avian influenza outbreak alone does not directly cause poultry price risk, suggesting that information and communication should not be overlooked when identifying the effect of epidemic animal disease on macroeconomic outcomes. Moreover, our finding offers a fresh perspective on global livestock market risk right after substantial media coverage.
(ii) There is an inverse U-shaped relationship between broiler price and public opinion; mean and median public opinion are both on the right-hand side of the turning point of the inverse U-shape; therefore, on average, public opinion exerts negative price pressure on broiler market and the marginal effect increases; but when public opinion is weaker than the turning point, it increases broiler price instead and the marginal effect decreases. Our finding contributes to prior work on nonlinear impact of avian influenza on poultry price transmission using time-series data [12,19], by examining nonlinear spillover of public opinion on avian influenza to broiler price risk using long provincial panel data, suggesting a strong inverse U-shaped pattern. Furthermore, our finding provides new insights into the aggravating price pressure on global livestock market along with increased public opinion on food safety.
(iii) The spatial coefficients of broiler price are significantly positive, indicating positive spatial clustering of broiler price, implying that the overall price risk of broiler market is positively spatially autocorrelated across regions; the temporal coefficients of broiler price are significantly positive, indicating positive temporal path dependence in broiler price; the spatiotemporal coefficients of broiler price are significantly negative, indicating negative spatiotemporal spillover of neighbouring broiler price in the previous period to local broiler price in the current period. Our finding complements the recent work by Han and Xu [99] who also found a positive spatial autocorrelation in broiler price using yearly static spatial panel; whereas our work further explores the positive temporal and negative spatiotemporal lagged effects of broiler price risk using monthly dynamic spatial panel. Besides, our finding can be extrapolated to global contexts, for interpreting spatial and temporal autocorrelation in worldwide livestock market risk.
(iv) Overall, whether direct or spatial spillover, long-run effects of public opinion on broiler price are larger than short-run effects; on average, public opinion on avian influenza has a negative direct effect on local broiler price and an even larger negative spatial spillover effect on nearby broiler price, which is three times as large as the direct effect; while in general, direct and spatial spillover effects of public opinion on broiler price are all inverse U-shaped. Our finding adds to an existing literature documenting preliminary spatial heterogeneity in impact of avian influenza to poultry market [29,32,33], by further identifying the short-run and long-run direct effects and spatial spillover effects of public opinion on avian influenza on broiler price risk, suggesting that public opinion on avian influenza poses an even larger negative price pressure on nearby poultry market compared to local market and the price pressure of both local and nearby markets aggravates along with increased public opinion. In addition, our finding implies that incident such as epidemic animal disease not only impacts local livestock market but may also threaten global market via the spatial spillover effects of public opinion and the neighbouring market might bear even larger price risk than the local market.

8.2. Implications

Our article produces some main implications for a global context, theoretically and practically.
First, theoretically, our article provides new insights into the mechanism of price risk spillover of animal disease to global livestock and poultry market, by highlighting the importance of studying public opinion in amplifying price risk during second-step flow of communication.
Second, practically, in a global perspective, our article might further indicate that: (i) facing global epidemic animal disease, official media should shoulder the responsibility of being the “opinion leader”, leading public opinion on global epidemic animal disease to behave more rationally, so as to mitigate the negative spillover of public opinion to livestock and poultry price; (ii) authorities should closely monitor public opinion on global epidemic animal disease when it is approaching or exceeding the “turning point”, in case of the increasing negative marginal effect of public opinion on livestock and poultry price on the right-hand side of the inverse U-shape; (iii) agricultural insurance companies may design targeted livestock and poultry price insurance products, by accounting for public opinion on epidemic animal disease in neighbouring areas or countries and thus, by forecasting local price risk, given the “spatial spillover” of public opinion to livestock and poultry price globally.

8.3. Future Research

There are several promising directions for future research:
(i) We include squared public opinion to capture the inverse U-shaped relationship between broiler price and public opinion and future work might extend the quadratic function to unconditional quantile regression (UQR) [119] or panel threshold model [120] to further explore possible nonlinearities in the relationship.
(ii) We analyse the spatial spillover of public opinion on avian influenza to broiler price and future work may further explore the regional damping boundary of the spatial spillover effects of public opinion on broiler price, following Shao and Su [105].
(iii) We model the spatial spillover of public opinion to broiler price using SDM, dynamic SDM, SAR, dynamic SAR and SAC and future work could further model spatial heterogeneity using geographically weighted regression (GWR) [121] or other approaches.
(iv) We develop our analytical framework by introducing the theory of limited attention [35] and two-step flow of communication [36] and design the research using big data techniques [69,70,71,72], both from a global perspective; whereas we conduct our baseline and spatial analysis based on evidence from China’s interprovincial broiler markets and future work can move to global evidence, by further testing for the potential spatial spillover effects of public opinion on cross-border livestock and poultry markets.

Author Contributions

Conceptualization, L.Y.; Formal analysis, L.Y.; Funding acquisition, J.T.; Methodology, L.Y.; Project administration, L.Y. and J.T.; Software, L.Y.; Supervision, J.T.; Validation, L.Y.; Visualization, L.Y.; Writing—original draft, L.Y.; Writing—review & editing, L.Y., J.T., C.T. and Z.Z.

Funding

This research is funded by the National Natural Science Foundation of China (grant numbers 71773033, 71173086) and the APC is funded by the Innovation Fund from Huazhong Agricultural University (grant number 2662016PY080).

Acknowledgments

We are grateful for comments and suggestions that substantially improved the article from the editor (Caitlyn Xi) and two anonymous referees. We are grateful to the National Natural Science Foundation of China (grant numbers 71773033, 71173086) and the Innovation Fund from Huazhong Agricultural University (grant number 2662016PY080), for generous funding.

Conflicts of Interest

The authors declare no conflict of interest.

References

  1. Li, K.S.; Guan, Y.; Wang, J.; Smith, G.J.D.; Xu, K.M.; Duan, L.; Rahardjo, A.P.; Puthavathana, P.; Buranathai, C.; Nguyen, T.D.; et al. Genesis of a highly pathogenic and potentially pandemic H5N1 influenza virus in eastern Asia. Nature 2004, 430, 209–213. [Google Scholar] [CrossRef] [PubMed]
  2. Aengwanich, W. Farm models and eco-health of poultry production clusters (PPCs) following avian influenza epidemics in Thailand. Sustainability 2014, 6, 2300–2319. [Google Scholar] [CrossRef]
  3. Garten, R.J.; Davis, C.T.; Russell, C.A.; Shu, B.; Lindstrom, S.; Balish, A.; Sessions, W.M.; Xu, X.Y.; Skepner, E.; Deyde, V.; et al. Antigenic and genetic characteristics of swine-origin 2009 A(H1N1) influenza viruses circulating in humans. Science 2009, 325, 197–201. [Google Scholar] [CrossRef] [PubMed]
  4. Zhou, X.T.; Li, N.; Luo, Y.Z.; Liu, Y.; Miao, F.M.; Chen, T.; Zhang, S.F.; Cao, P.L.; Li, X.D.; Tian, K.G.; et al. Emergence of African swine fever in China, 2018. Transbound. Emerg. Dis. 2018, 65, 1482–1484. [Google Scholar] [CrossRef] [PubMed]
  5. Harvey, N.; Reeves, A.; Schoenbaum, M.A.; Zagmutt-Vergara, F.J.; Dub, C.; Hill, A.E.; Corso, B.A.; McNab, W.B.; Cartwright, C.I.; Salman, M.D. The North American Animal Disease Spread Model: A simulation model to assist decision making in evaluating animal disease incursions. Prev. Vet. Med. 2007, 82, 176–197. [Google Scholar] [CrossRef] [PubMed]
  6. Aradhyula, S.V.; Holt, M.T. Risk behavior and rational expectations in the U.S. broiler market. Am. J. Agric. Econ. 1989, 71, 892–902. [Google Scholar] [CrossRef]
  7. Holt, M.T.; Aradhyula, S.V. Price risk in supply equations: An application of GARCH time-series models to the U. S. broiler market. South. Econ. J. 1990, 57, 230–242. [Google Scholar] [CrossRef]
  8. Knoeber, C.R.; Thurman, W.N. Don’t count your chickens—Risk and risk shifting in the broiler industry. Am. J. Agric. Econ. 1995, 77, 486–496. [Google Scholar] [CrossRef]
  9. Goodhue, R.E. Broiler production contracts as a multi-agent problem: Common risk, incentives and heterogeneity. Am. J. Agric. Econ. 2000, 82, 606–622. [Google Scholar] [CrossRef]
  10. Nicita, A. Avian Influenza Poultry Trade; The World Bank: Washington, DC, USA, 2008. [Google Scholar]
  11. Saghaian, S.H.; Özertan, G.; Spaulding, A.D. Dynamics of price transmission in the presence of a major food safety shock: Impact of H5N1 avian influenza on the Turkish poultry sector. J. Agric. Appl. Econ. 2008, 40, 1015–1031. [Google Scholar] [CrossRef]
  12. Hassouneh, I.; Radwan, A.; Serra, T.; Gil, J.M. Food scare crises and developing countries: The impact of avian influenza on vertical price transmission in the Egyptian poultry sector. Food Policy 2012, 37, 264–274. [Google Scholar] [CrossRef]
  13. Cai, X.; Tao, J. The price fluctuation and its dynamic relations of the poultry industry chain under the influence of avian influenza. Res. Agric. Mod. 2017, 38, 267–274. [Google Scholar] [CrossRef]
  14. Neuman, W.R.; Guggenheim, L.; Jang, S.M.; Bae, S.Y. The dynamics of public attention: Agenda-setting theory meets big data. J. Commun. 2014, 64, 193–214. [Google Scholar] [CrossRef]
  15. Zhang, Y.J.; Song, W.X.; Shen, D.H.; Zhang, W. Market reaction to internet news: Information diffusion and price pressure. Econ. Model. 2016, 56, 43–49. [Google Scholar] [CrossRef]
  16. Huang, Z.; Wang, J. Economic impact of highly pathogenic avian influenza on broiler industry in China. J. Agric. Sci. Technol. 2016, 18, 189–199. [Google Scholar] [CrossRef]
  17. Liu, M.; Lu, Q. Study of farmers’ productive recovery behavior in avian-infected area under the shocks of avian influenza: A case study of Zhongwei in Ningxia. Issue Agric. Econ. 2016, 37, 40–50+111. [Google Scholar] [CrossRef]
  18. Zhou, L.; Liu, C. Study on vertical and horizontal transmission of broiler industry price under avian influenza risk. Stat. Decis. 2016, 93–96. [Google Scholar] [CrossRef]
  19. Camoglu, S.M.; Serra, T.; Gil, J.M. Vertical price transmission in the Turkish poultry market: The avian influenza crisis. Appl. Econ. 2015, 47, 1106–1117. [Google Scholar] [CrossRef]
  20. Zheng, Y.; Ma, J. The analysis of the dynamic impacts of avian influenza on livestock and poultry prices: Based on the TVP-VAR model. Res. Agric. Mod. 2018, 39, 751–760. [Google Scholar] [CrossRef]
  21. Wang, X.; Weldegebriel, H.T.; Rayner, A.J. Price transmission in vertically related markets. China Econ. Q. 2007, 885–898. [Google Scholar] [CrossRef]
  22. Turvey, C.G.; Onyango, B.; Cuite, C.; Hallman, W.K. Risk, fear, bird flu and terrorists: A study of risk perceptions and economics. J. Soc. Econ. 2010, 39, 1–10. [Google Scholar] [CrossRef]
  23. Liu, F.; Corcoran, C.P.; Tao, J.P.; Cheng, J. Risk perception, insurance recognition and agricultural insurance behavior—An empirical based on dynamic panel data in 31 provinces of China. Int. J. Disast. Risk Res. 2016, 20, 19–25. [Google Scholar] [CrossRef]
  24. Zhou, L.; Turvey, C.G.; Hu, W.Y.; Ying, R.Y. Fear and trust: How risk perceptions of avian influenza affect Chinese consumers’ demand for chicken. China Econ. Rev. 2016, 40, 91–104. [Google Scholar] [CrossRef]
  25. Huang, D.; Dong, L.; Wang, J. The impact of bird flu to China poultry industry and farmer’s income. Issue Agric. Econ. 2004, 0, 21–25. [Google Scholar] [CrossRef]
  26. Park, M.; Jin, Y.H.H.; Bessler, D.A. The impacts of animal disease crises on the Korean meat market. Agric. Econ. Blackwell 2008, 39, 183–195. [Google Scholar] [CrossRef]
  27. Liu, M.; Lu, Q. The random shocks of epidemic outbreak on fluctuations of eggs price in Xinjiang. China Soft Sci. 2013, 66–72. [Google Scholar]
  28. Dai, W.; Hu, H.; Yu, W. Analysis on cyclical fluctuations of China’s broiler market price in 2001–2013 and the impact of factors. J. Agrotech. Econ. 2014, 12–20. [Google Scholar]
  29. Liu, T.; Ying, R. Avian influenza risk, spatial heterogeneity and restoration of poultry farmers in China. Res. Agric. Mod. 2018, 39, 122–129. [Google Scholar] [CrossRef]
  30. Hong, H.; Stein, J.C. A unified theory of underreaction, momentum trading and overreaction in asset markets. J. Financ. 1999, 54, 2143–2184. [Google Scholar] [CrossRef]
  31. Li, J.; He, C.; Liao, D.; He, M. Opinion leadership, limited attention and overreaction. Econ. Res. J. 2018, 53, 126–141. [Google Scholar]
  32. Djunaidi, H.; Djunaidi, A.C.M. The economic impacts of avian influenza on world poultry trade and the U.S. poultry industry: A spatial equilibrium analysis. J. Agric. Appl. Econ. 2007, 39, 313–323. [Google Scholar] [CrossRef]
  33. You, L.Z.; Diao, X.S. Assessing the potential impact of avian influenza on poultry in West Africa: A spatial equilibrium analysis. J. Agric. Econ. 2007, 58, 348–367. [Google Scholar] [CrossRef]
  34. Gao, Q.; Song, C. A comparison of price spillover effects of livestock and poultry products in China: A whole industrial chain perspective. Chin. Rural Econ. 2016, 31–43. [Google Scholar]
  35. Kahneman, D. Attention and Effort; Prentice-Hall: Englewood Cliffs, NJ, USA, 1973; Volume 1063. [Google Scholar]
  36. Lazarsfeld, P.F.; Berelson, B.; Gaudet, H. The People’s Choice: How the Voter Makes Up His Mind in a Presidential Campaign; Columbia University Press: New York, NY, USA, 1944; Volume 3. [Google Scholar]
  37. Sun, S.; Sun, Q. Investor attention and market performance: Evidence based on “Xueqiu attention”. J. Manag. Sci. China 2018, 21, 60–71. [Google Scholar]
  38. Aboody, D.; Lehavy, R.; Trueman, B. Limited attention and the earnings announcement returns of past stock market winners. Rev. Acc. Stud. 2010, 15, 317–344. [Google Scholar] [CrossRef]
  39. Wang, C.; Xu, L. New development of researches on investor attention. J. Shanghai Univ. Financ. Econ. 2009, 11, 90–97. [Google Scholar] [CrossRef]
  40. Chen, X. Analyze fulcrum of two-step flow of communication. J. Xiamen Univer. (Arts Soc. Sci. ) 2013, 5, 142–148. [Google Scholar]
  41. Chen, C.-W.; Pantzalis, C.; Park, J.C. Press coverage and stock price deviation from fundamental value. J. Financ. Res. 2013, 36, 175–214. [Google Scholar] [CrossRef]
  42. He, C.; Liu, L.; Xu, X.; Wang, Z. Foreign intervention, exchange rate movements and stock price fluctuations—Theoretical model and empirical study based on investor’s heterogeneity. Econ. Res. J. 2013, 48, 29–42+97. [Google Scholar]
  43. Bushee, B.J.; Core, J.E.; Guay, W.; Hamm, S.J.W. The role of the business press as an information intermediary. J. Acc. Res. 2010, 48, 1–19. [Google Scholar] [CrossRef]
  44. Da, Z.; Engelberg, J.; Gao, P.J. In search of attention. J. Financ. 2011, 66, 1461–1499. [Google Scholar] [CrossRef]
  45. Dai, J.W.; Lu, C.; Qi, J.P. Corporate social responsibility disclosure and stock price crash risk: Evidence from China. Sustainability 2019, 11. [Google Scholar] [CrossRef]
  46. Peng, Y.; Zhang, Y.; Tang, Y.; Li, S.M. An incident information management framework based on data integration, data mining and multi-criteria decision making. Decis. Support. Syst. 2011, 51, 316–327. [Google Scholar] [CrossRef]
  47. Weimann, G. On the importance of marginality: One more step into the two-step flow of communication. Am. Sociol. Rev. 1982, 47, 764–773. [Google Scholar] [CrossRef]
  48. Hovland, C.I.; Weiss, W. The influence of source credibility on communication effectiveness. Pub. Opin. Q. 1951, 15, 635–650. [Google Scholar] [CrossRef]
  49. Hirshleifer, D.; Teoh, S.H. Limited attention, information disclosure and financial reporting. J. Accoun. Econ. 2003, 36, 337–386. [Google Scholar] [CrossRef]
  50. Nisbet, M.C.; Kotcher, J.E. A two-step flow of influence? Opinion-leader campaigns on climate change. Sci. Commun. 2009, 30, 328–354. [Google Scholar] [CrossRef]
  51. Gamson, W.A.; Modigliani, A. Media discourse and public opinion on nuclear power: A constructionist approach. Am. J. Sociol. 1989, 95, 1–37. [Google Scholar] [CrossRef]
  52. Troldahl, V.C. A field test of a modified “two-step flow of communication” model. Pub. Opin. Q. 1966, 30, 609–623. [Google Scholar] [CrossRef]
  53. Goetzmann, W.N.; Massa, M. Disposition Matters: Volume, Volatility and Price Impact of a Behavioral Bias; National Bureau of Economic Research: Cambridge, MA, USA, 2003. [Google Scholar]
  54. De Bondt, W.F.M.; Thaler, R.H. Further evidence on investor overreaction and stock market seasonality. J. Financ. 1987, 42, 557–581. [Google Scholar] [CrossRef]
  55. Mitchell, M.; Pulvino, T.; Stafford, E. Price pressure around mergers. J. Financ. 2004, 59, 31–63. [Google Scholar] [CrossRef]
  56. Hong, Y.M.; Liu, Y.H.; Wang, S.Y. Granger causality in risk and detection of extreme risk spillover between financial markets. J. Econ. 2009, 150, 271–287. [Google Scholar] [CrossRef]
  57. Tan, S. Response measures of veterinary department after human infection with H7N9 avian influenza. Livest. Poult. Ind. 2017, 28, 48–50. [Google Scholar] [CrossRef]
  58. Li, Z.; Hu, Z. Media and asset pricing: A literature review from the perspective of behavioral finance. China Rev. Financ. Stud. 2018, 10, 110–122. [Google Scholar]
  59. Sohlberg, J. The effect of elite polarization: A comparative perspective on how party elites influence attitudes and behavior on climate change in the European Union. Sustainability 2017, 9. [Google Scholar] [CrossRef]
  60. Xin, X.; Wang, J. Development report and policy suggestion on broiler industry in China in 2017. China Poult. 2018, 40, 68–72. [Google Scholar] [CrossRef]
  61. Li, S.; Li, S.; Kong, X. Empirical analysis on price transmission mechanism in agricultural industrial chain. Technol. Econ. 2010, 29, 108–112. [Google Scholar]
  62. Kahneman, D. Maps of bounded rationality: Psychology for behavioral economics. Am. Econ. Rev. 2003, 93, 1449–1475. [Google Scholar] [CrossRef]
  63. BenSaida, A. Herding effect on idiosyncratic volatility in US industries. Financ. Res. Lett. 2017, 23, 121–132. [Google Scholar] [CrossRef]
  64. Zhou, Y.; Chen, H. Construction of the evaluation system of network audiovisual information influences under multilevel communication path. Mod. Commun. (J. Commun. Univ. China) 2013, 35, 123–128. [Google Scholar]
  65. Moreno, R.; Paci, R.; Usai, S. Spatial spillovers and innovation activity in European regions. Environ. Plan. A 2005, 37, 1793–1812. [Google Scholar] [CrossRef]
  66. Zheng, Y.; Ma, J. Research on the state transition of broiler industry and asymmetric transmission of industrial chain price—Based on MS-VAR model. J. Huazhong Agric. Univ. (Soc. Sci. Ed.) 2018, 73–160. [Google Scholar] [CrossRef]
  67. Lu, Y.; Xu, P. Markov mechanism switch vector autoregressive model for chicken price fluctuation and its influence factors. China Poult. 2018, 40, 36–41. [Google Scholar] [CrossRef]
  68. Zhang, B.; Lin, J. Study on the consumers decision about chilled chicken with the perception of avian influenza risk: The effects of the cognitive and emotional mechanism. Res. Agric. Mod. 2017, 38, 772–782. [Google Scholar] [CrossRef]
  69. Li, X.; Yang, C.; Cao, J. Does network public opinion help mitigate haze pollution? Econ. Perspec. 2017, 45–57. [Google Scholar]
  70. Zheng, S.Q.; Wu, J.; Kahn, M.E.; Deng, Y.H. The nascent market for “green” real estate in Beijing. Eur. Econ. Rev. 2012, 56, 974–984. [Google Scholar] [CrossRef]
  71. Zheng, S.; Wan, G.; Sun, W.; Luo, D. The demand of the public and the control over the city environment. Manag. World 2013, 72–84. [Google Scholar] [CrossRef]
  72. Xu, Y. Whether informal environmental regulation from social pressure constraints on China’s industrial pollution? Financ. Trade Res. 2014, 25, 7–15. [Google Scholar] [CrossRef]
  73. Heller, S.B.; Shah, A.K.; Guryan, J.; Ludwig, J.; Mullainathan, S.; Pollack, H.A. Thinking, fast and slow? Some field experiments to reduce crime and dropout in Chicago. Q. J. Econ. 2017, 132, 1–54. [Google Scholar] [CrossRef] [PubMed]
  74. Levine, R.; Rubinstein, Y. Smart and illicit: Who becomes an entrepreneur and do they earn more? Q. J. Econ. 2017, 132, 963–1018. [Google Scholar] [CrossRef]
  75. Ponticelli, J.; Alencar, L.S. Court enforcement, bank loans and firm investment: Evidence from a bankruptcy reform in Brazil. Q. J. Econ. 2016, 131, 1365–1413. [Google Scholar] [CrossRef]
  76. Atkin, D.; Khandelwal, A.K.; Osman, A. Exporting and firm performance: Evidence from a randomized experiment. Q. J. Econ. 2017, 132, 551–615. [Google Scholar] [CrossRef]
  77. Yi, L.; Tao, J.; Tan, C. The impact mechanism of quality management practice on quality performance under the effect of supply chain relationship quality: Based on survey data from 448 Hubei enterprises. J. Bus. Manag. 2017, 39, 110–127. [Google Scholar] [CrossRef]
  78. Campante, F.; Yanagizawa-Drott, D. Long-range growth: Economic development in the global network of air links. Q. J. Econ. 2018, 133, 1395–1458. [Google Scholar] [CrossRef]
  79. Wooldridge, J.M. Introductory Econometrics: A Modern Approach; Cengage Learning: Boston, MA, USA, 2016. [Google Scholar]
  80. Levin, A.; Lin, C.F.; Chu, C.S.J. Unit root tests in panel data: Asymptotic and finite-sample properties. J. Econ. 2002, 108, 1–24. [Google Scholar] [CrossRef]
  81. Im, K.S.; Pesaran, M.H.; Shin, Y. Testing for unit roots in heterogeneous panels. J. Econ. 2003, 115, 53–74. [Google Scholar] [CrossRef]
  82. Choi, I. Unit root tests for panel data. J. Int. Money Financ. 2001, 20, 249–272. [Google Scholar] [CrossRef]
  83. Neuman, W.R. The threshold of public attention. Pub. Opin. Q. 1990, 54, 159–176. [Google Scholar] [CrossRef]
  84. Webster, J.G.; Ksiazek, T.B. The dynamics of audience fragmentation: Public attention in an age of digital media. J. Commun. 2012, 62, 39–56. [Google Scholar] [CrossRef]
  85. Soroka, S.N. Media, Public opinion and foreign policy. Harv. Inter. J. Press/Politics 2003, 8, 27–48. [Google Scholar] [CrossRef]
  86. Ramsey, J.B. Tests for specification errors in classical linear least-squares regression analysis. J. R. Stat. Soc. B 1969, 31, 350–371. [Google Scholar] [CrossRef]
  87. Hausman, J.A. Specification tests in econometrics. Econometrica 1978, 46, 1251–1271. [Google Scholar] [CrossRef]
  88. Stock, J.H.; Watson, M.W. Introduction to Econometrics; Pearson: London, UK, 2015. [Google Scholar]
  89. Greene, W.H. Econometric Analysis, 4th ed.; Prentice Hall: New Jersey, NJ, USA, 2000; pp. 201–215. [Google Scholar]
  90. Drukker, D.M. Testing for serial correlation in linear panel-data models. Stata J. 2003, 3, 168–177. [Google Scholar] [CrossRef]
  91. Wooldridge, J.M. Econometric Analysis of Cross Section and Panel Data; MIT Press: Cambridge, MA, USA, 2010. [Google Scholar]
  92. Altonji, J.G.; Elder, T.E.; Taber, C.R. Selection on observed and unobserved variables: Assessing the effectiveness of Catholic schools. J. Polit. Econ. 2005, 113, 151–184. [Google Scholar] [CrossRef]
  93. Elhorst, J.P. Applied spatial econometrics: Raising the bar. Spat. Econ. Anal. 2010, 5, 9–28. [Google Scholar] [CrossRef]
  94. Belotti, F.; Hughes, G.; Mortari, A.P. Spatial panel-data models using Stata. Stata. J. 2017, 17, 139–180. [Google Scholar] [CrossRef]
  95. Blanchflower, D.G.; Oswald, A.J. Is well-being U-shaped over the life cycle? Soc. Sci. Med. 2008, 66, 1733–1749. [Google Scholar] [CrossRef] [PubMed]
  96. Getis, A.; Aldstadt, J. Constructing the spatial weights matrix using a local statistic. Geogr. Anal. 2004, 36, 90–104. [Google Scholar] [CrossRef]
  97. Getis, A. Spatial weights matrices. Geogr. Anal. 2009, 41, 404–410. [Google Scholar] [CrossRef]
  98. Moran, P.A.P. Notes on continuous stochastic phenomena. Biometrika 1950, 37, 17–23. [Google Scholar] [CrossRef]
  99. Han, J.; Xu, L. Spatial econometric analysis of price fluctuation of broiler in China. Price Theory Pract. 2017, 6, 101–104. [Google Scholar]
  100. Anselin, L. The Moran Scatterplot as an ESDA Tool to Assess. Local Instability in Spatial Association; Regional Research Institute, West Virginia University: Morgantown, WV, USA, 1993. [Google Scholar]
  101. Anselin, L. Local indicators of spatial association—LISA. Geogr. Anal. 1995, 27, 93–115. [Google Scholar] [CrossRef]
  102. Lee, L.F. Asymptotic distributions of quasi-maximum likelihood estimators for spatial autoregressive models. Econometrica 2004, 72, 1899–1925. [Google Scholar] [CrossRef]
  103. LeSage, J.; Pace, R.K. Introduction to Spatial Econometrics; Boca Raton, FL, USA, 2009. [Google Scholar]
  104. Elhorst, J.P. Spatial Econometrics: From Cross-Sectional Data to Spatial Panels; Springer: Heidelberg, Germany, 2014; Volume 479. [Google Scholar]
  105. Shao, C.; Su, D. The spatial spillover effect of global value chain on productivity. China Ind. Econ. 2017, 94–114. [Google Scholar] [CrossRef]
  106. Rushton, J.; Viscarra, R.; Bleich, E.G.; Mcleod, A. Impact of avian influenza outbreaks in the poultry sectors of five South East Asian countries (Cambodia, Indonesia, Lao PDR, Thailand, Viet Nam) outbreak costs, responses and potential long term control. World Poult. Sci. J. 2005, 61, 491–514. [Google Scholar] [CrossRef]
  107. Brown, S.; Madison, D.; Goodwin, H.L.; Clark, F.D. The potential effects on United States agriculture of an avian influenza outbreak. J. Agric. Appl. Econ. 2007, 39, 335–343. [Google Scholar] [CrossRef]
  108. Paarlberg, P.L.; Seitzinger, A.H.; Lee, J.G. Economic impacts of regionalization of a highly pathogenic avian influenza outbreak in the United States. J. Agric. Appl. Econ. 2007, 39, 325–333. [Google Scholar] [CrossRef]
  109. Bing, L.; Chan, K.C.C.; Ou, C. Public Sentiment Analysis in Twitter Data for Prediction of a Company’s Stock Price Movements. In Proceedings of the 2014 IEEE 11th International Conference on e-Business Engineering, Guangzhou, China, 5–7 November 2014. [Google Scholar]
  110. Zhang, D.; Qi, J. Research on the stock price shock effects of the internet public opinion of enterprise’s emergency crisis incident based on Microblog. J. Intell. 2015, 34, 132–149. [Google Scholar] [CrossRef]
  111. Pagolu, V.S.; Reddy, K.N.; Panda, G.; Majhi, B. Sentiment Analysis of Twitter Data for Predicting Stock Market Movements. In Proceedings of the 2016 International Conference on Signal Processing, Communication, Power and Embedded System (SCOPES), Paralakhemundi, India, 3–5 October 2016. [Google Scholar]
  112. Yawen, Y.; Shanshan, W.; Lijun, Z. Stock Price Forecasting Based on BP Neural Network Model of Network Public Opinion. In Proceedings of the 2017 2nd International Conference on Image, Vision and Computing (ICIVC), Chengdu, China, 2–4 June 2017. [Google Scholar]
  113. Ikenberry, D.; Lakonishok, J.; Vermaelen, T. Market underreaction to open market share repurchases. J. Financ. Econ. 1995, 39, 181–208. [Google Scholar] [CrossRef]
  114. Bollen, J.; Mao, H.N.; Zeng, X.J. Twitter mood predicts the stock market. J. Comput. Sci. Neth. 2011, 2, 1–8. [Google Scholar] [CrossRef]
  115. Brown, C. Consumers’ preferences for locally produced food: A study in southeast Missouri. Am. J. Altern. Agric. 2003, 18, 213–224. [Google Scholar] [CrossRef]
  116. Slovic, P. Perception of risk. Science 1987, 236, 280–285. [Google Scholar] [CrossRef] [PubMed]
  117. Banerjee, A.V. A simple model of herd behavior. Q. J. Econ. 1992, 107, 797–817. [Google Scholar] [CrossRef]
  118. Fang, L.; Peress, J. Media coverage and the cross-section of stock returns. J. Financ. 2009, 64, 2023–2052. [Google Scholar] [CrossRef]
  119. Firpo, S.; Fortin, N.M.; Lemieux, T. Unconditional quantile regressions. Econometrica 2009, 77, 953–973. [Google Scholar] [CrossRef]
  120. Hansen, B.E. Threshold effects in non-dynamic panels: Estimation, testing and inference. J. Econ. 1999, 93, 345–368. [Google Scholar] [CrossRef]
  121. Fotheringham, A.S.; Brunsdon, C. Local forms of spatial analysis. Geogr. Anal. 1999, 31, 340–358. [Google Scholar] [CrossRef]
Figure 1. These figures present our analytical framework: (a) conceptual framework of decomposition of an avian influenza epidemic into avian influenza outbreak and public opinion; (b) causal framework of mechanism of avian influenza outbreak, public opinion, and broiler price risk spillover. Source: the analytical framework is originally developed by the authors, by introducing the theory of limited attention [35] and two-step flow of communication [36].
Sustainability 11 02358 g001
Figure 2. These figures report trends in lnbroiler (broiler price), lnbaidu (public opinion), pai (dummy for poultry infection with avian influenza outbreak) and hai (dummy for human infection with avian influenza outbreak) in avian influenza high incidence areas in China, spanning November 2004–November 2017. Panel (ad): trends in Liaoning, Anhui, Guangdong and Xinjiang, respectively. Source: the data are collected by the authors and the results are implemented in Stata/MP 15.1.
Sustainability 11 02358 g002
Figure 3. These figures report scatterplots of broiler price (lnbroiler) against (a) public opinion (lnbaidu), (b) dummy for poultry infection with avian influenza cases (pai) and (c) dummy for human infection with avian influenza cases (hai), respectively, with pointwise 95% confidence intervals. Dashed red line = 0. Source: the data are collected by the authors and the results are implemented in Stata/MP 15.1.
Sustainability 11 02358 g003
Figure 4. These figures report plots of baseline estimates: (a) regression coefficients (linear) from column (7) of Table 5, (b) regression coefficients (nonlinear) from column (8) of Table 5 and (c) marginal effect of lnbaidu on lnbroiler (nonlinear) from column (8) of Table 5, with 95% confidence intervals. Dashed red line = 0 and dot-dashed blue line (turning point) = −1.5714. Source: the data are collected by the authors and the results are implemented in Stata/MP 15.1.
Sustainability 11 02358 g004
Figure 5. These figures report Moran scatterplots of (a) broiler price (lnbroiler), (b) public opinion (lnbaidu), (c) dummy for poultry infection with avian influenza cases (pai) and (d) dummy for human infection with avian influenza cases (hai), respectively, in May 2017. Figure corresponds to the local spatial autocorrelation test (Table 7). Province in red = Moran’s Ii is significant at 10% or better. Dashed red line = 0. We use squared inverse-distance spatial weighting matrix W(1). Source: the data are collected by the authors and the results are implemented in Stata/MP 15.1.
Sustainability 11 02358 g005
Table 1. Variable definitions and data sources.
Variable CategoryVariable NameVariable DefinitionIndicator MeasurementData Source
Panel A
Dependent variablelnbroilerBroiler priceLog market price of dressed broiler (yuan)China Animal Agriculture Association
Panel B
Independent variables of interestlnbaiduPublic opinionLog Baidu search volume on avian influenzaBaidu Search (hand-collected)
lnbaidu2Squared public opinionSquared log Baidu search volume on avian influenzaBaidu Search (hand-collected)
lngoogleGoogle opinionLog Google search volume on avian influenzaGoogle Search (hand-collected)
lngoogle2Squared Google opinionSquared log Google search volume on avian influenzaGoogle Search (hand-collected)
paiPoultry infectionDummy for poultry infection with avian influenza casesOfficial Veterinary Bulletin (hand-collected)
haiHuman infectionDummy for human infection with avian influenza casesDisease Surveillance (hand-collected)
Panel C
Price control variableslnforageFeed priceLog market price of broiler compound feed (yuan)China Animal Agriculture Association
lnchickChick priceLog market price of broiler chick (yuan)China Animal Agriculture Association
lnliveLive chicken priceLog market price of live chicken (yuan)China Animal Agriculture Association
lnporkPork priceLog market price of pork (yuan)China Animal Agriculture Association
Panel D
Supply and demand control variableslnoutputPoultry outputLog poultry meat output (10,000 tons)EPS China Data
lnurbanUrban poultry consumptionLog poultry meat consumption in cities and towns (yuan)EPS China Data
lnruralRural poultry consumptionLog poultry meat consumption in rural areas (kg)EPS China Data
Notes. This table reports variable definitions and data sources. Panel A presents definition and data source of dependent variable; Panel B presents definitions and data sources of independent variables of interest; Panel C presents definitions and data sources of price control variables; and Panel D presents definitions and data sources of supply and demand control variables. Source: the data are collected by the authors.
Table 2. Summary statistics.
VarNameObsMeanSDSkewnessKurtosisMinMedianMax
lnbroiler47100.00000.9969−0.79613.5984−4.48090.17383.1626
lnbaidu47100.00000.9969−0.47149.6616−6.41980.00284.7698
lnbaidu247100.99362.92466.285457.95660.00000.137341.2132
lngoogle47100.00000.99690.37622.4029−2.3342−0.17203.1526
lngoogle247100.99361.17702.11588.99710.00000.61999.9392
pai47100.01530.12277.901463.43220.00000.00001.0000
hai47100.05920.23613.734314.94470.00000.00001.0000
lnforage47100.00000.9969−0.49702.3798−4.85030.21082.4497
lnchick47100.00000.9969−0.17913.0160−3.95420.05793.4240
lnlive47100.00000.9969−0.64223.7755−6.37850.15264.4838
lnpork47100.00000.9969−0.52812.6224−2.92330.15362.2861
lnoutput47100.00000.9969−0.22722.4069−2.78100.12373.0341
lnurban47100.00000.9969−0.97972.6054−2.37800.45241.3837
lnrural47100.00000.99690.14022.2011−3.4267−0.20502.1105
Notes. This table reports summary statistics. All continuous variables are winsorized at the 1st and 99th percentile and standardized by province to be mean 0 and standard deviation 1; pai and hai are dummies and others are continuous variables; similarly hereinafter. Source: the data are collected by the authors and the results are implemented in Stata/MP 15.1.
Table 3. Panel-data unit-root tests.
VarNameLLCp-ValueIPSp-ValueFisher-ADFp-Value
lnbroiler−10.6621 ***0.0000−16.3493 ***0.000040.9499 ***0.0000
lnbaidu−36.5880 ***0.0000−44.1220 ***0.0000145.5372 ***0.0000
lnbaidu2−39.2399 ***0.0000−45.8816 ***0.0000157.7744 ***0.0000
lngoogle−21.4760 ***0.0000−21.1794 ***0.000080.9164 ***0.0000
lngoogle2−17.6844 ***0.0000−27.1692 ***0.000078.0917 ***0.0000
lnforage−9.3631 ***0.0000−17.597 ***0.000029.5647 ***0.0000
lnchick−16.4211 ***0.0000−20.7305 ***0.000051.3036 ***0.0000
lnlive−2.2135 **0.0134−9.4672 ***0.000030.7042 ***0.0000
lnpork−21.1036 ***0.0000−21.5955 ***0.000071.3931 ***0.0000
lnoutput−2.9079 ***0.0018−4.7390 ***0.000012.3871 ***0.0000
lnurban−5.0038 ***0.0000−8.9104 ***0.000025.9266 ***0.0000
lnrural−2.6133 ***0.0045−6.3218 ***0.000022.6407 ***0.0000
Notes. This table reports panel-data unit-root tests. ** p < 0.05, *** p < 0.01. Source: the data are collected by the authors and the results are implemented in Stata/MP 15.1.
Table 4. Baseline specification tests.
(1) (2) (3)(4)(5)(6)(7)(8)
OLS_1 OLS_2 BE_1BE_2RE_1RE_2FE_1FE_2
b/seVIFb/seVIFb/seb/seb/seb/seb/seb/se
Panel A
lnbaidu (β1)−0.0363 ***1.4597−0.0466 ***1.5190−4.8100−5.2185−0.0363 **−0.0466 ***−0.0363 **−0.0467 ***
(0.0109) (0.0107) (6.1448)(6.2485)(0.0158)(0.0160)(0.0158)(0.0160)
lnbaidu2 (β2) −0.0148 ***1.0608 −1.7253 −0.0148 *** −0.0149 ***
(0.0031) (2.3807) (0.0037) (0.0037)
pai (β3)−0.06931.0173−0.05831.01830.00000.0000−0.0693-0.0583−0.0705−0.0592
(0.0735) (0.0734) (0.0000)(0.0000)(0.0794)(0.0784)(0.0808)(0.0798)
hai (β4)0.01391.16720.03071.17600.00000.00000.01390.03070.01490.0329
(0.0404) (0.0405) (0.0000)(0.0000)(0.0753)(0.0754)(0.0812)(0.0814)
lnforage (β5)0.0575 ***2.27340.0583 ***2.2738−0.4402−0.43530.05750.05830.05750.0583
(0.0144) (0.0143) (0.7010)(0.7099)(0.0448)(0.0443)(0.0448)(0.0443)
lnchick (β6)0.2073 ***1.45800.2041 ***1.46370.66100.40710.2073 ***0.2041 ***0.2073 ***0.2042 ***
(0.0118) (0.0117) (1.7349)(1.7916)(0.0327)(0.0321)(0.0327)(0.0321)
lnlive (β7)0.3822 ***1.80430.3803 ***1.8065−0.3858−0.36140.3822 ***0.3803 ***0.3822 ***0.3803 ***
(0.0150) (0.0149) (0.3054)(0.3112)(0.0372)(0.0370)(0.0372)(0.0370)
lnpork (β8)0.1441 ***2.49080.1477 ***2.49800.19190.32060.1441 ***0.1477 ***0.1441 ***0.1477 ***
(0.0135) (0.0136) (0.4793)(0.5168)(0.0299)(0.0300)(0.0299)(0.0300)
lnoutput (β9)−0.0708 ***1.2331−0.0718 ***1.23360.21320.2965−0.0708−0.0718−0.0708−0.0718
(0.0102) (0.0102) (0.4543)(0.4742)(0.0487)(0.0489)(0.0487)(0.0489)
lnurban (β10)0.1636 ***6.76430.1592 ***6.7750−0.2031−0.16860.1636 ***0.1592 **0.1636 **0.1593 **
(0.0233) (0.0233) (0.2583)(0.2659)(0.0629)(0.0631)(0.0630)(0.0631)
lnrural (β11)0.0541 ***4.96300.0607 ***4.98771.53661.65430.05410.06070.05400.0606
(0.0164) (0.0164) (1.4154)(1.4426)(0.0473)(0.0472)(0.0473)(0.0472)
Panel B
N4710 4710 471047104710471047104710
adjusted_R20.6687 0.6704 −0.1344−0.1635 0.66870.6704
within_R2 0.00030.00490.66950.67130.66950.6713
between_R2 0.25680.27780.00060.01630.00090.0174
log_likelihood−4060.8367 −4048.0741 389.6401390.0716 −4060.8243−4048.0461
AIC8145.6734 8122.1482 −757.2803−758.1431 8143.64858120.0922
BIC8223.1627 8206.0950 −686.2484−687.1112 8214.68048197.5815
RESET_p0.7138 0.7793
LR_p 0.0000 ***0.0000 ***
Wald_p 0.0000 ***0.0000 ***
Hausman_p 0.0000 ***0.0000 ***
heteroske_p 0.0000 ***0.0000 ***
autocorr_p 0.0000 ***0.0000 ***0.0000 ***0.0000 ***0.0000 ***0.0000 ***
province_FENo No NoNoNoNoYesYes
month_trendYes Yes YesYesYesYesYesYes
cluster_robustYes Yes NoNoYesYesYesYes
Notes. This table reports baseline specification tests. Panel A presents regression coefficients of baseline model (β1–β11); and Panel B presents specification tests. VIF, RESET_p, LR_p, Wald_p, Hausman_p, heteroske_p and autocorr_p are VIF test, p-value of RESET, p-value of LR test, p-value of Wald test, p-value of Hausman test, p-value of heteroskedasticity test and p-value of autocorrelation test, respectively. province_FE, month_trend and cluster_robust indicate the inclusion of province fixed-effects, month trend and cluster-robust standard errors, respectively. Heteroskedasticity-robust standard errors clustered at the province-level are in parentheses, except for columns (3)–(4) (conventional standard errors in parentheses). ** p < 0.05, *** p < 0.01. Source: the data are collected by the authors and the results are implemented in Stata/MP 15.1.
Table 5. Baseline estimates.
(1)(2)(3)(4)(5)(6)(7)(8)
FE_1FE_2FE_3FE_4FE_5FE_6FE_7FE_8
Panel A
pai (β3)−0.4034 **−0.2703 *−0.1361−0.1369−0.1193−0.0669−0.0705−0.0592
(0.1475)(0.1330)(0.1207)(0.1205)(0.0938)(0.0811)(0.0808)(0.0798)
hai (β4)−0.3938 ***−0.2746 **−0.1352−0.1167−0.02340.01950.01490.0329
(0.1057)(0.1025)(0.0850)(0.0839)(0.0837)(0.0825)(0.0812)(0.0814)
lnbaidu (β1) −0.2005 ***−0.1240 ***−0.1245 ***−0.0654 ***−0.0431 **−0.0363 **−0.0467 ***
(0.0227)(0.0157)(0.0157)(0.0162)(0.0160)(0.0158)(0.0160)
lnbaidu2 (β2) −0.0149 ***
(0.0037)
lnoutput (β9) −0.1020 *−0.1042 *−0.0728−0.0797−0.0708−0.0718
(0.0530)(0.0529)(0.0571)(0.0475)(0.0487)(0.0489)
lnurban (β10) 0.6024 ***0.5332 ***0.3700 ***0.2565 ***0.1636 **0.1593 **
(0.0819)(0.0818)(0.0824)(0.0682)(0.0630)(0.0631)
lnrural (β11) 0.1461 **0.1617 ***0.06900.07660.05400.0606
(0.0539)(0.0561)(0.0566)(0.0478)(0.0473)(0.0472)
lnforage (β5) 0.06770.0953 *0.04620.05750.0583
(0.0540)(0.0482)(0.0444)(0.0448)(0.0443)
lnchick (β6) 0.3786 ***0.2419 ***0.2073 ***0.2042 ***
(0.0391)(0.0344)(0.0327)(0.0321)
lnlive (β7) 0.4021 ***0.3822 ***0.3803 ***
(0.0358)(0.0372)(0.0370)
lnpork (β8) 0.1441 ***0.1477 ***
(0.0299)(0.0300)
Panel B
N47104710471047104710471047104710
adjusted_R20.28020.30930.43740.43930.56830.66040.66870.6704
log_likelihood−5892.2092−5794.5652−5310.2243−5301.5711−4685.1819−4119.5209−4060.8243−4048.0461
AIC11,790.418311,597.130410,634.448610,619.14219388.36398259.04188143.64858120.0922
BIC11,809.790611,622.960210,679.650710,670.80179446.48098323.61628214.68048197.5815
province_FEYesYesYesYesYesYesYesYes
month_trendYesYesYesYesYesYesYesYes
cluster_robustYesYesYesYesYesYesYesYes
turning_lnbaidu −1.5714
Notes. This table reports baseline estimates. Panel A presents regression coefficients of baseline model (β1–β11); and Panel B presents specification tests. province_FE, month_trend and cluster_robust indicate the inclusion of province fixed-effects, month trend and cluster-robust standard errors, respectively. turning_lnbaidu is the turning point value for public opinion. Heteroskedasticity-robust standard errors clustered at the province-level are in parentheses. * p < 0.10, ** p < 0.05, *** p < 0.01. Source: the data are collected by the authors and the results are implemented in Stata/MP 15.1.
Table 6. Global spatial autocorrelation in lnbroiler spanning November 2004–November 2017.
MonthMIZMonthMIZMonthMIZ
2004m11−0.02680.08192009m50.1476 **1.98082013m110.01520.5264
2005m5−0.03130.03412009m110.01400.52732014m5−0.0676−0.3501
2005m11−0.0707−0.39412010m50.1609 **2.05642014m11−0.0845−0.5339
2006m50.1189 **1.86912010m11−0.0584−0.25102015m5−0.0501−0.1739
2006m110.05120.90972011m5−0.0536−0.19942015m110.3298 ***3.7626
2007m5−0.1208−0.91962011m110.1025 *1.43112016m50.1879 ***2.3535
2007m11−0.1226−0.92462012m50.3702 ***4.18312016m110.3449 ***3.9889
2008m50.3031 ***3.50462012m110.05810.96752017m50.1715 **2.1418
2008m110.2295 ***2.73482013m50.06981.20362017m110.1032 *1.4828
Notes. This table reports global spatial autocorrelation in lnbroiler spanning November 2004–November 2017. MI indicates Moran’s I and Z indicates the standardized form of Moran’s I. Single-tailed p-value test. MI and Z are calculated every 6 months. * p < 0.10, ** p < 0.05, *** p < 0.01. We use squared inverse-distance spatial weighting matrix W(1). Source: the data are collected by the authors and the results are implemented in Stata/MP 15.1.
Table 7. Local spatial autocorrelation in lnbroiler, lnbaidu, pai and hai in May 2017.
VarNameLSAProvince
Panel A
lnbroilerHigh-HighGuangdong, Hainan, Guizhou, Yunnan
Low-HighHubei
Low-LowBeijing, Tianjin, Hebei, Shandong, Henan, Shaanxi
High-LowShanxi, Jiangxi
Panel B
lnbaiduHigh-HighHebei, Shanxi, Shaanxi
Low-HighInner Mongolia
Low-Lownone
High-Lownone
Panel C
paiHigh-HighHebei, Henan, Shaanxi
Low-HighShanxi, Shandong
Low-Lownone
High-Lownone
Panel D
haiHigh-HighShanxi, Henan, Shaanxi
Low-HighShanghai, Jiangxi, Ningxia
Low-LowLiaoning, Jilin, Heilongjiang
High-LowGuangxi
Notes. This table reports local spatial autocorrelation (LSA) in lnbroiler, lnbaidu, pai and hai in May 2017. Table corresponds to the Moran scatterplots (Figure 5). Panel A presents LSA in broiler price (lnbroiler); Panel B presents LSA in public opinion (lnbaidu); Panel C presents LSA in dummy for poultry infection with avian influenza cases (pai); and Panel D presents LSA in dummy for human infection with avian influenza cases (hai). Provinces presented in this table correspond to provinces in red in Figure 5, indicating that Moran’s Ii is significant at 10% or better. High-High (spatial clustering of high values) corresponds to the upper right quadrant, Low-High (low values surrounded by high neighbouring values) corresponds to the upper left quadrant, Low-Low (spatial clustering of low values) corresponds to the lower left quadrant and High-Low (high values surrounded by low values) corresponds to the lower right quadrant in Figure 5. We use squared inverse-distance spatial weighting matrix W(1). Source: the data are collected by the authors and the results are implemented in Stata/MP 15.1.
Table 8. Spatial specification tests and spatial estimates.
(1)(2)(3)(4)(5)(6)(7)(8)(9)(10)
SDM_1SDM_2dynSDM_1dynSDM_2SAR_1SAR_2dynSAR_1dynSAR_2SAC_1SAC_2
Panel A
lnbaidu (β1)−0.0215−0.0367−0.0129 *−0.0145 *−0.0232−0.0322 **−0.0237 ***−0.0288 ***−0.0094−0.0136
(0.0214)(0.0259)(0.0074)(0.0077)(0.0157)(0.0164)(0.0050)(0.0054)(0.0151)(0.0163)
lnbaidu2 (β2) −0.0134 ** −0.0045 ** −0.0126 *** −0.0075 *** −0.0094 **
(0.0054) (0.0020) (0.0040) (0.0020) (0.0039)
pai (β3)−0.0528−0.0397−0.0319−0.0325−0.0527−0.0433−0.0298−0.0241−0.0503−0.0472
(0.0781)(0.0761)(0.0355)(0.0345)(0.0769)(0.0756)(0.0360)(0.0346)(0.0723)(0.0710)
hai (β4)−0.00250.0081−0.0061−0.00300.00240.0180−0.0307−0.02220.01630.0295
(0.0776)(0.0784)(0.0274)(0.0277)(0.0795)(0.0801)(0.0261)(0.0254)(0.0683)(0.0682)
lnforage (β5)0.04440.04560.0171 *0.0192 **0.04450.04550.0188 **0.0193 **0.02700.0292
(0.0425)(0.0418)(0.0094)(0.0091)(0.0432)(0.0428)(0.0095)(0.0093)(0.0341)(0.0345)
lnchick (β6)0.1767 ***0.1753 ***0.0535 ***0.0522 ***0.1767 ***0.1745 ***0.0561 ***0.0551 ***0.1325 ***0.1315 ***
(0.0344)(0.0339)(0.0117)(0.0115)(0.0347)(0.0340)(0.0120)(0.0119)(0.0360)(0.0357)
lnlive (β7)0.3234 ***0.3228 ***0.1238 ***0.1235 ***0.3238 ***0.3231 ***0.1241 ***0.1240 ***0.3054 ***0.3058 ***
(0.0384)(0.0384)(0.0176)(0.0175)(0.0386)(0.0387)(0.0176)(0.0176)(0.0335)(0.0335)
lnpork (β8)0.0839 ***0.0882 ***0.0285 ***0.0328 ***0.0845 ***0.0886 ***0.0298 ***0.0318 ***0.03020.0345
(0.0312)(0.0307)(0.0104)(0.0101)(0.0309)(0.0314)(0.0105)(0.0107)(0.0289)(0.0303)
lnoutput (β9)−0.0650−0.0660−0.0191 *−0.0197 *−0.0654−0.0663−0.0193 *−0.0198 *−0.0604−0.0612
(0.0479)(0.0482)(0.0115)(0.0114)(0.0478)(0.0480)(0.0115)(0.0116)(0.0456)(0.0459)
lnurban (β10)0.1012 *0.0998 *0.00600.00270.1014 *0.0987 *0.01070.00900.0658 *0.0636 *
(0.0560)(0.0566)(0.0151)(0.0153)(0.0570)(0.0570)(0.0155)(0.0156)(0.0358)(0.0364)
lnrural (β11)0.04730.05250.01080.01590.04780.05350.00860.01190.04430.0499
(0.0443)(0.0441)(0.0134)(0.0134)(0.0450)(0.0451)(0.0133)(0.0133)(0.0384)(0.0385)
Panel B
L.lnbroiler (τ) 0.7849 ***0.7844 *** 0.7836 ***0.7819 ***
(0.0343)(0.0339) (0.0340)(0.0337)
L.Wlnbroiler (ψ) −0.3858 ***−0.3785 *** −0.3982 ***−0.3901 ***
(0.0460)(0.0455) (0.0472)(0.0467)
Wlnbroiler (ρ)0.2513 ***0.2490 ***0.3564 ***0.3476 ***0.2522 ***0.2479 ***0.3714 ***0.3630 ***0.4581 ***0.4515 ***
(0.0669)(0.0667)(0.0353)(0.0359)(0.0677)(0.0682)(0.0369)(0.0371)(0.1044)(0.1074)
Wv (λ) −0.4226 ***−0.4142 ***
(0.1518)(0.1553)
Panel C
LR_Direct_lnbaidu−0.0215−0.0360−0.0544−0.0609 *−0.0229−0.0320 *−0.1081 ***−0.1305 ***−0.0090−0.0133
(0.0211)(0.0256)(0.0340)(0.0354)(0.0162)(0.0170)(0.0225)(0.0244)(0.0162)(0.0174)
LR_Direct_lnbaidu2 −0.0136 *** −0.0196 ** −0.0128 *** −0.0345 *** −0.0098 **
(0.0051) (0.0098) (0.0039) (0.0092) (0.0038)
LR_Indirect_lnbaidu−0.0171−0.0006−0.1532 **−0.1448 **−0.0071−0.0097 *0.01000.0132−0.0043−0.0067
(0.0355)(0.0384)(0.0702)(0.0678)(0.0056)(0.0057)(0.0167)(0.0206)(0.0137)(0.0142)
LR_Indirect_lnbaidu2 −0.0025 −0.0406 ** −0.0039 *** 0.0033 −0.0069 ***
(0.0105) (0.0159) (0.0013) (0.0054) (0.0021)
SR_Direct_lnbaidu −0.0152 **−0.0165 ** −0.0239 ***−0.0290 ***
(0.0066)(0.0070) (0.0049)(0.0053)
SR_Direct_lnbaidu2 −0.0053 *** −0.0077 ***
(0.0020) (0.0020)
SR_Indirect_lnbaidu −0.0616 ***−0.0596 *** −0.0132 ***−0.0154 ***
(0.0179)(0.0170) (0.0032)(0.0033)
SR_Indirect_lnbaidu2 −0.0173 *** −0.0041 ***
(0.0048) (0.0013)
Panel D
N4710471046804680471047104680468047104710
R20.68250.68370.88420.88480.68250.68350.88360.88440.68940.6900
log_likelihood−3970.1324−3960.0735−1493.8413−1482.4369−3970.5199−3960.8472−1502.4859−1492.8716−3917.8213−3910.9946
AIC8016.26488004.14703111.68263100.87398011.03987997.69443122.97183113.74327907.64277899.9892
BIC8261.64778275.35963511.64793539.54558237.05038243.07733503.58403526.61068140.11068151.8294
Hausman_p0.0000 ***0.0000 *** 0.0000 ***0.0000 ***
testSAR_p0.0000 ***0.0000 ***
province_FEYesYesYesYesYesYesYesYesYesYes
month_trendYesYesYesYesYesYesYesYesYesYes
cluster_robustYesYesYesYesYesYesYesYesYesYes
turning_lnbaidu −1.3678 −1.6101 −1.2768 −1.9252 −0.7224
This table reports spatial specification tests and spatial estimates. Panel A presents regression coefficients of spatial models (β1–β11); Panel B presents spatial coefficients of spatial models (ρ and λ), temporal coefficients of spatial models (τ) and spatiotemporal coefficients of spatial models (ψ); Panel C presents direct and indirect marginal effects; and Panel D presents specification tests. LR_Direct, LR_Indirect, SR_Direct and SR_Indirect are long-run direct effects, long-run spatial spillover effects, short-run direct effects and short-run spatial spillover effects, respectively. Spatially lagged independent variables of interest (θ1–θ4) are included but not reported for reasons of space. Hausman_p and testSAR_p are p-value of Hausman test and p-value of Wald test, respectively. province_FE, month_trend and cluster_robust indicate the inclusion of province fixed-effects, month trend and cluster-robust standard errors, respectively. turning_lnbaidu is the turning point value for public opinion. Heteroskedasticity-robust standard errors clustered at the province-level are in parentheses. * p < 0.10, ** p < 0.05, *** p < 0.01. We use squared inverse-distance spatial weighting matrix W(1). Source: the data are collected by the authors and the results are implemented in Stata/MP 15.1.
Table 9. Robustness checks on alternative spatial weighting matrix.
(1)(2)(3)(4)(5)(6)(7)(8)(9)(10)
SDM_1SDM_2dynSDM_1dynSDM_2SAR_1SAR_2dynSAR_1dynSAR_2SAC_1SAC_2
Panel A
lnbaidu (β1)−0.0155−0.0278−0.0138 **−0.0145 **−0.0214−0.0304 **−0.0257 ***−0.0313 ***−0.0161−0.0215
(0.0201)(0.0231)(0.0067)(0.0074)(0.0152)(0.0155)(0.0051)(0.0055)(0.0135)(0.0144)
lnbaidu2 (β2) −0.0124 *** −0.0050 ** −0.0127 *** −0.0084 *** −0.0106 ***
(0.0046) (0.0020) (0.0036) (0.0021) (0.0040)
pai (β3)−0.0476−0.0376−0.0192−0.0189−0.0444−0.0349−0.0171−0.01080.0533−0.0468
(0.0734)(0.0714)(0.0386)(0.0386)(0.0706)(0.0692)(0.0388)(0.0371)(0.0629)(0.0612)
hai (β4)−0.0355−0.0258−0.0200−0.0167−0.00400.0117−0.0367−0.02700.01870.0323
(0.0702)(0.0701)(0.0280)(0.0285)(0.0814)(0.0818)(0.0246)(0.0239)(0.0767)(0.0768)
lnforage (β5)0.05330.05500.0157 *0.0186 **0.05290.05360.0174 *0.0179*0.03310.0354
(0.0405)(0.0400)(0.0094)(0.0090)(0.0404)(0.0400)(0.0094)(0.0092)(0.0341)(0.0343)
lnchick (β6)0.1676 ***0.1658 ***0.0534 ***0.0518 ***0.1677 ***0.1653 ***0.0556 ***0.0543 ***0.1381 ***0.1369 ***
(0.0328)(0.0322)(0.0117)(0.0115)(0.0330)(0.0325)(0.0120)(0.0120)(0.0373)(0.0368)
lnlive (β7)0.3042 ***0.3033 ***0.1187 ***0.1181 ***0.3047 ***0.3037 ***0.1192 ***0.1190 ***0.2811 ***0.2813 ***
(0.0346)(0.0345)(0.0180)(0.0179)(0.0349)(0.0349)(0.0180)(0.0179)(0.0322)(0.0324)
lnpork (β8)0.0766 ***0.0812 ***0.0215 **0.0264 **0.0783 ***0.0819 ***0.0232 **0.0254 **0.03830.0427
(0.0264)(0.0264)(0.0106)(0.0105)(0.0262)(0.0266)(0.0106)(0.0107)(0.0281)(0.0292)
lnoutput (β9)−0.0659−0.0665−0.0194 *−0.0192 *−0.0667−0.0676−0.0191 *−0.0197 *−0.0503−0.0513
(0.0458)(0.0459)(0.0115)(0.0112)(0.0456)(0.0458)(0.0114)(0.0115)(0.0472)(0.0476)
lnurban (β10)0.08230.0794−0.0011−0.00620.08220.07910.00240.00030.06440.0613
(0.0567)(0.0570)(0.0163)(0.0165)(0.0576)(0.0576)(0.0166)(0.0168)(0.0399)(0.0405)
lnrural (β11)0.03680.04270.00650.01270.03960.04540.00510.00880.04670.0526
(0.0413)(0.0410)(0.0133)(0.0128)(0.0429)(0.0428)(0.0133)(0.0132)(0.0388)(0.0387)
Panel B
L.lnbroiler (τ) 0.7763 ***0.7758 *** 0.7754 ***0.7734 ***
(0.0357)(0.0352) (0.0352)(0.0348)
L.Wlnbroiler (ψ) −0.3196 ***−0.3129 *** −0.3280 ***−0.3209 ***
(0.0387)(0.0385) (0.0389)(0.0389)
Wlnbroiler (ρ)0.2915 ***0.2899 ***0.3208 ***0.3116 ***0.2934 ***0.2909 ***0.3320 ***0.3254 ***0.4500 ***0.4434 ***
(0.0415)(0.0416)(0.0314)(0.0317)(0.0420)(0.0424)(0.0319)(0.0324)(0.0930)(0.0950)
Wv (λ) −0.2904 **−0.2817 **
(0.1374)(0.1396)
Panel C
LR_Direct_lnbaidu−0.0170−0.0287−0.0602 **−0.0619 *−0.0214−0.0305 *−0.1129 ***−0.1364 ***−0.0165−0.0222
(0.0198)(0.0226)(0.0292)(0.0321)(0.0160)(0.0163)(0.0221)(0.0234)(0.0147)(0.0155)
LR_Direct_lnbaidu2 −0.0128 *** −0.0220 ** −0.0131 *** −0.0372 *** −0.0112 ***
(0.0044) (0.0092) (0.0035) (0.0092) (0.0039)
LR_Indirect_lnbaidu−0.0384−0.0283−0.1860 ***−0.1932 ***−0.0083−0.0116 *−0.0044−0.0044−0.0114−0.0147
(0.0309)(0.0320)(0.0610)(0.0614)(0.0066)(0.0067)(0.0174)(0.0213)(0.0114)(0.0112)
LR_Indirect_lnbaidu2 −0.0069 −0.0516 *** −0.0049 *** −0.0014 −0.0075 ***
(0.0082) (0.0128) (0.0013) (0.0059) (0.0021)
SR_Direct_lnbaidu −0.0171 ***−0.0177 *** −0.0260 ***−0.0316 ***
(0.0060)(0.0067) (0.0051)(0.0054)
SR_Direct_lnbaidu2 −0.0060 *** −0.0086 ***
(0.0020) (0.0021)
SR_Indirect_lnbaidu −0.0617 ***−0.0644 *** −0.0119 ***−0.0140 ***
(0.0143)(0.0140) (0.0027)(0.0028)
SR_Indirect_lnbaidu2 −0.0178 *** −0.0038 ***
(0.0034) (0.0011)
Panel D
N4710471046804680471047104680468047104710
R20.68520.68650.88180.88290.68480.68600.88110.88210.69080.6916
log_likelihood−3894.9412−3885.0745−1513.4162−1497.9224−3898.3095−3888.0737−1523.6312−1511.5210−3870.0626−3861.6089
AIC7865.88247854.14913150.83253131.84497866.61917852.14733165.26253151.04197812.12537801.2178
BIC8111.26528125.36173550.79783570.51658092.62968097.53023545.87463563.90938044.59328053.0581
Hausman_p0.0000 ***0.0000 *** 0.0000 ***0.0000 ***
testSAR_p0.0000 ***0.0000 ***
province_FEYesYesYesYesYesYesYesYesYesYes
month_trendYesYesYesYesYesYesYesYesYesYes
cluster_robustYesYesYesYesYesYesYesYesYesYes
turning_lnbaidu −1.1216 −1.4561 −1.1953 −1.8630 −1.0167
Notes. This table reports robustness checks on alternative spatial weighting matrix. Panel A presents regression coefficients of spatial models (β1–β11); Panel B presents spatial coefficients of spatial models (ρ and λ), temporal coefficients of spatial models (τ) and spatiotemporal coefficients of spatial models (ψ); Panel C presents direct and indirect marginal effects; and Panel D presents specification tests. LR_Direct, LR_Indirect, SR_Direct and SR_Indirect are long-run direct effects, long-run spatial spillover effects, short-run direct effects and short-run spatial spillover effects, respectively. Spatially lagged independent variables of interest (θ1–θ4) are included but not reported for reasons of space. Hausman_p and testSAR_p are p-value of Hausman test and p-value of Wald test, respectively. province_FE, month_trend and cluster_robust indicate the inclusion of province fixed-effects, month trend and cluster-robust standard errors, respectively. turning_lnbaidu is the turning point value for public opinion. Heteroskedasticity-robust standard errors clustered at the province-level are in parentheses. * p < 0.10, ** p < 0.05, *** p < 0.01. We use queen contiguity spatial weighting matrix W(2). Source: the data are collected by the authors and the results are implemented in Stata/MP 15.1.
Table 10. Robustness checks on alternative measurement of public opinion.
(1)(2)(3)(4)(5)(6)(7)(8)(9)(10)
SDM_1SDM_2dynSDM_1dynSDM_2SAR_1SAR_2dynSAR_1dynSAR_2SAC_1SAC_2
Panel A
lngoogle (β1)0.01960.02170.01430.0193−0.0454 *−0.0381−0.0472 ***−0.0402 ***−0.0175−0.0129
(0.0587)(0.0603)(0.0285)(0.0267)(0.0242)(0.0243)(0.0090)(0.0096)(0.0176)(0.0175)
lngoogle2 (β2) −0.0127 −0.0325 ** −0.0198 −0.0197 *** −0.0121
(0.0512) (0.0164) (0.0173) (0.0060) (0.0112)
pai (β3)−0.0667−0.0668−0.0402−0.0400−0.0665−0.0664−0.0439−0.0436−0.0565−0.0569
(0.0794)(0.0787)(0.0353)(0.0357)(0.0780)(0.0775)(0.0366)(0.0370)(0.0739)(0.0735)
hai (β4)−0.0094−0.0098−0.0106−0.0104−0.0029−0.0019−0.0360−0.03560.01390.0143
(0.0786)(0.0787)(0.0275)(0.0269)(0.0804)(0.0802)(0.0267)(0.0261)(0.0695)(0.0695)
lnforage (β5)0.04370.03930.0167 *0.01260.04430.03980.0185 *0.01390.02700.0239
(0.0429)(0.0449)(0.0095)(0.0102)(0.0435)(0.0459)(0.0098)(0.0105)(0.0340)(0.0354)
lnchick (β6)0.1777 ***0.1771 ***0.0557 ***0.0547 ***0.1778 ***0.1770 ***0.0573 ***0.0566 ***0.1333 ***0.1333 ***
(0.0342)(0.0344)(0.0118)(0.0118)(0.0348)(0.0348)(0.0120)(0.0119)(0.0361)(0.0359)
lnlive (β7)0.3215 ***0.3218 ***0.1230 ***0.1236 ***0.3226 ***0.3229 ***0.1230 ***0.1234 ***0.3047 ***0.3052 ***
(0.0383)(0.0385)(0.0178)(0.0177)(0.0387)(0.0387)(0.0176)(0.0175)(0.0335)(0.0334)
lnpork (β8)0.0818 ***0.0852 ***0.0279 ***0.0303 ***0.0832 ***0.0864 ***0.0285 ***0.0314 ***0.02970.0319
(0.0313)(0.0306)(0.0102)(0.0102)(0.0310)(0.0301)(0.0102)(0.0101)(0.0286)(0.0284)
lnoutput (β9)−0.0646−0.0656−0.0190 *−0.0198 *−0.0650−0.0661−0.0187−0.0198 *−0.0601−0.0613
(0.0482)(0.0482)(0.0115)(0.0114)(0.0480)(0.0480)(0.0114)(0.0113)(0.0458)(0.0459)
lnurban (β10)0.0969 *0.0891 *0.0044−0.00160.0972 *0.0895*0.0068−0.00050.0643 *0.0606 *
(0.0554)(0.0527)(0.0151)(0.0150)(0.0556)(0.0534)(0.0147)(0.0147)(0.0351)(0.0342)
lnrural (β11)0.04950.05330.01350.01730.04800.05210.00890.01320.04480.0477
(0.0445)(0.0445)(0.0136)(0.0136)(0.0451)(0.0454)(0.0136)(0.0137)(0.0383)(0.0384)
Panel B
L.lnbroiler (τ) 0.7841 ***0.7841 *** 0.7837 ***0.7835 ***
(0.0347)(0.0349) (0.0346)(0.0348)
L.Wlnbroiler (ψ) −0.3922 ***−0.3891 *** −0.3987 ***−0.3940 ***
(0.0465)(0.0462) (0.0474)(0.0473)
Wlnbroiler (ρ)0.2480 ***0.2450 ***0.3605 ***0.3556 ***0.2498 ***0.2469 ***0.3684 ***0.3613 ***0.4569 ***0.4536 ***
(0.0672)(0.0671)(0.0369)(0.0366)(0.0667)(0.0662)(0.0375)(0.0374)(0.1016)(0.1011)
Wv (λ) −0.4222 ***−0.4198 ***
(0.1476)(0.1465)
Panel C
LR_Direct_lngoogle0.01840.02060.08800.1114−0.0451 *−0.0377−0.2151 ***−0.1826 ***−0.0176−0.0128
(0.0586)(0.0601)(0.1308)(0.1236)(0.0253)(0.0253)(0.0409)(0.0435)(0.0189)(0.0187)
LR_Direct_lngoogle2 −0.0158 −0.1533 ** −0.0209 −0.0933 *** −0.0132
(0.0492) (0.0772) (0.0170) (0.0268) (0.0114)
LR_Indirect_lngoogle−0.0993−0.0955−0.3320 **−0.3314 **−0.0151−0.01260.02260.0225−0.0132−0.0094
(0.0668)(0.0647)(0.1575)(0.1530)(0.0109)(0.0103)(0.0330)(0.0295)(0.0162)(0.0161)
LR_Indirect_lngoogle2 −0.0115 0.0859 −0.0069 0.0113 −0.0104
(0.0462) (0.0792) (0.0062) (0.0144) (0.0099)
SR_Direct_lngoogle 0.01220.0172 −0.0474 ***−0.0402 ***
(0.0258)(0.0242) (0.0088)(0.0094)
SR_Direct_lngoogle2 −0.0321 ** −0.0205 ***
(0.0154) (0.0059)
SR_Indirect_lngoogle −0.1049 ***−0.1013 *** −0.0261 ***−0.0212 ***
(0.0365)(0.0359) (0.0056)(0.0055)
SR_Indirect_lngoogle2 0.0065 −0.0109 ***
(0.0168) (0.0034)
Panel D
N4710471046804680471047104680468047104710
R20.68280.68320.88410.88470.68260.68300.88370.88440.68950.6898
log_likelihood−3967.9235−3964.9574−1493.7548−1484.8849−3970.0516−3966.9782−1500.6389−1491.9483−3917.5113−3915.2420
AIC8011.84698013.91493111.50963105.76988010.10328009.95643119.27773111.89667907.02267908.4839
BIC8257.22988285.12753511.47493544.44158236.11378255.33923499.88993524.76408139.49068160.3242
Hausman_p0.0000 ***0.0000 *** 0.0000 ***0.0000 ***
testSAR_p0.0000 ***0.0000 ***
province_FEYesYesYesYesYesYesYesYesYesYes
month_trendYesYesYesYesYesYesYesYesYesYes
cluster_robustYesYesYesYesYesYesYesYesYesYes
turning_lngoogle 0.8543 0.2968 −0.9622 −1.0199 −0.5318
Notes. This table reports robustness checks on alternative measurement of public opinion. Panel A presents regression coefficients of spatial models (β1–β11); Panel B presents spatial coefficients of spatial models (ρ and λ), temporal coefficients of spatial models (τ) and spatiotemporal coefficients of spatial models (ψ); Panel C presents direct and indirect marginal effects; and Panel D presents specification tests. LR_Direct, LR_Indirect, SR_Direct and SR_Indirect are long-run direct effects, long-run spatial spillover effects, short-run direct effects and short-run spatial spillover effects, respectively. Spatially lagged independent variables of interest (θ1–θ4) are included but not reported for reasons of space. Hausman_p and testSAR_p are p-value of Hausman test and p-value of Wald test, respectively. province_FE, month_trend and cluster_robust indicate the inclusion of province fixed-effects, month trend and cluster-robust standard errors, respectively. turning_lngoogle is the turning point value for Google opinion. Heteroskedasticity-robust standard errors clustered at the province-level are in parentheses. * p < 0.10, ** p < 0.05, *** p < 0.01. We use squared inverse-distance spatial weighting matrix W(1). Source: the data are collected by the authors and the results are implemented in Stata/MP 15.1.

