Article

Development of a Novel Hybrid Optimization Algorithm for Minimizing Irrigation Deficiencies

1
Department of Water Engineering and Hydraulic Structures, Faculty of Civil Engineering, Semnan University, Semnan 35131-19111, Iran
2
School of Natural Sciences and Engineering, Ilia State University, Tbilisi 0162, Georgia
3
Institute of Energy Infrastructure (IEI), Civil Engineering department, Universiti Tenaga Nasional (UNITEN), Selangor 43000, Malaysia
4
Department of Civil Engineering, Heriot-Watt University, Putrajaya 62200, Malaysia
5
Civil Engineering Department El-Gazeera High Institute for Engineering Al Moqattam, Cairo 11311, Egypt
6
Civil Engineering Department, Faculty of Engineering; University of Malaya, Kuala Lumpur 50603, Malaysia
*
Author to whom correspondence should be addressed.
Sustainability 2019, 11(8), 2337; https://doi.org/10.3390/su11082337
Submission received: 26 February 2019 / Revised: 18 March 2019 / Accepted: 19 March 2019 / Published: 18 April 2019
(This article belongs to the Special Issue Sustainability with Optimization Techniques)

Abstract

:
One of the most important issues in the field of water resource management is the optimal utilization of dam reservoirs. In the current study, the optimal utilization of the Aydoghmoush Dam Reservoir is examined based on a hybrid of the bat algorithm (BA) and particle swarm optimization algorithm (PSOA) by increasing the convergence rate of the new hybrid algorithm (HA) without being trapped in the local optima. The main goal of the study was to reduce irrigation deficiencies downstream of this reservoir. The results showed that the HA reduced the computational time and increased the convergence rate. The average downstream irrigation demand over a 10-year period (1991–2000) was 25.12 × 10⁶ m3, while the amount of water release based on the HA was 24.48 × 10⁶ m3. Therefore, the HA was able to meet the irrigation demands better than some other evolutionary algorithms. Moreover, lower indices of root mean square error (RMSE) and mean absolute error (MAE) were obtained for the HA. In addition, a multicriteria decision-making model based on the vulnerability, reliability, and reversibility indices and the objective function performed better with the new HA than with the BA, PSOA, genetic algorithm (GA), and shark algorithm (SA) in terms of providing for downstream irrigation demands.

1. Introduction

Continuous droughts and climate change make optimal operations of existing water resource systems particularly important, especially when there is a shortage of resources and increased demands [1]. Recently, water resource management (WRM) planning has been of great importance, and thus the water resources behind dams are exploited by the best possible methods [2]. WRM involves ensuring the best possible decisions regarding water releases and the amounts of water stored behind dams. Recently, mathematical models and evolutionary algorithms have been used to optimize the use of stored water in the reservoirs of dams. Various studies have shown that these algorithms can be used to plan WRM by reducing computational time and solving multiobjective WRM issues, as well as demonstrating high resilience in various scenarios, such as climate change or droughts [3]. Boluri-Yazdeli et al. [4] used the genetic algorithm (GA) along with operating rule curves for planning and managing reservoir water resources, with the aim to reduce downstream irrigation deficiencies. The released water was considered to be a decision variable. Different operators, such as mutation and crossover, were applied to the decision variable. The objective function was used to decrease monthly irrigation deficits. The results showed that the GA, along with the third-order command curves, provided a higher reliability index of irrigation needs.

1.1. Background

Bozorg-Haddad et al. [5] used a biogeography-based algorithm to reduce the hydrologic deficiencies of a power plant. This algorithm performs based on the immigration of biological species. The species location was considered to be a decision variable. The results showed that with a high convergence speed, the biogeography-based algorithm was able to assess the best problem response. In another study, genetic programming (GP) was used to plan and manage water resources and increase the energy production of a power plant [6]. Water release was considered to be the decision variable, and reservoir storage was considered to be the state variable. The rule curves–time series for released water were extracted based on reservoir inflow and storage. The results showed that the GP method could provide downstream hydroelectricity needs at a 90% confidence level compared to the GA and PSOA. Additionally, the convergence speed of the GA was less than the PSOA and biogeography-based algorithm convergence speeds. Bozorg-Haddad et al. [5] used the BA to increase energy efficiency in a 10-reservoir system. The results showed that BA could increase the profit from energy production by 20%, 25%, and 30% compared to the GA, PSOA, and harmonic search algorithm (HSA), respectively. The initial location of bats was considered to be a decision variable, and the sound ability of bats was used for the study.
An invasive weed optimization algorithm was used by Azizipour et al. [7] to reduce irrigation deficiencies. This algorithm was inspired by weed life and performed based on weed production in the environment. The decision variables, such as released water volumes, were distributed in the search space of the problem based on the weed location distribution in the environment. The results showed that this algorithm could lower the downstream water demands by decreasing the vulnerability index and increasing the reliability of the GA and PSOA. Mansouri et al. [8] used modified version of Penguins Search Optimization Algorithm (PeSOA) for the operation of a multipurpose reservoir water system to meet hydroelectricity needs. The results showed that the PeSOA could achieve to generate optimal solutions for the operation rules that were closed to the global solution with less computational time compared to the GA.
Shark Algorithm (SA) has been used to increase the energy gain from a multireservoir system with several power plants [9]. The results indicated that this algorithm increased energy production for the multipower system. Additionally, the SA had interesting operators, such as rotational movement for the sharks, which causes the sharks to avoid being trapped in the local optima. In addition, Spider Monkey Algorithm (SMA) has been applied to irrigation management with the aim of decreasing irrigation deficits in multireservoir systems [10]. The water released from the reservoirs was considered to be a decision variable. The results indicated that this new algorithm, which is based on the social behavior of monkeys, can obtain a global solution with less computation time than the PSOA and GA. For a case study in Iran, Mousvai et al. [11] applied the crow algorithm (CA) for irrigation management. This algorithm acts based on the behavior of crows attempting to find food. The results showed that CA requires less computational time to find the global solution than the PSOA and GA. Karami et al. [12] applied the Krill Algorithm (KA) to extract rule curves for irrigation management. The results revealed that the KA could supply the irrigation demands with a lower vulnerability index than the SA, GA, and PSOA. Furthermore, Kidney Algorithm (KA) and Weed Algorithm (WA) have been investigated to decrease hydropower deficits [13,14,15]. The KA performed based on different operators, such as reabsorption, filtration, and secretion. The results showed that the KA could increase the annual power generation by 12% and 2% compared to the PSOA and GA, respectively. On the other hand, the WA showed a high potential for generating optimal operation rules for dam and reservoir water system; however, it has experienced difficulty in adaptation to dam and reservoir system features and the convergence rate is relatively slow. Ming et al. [16] optimized the performance of a multireservoir system using the cuckoo algorithm, considering the water level as the decision variable, which is the main factor affecting the amount of the generated hydropower. The study targeted the maximization of hydropower generation during all possible climate condition scenarios (dry, normal, and wet year). The results indicated that the cuckoo algorithm could successfully generate operation rules to supply hydropower during the dry year adequately with minimal shortage.

1.2. Problem Statement

Until now, evolutionary algorithms have been shown to have high potential for solving WRM problems. Most recently, a motivation for developing a hybrid optimization model using two different meta-heuristic algorithms in parallel has attracted researchers to be implemented for dam and reservoir water systems rather than using single meta-heuristic algorithms [14]. The hybridization was developed between Artificial Fish Optimization Algorithm (AFOA) and Particle Swarm Optimization Algorithm (PSOA) for a single reservoir water system with a single purpose. The main challenge experienced in developing the hybrid model is difficulty in adjusting the communication procedure between both algorithms effectively [14]. Another hybrid model was developed using BA and PSOA with a certain communication process that was easily implemented but not efficient in terms of the convergence rate [14]. However, evolutionary algorithms also have some shortcomings, such as becoming trapped in local optima, low convergence rates, immature solutions, and early convergence in some algorithms [17].
One of the evolutionary algorithms that are successful in WRM is the BA [18]. However, the BA usually becomes trapped in local optima, and the convergence rate of the BA is slow [5]. Hence, in the current study, a hybrid approach is presented in an attempt to solve the problem: the PSOA is coupled with the BA. This hybrid approach improves the BA’s capabilities. The PSOA has been highly relevant to WRM issues [19,20,21]. The structure of the proposed hybrid algorithm (HA) is such that both algorithms (PSOA and BA) run in parallel and independently. The best responses from one algorithm compensate for the worst responses of the other algorithm. Therefore, by improving the responses, the BA will not become trapped in the local optima according to the PSOA, and the time needed to achieve the best response is reduced.

1.3. Novelty and Objective

BA suffers from a few drawbacks, such as slow convergence and poor exploitation. The reason is that the search strategy used in BA only updates one variable at a time, which results not only in trapping in local optima, but also slow convergence [22]. To address this issue, improvements to the BA algorithm have been introduced by hybridizing with other meta-heuristic algorithms and employing multiple search strategies [5]. While the convergence of these BA variants have been prominently increased, most of these improved BA algorithms are still confined to updating one variable at a time and must be re-checked to optimize the objective function. In particular, although this kind of updating strategy may achieve fairly good performance on the reservoir’s experienced deterministic variables (reservoir inflow) and relatively independent constraints of the system physical characteristics, in brief, these optimization applications could be improved. For optimizing each variable independently, the performance of these improved BA algorithms for nonseparable problems is still unsatisfactory. This may become a major restriction to BA algorithms because, when given an optimization problem, it is unrealistic to require that the problem is separable. In fact, most dam and reservoir water systems and most real-world optimization problems are nonseparable.
The motive of this idea is to add diversity that enhances the convergence rate locally to improve the overall performance of the proposed algorithm. This policy works against the premature search capability by gathering together all the best candidates under the same roof to undergo evolution. Afterwards, each iteration revision takes place to improve weakness, which results in improved search capability. Therefore, it is of great significance if the BA algorithm can be fundamentally enhanced for complex nonseparable problems.
This paper is focused on enhancing the BA for solving complex nonseparable problems. Through incorporating differential search strategies into hybrid algorithm framework, we propose a BA and PSOA hybrid algorithm. The proposed algorithm employs different search strategies of differential evolution in both employed and onlooker initial parameter updating phases. By means of differential search strategies, more variables are updated each time based on the combination of mutation and crossover. Undoubtedly, this will be very beneficial for enhancing the ability of the proposed optimization algorithm in solving complex nonseparable problems. In addition, in this study, special attention has been given to the selection of a dam and reservoir water system that represents a nonseparable problems, Aydoghmoush Dam and reservoir, Iran. Different case studies will experience completely different features and characteristics that should be investigated in order to assure the generalization of the proposed model. For the current research, the case study is Aydoghmoush Dam and reservoir water system which is highly nonlinear in terms of the elevation–surface area–storage relationship, the reservoir water inflow pattern is considered highly stochastic, and most importantly, it is nonseparable.
The new HA is robust for the following reasons: (1) the HA can increase the diversity of the population number and the chance of obtaining global solutions; (2) the HA eliminates bad-quality solutions of one algorithm by replacing it with a better solution from the other algorithm to increase the convergence speed; and (3) early convergence and immature solutions of the PSOA are avoided by applying the BA. The HA is used for a dam reservoir system (Aydoghmoush basin in Iran) to reduce irrigation deficiencies. The results of the HA are compared to the BA, PSOA, GA, and SA. A multicriteria decision-making model is also used to select the best method. This basin has encountered water scarcity for supplying irrigation demands.

2. Materials and Methods

2.1. Bat Algorithm (BA)

Bats are mammals that detect differences in obstacles and prey according to the sound frequencies received from their surroundings. Bats can determine the atmosphere of their surroundings to find prey by generating loud sounds and then receiving the recursive frequencies. The BA acts based on the echolocation ability of bats to find the global solution [22]. The speed of the bat and its position are important in the BA operation. The following assumptions are considered for the simplification of this algorithm [18]:
(1)
All bats use their echolocation ability to find prey. This ability helps bats identify prey and obstacles.
(2)
The bats fly randomly with a speed of vl in the position of yl by producing a minimum frequency of fmin; thus, the wavelength of the sound produced is λ and the loudness is A 0 .
(3)
Although the loudness can be changed, the value of this parameter is considered to be between A 0 and Amin.
The following equations are used to update the frequency, velocity, and position of the bats:
v l ( t ) = [ y l ( t ) Y ] × f l
y l ( t ) = y l ( t 1 ) + v l ( t )
where y l ( t 1 ) is the bat’s position at time t − 1, β is a random vector from 0 to 1, Y is the bat’s best position, f l is the bat’s sound frequency, f max is the maximum frequency, l; the index of number of bats (l = 1, 2, …, population size), and f min is the minimum frequency. The bat uses the following equation for local searches:
y ( t ) = y ( t 1 ) + ε A ( t )
where ε is a random number (in the interval of −1 to 1), and A ( t ) is the loudness of the sound.
When the bat finds prey, the pulse rate of the sound ( r l ) increases, but the loudness decreases. The pulse rate varies between 0 and 1. The loudness and pulse rate should be updated for each algorithm level. The following equation is used for updating the pulse rate:
r l t + 1 = r l 0 ( 1 exp ( γ t ) ) A l t + 1 = α A l t
where r l t + 1 is the new pulse rate and α and γ are the constant coefficients. When 0 < α < 1 and γ > 0 , A l t 0 and when t , r l t r l 0 .
Different parameters of the BA can be seen in the above equations. These parameters have different roles in the optimization process. For example, the decision variables are inserted into the algorithm based on the initial bat population. The initial position of the bats is considered to be a decision variable. Additionally, the frequency is used to update the velocity for each level, and then, the bat can find prey as one objective. Based on updating these parameters, the bats will receive the frequency and adjust their velocity to find the best position.

2.2. Particle Swarm Optimization Algorithm

The particle swarm optimization algorithm (PSOA) considers the mass motion of particles with random velocities and positions. The particles can update their positions and velocities based on personal experience, and the particles can also use the experience of other particles to improve their positions and velocities. The process begins with a set of particles. Then, searches are performed to determine the optimal solution during the successive iterations. The ith particle is associated with a position in an s-dimensional space, which shows the number of decision-making variables in the problem. The values of the s variables that determine the positions of particles are possible solutions to the optimization problem. Each particle i is characterized by three vectors: the Xi vector, which is the current position of the particle; the Yi vector, which is the best position that the particle has reached in its previous iteration; and the particle velocity vector shown with Vi. The positions and velocities of particles in the algorithm are updated based on the following equations [23,24]:
V i i t e r + 1 = χ [ w V i i t e r + c 1 r a n d ( Y i i t e r X i i t e r ) Δ T + c 2 r a n d ( Y i t e r X i i t e r ) Δ t ] X i i t e r + 1 = X i i t e r + V i i t e r + 1 Δ t
where V i i t e r + 1 is the new particle velocity in each iteration, w is the inertia coefficient, and c1 and c2 are the acceleration coefficients, Y i t e r is the best current solution among the solutions, X i i t e r + 1 is the new particle position, and Δ t is the time step.

2.3. New Hybrid of the BA and PSOA

The hybrid structure of the new algorithm is based on the communication strategy between the BA and PSOA. The main idea for the HA is substitution of the worst solutions from each algorithm with the best solutions from the other algorithm. The initial population is divided into subgroups that act independently from each other and then share information. If the initial total population for the HA is considered to be N, then N1 and N2 will be the population of the bat and particle swarm algorithms, respectively. Figure 1 shows the communication strategy for the two algorithms. Different HA levels can be defined as follows:
  • First, the initial populations are considered for both algorithms (N1 and N2 for the BA and PSOA, respectively). In addition to the positions and initial speeds of the particles, the positions and velocities of the bats are also defined.
  • Evaluation: the solution candidates should be evaluated separately based on the computation of the objective function for each algorithm.
  • Update: the velocity and position for the PSOA are updated based on Equation (5). The velocity and position for the BA are updated based on Equations (1) and (2).
  • Communication strategy: the k numbers of the best solution candidates are selected and then these solutions are copied and transferred to the other algorithm to replace the worst solution.
  • Termination: levels 2 to 4 are repeated to reach the maximum iteration and then the best solutions from both algorithms will be recorded.

2.4. Shark Algorithm

The SA operates based on the location and velocity of sharks. Sharks hunt in the water according to their olfactory receptors. The following hypotheses are considered in relation to the SA [17]:
  • Each fish is prey for the shark in the water. The fish have a wounded body and blood leaks from the fish’s body. Thus, the velocity of the fish moving in the water is nonsignificant compared to the shark.
  • The blood from the body of the wounded fish is permanently injected into the water. Thus, the shark recognizes the location of the fish through its olfactory ability.
  • Each fish is considered to be a source of blood production.
The sharks have a [ X 1 1 , X 1 2 , , X N P 1 ] position where NP is the size of the shark population, Xil is the initial position of the shark, and each shark position contains several dimensions according to the following equation:
X i 1 = [ x i , 1 1 , x i , 2 1 , x i , N D 1 ] , i = 1 , N P
where x i , j 1 represents the jth position of the ith shark. In other words, the jth decision variable is the jth shark position. Moreover, ND is the number of decision variables. Furthermore, the sharks have a velocity of V i l . Each velocity component is shown based on the following equation:
V i l = [ v i , l 1 , v i , 2 1 , , v i , N D 1 ]
where V i l is the initial velocity of the ith shark and v i , l 1 presents jth dimension of the ith shark’s velocity or equivalently jth decision variable of the ith individual. Moreover, the more scent it receives from the blood particles in the water, the more the velocity of the shark increases. Thus, the objective function can be considered to be the intensity of the odor from the prey received by the shark. In this case, the velocity changes with the changes in the objective function, and the velocity can be defined according to the following equation:
V i k = η k R 1 ( O F ) | x i k
where OF is the objective function, R 1 is a random number from 0 to 1, η k is a random number from 0 to 1, V i k is the velocity of the shark, and k is the number of sharks that move forward. As the motion of the shark is inertial, the velocity of the shark’s movement is corrected using the following equation:
v i , j k = η k · R 1 · ( O F ) x j | x i , j k + α k · R 2 · v i , j k 1
where α k is the momentum coefficient and R 2 is a random number from 0 to 1. Furthermore, the maximum shark velocity is 80 km/h, and the minimum shark velocity is 20 km/h. Therefore, the speed limit coefficient is added to Equation (9):
| v i , j k | = min [ | η k R 1 ( O F ) x j | x i , j k + α k R 2 v i , j k 1 | , | β k v i , j k 1 | ]
where β k is a limiting factor for velocity.
The shark’s position is updated based on the following relationship:
Y i k + 1 = X i k + V i k Δ t k
where Y i k + 1 is the new shark position and Δ t k is the time step. Moreover, using rotational motion, the sharks can examine the search space with high accuracy, and the following equation, based on the rotation of the sharks, is the basis for the local search:
Z i k + 1 , m = Y i k + 1 + R 3 Y i k + 1
where Z i k + 1 , m is the new position of the shark after rotation, random numbers are from −1 to 1, and m is the number of points that the shark searches. The decision variables for the SA are the shark position, and the sharks attempt to find the prey based on received scent intensity. Thus, the sharks update their positions based on their velocity in each iteration.

2.5. Genetic Algorithm

In the GA, a primary population is generated. In the iteration process, subsequent populations are generated to improve the objective function. At each stage, parents from the current population are selected to produce individuals or children of the next generation. Accordingly, the probability that one population will have a better performance than the other is selected. Selected people produce the next population according to two genetic operators: combination and mutation. For the combination operator, the following equations are used [17]:
P o p i n e w = α P o p i o l d + ( 1 α ) P o p j o l d
P o p j n e w = α P o p j o l d + ( 1 α ) P o p i o l d
where P o p i n e w is the ith child, α is a random number from 0 to 1, P o p i o l d is the ith parent, P o p j o l d is the jth parent, and P o p j n e w is the jth child
The mutation is based on the following equation:
P o p j , i n e w = V a r j , i l o w + β ( V a r j , i h i V a r j , i l o w )
where P o p j , i n e w is the new gene i in the jth chromosome, V a r j , i h i is the upper limit of the ith gene in the jth chromosome, V a r j , i l o w is the lower limit of the ith gene in the jth chromosome, and β is a random number from 0 to 1.
In the hybrid process, both new individuals make gene changes between the two individuals. A mutation operator is used to change the chromosomes and to transform genes to create diversity.

3. Case Study

As a clay-core earth dam, the Aydoghmoush Dam is located in southwestern Mianeh, East Azarbayjan Province, Iran. The purpose of the dam is to supply and improve the irrigation demands of 15 × 10 3 ha of land. The length and top width of the dam are 297 m and 12 m, respectively. The maximum and minimum storage volumes of the dam reservoir are 145.7 × 10 6 m3 and 8.9 × 10 6 m3, respectively. The study period is 10 years (1991–2000) with monthly inputs, as shown in Figure 2. The Aydoghmoush River basin climate type is semiarid and the average annual discharge of river in the basin is 190 × 10 6   m 3 and the average annual rainfall is 340 mm. This case study is very important for policy makers to supply irrigation demands in agricultural areas. Different crops, such as wheat, barley, alfalfa, soybean, silage corn, forage, potato, and walnut are grown in the downstream area. In fact, the released water is considered to be a decision variable and unknown value, and thus, the water volume should simultaneously supply the downstream demands of the downstream farmers.
The following objective function is used to minimize irrigation deficiencies:
M i n i m i z e ( O F ) = t = 1 T ( D t R t D max ) 2
where OF is the objective function, D t is the required irrigation volume, R t is the released water, and D max is the maximum water release during the operation period.
In addition, the continuity equation is written as follows:
S t + 1 = S t + I t L o s s t R t S p t
where St+1 is the reservoir storage at time t + 1, S t is the reservoir storage at time t, I t is input to the reservoir, L o s s t is the water losses, R t is the water release, and S p t is the overflow. The water loss and overflow values are obtained from the following equations:
L o s s t = A t × E v t
where A t is the reservoir surface area and E v t is the evapotranspiration from the reservoir.
S p t = [ 0 i f ( S t < S max ) S max S t i f ( S t ) > S max ]
Problem constraints are displayed according to the following equation:
0 R t D t S min S t S max
where D t is irrigation demand at time t. If the constraints are not met, the following penalty functions are used and added to the objective function:
P 1 , t = [ 0 I f ( S t + 1 ) > S min ( ( S min S t + 1 ) 2 S min ) o t h e r w i s e ]
P 1 , t = [ 0 I f ( S t + 1 ) < S max ( ( S max S t + 1 ) 2 S max ) o t h e r w i s e ]
P 3 , t = [ 0 i f ( R t ) < D t ( R t D t ) 2 D max o t h e r w i s e ]
To evaluate the performances of different algorithms, the following indices are used in WRM:
(1)
Volumetric reliability index: this is the volume of released water over the entire period versus the total irrigation requirement amounts. This index is calculated based on the following equation [9]:
α V = t = 1 T R t t = 1 T D t × 100
where α V is the volumetric reliability.
(2)
Vulnerability index: the Vulnerability index is defined as the maximum failure rate created during the operation period of a reservoir system. The smaller this index, the better the system performs [23]:
λ = M a x t = 1 T ( D t R t D t ) × 100
where λ is the vulnerability index.
(3)
Resiliency index: this shows how quickly the system will recover if the period is a failure. For example, if in a 12-month operation period 4 period failures occur, the sequence of failure periods is important and affects the system. However, higher percentages of this index are desirable.
γ i = f s i F i × 100
where γ i is the resiliency index, f s i is the number of occurred failure series, and F i is the total number of failed periods.
A multicriteria decision-making index is also used to evaluate the performance of different algorithms. Based on the weighted sum model, the weighted product model, considering the objective function value, volumetric reliability, vulnerability, and resiliency index, attempts to determine the best algorithm in the optimization process. First, the value of each derived index for each algorithm is normalized based on the following relationships:
x ¯ e f = x e f M a x e x e f f o r ( b e n e f i c a l ) c r i t e r i a
x ¯ e f = M i n e x e f x e f f o r ( n o n b e n e f i c a l ) c r i t e r i a
where M a x e x e f is the maximum value of each index, x e f is the value of each index, x ¯ e f is the normalized value of each index and M i n e x e f is the minimum value of each index. Equation (27) is used for indices whose high percentages are desirable, and Equation (28) is used for indices whose low percentages are desirable. Then, the decision variable matrix for the weighted sum and weighted product is obtained as follows:
ϕ 1 e = f = 1 n c ( x ¯ e f ) w f
ϕ 2 e = f = 1 n c ( x ¯ e f ) w f
where w f is the weight of each index. In the present study, considering that all indices have the same importance, the weights of the indices are equal to each other. Finally, the decision index ϕ is calculated as follows:
ϕ = λ ( ϕ 1 e ) + ( 1 λ ) ( ϕ 2 e )
where λ is a coefficient from 0 to 1. In the current study, this coefficient began at zero, and then a value of 0.1 was added in each step. The values of the decision indices are compared for all algorithms. The algorithm with a higher ϕ is chosen as the preferred algorithm. A pairwise comparison process is used to compare the new HA to other algorithms, based on the number of times the ϕ of each algorithm is larger than the HA (losses) and the number of times the ϕ of each algorithm is lower than the HA (victories).
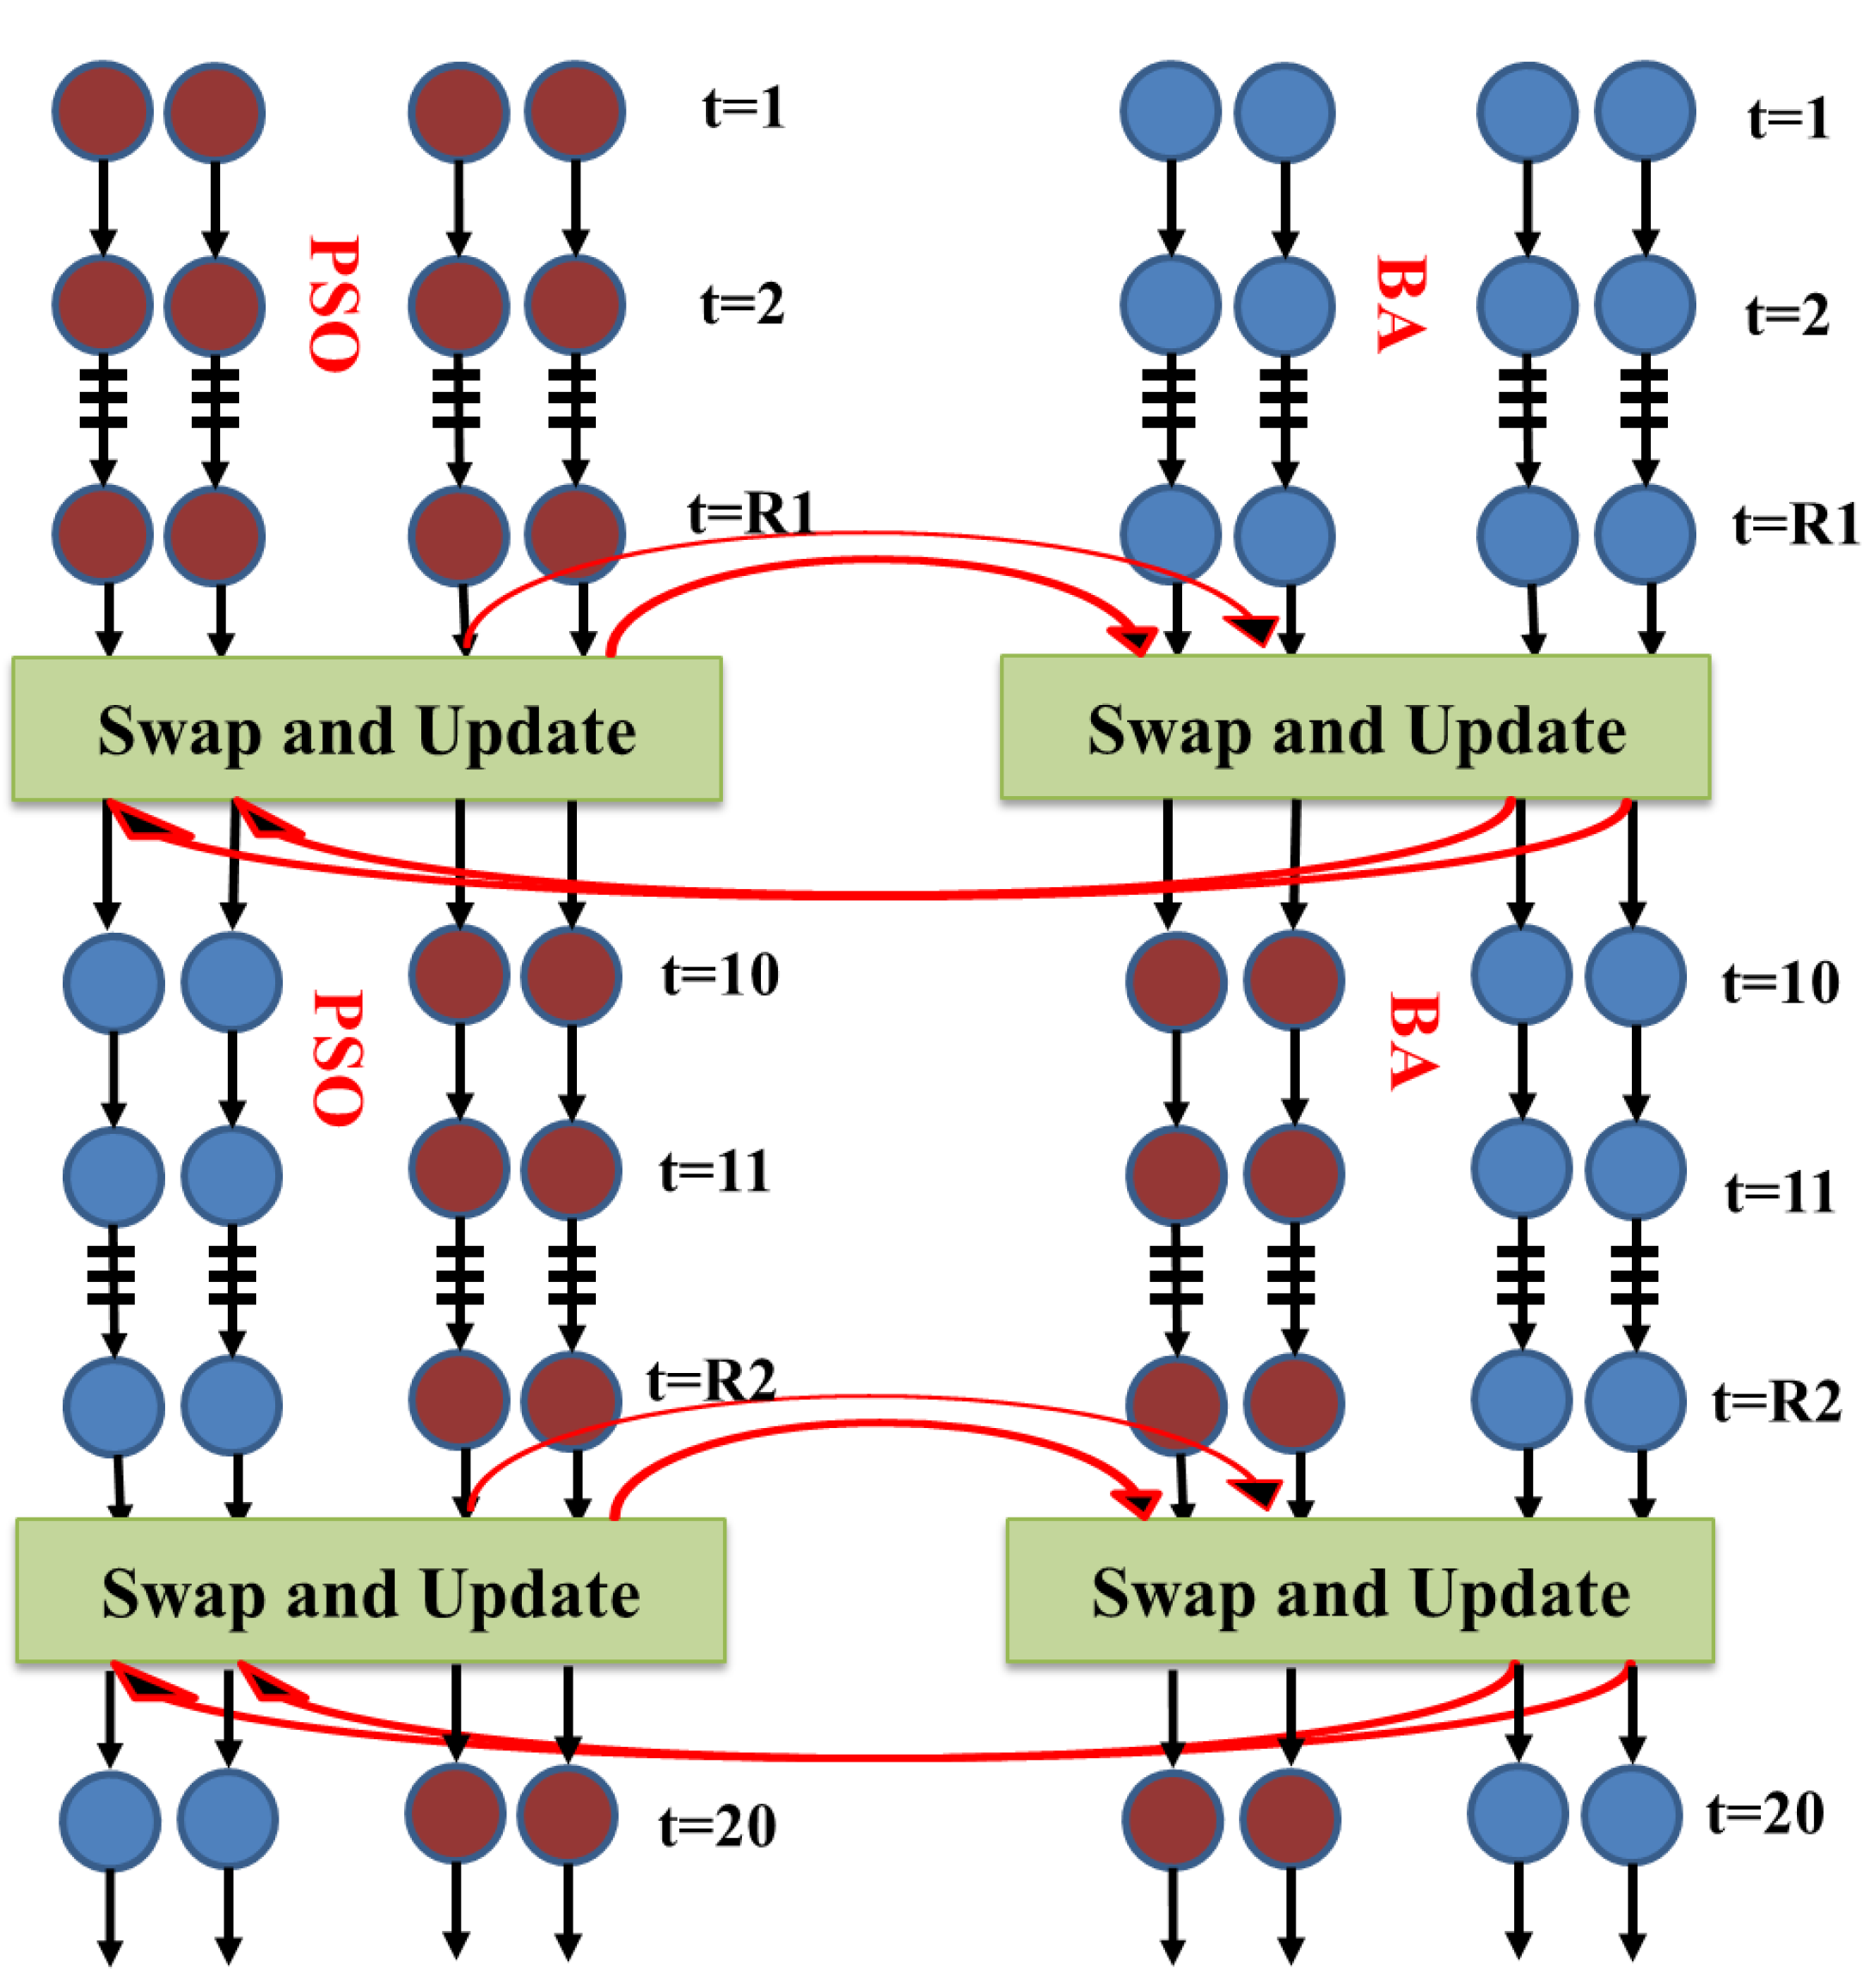
The steps of running the HA for reservoir operations are as follows:
The decision variables are inserted in the new HA based on the initial population of bats and particles.
(1)
The random parameters are determined based on the sensitivity analysis for the BA and PSOA.
(2)
The continuity equation is used to calculate the reservoir storage for the next operation period.
(3)
The reservoir storage and released water are compared to the permissible values. If the released water and reservoir storage values are not in the permissible domain, the penalty functions (Equations (21)–(23)) are applied to the solutions. The penalty functions increase the convergence velocity and accuracy of the HA.
(4)
The objective function for each member of the population is computed, and steps 3 to 4 are repeated for all operation periods.
(5)
Different HA levels are applied to the solutions based on Figure 2.
(6)
The convergence criteria are checked; if the criteria are satisfied, the algorithm is finished; otherwise, the process returns to step 2.

4. Results

Table 1 describes the results of the sensitivity analysis of the random parameters of different algorithms. For example, the optimum population size for the HA is 60, whose objective function (1.12) is smaller than the other population sizes. The bat’s maximum audio frequency (fmax) is 7.0 Hz, and the minimum bat audio frequency (fmin) is 2.0 Hz, and the objective function of 1.12 is associated with these two values. The best value for acceleration coefficients (c1 = c2) is selected as 2.0, and the inertia coefficient (w) is 0.7 with an objective function of 1.14.
The probabilities of mutation and crossover for the GA are 0.6 and 0.5, with objective functions of 3.15 and 3.15, respectively. The optimum size of the SA is 60. Other optimum values of the SA ( β , M and α ) are 4, 200 and 0.6, respectively. The size population for the GA is 100 chromosomes.
Table 2 shows the results of 10 random runs of the algorithms. The average response of the 10 HA runs is 1.12. However, the values for the SA, BA, PSOA, and GA are 2.79, 2.86, 3.0, and 3.55, respectively, and there is an overestimation of 149.1, 155.4, 167.8, and 217.0 percent with respect to the HA, respectively. Therefore, the objective function of the problem is based on the HA, which represents the minimum irrigation deficiencies.
The calculation time for the HA is 50 s, while the calculation times are 65, 87, 95, and 112 s for the SA, BA, PSOA, and GA, respectively. The HA has reduced computational time compared to the other algorithms. The variation coefficient for the 10 HA run implementations is smaller than that of the other algorithms, which indicates that the results of the one-time HA execution are also reliable.
Figure 3 shows the convergence rates of different algorithms. The HA is able to converge faster than the other algorithms. Therefore, the HA has superior performance in terms of response quality as well as computing time. Replacement of one algorithm’s weaker solutions with good responses from another algorithm has improved the convergence velocity for the new HA. In fact, although the BA and PSOA have poor individual performances, the combination of these two algorithms improved the performance. The results are compared for the same number of function evaluation (5000).
Table 3 shows the performances of the different algorithms in providing irrigation demands over the 10-year period. The correlation coefficient (r) between the water release values and the required values in the HA is 0.95, which is more than the other studied evolutionary algorithms. In addition, the RMSE value for the HA is 1.2 × 10⁶ m3, whereas this index for the SA, BA, PSOA, and GA is 5.2 × 10⁶ m3, 7.14 × 10⁶ m3, 8.23 × 10⁶ m3 and 10.12 × 10⁶ m3, respectively. Thus, the HA has managed to better meet the irrigation needs. The MAE index for the HA is less than the other evolutionary algorithms in Table 3, which shows the better performance of HA in providing for downstream irrigation needs.
Figure 4 shows the water release volume by the HA for supplying the irrigation demands. The average demand is 25.12 × 10⁶ m3, and the HA has released 24.48 × 10⁶ m3 for irrigation. The SA, BA, PSOA, and GA released 23.12 × 10⁶ m3, 22.87 × 10⁶ m3, 20.45 × 10⁶ m3, and 19.88 × 10⁶ m3 of water from the Aydoghmoush Dam for irrigation. These values indicate that the average water release during the study period is closer to the average required demand based on the HA.
Table 4 shows the performances of various studied algorithms based on WRM indices. For example, the HA, with a reliability index of 92%, would be better able to respond to the downstream irrigation requirements than the other evolutionary algorithms. The SA has a lower vulnerability index than the HA. In addition, the HA, with the highest percentage resiliency index (45%) and the lowest value objective function (1.12), has a better status than the other evolutionary algorithms. Thus, the best decision can be made by simultaneously considering several indices using a multicriteria decision-making model. In this case study, the objective function is not considered to be the sole index for selecting the best algorithm to supply the downstream irrigation demands, and the other indices, such as resiliency, reliability, and vulnerability, can aid us in selecting the preferred algorithm.
Table 5 shows the values of ϕ 1 and ϕ 2 of Equations (30) and (31). This table shows that the values of ϕ 1 and ϕ 2 for the HA are higher than the other algorithms, which again is an indication of the superiority of the HA.
Table 6 shows the value of ϕ for different algorithms based on different λ values in the 0 to 1 interval. As seen in Table 6, the HA has higher ϕ values at all λ values than the other algorithms. According to the results of the pairwise comparison of the studied algorithms (Table 7), the HA, with 11 successes over the SA, BA, PSOA and GA, is superior to the other evolutionary algorithms for the following reasons:
(1)
The computing time was decreased and the convergence speed was increased.
(2)
The objective function was minimized.
(3)
The irrigation demands were supplied with released water at an amount close to the average irrigation demands.
(4)
The statistical indices of the RMSE and MAE showed that the new HA can better meet the irrigation needs.
(5)
Based on the multicriteria decision-making model, objective function, and the vulnerability, resiliency, and reliability indices, the new HA has ranked first among the studied evolutionary algorithms.
However, every algorithm has its own advantages or weaknesses. For example, the new hybrid algorithm of the BA and PSOA (HA) can improve the convergence speed and avoid being trapped in the local optima. However, the method also has some limitations. For example, the number of random parameters is considerable, setting these parameters is difficult, and the algorithm may not work well for every problem or case study. The uncertainty of data in input instances of optimization problems are a curse, but a reality [25]. The uncertainty in the inputs is important: even if we had precisely correct inputs, the model would provide a perfect prediction. However, for anything beyond an absolutely trivial model, the optimization would still be inaccurate. In this case, there is a level of input uncertainty, and even a deterministic model would provide output uncertainty. Taking this uncertainty into account, further predictions and/or decisions could be moderately critical.
The inclusion of uncertainty in a model and how it is treated depends on the model approach, the analysis, and the decisions being made. (i) Is the model sensitive to input parameters? (ii) Are there input parameters that are not well known? (iii) Is the nature of the uncertainty aleatory or epistemic? (iv) What decisions are being made based on the model?
There are few systems in which uncertainties are so limited that they can be neglected, as none of these four reasons of uncertainty exist. Instead, when modelling a real, complex system to support its management, an uncertainty assessment is important because interventions are to be “calibrated” for the quality of predictions. However, if the model has been examined using unseen data, the model is indirectly assessed and evaluated against the model performance ability regardless of the level of uncertainty. There are many sources of uncertainty for reservoir optimization, such as inflow, evaporation, and the climate conditions, which directly affect the operation and hence the released water volume.
It should be highlighted here that each of the used optimization algorithms has particular limitations that might negatively influence the generation of the proposed operation rules. For example, the particle swarm optimization (PSO) is weak in exploration; this leads to its convergence to local optima. This is because there is no operator that can stimulate abrupt changes that can enhance the exploration in the set of potential solutions; consequently, the solutions are easily trapped in local minima. Other major factors to the convergence to local optima are due to heavily reliance on dispersal of the initial swarm and the connection among the particle members. Since the members of particles are strongly bonded, the chances for them to escape from local optima are low, if the majority of them are trapped in a local optimum.
Secondly, the GA is sensitive to the initial population used. A wide diversity of feasible solutions is what one wants. Stochastic algorithms, in general, can have difficulty obeying equality constraints. Different sets of results are obtained through numerous simulation processes, even when the same input data are used. This means that one needs to find a statistically convergent solution with many simulations. In GA, the population has no memory of its previous state; this results in an independent event for each generation.
The limitation for the standard BA seems to be its relatively poor exploration ability despite its good performance in exploitation. This is because BA has no crossover operation (unlike GA); consequently, BA maintains the members of the whole population through the search procedure. There is a need to improve the control strategy to switch between exploration and exploitation at the right moment.
Finally, the limitation of the shark algorithm is that the search performance depends on the randomness in the initial population of solutions. Consequently, the searching process may become trapped in local optima. This drawback is also possibly due to gradient behavior, which is the movement of solutions along the objective function, even though it speeds up the convergence rate. Another probable disadvantage of gradient-based methods is that they are weak in handling problems such as objective functions with noise, inaccurate gradients, and an irregular shape of problem layout. In addition, gradient-based methods require tremendous computational work; for example, each time the code is altered, the adjoint computations may need to be revised.

5. Conclusions

In the present study, a new HA combining the BA and PSOA is introduced for optimal operation of the Aydoghmoush Dam Reservoir to meet downstream irrigation demands and reduce irrigation deficiencies. The results showed that the HA, with an objective function value of 1.12, demonstrated a more successful performance in the optimization process with a lower computational time and higher convergence rate than the SA, BA, PSOA, and GA. The 10-year average irrigation demand was 25.12 × 10⁶ m3, and the average HA water release volume was 24.48 × 10⁶ m3. Other evolutionary algorithms resulted in higher water release volumes. Furthermore, a multicriteria decision-making model based on reliability, vulnerability, and resiliency indices was used to select the best algorithm. This result again indicated the superiority of the HA. In future studies, this new HA can be tested under climate change conditions and different reservoir operations. In fact, the water demand data and the reservoir inflow for this study are characterized by its relative high variability in nature. This variability is seen within two different scales: monthly scale and annual (yearly) scale. The successfulness of the proposed model in detecting such variability could be strong evidence that the model has potential to capture the possible uncertainty in these variables in the future under different climate conditions and changes. The results indicated that the method could be used for complex problems, such as multireservoir and multipurpose systems with consideration of uncertainty of different parameters, such as inflow, evaporation, and others. In addition, for downstream demand from different stakeholders, the generated operation rules could be adapted to allocate the released water using game theory. Therefore, the proposed optimization algorithm and the allocation methods could be integrated and could provide the decision-makers with an effective tool to achieve better management and operation for dam and reservoir water systems.

Author Contributions

Formal analysis, S.F., H.K., M.E., O.K., A.H.E.-S., H.A.A. and L.S.H.; Methodology, M.V.-A., S.-F.M. and M.E.; Supervision, A.E.-S.; Validation, C.M.F. and H.B.H.; Writing—original draft, M.S.H., A.N.A. and A.H.E.-S.; Writing—review & editing, G.H. and H.A.A.

Funding

This research was funding by Universiti Tenaga Nasional (UNITEN) under Bold Grant. In addition, this study was partially supported by the University of Malaya Research Grant (UMRG) coded RP025A-18SUS University of Malaya, Malaysia

Acknowledgments

The authors appreciate so much the facilities support by the Civil Engineering Department, Faculty of Engineering, University of Malaya, Malaysia and Department of Water Engineering and Hydraulic Structures, Faculty of Civil Engineering, Semnan University, Iran.

Conflicts of Interest

We declare no conflicts of interest with any person or institute.

References

  1. Afshar, M.H.; Hajiabadi, R. A Novel Parallel Cellular Automata Algorithm for Multi-Objective Reservoir Operation Optimization. Water Resour. Manag. 2017, 32, 785–803. [Google Scholar] [CrossRef]
  2. Xie, A.; Liu, P.; Guo, S.; Zhang, X.; Jiang, H.; Yang, G. Optimal Design of Seasonal Flood Limited Water Levels by Jointing Operation of the Reservoir and Floodplains. Water Resour. Manag. 2017, 32, 179–193. [Google Scholar] [CrossRef]
  3. Ehteram, M.; Mousavi, S.F.; Karami, H.; Farzin, S.; Emami, M.; Binti Othman, F.; Amini, Z.; Kisi, O.; El-Shafie, A. Fast convergence optimization model for single and multi-purposes reservoirs using hybrid algorithm. Adv. Eng. Inform. 2017, 32, 287–298. [Google Scholar] [CrossRef]
  4. Bolouri-Yazdeli, Y.; Bozorg Haddad, O.; Fallah-Mehdipour, E.; Mariño, M.A. Evaluation of real-time operation rules in reservoir systems operation. Water Resour. Manag. 2014, 28, 715–729. [Google Scholar] [CrossRef]
  5. Bozorg-Haddad, O.; Karimirad, I.; Seifollahi-Aghmiuni, S.; Loáiciga, H.A. Development and Application of the Bat Algorithm for Optimizing the Operation of Reservoir Systems. J. Water Resour. Plan. Manag. 2015, 141, 04014097. [Google Scholar] [CrossRef]
  6. Akbari-Alashti, H.; Bozorg Haddad, O.; Fallah-Mehdipour, E.; Mariño, M.A. Multi-reservoir real-time operation rules: A new genetic programming approach. Proc. Inst. Civ. Eng. Water Manag. 2014, 167, 561–576. [Google Scholar] [CrossRef]
  7. Azizipour, M.; Ghalenoei, V.; Afshar, M.H.; Solis, S.S. Optimal Operation of Hydropower Reservoir Systems Using Weed Optimization Algorithm. Water Resour. Manag. 2016, 30, 3995–4009. [Google Scholar] [CrossRef]
  8. Mansouri, A.; Aminnejad, B.; Ahmadi, H. Introducing modified version of penguins search optimization algorithm (PeSOA) and its application in optimal operation of reservoir systems. Water Sci. Technol. Water Supply 2017, 18, 1484–1496. [Google Scholar] [CrossRef]
  9. Ehteram, M.; Karami, H.; Mousavi, S.-F.; Farzin, S.; Kisi, O. Evaluation of contemporary evolutionary algorithms for optimization in reservoir operation and water supply. J. Water Supply Res. Technol. Aqua 2017, 67, 54–67. [Google Scholar] [CrossRef]
  10. Ehteram, M.; Karami, H.; Farzin, S. Reducing Irrigation Deficiencies Based Optimizing Model for Multi-Reservoir Systems Utilizing Spider Monkey Algorithm. Water Resour. Manag. 2018, 32, 2315–2334. [Google Scholar] [CrossRef]
  11. Mousavi, S.F.; Vaziri, H.R.; Karami, H.; Hadiani, O. Optimizing Reservoirs Exploitation with A New Crow Search Algorithm Based on a Multi-Criteria Decision-Making Model. J. Water Soil Sci. 2018, 22, 279–290. [Google Scholar] [CrossRef]
  12. Karami, H.; Mousavi, S.F.; Farzin, S.; Ehteram, M.; Singh, V.P.; Kisi, O. Improved Krill Algorithm for Reservoir Operation. Water Resour. Manag. 2018, 32, 3353–3372. [Google Scholar] [CrossRef]
  13. Ehteram, M.; Karami, H.; Farzin, S. Reservoir Optimization for Energy Production Using a New Evolutionary Algorithm Based on Multi-Criteria Decision-Making Models. Water Resour. Manag. 2018, 32, 2539–2560. [Google Scholar] [CrossRef]
  14. Yaseen, Z.M.; Karami, H.; Ehteram, M.; Mohd, N.S.; Mousavi, S.F.; Hin, L.S.; Kisi, O.; Farzin, S.; Kim, S.; El-Shafie, A. Optimization of Reservoir Operation using New Hybrid Algorithm. KSCE J. Civ. Eng. 2018, 22, 4668–4680. [Google Scholar] [CrossRef]
  15. Ehteram, M.; Singh, V.P.; Karami, H.; Hosseini, K.; Dianatikhah, M.; Hossain, M.; Ming Fai, C.; El-Shafie, A. Irrigation Management Based on Reservoir Operation with an Improved Weed Algorithm. Water 2018, 10, 1267. [Google Scholar] [CrossRef]
  16. Ming, B.; Chang, J.X.; Huang, Q.; Wang, Y.M.; Huang, S.Z. Optimal Operation of Multi-Reservoir System Based-On Cuckoo Search Algorithm. Water Resour. Manag. 2015, 29, 5671–5687. [Google Scholar] [CrossRef]
  17. Ehteram, M.; Karami, H.; Mousavi, S.-F.; Farzin, S.; Kisi, O. Optimization of energy management and conversion in the multi-reservoir systems based on evolutionary algorithms. J. Clean. Prod. 2017, 168, 1132–1142. [Google Scholar] [CrossRef]
  18. Ahmadianfar, I.; Adib, A.; Salarijazi, M. Optimizing Multireservoir Operation: Hybrid of Bat Algorithm and Differential Evolution. J. Water Resour. Plan. Manag. 2016, 142, 5015010. [Google Scholar] [CrossRef]
  19. Moeini, R.; Babaei, M. Constrained improved particle swarm optimization algorithm for optimal operation of large scale reservoir: Proposing three approaches. Evol. Syst. 2017, 8, 287–301. [Google Scholar] [CrossRef]
  20. Peng, Y.; Peng, A.; Zhang, X.; Zhou, H.; Zhang, L.; Wang, W.; Zhang, Z. Multi-Core Parallel Particle Swarm Optimization for the Operation of Inter-Basin Water Transfer-Supply Systems. Water Resour. Manag. 2016, 31, 27–41. [Google Scholar] [CrossRef]
  21. Wan, W.; Guo, X.; Lei, X.; Jiang, Y.; Wang, H. A Novel Optimization Method for Multi-Reservoir Operation Policy Derivation in Complex Inter-Basin Water Transfer System. Water Resour. Manag. 2017, 32, 31–51. [Google Scholar] [CrossRef]
  22. Yaseen, Z.M.; Allawi, M.F.; Karami, H.; Ehteram, M.; Farzin, S.; Ahmed, A.N.; Koting, S.B.; Mohd, N.S.; Jaafar, W.Z.B.; Afan, H.A.; et al. A hybrid bat–swarm algorithm for optimizing dam and reservoir operation. Neural Comput. Appl. 2019, 1–15. [Google Scholar] [CrossRef]
  23. Ehteram, M.; Allawi, M.F.; Karami, H.; Mousavi, S.-F.; Emami, M.; EL-Shafie, A.; Farzin, S. Optimization of Chain-Reservoirs’ Operation with a New Approach in Artificial Intelligence. Water Resour. Manag. 2017, 31, 2085–2104. [Google Scholar] [CrossRef]
  24. Ehteram, M.; Karami, H.; Mousavi, S.-F.; El-Shafie, A.; Amini, Z. Optimizing dam and reservoirs operation based model utilizing shark algorithm approach. Knowl. Based Syst. 2017, 122, 26–38. [Google Scholar] [CrossRef]
  25. Buhmann, J.M.; Gronskiy, A.Y.; Mihalák, M.; Pröger, T.; Šrámek, R.; Widmayer, P. Robust optimization in the presence of uncertainty: A generic approach. J. Comput. Syst. Sci. 2018, 94, 135–166. [Google Scholar] [CrossRef]
Figure 1. Hybrid of the particle swarm optimization algorithm (PSOA) and the bat algorithm (BA) with a communication strategy.
Sustainability 11 02337 g001
Figure 2. Monthly inflow to the Aydoghmoush Dam.
Sustainability 11 02337 g002
Figure 3. Convergence curve for different algorithms.
Sustainability 11 02337 g003
Figure 4. Irrigation supplies of different algorithms.
Sustainability 11 02337 g004
Table 1. Sensitivity analysis for different algorithms, hybrid algorithm (HA), genetic algorithm (GA), and shark algorithm (SA).
Hybrid Algorithm (HA)
Population SizeObjective FunctionfminObjective FunctionfmaxObjective Functionc1 = c2Objective FunctionwObjective Function
202.2402.3431.981.61.450.31.48
401.9811.7651.671.81.380.51.33
601.1221.1271.1221.120.71.14
801.4531.3491.342.21.160.91.24
Genetic Algorithm (GA)
Population SizeObjective FunctionMutation ProbabilityObjective FunctionCrossover ProbabilityObjective Function
204.780.23.550.14.24
403.140.43.340.33.98
603.550.63.150.53.15
803.870.62.980.73.76
Shark Algorithm (SA)
Population SizeObjective Function β Objective FunctionMObjective Function α Objective Function
203.2423.111003.10.23.24
402.9842.782002.780.42.96
602.7862.983002.890.62.78
802.8973.114002.910.82.82
Table 2. Results of the 10 random runs for different algorithms.
RunHASABAPSOGA
11.122.782.852.993.55
21.142.782.853.123.76
31.122.892.932.993.55
41.122.782.852.993.55
51.122.782.862.993.55
61.122.782.852.993.55
71.122.782.852.993.55
81.122.782.853.003.55
91.122.782.852.993.55
101.122.782.852.993.55
Average1.122.792.863.003.55
Coefficient of variation0.0050.0100.0080.0133.57
Computation time (s)50658795112
Table 3. The evaluation of different algorithms for irrigation supply based on statistical indices.
IndexEquationHASABAPSOGA
Correlation coefficient (r) r = t = 1 T ( D t D ¯ t ) · ( R t R ¯ t ) t = 1 T ( D t D ¯ t ) 2 · t = 1 T ( R t R ¯ t ) 0.950.870.860.850.84
Root mean square error (RMSE) R M S E = t = 1 T ( D t R t ) 2 T 1.2 (106 m3)5.20 (106 m3)7.14 (106 m3)8.23 (106 m3)10.12 (106 m3)
Mean absolute error (MAE) M A E = t = T | D t R t | T 3.45 (106 m3)4.45 (106 m3)5.57 (106 m3)6.12 (106 m3)7.25 (106 m3)
Table 4. Evaluation of the performances of different algorithms based on different indices in water resources management.
AlgorithmReliability Index (%)Vulnerability Index (%)Resiliency Index (%)Objective Function
HA9212451.12
SA8810432.78
BA8714422.85
PSO7616402.99
GA6918383.55
Normalized decision matrix
HA10.8311
SA0.9510.950.40
BA0.940.710.930.39
PSO0.820.620.880.37
GA0.750.550.840.31
Table 5. Values of ϕ 1 and ϕ2.
ParameterHASABAPSOGA
ϕ 1 0.95750.8250.74250.67250.6125
ϕ 2 0.95410.77510.70140.63120.5712
Table 6. Performances of the studied algorithms for different values of λ.
Values ϕ H A ϕ S A ϕ B A ϕ P S O ϕ G A
λ = 0 0.95410.77510.70140.63120.5712
λ = 0.10 0.95440.78000.70550.63530.5733
λ = 0.20 0.95470.78500.70960.63940.5794
λ = 0.30 0.95510.79000.71370.64350.5833
λ = 0.40 0.95540.79500.71780.64770.5877
λ = 0.50 0.95580.80050.72190.65180.5918
λ = 0.60 0.95610.80500.72260.65590.5959
λ = 0.70 0.95640.81000.73010.66060.6001
λ = 0.80 0.95680.81500.73450.66420.6042
λ = 0.90 0.95710.82000.73830.66830.6083
λ = 1.00 0.95750.825000.74250.67250.6125
Table 7. Pairwise comparison of the different algorithms based on decision index.
Contender AContender BNumber of Victories for ANumber of Victories for BWinner
HASA110HA
HABA110HA
HAGA110HA
HAPSOA110HA
SABA110SA
SAPSOA110SA
SAGA110SA
BAGA110BA
BAPSOA110BA
PSOAGA110PSOA

