Assessment of the Ecological Niche of Photovoltaic Agriculture in China


Abstract
:1. Introduction
2. Construction of Index System for Evaluating Ecological Niche of Photovoltaic Agriculture
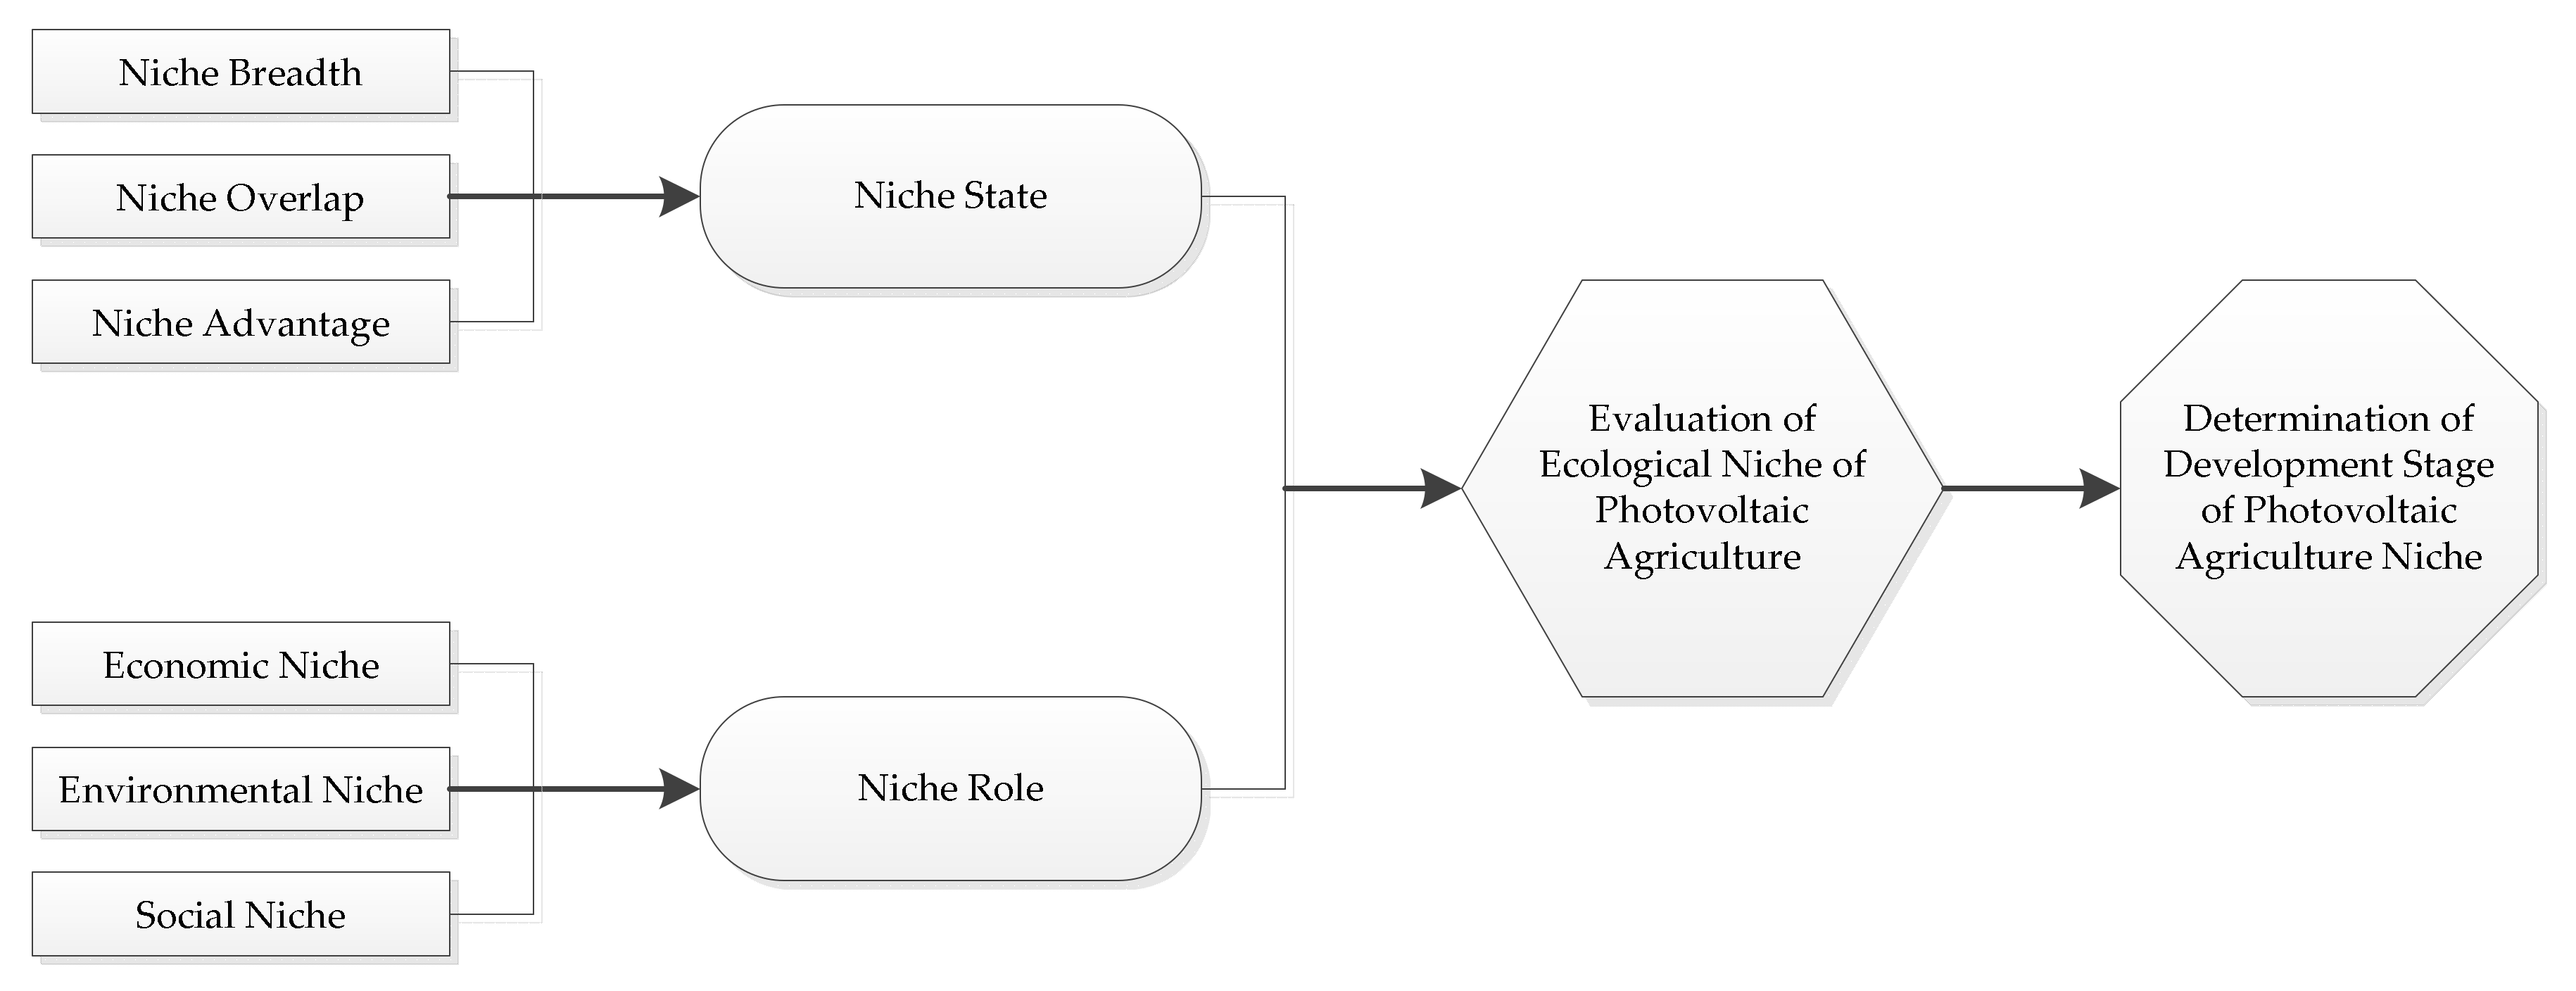
2.1. Analytical Framework
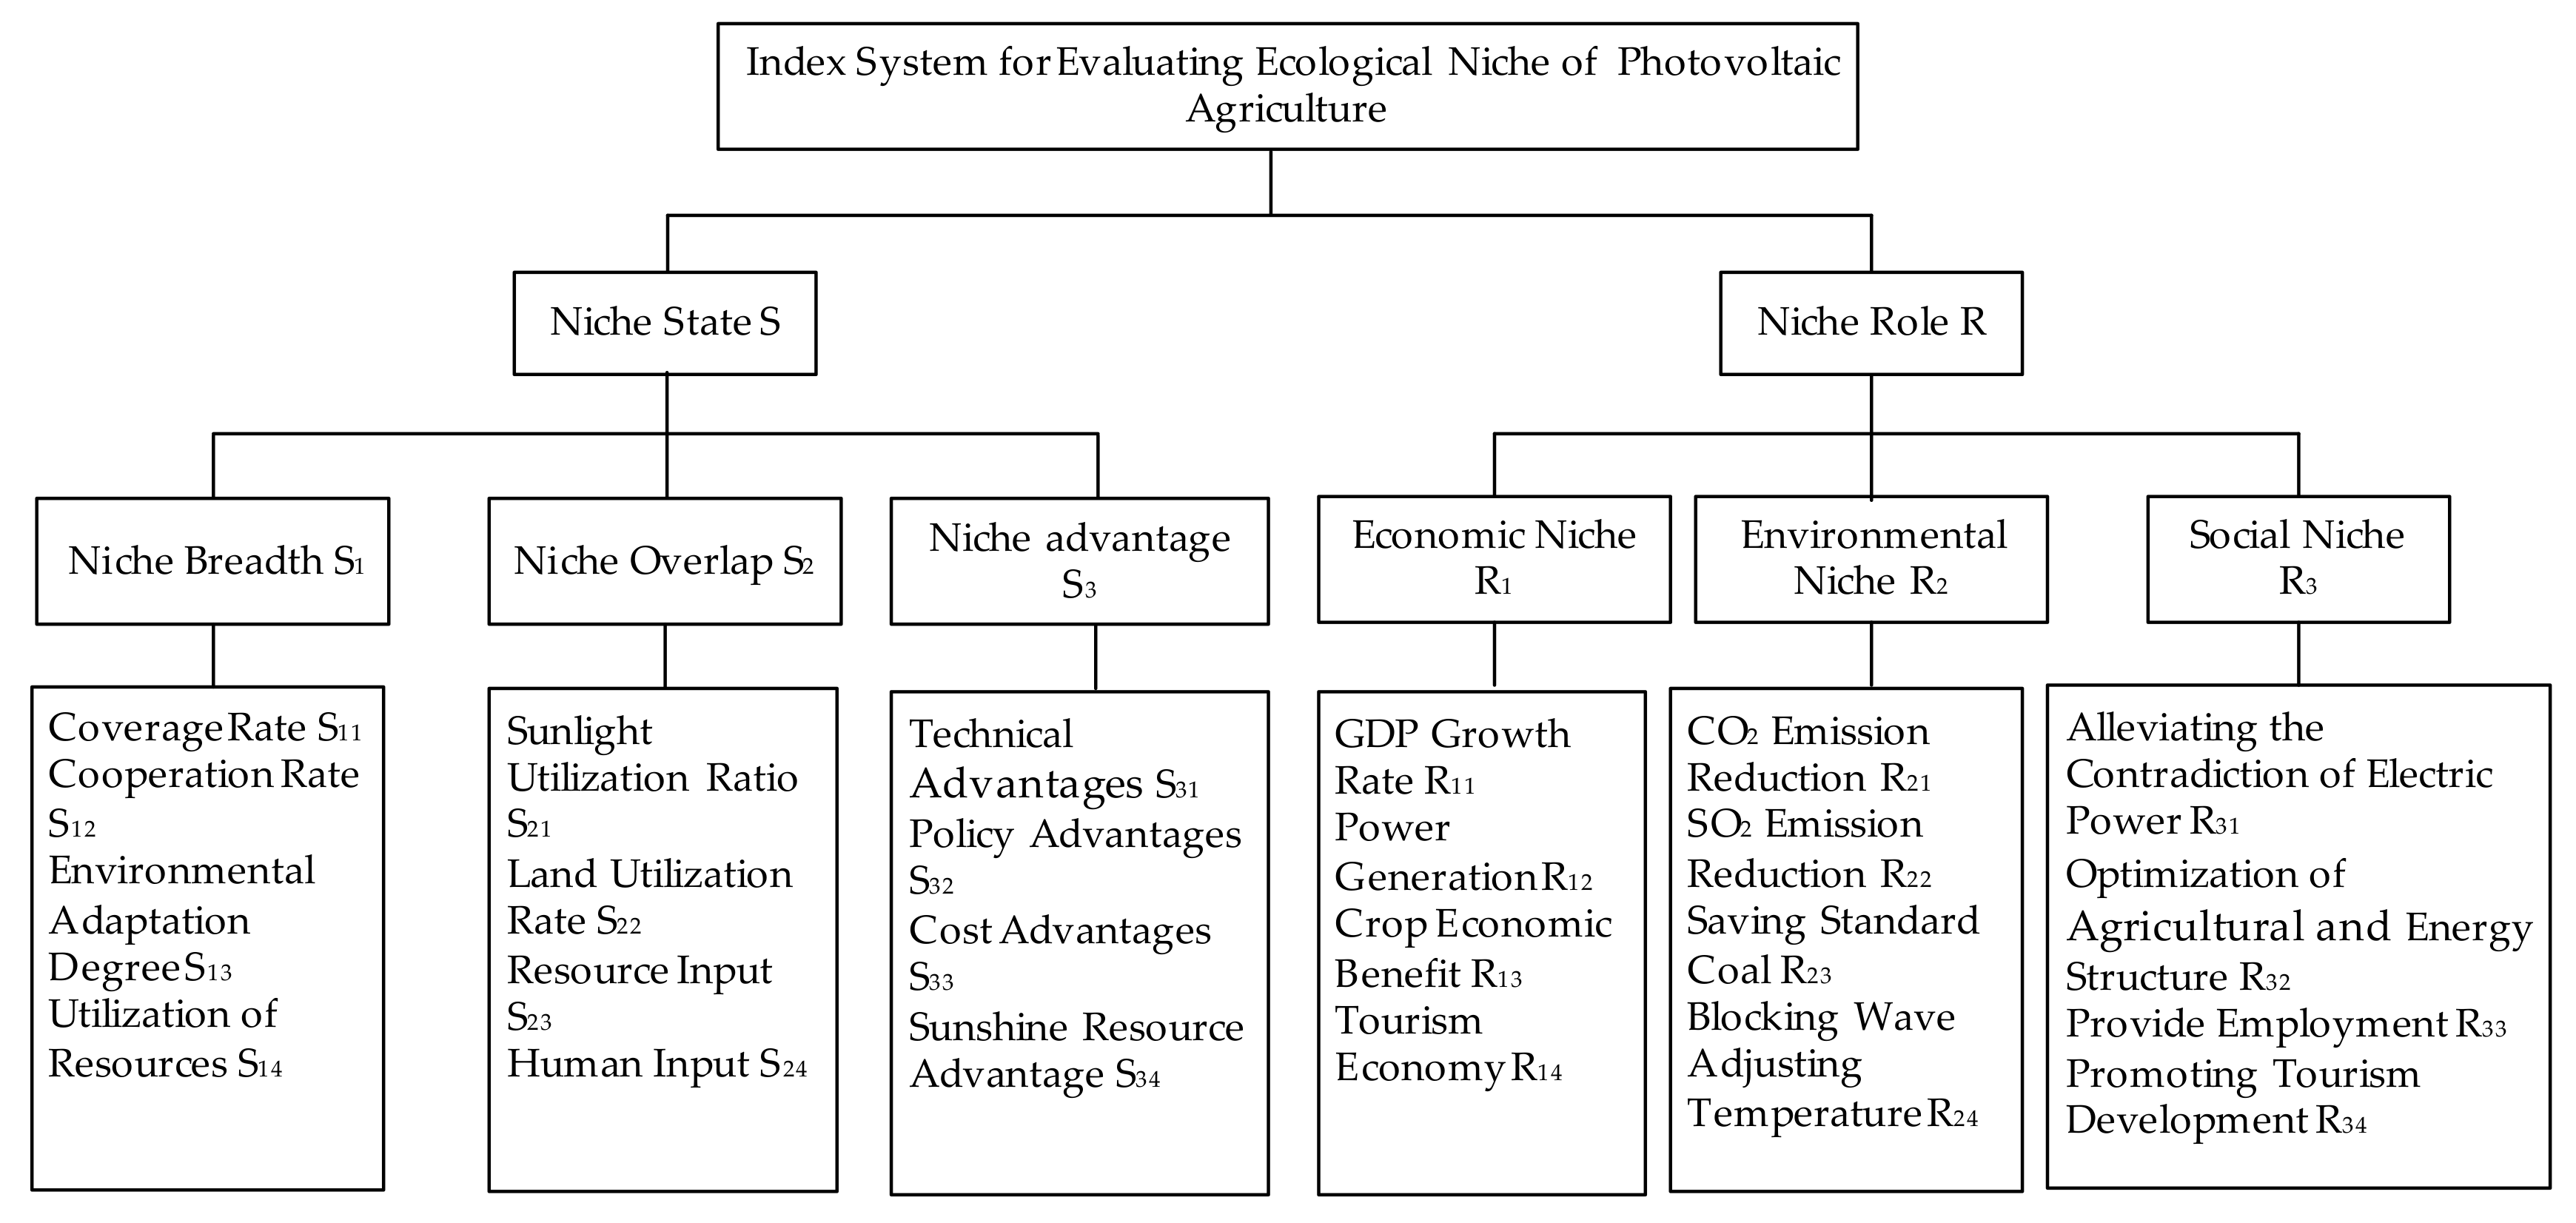
2.2. Index System Construction
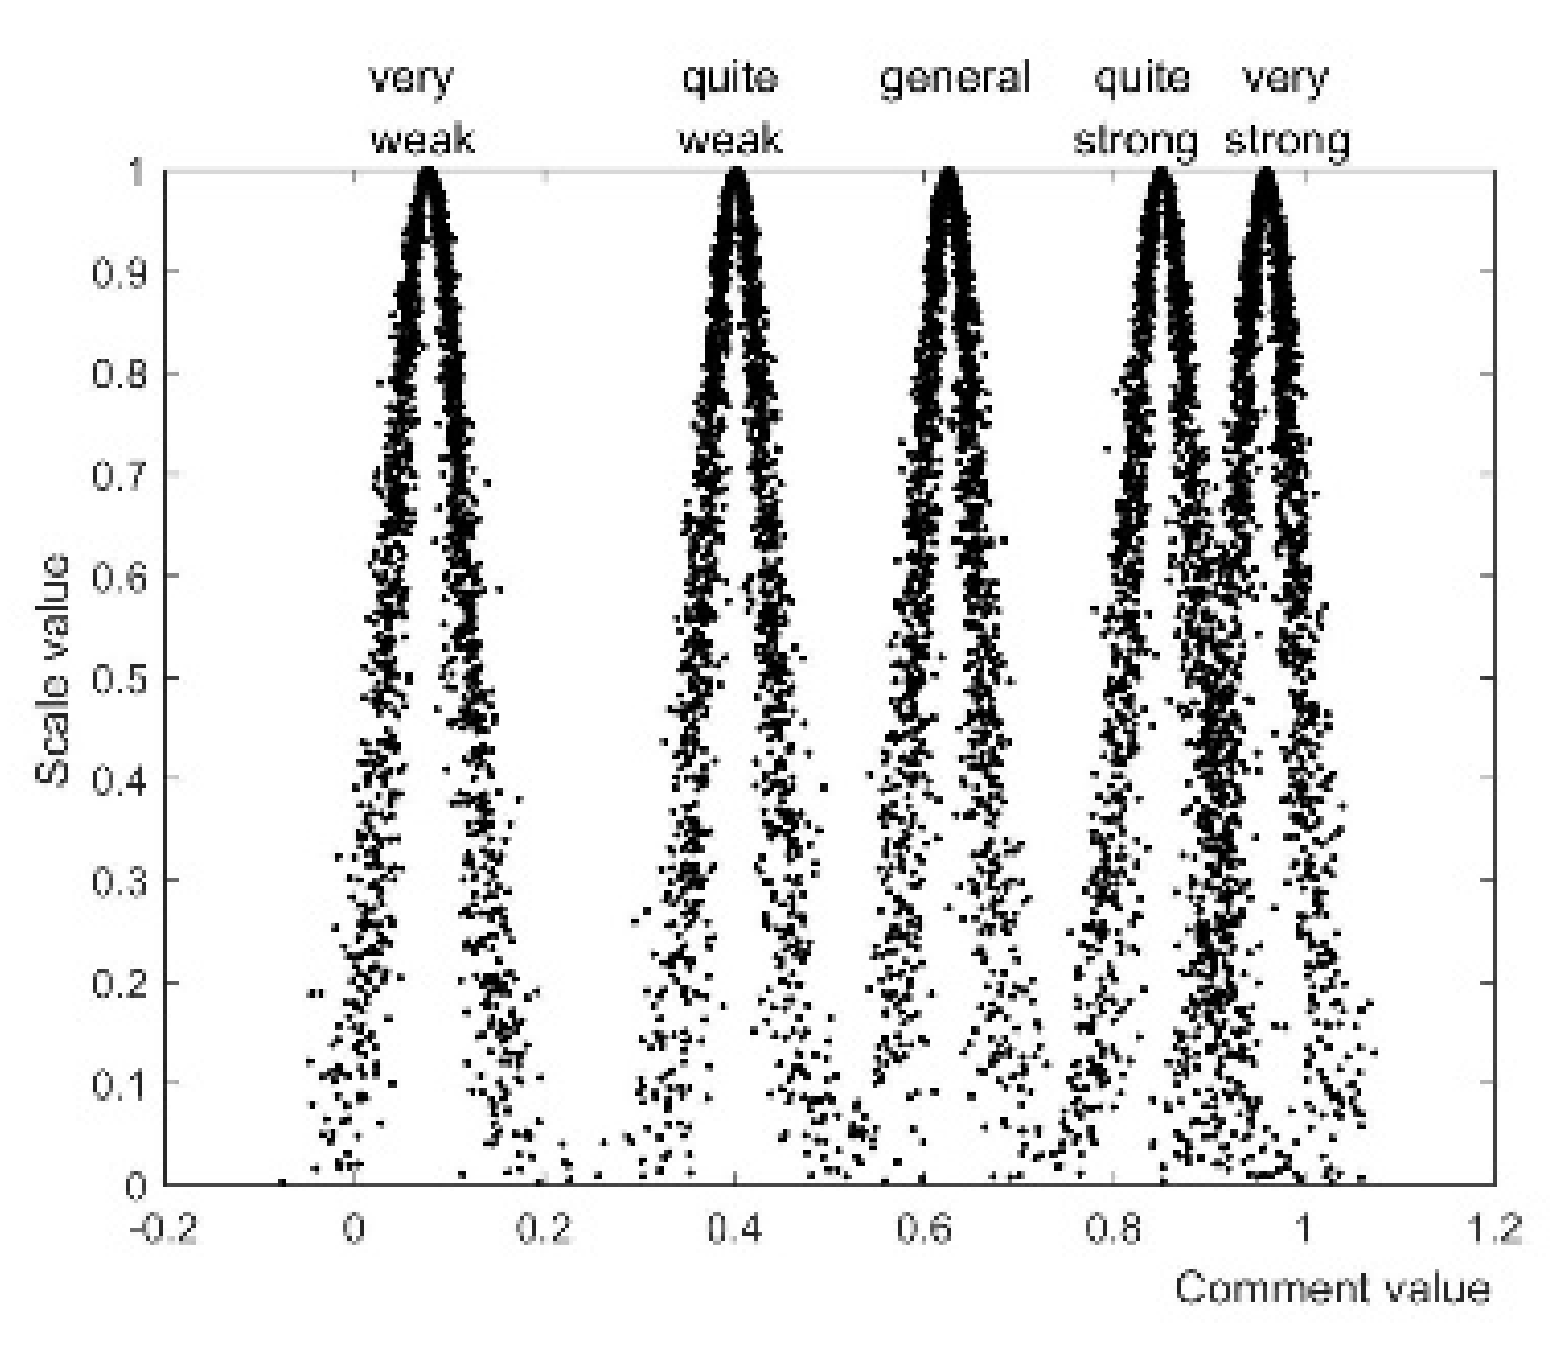
2.3. Index Comment Set
3. Methods
3.1. Weight Determination
3.2. Evaluation Method Based on Interval Cloud Model
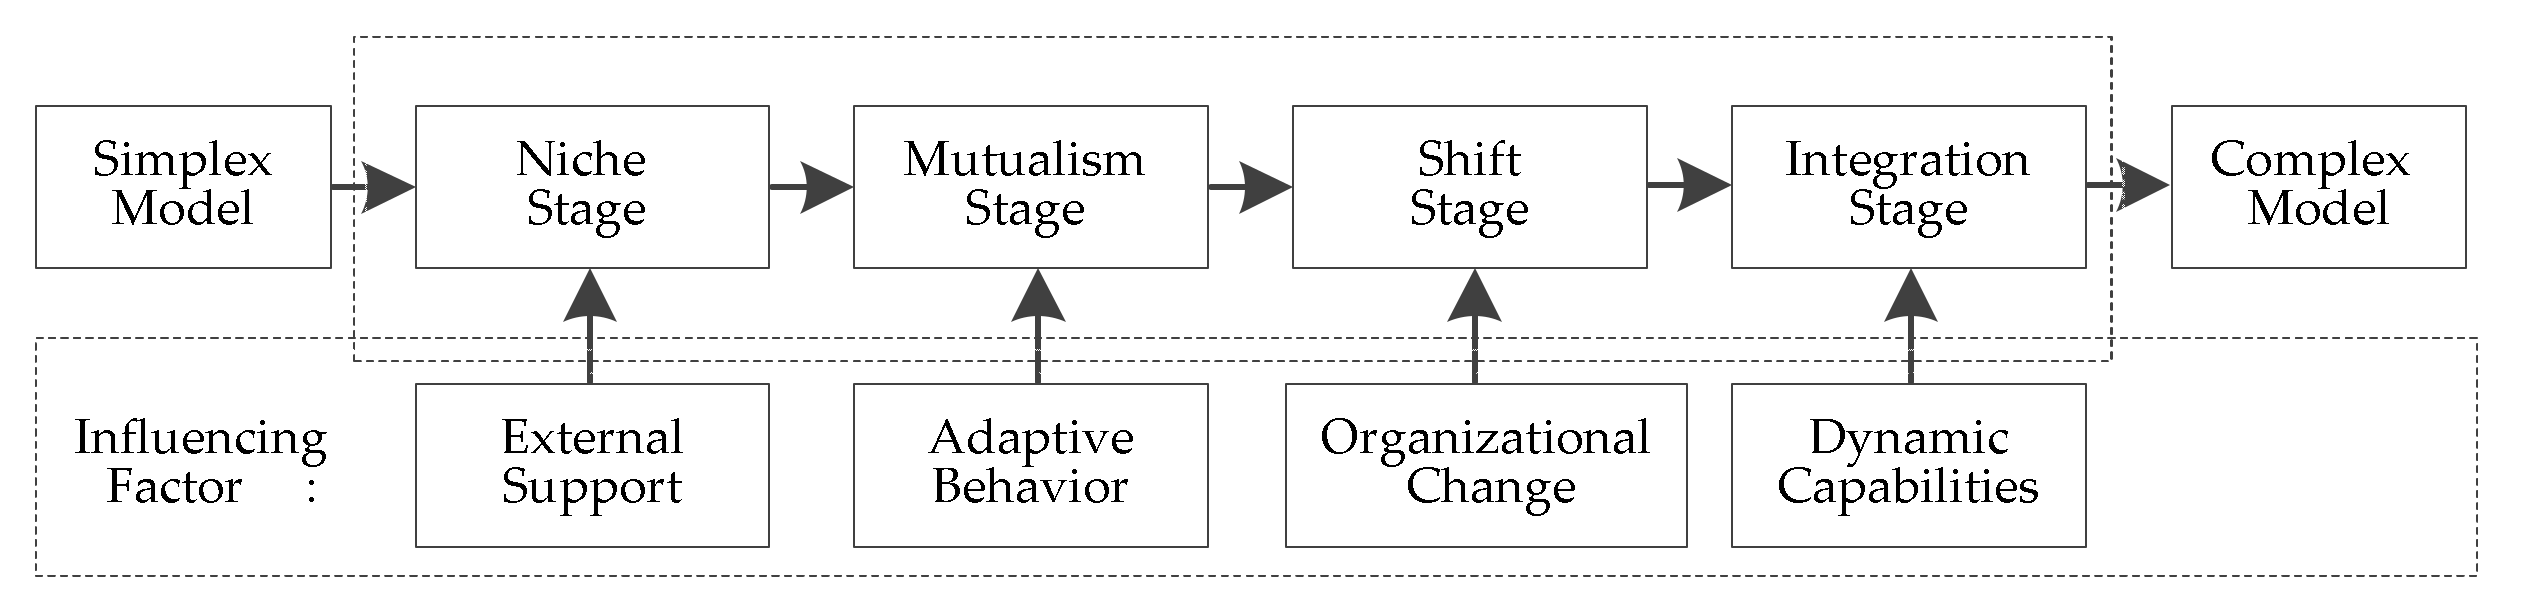
3.3. NMSI Model
4. Results
4.1. Index Weight
4.2. Evaluation Results
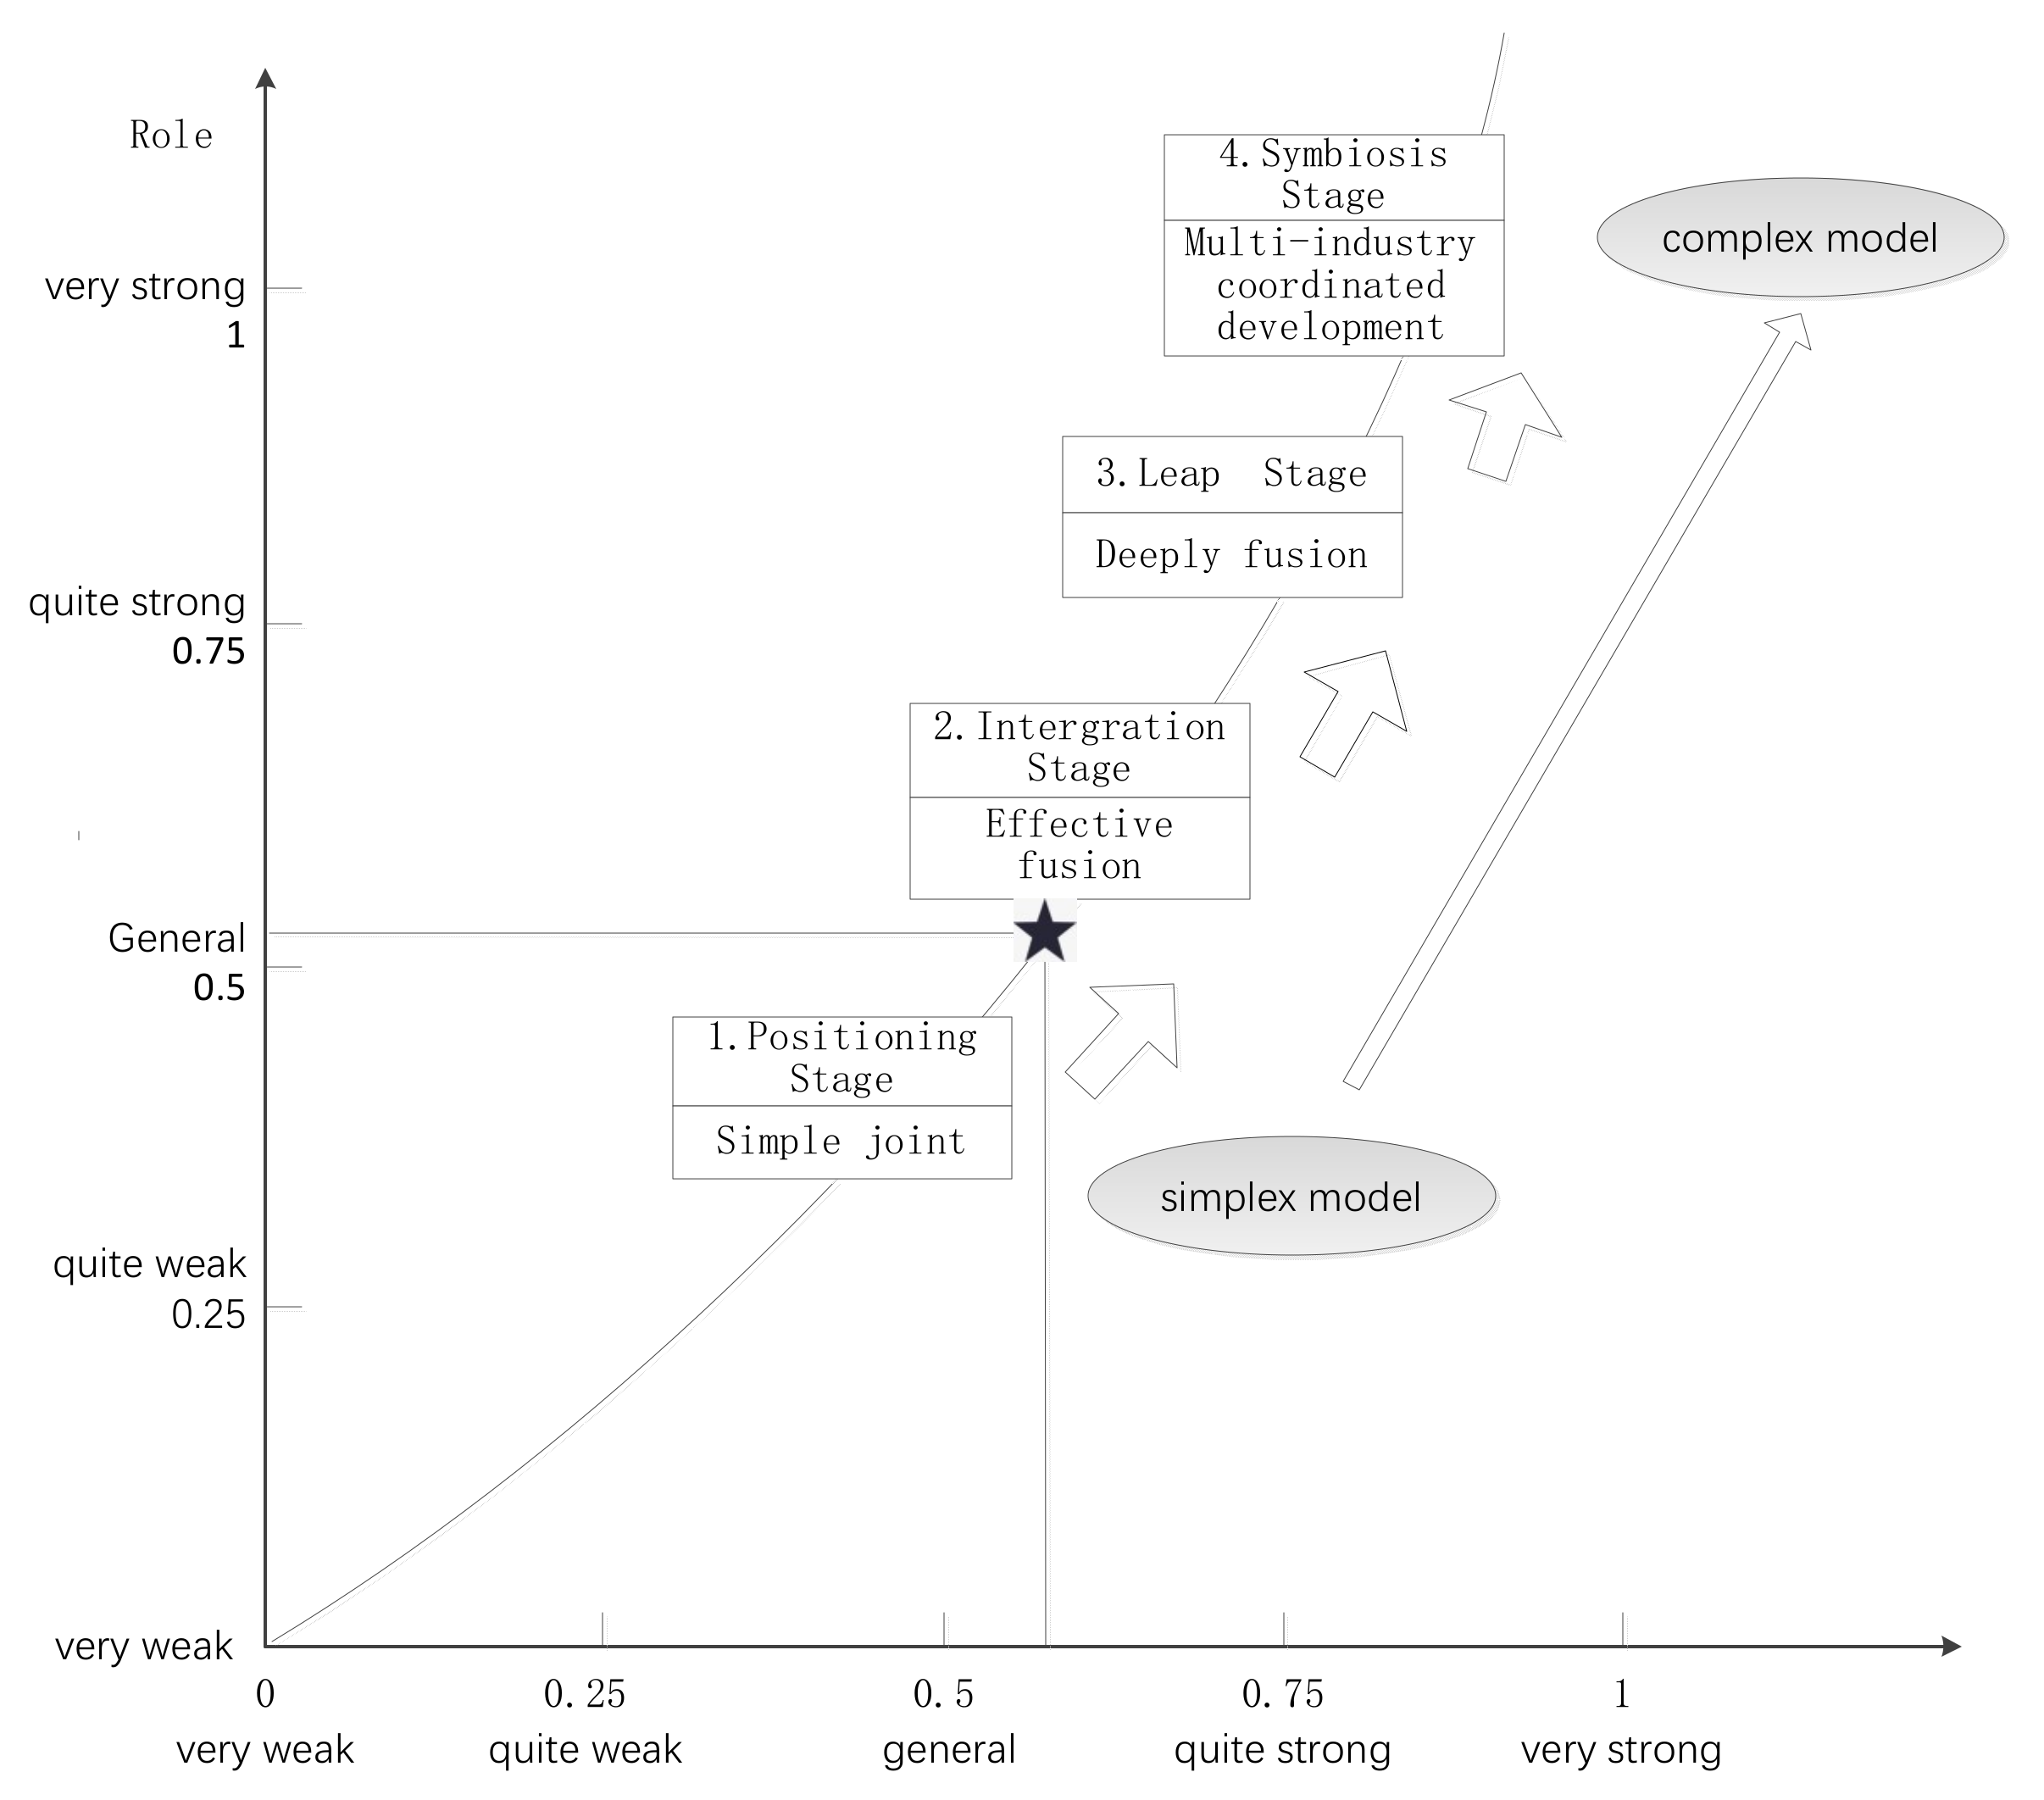
4.3. Development Stage of Ecological Niche of China’s Photovoltaic Agriculture
5. Discussion
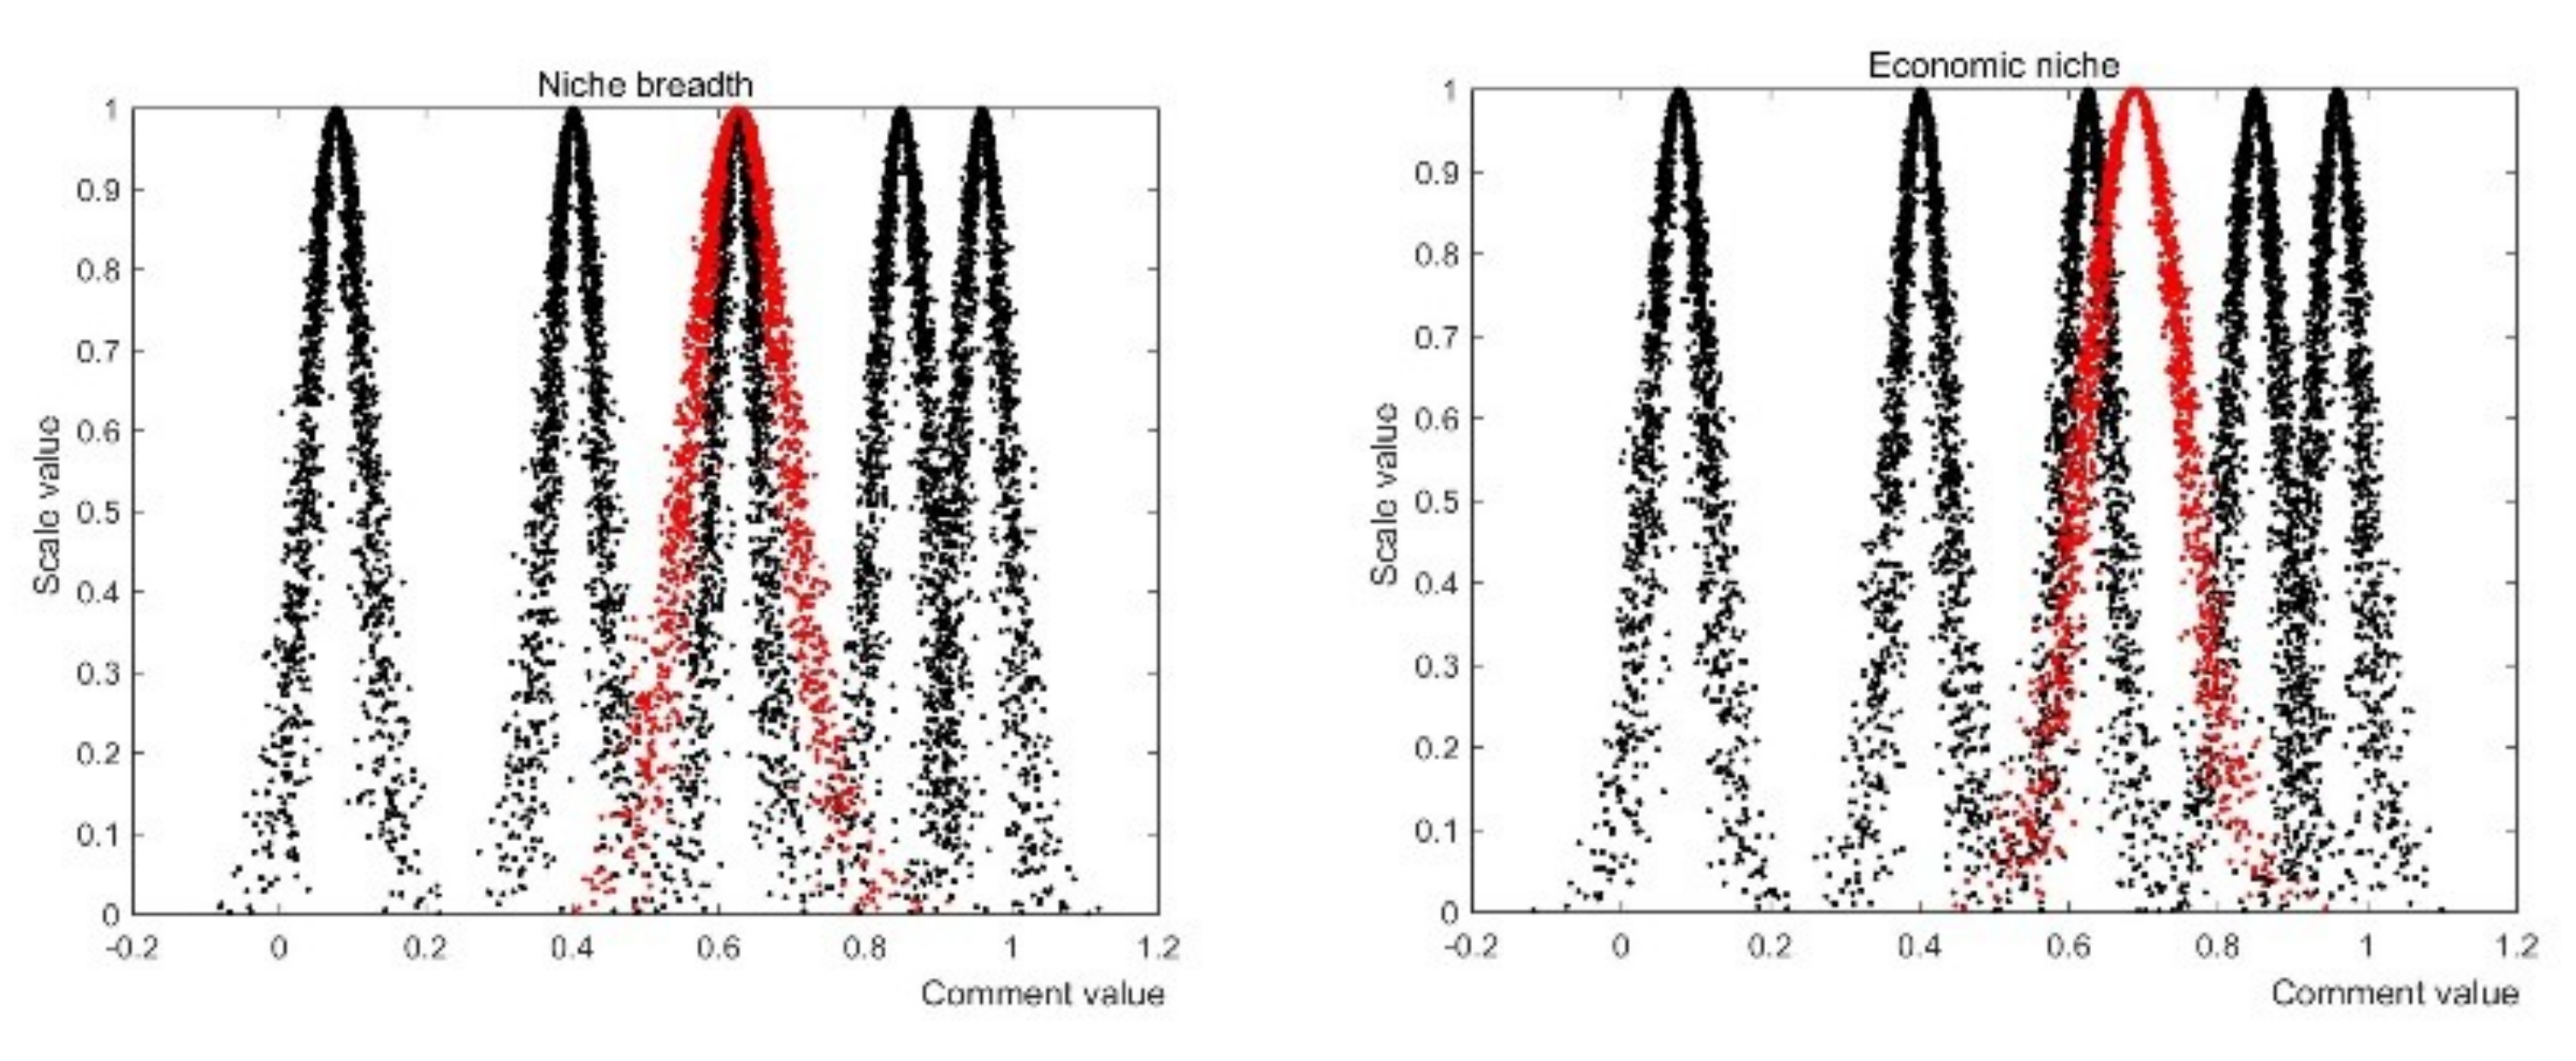
5.1. Niche State
5.2. Niche Role
5.3. Integrated Niche
6. Conclusions and Suggestions
Author Contributions
Funding
Conflicts of Interest
References
- Dinesh, H.; Pearce, J.M. The potential of agrivoltaic systems. Renew. Sustain. Energy Rev. 2016, 54, 299–308. [Google Scholar] [CrossRef]
- Brudermann, T.; Reinsberger, K.; Orthofer, A.; Kislinger, M.; Posch, A. Photovoltaics in agriculture: A case study on decision making of farmers. Energy Policy 2013, 61, 96–103. [Google Scholar] [CrossRef]
- Li, C.S.; Wang, H.Y.; Miao, H.; Ye, B. The economic and social performance of integrated photovoltaic and agricultural greenhouses systems: Case study in China. Appl. Energy 2017, 190, 204–212. [Google Scholar] [CrossRef]
- Wang, T.Y.; Wu, G.X.; Chen, J.W.; Cui, P.; Chen, Z.; Yan, Y.; Zhang, Y.; Li, M.; Niu, D.; Li, B.; et al. Integration of solar technology to modern greenhouse in China: Current status, challenges and prospect. Renew. Sustain. Energy Rev. 2017, 70, 1178–1188. [Google Scholar] [CrossRef]
- Hutchinson, G.E. A Treatise on Limnology. Geography, Physics, and Chemistry; John Wiley & Sons: New York, NY, USA, 1957; Volume 1, ISBN 978-047-142-569-4. [Google Scholar]
- Hommels, A.; Peters, P.; Bijker, W.E. Techno therapy or nurtured niches? Technology studies and the evaluation of radical innovations. Res. Policy 2007, 36, 1088–1099. [Google Scholar] [CrossRef]
- Smith, A.; Voß, J.P.; Grin, J. Innovation studies and sustainability transitions: The allure of the multi-level perspective and its challenges. Res. Policy 2010, 39, 435–448. [Google Scholar] [CrossRef]
- Seol, H.; Park, G.; Lee, H.; Yoon, B. Demand forecasting for new media services with consideration of competitive relationships using the competitive Bass model and the theory of the niche. Technol. Forecast. Soc. Chang. 2012, 79, 1217–1228. [Google Scholar] [CrossRef]
- Singh, J.V. Organizational Niches and the Dynamics of Organizational Founding. Organ. Sci. 1994, 5, 483–501. [Google Scholar] [CrossRef]
- Hannan, M.T.; Carroll, G.R.; Pólos, L. The Organizational Niche. Sociol. Theory 2003, 21, 309–340. [Google Scholar] [CrossRef]
- Hamarat, B.; Kasimoglu, M. Niche overlap—Competition and homogeneity in the organizational clusters of hotel population. Manag. Res. News 2003, 26, 60–77. [Google Scholar] [CrossRef]
- Zhu, C.Q. The Niche Ecostate-Ecorole Theory and Expansion Hypothesis. Acta Ecol. Sin. 1997, 17, 324–332. [Google Scholar] [CrossRef]
- Zhang, G.Y.; Xie, W.H.; Liu, Y.; Deng, X.F. Theory and Practice of Strategic Niche Management; Science Press: Beijing, China, 2015; ISBN 978-703-042-644-4. [Google Scholar]
- Song, Y.F.; You, J.X.; Shao, L.N.; Guo, B. Efficiency Evaluation of Niche Status of Electric Vehicle Enterprises. J. Tongji Univ. (Nat. Sci.) 2015, 43, 951–957. [Google Scholar] [CrossRef]
- Shi, B.; Tian, H.N. Research on the Path Selection of Green Process Innovation of Home Appliances Manufacturing Based on Niche Ecostate-ecorole Theory. Manag. Rev. 2018, 2, 83–93. [Google Scholar] [CrossRef]
- Mokyr, J. The Lever of Riches: Technological Creativity and Economic Progress; Oxford University Press: London, UK, 1990; ISBN 978-019-506-113-0. [Google Scholar]
- Van den Belt, H.; Rip, A. The Nelson-Winter-Dosi Model and Synthetic Dye Chemistry; MIT Press: Cambridge, MA, USA, 1987; ISBN 978-026-202-262-0. [Google Scholar]
- Smith, A.; Raven, R. What is protective space? Reconsidering niches in transitions to sustainability. Res. Policy 2012, 41, 1025–1036. [Google Scholar] [CrossRef]
- Pigford, A.-A.E.; Hickey, G.M.; Klerkx, L. Beyond agricultural innovation systems? Exploring an agricultural innovation ecosystems approach for niche design and development in sustainability transitions. Agric. Syst. 2018, 164, 116–121. [Google Scholar] [CrossRef]
- Marrou, H.; Wery, J.; Dufour, L.; Dupraz, C. Productivity and radiation use efficiency of lettuces grown in the partial shade of photovoltaic panels. Eur. J. Agron. 2013, 44, 54–66. [Google Scholar] [CrossRef]
- Allardyce, C.S.; Fankhauser, C.; Zakeeruddin, S.M.; Grätzel, M.; Dyson, P.J. The influence of greenhouse-integrated photovoltaics on crop production. Sol. Energy 2017, 155, 517–522. [Google Scholar] [CrossRef]
- Liu, W.; Liu, L.; Guan, C.; Zhang, F.; Li, M.; Lv, H.; Yao, P.; Ingenhoff, J. A novel agricultural photovoltaic system based on solar spectrum separation. Sol. Energy 2018, 162, 84–94. [Google Scholar] [CrossRef]
- Malu, P.R.; Sharma, U.S.; Pearce, J.M. Agrivoltaic potential on grape farms in India. Sustain. Energy Technol. Assess. 2017, 23, 104–110. [Google Scholar] [CrossRef]
- Mehmood, A.; Waqas, A.; Mahmood, H.T. Economic Viability of Solar Photovoltaic Water Pump for Sustainable Agriculture Growth in Pakistan. Mater. Today Proc. 2015, 2, 5190–5195. [Google Scholar] [CrossRef]
- Sacchelli, S.; Garegnani, G.; Geri, F.; Grilli, G.; Paletto, A.; Zambelli, P.; Ciolli, M.; Vettorato, D. Trade-off between photovoltaic systems installation and agricultural practices on arable lands: An environmental and socio-economic impact analysis for Italy. Land Use Policy 2016, 56, 90–99. [Google Scholar] [CrossRef]
- Jones, M.A.; Odeh, I.; Haddad, M.; Mohammad, A.H.; Quinn, J.C. Economic analysis of photovoltaic (PV) powered water pumping and desalination without energy storage for agriculture. Desalination 2016, 387, 35–45. [Google Scholar] [CrossRef]
- Zheng, S.Z.; Wu, Q.H.; Wang, H.B. General Ecology: Principles, Methods, and Applications; Fudan University Press: Shanghai, China, 1994; ISBN 7-309-01275-5/Q.43. [Google Scholar]
- Hannan, M.T.; Freeman, J. Organizational Ecology; Harvard University Press: Cambridge, UK, 1993; ISBN 978-067-464-349-9. [Google Scholar]
- Hurlbert, S.H. The Measurement of Niche Overlap and Some Relatives. Ecology 1978, 59, 67–77. [Google Scholar] [CrossRef]
- Hu, Q.Z.; Zhang, W.H. Research on Interval Number Theory and Its Application; Higher Education Press: Beijing, China, 2010; ISBN 978-703-028-993-3. [Google Scholar]
- Song, P.; Liang, J.Y.; Qian, Y.H.; Li, C.H. Research on Feature Selection Method for Interval Sorting Decision. Chin. J. Manag. Sci. 2017, 25, 141–152. [Google Scholar] [CrossRef]
- Wu, L.Y.; Yue, F.; Hu, K.; Wang, G. Innovation capability evaluation of universities based on combination of evidence grouping by interval number. Sci. Res. Manag. 2017, 4, 656–665. [Google Scholar] [CrossRef]
- Zhang, J.G.; Song, X.W.; Yang, S. Buffer Sizing of a Critical Chain Project Based on the Entropy Method. Manag. Rev. 2017, 29, 211–219. [Google Scholar] [CrossRef]
- Qian, Y.H.; Liang, J.Y.; Pedrycz, W.; Dang, C. Positive approximation: An accelerator for attribute reduction in rough set theory. Artif. Intell. 2010, 174, 597–618. [Google Scholar] [CrossRef]
- Liang, J.Y.; Wang, F.; Qian, Y.H. A group incremental approach to feather selection applying rough set technique. IEEE Trans. Knowl. Date Eng. 2014, 26, 294–308. [Google Scholar] [CrossRef]
- Xu, L.; Yao, X.L.; Li, Y.H. On the Risk Evaluation of Financing Guarantee Agencies based on Analytic Hierarchy Process. Econ. Manag. 2017, 31, 50–55. [Google Scholar] [CrossRef]
- Song, P.; Liang, J.Y.; Qian, Y.H. A two-grade approach to ranking interval data. Knowl. Based Syst. 2012, 27, 234–244. [Google Scholar] [CrossRef]
- Billard, L.; Diday, E. From the Statistics of Data to the Statistics of Knowledge: Symbolic Data Analysis. J. Am. Stat. Assoc. 2003, 98, 470–487. [Google Scholar] [CrossRef]
- Hu, T.; Jiao, Y.W. The efficiency evaluation of information networks based on interval-based cloud model. Syst. Eng. Theory Pract. 2017, 37, 478–485. [Google Scholar] [CrossRef]
- Xu, X.H.; Wu, H.D. Approach for multi-attribute large group decision-making with linguistic preference information based on improved cloud model. J. Ind. Eng. Manag. 2018, 1, 117–125. [Google Scholar] [CrossRef]
- Guo, Y.Q.; He, D.; Yao, Y. NMSI Model and Case Study in the Evolution of Innovation Ecosystem. Forum Sci. Technol. China 2017, 12, 25–31. [Google Scholar] [CrossRef]
- Chen, X.D.; Chu, Q.Q. Research on Planning of Ecological Agricultural Park PV-Powered Based on Health-oriented Agriculture. J. Agric. Sci. Technol. 2017, 19, 45–51. [Google Scholar] [CrossRef]
- Xue, J. Photovoltaic agriculture—New opportunity for photovoltaic applications in China. Renew. Sustain. Energy Rev. 2017, 73, 1–9. [Google Scholar] [CrossRef]
- Fang, Y.D.; Huang, S.H.; Qing, S.X.; Shen, W.J.; Wei, D.; Yang, M.X.; Zheng, B.; Li, Y.J. Analysis of Development Status and Prospect of Photovoltaic Agriculture. J. Chang. Veg. 2015, 18, 35–40. [Google Scholar] [CrossRef]


| Target Layer | Criterion Layer | Weight | Index Layer | Weight |
|---|---|---|---|---|
| Niche state (S) | Niche breadth (S1) | 0.2016–0.2337 | Coverage rate (S11) | 0.0531–0.0822 |
| Cooperation rate (S12) | 0.1214–0.1226 | |||
| Environmental adaptation degree (S13) | 0.0084–0.0108 | |||
| Utilization of resources (S14) | 0.0163–0.0205 | |||
| Niche overlap (S2) | 0.2420–0.2533 | Sunlight utilization ratio (S21) | 0.1412–0.1418 | |
| Land utilization rate (S22) | 0.0688–0.0803 | |||
| Resource input (S23) | 0.0165–0.0172 | |||
| Human input (S24) | 0.0142–0.0154 | |||
| Niche advantage (S3) | 0.1609–0.1695 | Technical advantages (S31) | 0.0718–0.0757 | |
| Policy advantages (S32) | 0.0682–0.0758 | |||
| Cost advantages (S33) | 0.0102–0.0105 | |||
| Sunshine resource advantage (S34) | 0.0075–0.0107 | |||
| Niche role (R) | Economic niche (R1) | 0.1413–0.1486 | GDP growth rate (R11) | 0.0174–0.0227 |
| Power generation (R12) | 0.0281–0.0400 | |||
| Crop economic benefit (R13) | 0.0762–0.0807 | |||
| Tourism economy (R14) | 0.0099–0.0150 | |||
| Environmental niche (R2) | 0.1068–0.1184 | CO2 emission reduction (R21) | 0.0377–0.0504 | |
| SO2 emission reduction (R22) | 0.0203–0.0283 | |||
| Saving standard coal (R23) | 0.0099–0.0101 | |||
| Blocking wave adjusting temperature (R24) | 0.0297–0.0387 | |||
| Social niche (R3) | 0.1081–0.1158 | Alleviating contradiction of electric power (R31) | 0.0078–0.0097 | |
| Optimizing agricultural and energy structure (R32) | 0.0381–0.0465 | |||
| Providing employment (R33) | 0.0156–0.0196 | |||
| Promoting tourism development (R34) | 0.0465–0.0490 |
| Target Layer | Criterion Layer | Index | Expected Value | Entropy | Super Entropy |
|---|---|---|---|---|---|
| Niche state (S) | Niche breadth (S1) | Coverage rate (S11) | 0.4570–0.5500 | 0.0356–0.0376 | 0.0055–0.0056 |
| Cooperation rate (S12) | 0.6840–0.7460 | 0.0847–0.0902 | 0.0125–0.0127 | ||
| Environmental adaptation degree (S13) | 0.4630–0.5340 | 0.0892–0.0990 | 0.0121–0.0142 | ||
| Utilization of resources (S14) | 0.5920–0.6570 | 0.0607–0.0677 | 0.0081–0.0102 | ||
| Niche overlap (S2) | Sunlight utilization ratio (S21) | 0.6870–0.7560 | 0.0782–0.0882 | 0.0123–0.0133 | |
| Land utilization rate (S22) | 0.7110–0.7930 | 0.1141–0.1258 | 0.0153–0.0166 | ||
| Resource input (S23) | 0.6510–0.7270 | 0.0614–0.0692 | 0.0098–0.0112 | ||
| Human input (S24) | 0.4780–0.5600 | 0.0777–0.1053 | 0.0099–0.0139 | ||
| Niche advantage (S3) | Technical advantages (S31) | 0.4530–0.5180 | 0.0852–0.0922 | 0.0111–0.0126 | |
| Policy advantages (S32) | 0.6000–0.6950 | 0.0551–0.0639 | 0.0090–0.0105 | ||
| Cost advantages (S33) | 0.6580–0.7310 | 0.0815–0.0902 | 0.0110–0.0127 | ||
| Sunshine resource advantage (S34) | 0.5900–0.6730 | 0.0664–0.0702 | 0.0101–0.0106 | ||
| Niche role (R) | Economic niche (R1) | GDP growth rate (R11) | 0.6210–0.6930 | 0.0449–0.0566 | 0.0066–0.0075 |
| Power Generation (R12) | 0.6570–0.7470 | 0.0614–0.0622 | 0.0079–0.0087 | ||
| Crop economic benefit (R13) | 0.6580–0.7430 | 0.0574–0.0707 | 0.0090–0.0103 | ||
| Tourism economy (R14) | 0.4040–0.4890 | 0.0892–0.0963 | 0.0123–0.0135 | ||
| Environmental niche (R2) | CO2 emission reduction (R21) | 0.6430–0.7200 | 0.0802–0.0840 | 0.0111–0.0118 | |
| SO2 emission reduction (R22) | 0.5430–0.6200 | 0.0802–0.0840 | 0.0111–0.0118 | ||
| Saving standard coal (R23) | 0.6150–0.6950 | 0.1065–0.1103 | 0.0142–0.0144 | ||
| Blocking wave adjusting temperature (R24) | 0.4680–0.5630 | 0.0915–0.0978 | 0.0129–0.0138 | ||
| Social niche (R3) | Alleviating contradiction of electric power (R31) | 0.5350–0.6150 | 0.0940–0.1028 | 0.0124–0.0137 | |
| Optimizing agricultural and energy structure (R32) | 0.6940–0.7760 | 0.0436–0.0491 | 0.0067–0.0070 | ||
| Providing employment (R33) | 0.4800–0.5780 | 0.0551–0.0602 | 0.0085–0.0085 | ||
| Promoting tourism development (R34) | 0.3520–0.4060 | 0.0812–0.0897 | 0.0103–0.0117 |
| Index | Expected Value | Entropy | Super Entropy |
|---|---|---|---|
| Niche breadth (S1) | 0.6049–0.6616 | 0.0662–0.0745 | 0.0098–0.0105 |
| Niche overlap (S2) | 0.6796–0.7529 | 0.0905–0.0962 | 0.0132–0.0138 |
| Niche advantage (S3) | 0.5375–0.6168 | 0.0745–0.0747 | 0.0107–0.0109 |
| Economic niche (R1) | 0.6340–0.7126 | 0.0604–0.0684 | 0.0090–0.0096 |
| Environmental niche (R2) | 0.5727–0.6418 | 0.0868–0.0896 | 0.0121–0.0125 |
| Social niche (R3) | 0.5164–0.5766 | 0.0658–0.0714 | 0.0089–0.0097 |
| Niche state (S) | 0.6169–0.6850 | 0.0776–0.0833 | 0.0113–0.0120 |
| Niche role (R) | 0.5784–0.6513 | 0.0698–0.0760 | 0.0099–0.0106 |
| Integrated niche | 0.6025–0.6728 | 0.0748–0.0806 | 0.0108–0.0115 |
© 2019 by the authors. Licensee MDPI, Basel, Switzerland. This article is an open access article distributed under the terms and conditions of the Creative Commons Attribution (CC BY) license (http://creativecommons.org/licenses/by/4.0/).
Share and Cite
Wang, L.; Wang, Y.; Chen, J. Assessment of the Ecological Niche of Photovoltaic Agriculture in China. Sustainability 2019, 11, 2268. https://doi.org/10.3390/su11082268
Wang L, Wang Y, Chen J. Assessment of the Ecological Niche of Photovoltaic Agriculture in China. Sustainability. 2019; 11(8):2268. https://doi.org/10.3390/su11082268
Chicago/Turabian StyleWang, Lingjun, Ying Wang, and Jian Chen. 2019. "Assessment of the Ecological Niche of Photovoltaic Agriculture in China" Sustainability 11, no. 8: 2268. https://doi.org/10.3390/su11082268
APA StyleWang, L., Wang, Y., & Chen, J. (2019). Assessment of the Ecological Niche of Photovoltaic Agriculture in China. Sustainability, 11(8), 2268. https://doi.org/10.3390/su11082268