Article

Can Environmental Regulation Flexibility Explain the Porter Hypothesis?—An Empirical Study Based on the Data of China’s Listed Enterprises

1
Business School, Sichuan University, Chengdu 610065, China
2
School of Economics, Sichuan University, Chengdu 610065, China
*
Author to whom correspondence should be addressed.
Sustainability 2019, 11(8), 2214; https://doi.org/10.3390/su11082214
Submission received: 16 March 2019 / Revised: 6 April 2019 / Accepted: 11 April 2019 / Published: 12 April 2019

Abstract

:
Previous studies indicate that the Porter hypothesis (PH) generates controversial and inconsistent conclusions on the impact of environmental regulation (ER) on business performance. As a result, based on the data of China’s A-share listed companies from 2016 to 2018, a moderated mediating effect model is established to examine the relationship between ER, technological innovation and business performance, as well as the moderating effect of environmental regulation flexibility (ERF) on the relationship. Results show that technological innovation has a significant mediating effect on the relationship between ER and business performance. Furthermore, ERF has a negative moderating effect on the mediating effect technological innovation exerted. At a certain degree, the flexible ER could weaken technological innovation’s mediating effects on the relationship between ER and business performance, and further could mitigate the negative impact of ER on both technological innovation and business performance. Also, an inflexible ER intensifies its negative effects on technological innovation and business performance, which is to the disadvantage of enterprises becoming the subject of environmental protection consciously and sustainably.

1. Introduction

One of the biggest challenges of the 21st century is to counterbalance environment deterioration [1,2]. To this end, various governments have been making strict environmental regulation (ER). The ER is definitely an effective approach for restraining enterprises’ behaviors to realize the improvement of environmental quality. However, this mechanism is mostly manifested as “pressure” and “passivity”. Whether ER can improve the business performance and guide businesses to take on environmental responsibilities “initiatively” and “actively” is still considered to be a theoretical controversy of inhibition [3,4,5] or promotion [6,7].
In the field of ER and business performance, the most representative study is that of Porter (1991) [8]. He suggested that the strict and appropriate ER could promote technology innovation, thereby offsetting ER costs for enterprise and improving business performance, thus creating a “win-win” result for the improvement of environment and business performance. So far, this view has been widely discussed and is acknowledged as the Porter hypothesis (PH). However, an increasing number of studies have indicated that ER is not conducive to the improvement of business performance, because enterprises will have to spend extra funds when addressing ER [9,10].
Until now, the dispute of PH validity has still existed in the academic circle, and whether there are specific premises for the establishment of the PH has become the focus of this controversy as a result. Based on China’s A-share listed companies from 2016 to 2018, this paper aims to examine the relationship between ER and business performance, and to investigate the mediating effect of technological innovation, as well as the moderating effect of environmental regulation flexibility (ERF).

2. Theoretical Background and Hypotheses

2.1. The Impact of ER on Business Performance

The core idea of the PH is that proper implementation of ER is conducive to the improvement of business performance [8]. This view has also been pursued by a large number of scholars. Testa et al. (2011) found that technical standards or emission standards can induce and stimulate enterprises to carry out technology R&D, promote the improvement of technical personnel skills, help to increase green business opportunities, and thus promote the business performance of enterprises [6]. Rassier & Earnhart (2015) took chemical enterprises as the research object and found that strict water quality regulation would promote the R&D of new technologies in chemical enterprises and have a positive impact on the business performance of enterprises [11].
However, as environmental issues become more severe, the ER of various countries has become more and more stringent, which has become a huge constraint that enterprises have to face in their business operations. Therefore, the debate on the impact of ER on the business performance of enterprises in the academic world is heating up. A common objection is that ER will limit the use of certain raw materials and pollution emissions by enterprises, increasing their production costs and reducing their business performance [12,13]. Plamer (1995) even proposed the expensive regulatory hypothesis that ER would increase the cost of enterprises [3]. Rubashkina et al. (2015) studied European countries and believed that ER would make enterprises increase additional input, such as labor, materials or capital, to meet the requirements of ER [9]. Zhu et al. (2019) believed that ER will increase the cost of raw materials, force enterprises to increase product prices, lead to partial substitution of imported products for domestic products, and lead to a decline in business performance [10]. In addition, some scholars also put forward other views on the reasons why ER reduces the business performance of enterprises. Wang (2011) and Zhao (2016) pointed out that low national economic development level will make ER unable to promote the improvement of business performance, because it is difficult to find a balance between environmental protection and economic development while in a resource-dependent development mode in economically backward areas [14,15]. Clausen et al. (2013) considered the heterogeneity of the industry, and believed that the heavy pollution industry should pay more of the cost needed to follow the ER, which has a great negative impact on the business performance of enterprises [16]. Ramiah et al. (2015) believed that the poor quality of ER, such as the lack of legislation and poor policies, has a negative effect on the business performance of enterprises [17].
Therefore, the following hypothesis is proposed:
Hypothesis 1.
ER has a negative correlation with business performance.

2.2. The Mediating Role of Technological Innovation

The focus of the PH debate is whether technological innovation can play a mediating role. The viewpoints represented by Porter held that ER can improve business performance by guiding technological innovation [18].
The exertion of this mediating effect is firstly based on the fact that ER can stimulate the technological innovation behavior of enterprises. Krysiak (2011) believed that ER can trigger technological innovation [19]. Lanoie et al. (2011) and Rubashkina, et al. (2015) also believed that ER will enable enterprises to use the funds for pollution control for technological innovation and adopt more energy saving and efficient technologies to follow ER [9,20].
By contrast, the opposing views are that under the dual pressure of market competition and environmental cost brought by ER, the technological innovation behavior of enterprises is complex and changeable. Firstly, enterprises are profit-oriented and will not take the initiative to carry out technological innovation in environmental protection with such high costs [21]. Secondly, due to the high risks and complexity of technological innovation [22], and the fact that most enterprises do not have the technology and experience of technological innovation in environmental protection, if enterprises hastily carry out technological innovation, it is likely to result in failure. Finally, the certainty of ER will limit enterprises’ choice of environmental strategy, which makes it difficult to give enterprises enough space for technological innovation [23].
Therefore, this paper proposes the following hypothesis:
Hypothesis 2.
ER has negative correlation with technological innovation.
Most scholars have reached a consensus that technological innovation plays a positive role to business performance [24]. Although the initial investment of technological innovation is large, and it is difficult to have a positive impact on the business performance in the short term. However, from a long-term perspective, technological innovation can help enterprises improve production efficiency and enhance market competitiveness and has a positive impact to business performance [25]. The technological innovation of enterprises will also improve the ability of pollution control and reduce the fines caused by environmental problems. Active participation in the technological innovation of environmental protection will also help enterprises to establish a green image and obtain a good market reputation and better business opportunities.
Therefore, the following hypotheses can be deduced:
Hypothesis 3.
Technological innovation has positive correlation with business performance.
Hypothesis 4.
Technological innovation has a mediating effect on the relationship between ER and business performance.

2.3. The Moderating Role of ERF

In order to find out the specific premise of the PH, some scholars have carried out exploratory research. Porter and Linde Van der (1995) went on to further explain and improve the PH, while emphasizing that one of the important premises of the establishment of the PH is ERF [18]. The ERF signifies that the government formulates environmental protection targets, gives sufficient time and space to the enterprises for implementation, and provides different incentives according to the implementation of ER [26,27,28]. Under this inspiration, more and more studies have found that there are differences in the impact of ER with different degrees of flexibility on enterprise business performance [29,30,31].
Ren et al. (2018) divides ER into three categories: command-and-control regulation (CCR), namely emission standards, emission permits and other mandatory ER; Market-based regulation (MBR) is the ER designed to encourage polluters to reduce pollution, such as sewage charge; Voluntary regulation (VR) refers to the relatively loose ER, such as public opinion, negotiation and so on [32]. The study found that the impact of different types of ER on business performance varies.
For the specific adjusted mechanism of ERF, the “narrow” PH emphasizes that flexible ER is more conducive to the exertion of the mediating effect of technological innovation, compared with normative ER such as technical standards [33,34]. According to the resource-based theory, when an enterprise is confronted with flexible ER, they are able to use their innovation capabilities to achieve the desired results in the most cost-effective way, thus offsetting the negative impact of ER on its business performance [14,35]. The reason why ERF has the effect is that when an external pressure (flexible ER here) provides opportunities to exploit internal capabilities innovatively, firms will utilize them to their competitive advantage [35].
Based on the above analysis, the following hypothesis is proposed:
Hypothesis 5.
The mediating effect of technological innovation is negatively regulated by ERF.
Based on the above theoretical background and hypotheses, the research model of this paper is shown in Figure 1.

3. Variables, Data, and Methodology

3.1. Variables

3.1.1. Dependent Variable

Business performance (BP) is selected as the dependent variable. The business performance of an enterprise refers to the evaluation of the efficiency related to resource utilization. Many scholars use a single financial indicator, such as ROA, Tobin Q [36]. Some scholars use a multi-dimension method to calculate the business performance of enterprises comprehensively. Sheng et al. used investment return, sales growth rate, market share growth rate and other indicators [37]. Hategan et al. (2018) adopted ROA and Tobin Q [38]. Compared with a single financial indicator, a measurement method integrating multiple financial indicators can reflect the business performance in a more comprehensive, scientific and accurate way. Therefore, this paper uses a financial crisis as a comprehensive evaluation method of business performance, which includes corporate profitability, asset liquidity, financial leverage, etc. [39]. This paper adopts the Atman score to mark the business performance of enterprises [40], as shown in Equation (1).
Z-score = 1.2X1 + 1.4X2 + 3.3X3 + 0.64X4 + 0.99X5,
X1 = working capital/total assets; X2 = retained earnings/total assets; X3 = profit before interest and tax/total assets; X4 = market value of equity/book value of liabilities; X5 = sales/total assets.

3.1.2. Independent Variable

The independent variable is ER. Because it is difficult to find data directly used to measure ER intensity, many proxy variables, such as per capita income level [41], the proportion of pollution investment in the total output value of enterprises [36,42], cost and expenditure on pollution control [9,43], pollutant discharge [44] are used to measure it. The method proposed by Jiang et al. (2013) is adopted in this paper, which calculates the comprehensive index of pollution emissions in each region as an index of the ER intensity in this region [44]. This method is used because the greater the total amount of pollution emitted in a region, the more stringent ER there is. By collecting the waste water, gas, solid and industrial output value of each province from 2013 to 2015, the emission value per unit output value of pollutants in each province is calculated, which is standardized linearly, adjusted and has a weighted average. Then, the average value of three years is calculated to obtain the pollutant emission amount as ER score of each province. The specific steps are as follows:
Firstly, linear standardization was carried out for pollutant emission value per unit output value of each province. The calculation method is shown in Equation (2).
UESij = [UEij − min(UEj)]/[ max(UEj) − min(UEj)]
UEij is the emission value per unit output value of j pollutant in province i, and Max (UEj) and min(UEj) respectively represent the maximum and minimum emission values per unit output value of pollutants in different provinces. UESij is the standardized emission value per unit output value of pollutants.
Secondly, the adjustment coefficient of each index is calculated. Due to the significant differences in the development level, geographical location and climatic conditions of different provinces, the pollution situation in different provinces is different. Even in the same province, there are significant differences in the emissions of different pollutants. This paper reflects the difference of pollution degree approximately by adjusting the coefficient. The specific methods are as Equation (3).
W ij = U E i j   i = 1 n UE ij
N means there are n provinces.
Finally, the total ER score (ERS) is calculated. Through the weight of each index and the standardized value of each index, the ER of each province can be calculated. The method is shown in Formula (4). Finally, the average of three years’ ER scores is taken to obtain the final ER scores of each province ERS i ¯ .
ERS i = j = 1 m W i j × U E S i j m
M means there are m pollutants.

3.1.3. Mediating Variable

The mediating variable is technological innovation (TI). R&D investment is the main basis for technological innovation, so the amount of R&D investment determines the level of technological innovation directly. In this paper, R&D investment is used as a proxy variable to measure the level of technological innovation. The higher the R&D investment, the higher the level of technological innovation.

3.1.4. Moderating Variable

The moderating variable of this paper is environmental regulation flexibility (ERF). The measurement of the degree of ERF is relatively complex and has not yet formed a unified understanding. Ramanathan et al. (2018) designed a scale to measure the ERF, including economic incentive, economic penalty and production restriction [35]. However, this scale mainly measures the subjective perception of the ERF of enterprises, and the production restriction index is not easy to measure accurately, which affects the objectivity and rationality of measurement results. Therefore, this paper adopts a content analysis method to analyze the three index dimensions of economic incentive, economic punishment and policy incentive. Compared with the scale questionnaire, content analysis of government documents can more objectively and systematically find the significant characteristics of research objects [45,46]. This paper draws on the research of Huang et al. (2010) to conduct content analysis of collected environmental policies [45].
The specific steps are as follows: firstly, collect policy texts. 149 copies of environmental policies were collected through the official website of environmental protection departments of each province in China, including regulations, plans, opinions, methods and other documents reflecting government policies. Secondly, determine the content analysis unit. There are differences in environmental conditions, economic and technological development basis, government administrative means and enterprise development level in different provinces, which lead to the differences in the degree of ER and ERF. Therefore, in order to increase the accuracy of the research results, provinces are taken as content analysis units and 149 environmental policy texts are numbered, as shown in Table 1. Thirdly, keywords are defined. According to research of Ramanathan et al. (2018) on the ERF and the analysis purpose of this paper, keywords are defined from the three dimensions of economic incentive, economic punishment and policy incentive, as shown in Table 2. Finally, analyze the frequency of keyword words. The scores of each dimension of ERF in different provinces are calculated, and the weighted average is used to obtain scores of the final ERF, as shown in Table 3.

3.1.5. Control Variables

In order to ensure the objectivity of the research, some control variables are also considered.
Local dummy variable (LDV). Due to unbalanced regional development in China, technological innovation and business performance of enterprises vary greatly [47]. If the registered location of the enterprise is in Beijing, Shanghai, Guangdong and other developed areas, the value is 1; otherwise, the value is 0.
Industry characteristics (IC). The degree of environmental pollution of enterprises in different industries is different obviously, and they are subject to different ERs. If this enterprise is heavy polluting industry, the value is 1, otherwise, the value is 0. The criterion is based on the environmental protection verification industry classification management directory of listed companies issued by the ministry of environmental protection of China. Heavy pollution industry can be divided into the excavation industry; textile, garment and fur industry; metal and nonmetal industry; biological and pharmaceutical industry; petrochemical plastics industry; paper making and printing industry; food and beverage industry; water, electricity and coal industry. There are eight types of polluting industries.
Enterprise nature (EN). Considering the particularity of China’s enterprises in the form of ownership, this paper considers the difference in the nature of enterprises. A state-owned enterprise is assigned a value of 1, otherwise, the value is 0.

3.2. Data

The data of this paper come from the following sources: the data of ER come from the official website of the national bureau of statistics in China; the initial data of business performance and technology innovation are from CSMAR database. The initial data on the ERF came from the official website of China’s provincial environmental protection bureaus.
This paper takes the A-share listed companies from 2016 to 2018 as samples, and selects them through the following steps: (1) Exclude the sample enterprises with abnormal financial conditions (ST, *ST). (2) Eliminate the financial industry sample enterprises. (3) Reject the sample enterprises of environmental protection industry. The main business of the environmental protection industry is environmental protection, so the impact of ER on these enterprises is significantly different from other enterprises. (4) Remove variable data missing sample enterprises. Finally, 2621 sample enterprises were obtained.

3.3. Methodology

In this paper, the moderating mediating effect test method proposed by Wen et al. (2006) is adopted for analysis [48]. The specific method is as follows:
  • Do the regression of dependent variable to independent variable and moderating variable.
  • Do the regression of mediating variable to independent variable and moderating variable.
  • Do the regression of dependent variable to independent variable, moderating variable and mediating variable.
  • Do the regression of dependent variable to independent variable, moderating variable, mediating variable, the interactive item of moderating and mediating variable.
In the process of test, if the coefficient of the independent variable in the first two steps is significant, and the coefficient of the mediating variable in the third step is significant, it can indicate that the mediating effect of the mediating variable is significant. If the interaction term coefficient in step 4 is significant, it indicates that there is a significant mediating effect of regulation.

4. Results and Discussion

4.1. The Impact of ER on Business Performance

In order to determine the impact of ER on business performance, the model 1 defines business performance as the dependent variable and ER as the independent variable. The regression results are shown in Table 4 below. The maximum value of VIF is 1.073, indicating that there is no severe collinearity.
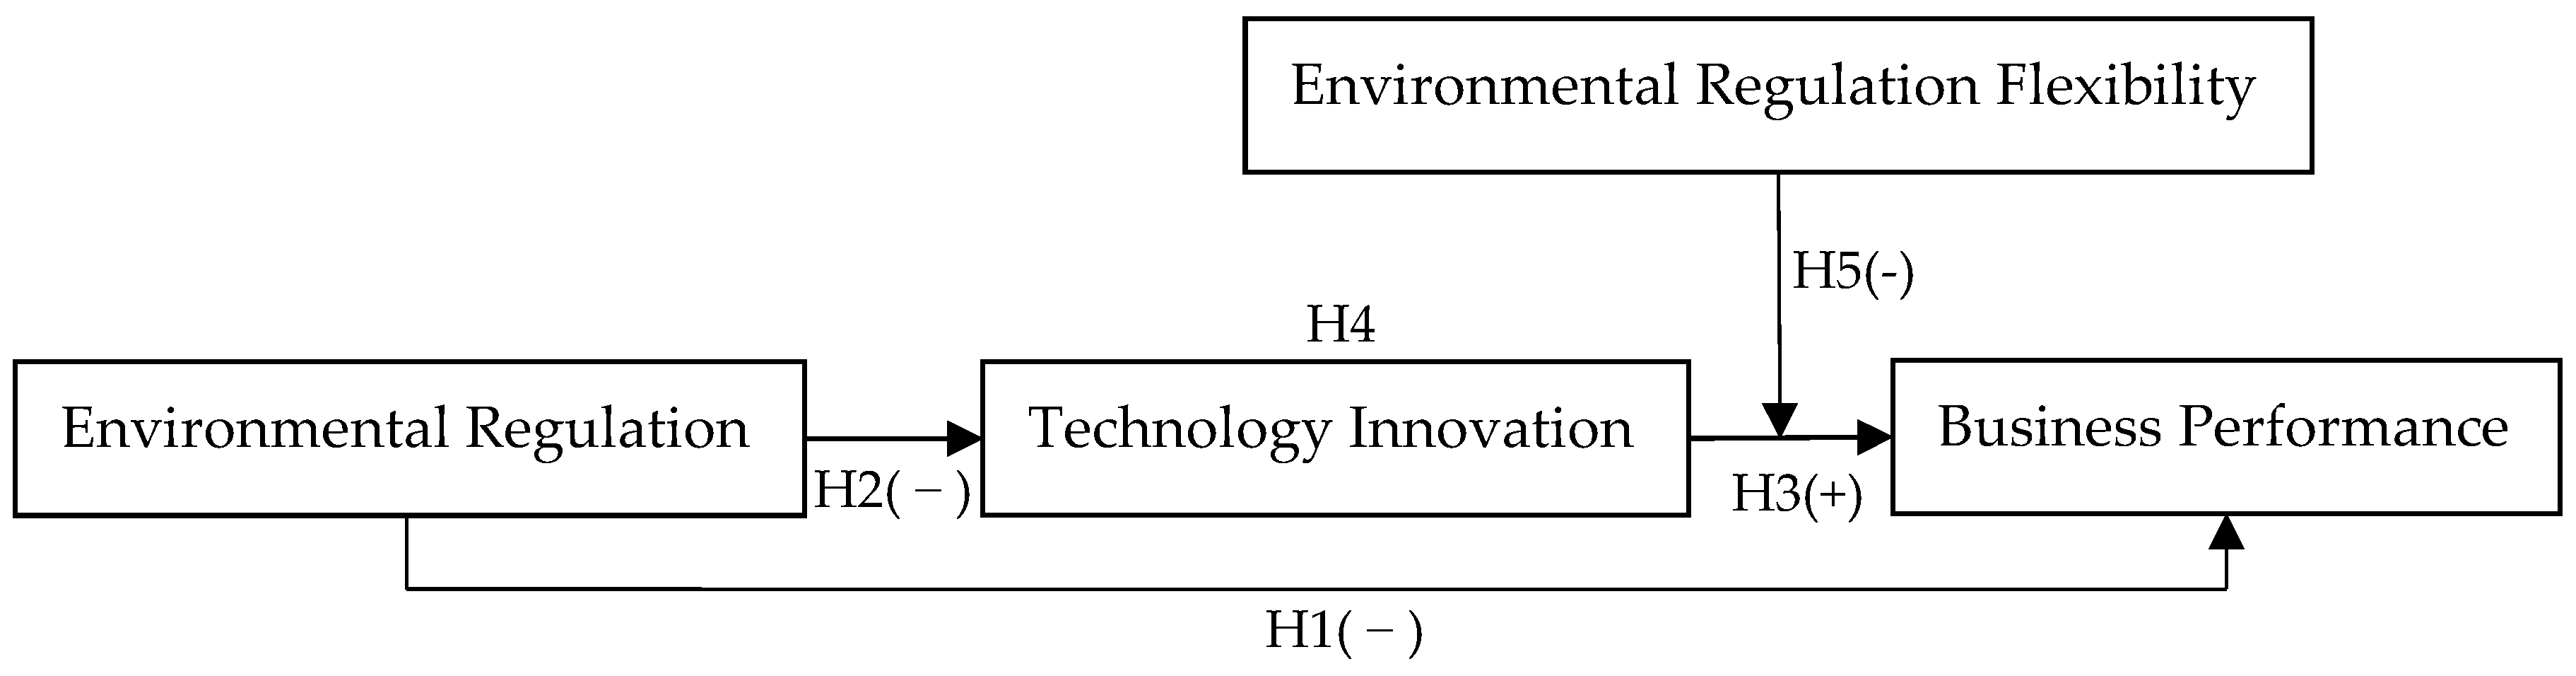
There is a significant negative correlation between ER and business performance (β = −0.112, p < 0.01), and Hypothesis 1 is supported. This shows that under the strong ER, the business performance of enterprises is not good. This result is contrary to the PH and consistent with the research results of Plamer (1995), Rubashkina et al. (2015) and Zhu et al. (2019) [2,8,9].
In addition, the industry characteristics and business performance have a significant positive correlation (β = 0.07, p < 0.05). That is, enterprises in the pollution industry can achieve better business performance, which is consistent with the actual situation for China and most developing countries, because the economic foundation and the level of science and technology in these countries is poorer, meaning companies with competitive advantages are concentrated in heavy pollution industries. At the same time, the enterprise nature has a significant negative relationship with the business performance (β = −0.204, p < 0.001), because private enterprises have higher management efficiency than state-owned enterprises in China, so they can obtain better business performance.

4.2. The Mediating Effect of Technological Innovation

In order to test the mediating effect of technological innovation, model 2 and model 3 are established in this paper. According to the regression results in Table 5, VIF values of corresponding variables in both models are close to 1 and far less than 5, indicating that there is no serious collinearity between variables.
Model 2 shows the regression result of technological innovation and ER, indicating that there is a significant negative correlation between ER and technological innovation input (β = −0.394, p < 0.001), and Hypothesis 2 is supported, indicating that ER may constrain technological innovation input of enterprises.
Model 3 adds technological innovation on the basis of model 1. The results show that there is significantly positive correlation between technological innovation and business performance (β = 0.040, p < 0.001), and Hypothesis 3 is supported. In addition, the technology innovation regression coefficient in model 3 (β = 0.04, p < 0.001), and the ER regression coefficient in model 1 and model 2 (β = −0.112, p < 0.001; β = −0.394, p < 0.001) are significant. Hypothesis 4 is supported, indicating that technological innovation has a mediating effect on the relationship between ER and business performance, that is, ER will cause enterprises to reduce investment in technological innovation, thus leading to poor business performance.
More importantly, after adding technological innovation, the significance degree of negative correlation between ER and business performance is reduced (β = −0.096, p < 0.05), indicating that enterprises can reduce the adverse impact of ER on business performance through technological innovation investment.
In addition, local dummy variables are positively correlated with technological innovation (β = −0.301, p < 0.001), because enterprises in developed regions have relative resource advantages, and are also facing fiercer market competition. So, they invest more in technological innovation. The enterprise nature is positively correlated with technological innovation (β = 0.388, p < 0.001) and negatively correlated with its business performance (β = −0.022, p < 0.001), which indicates that state-owned enterprises have obvious resource advantages and relatively large investment in technological innovation. However, the advantage of innovative resources has not been transformed into a market competitive advantage because it is limited by low management efficiency.

4.3. The Moderating Effect of ERF

Finally, model 4 is established in order to check the moderating effect of ERF, and the regression results are shown in Table 6. Although the VIF value of the ERF and interactive item of ERF and technological innovation is large relatively, which is a collinearity problem caused by the interaction term and has little influence on the research conclusion.
The interpretation degree of model 4 (R2 = 0.031, F = 12.119, p < 0.001) is improved compared with model 3 (R2 = 0.029, F = 12.783, p < 0.001). Although the increase of R2 is small (0.2%) after the addition of the interaction term, Chaplin (1991) pointed out that if the sample size is large enough and the interaction term coefficient is significant in the multiple regression, the conclusion would be valid even with a small R2 in the test of the regulation effect [49]. As Table 6 shows, the interaction term between ERF and technological innovation is significant (β = −0.008, p < 0.01), which proves that ERF has a negative moderating effect on the mediating effect of technological innovation, and Hypothesis 5 is supported.
In order to further test the regulatory effect of ERF, this paper takes the median of ERF as the boundary, divides the samples into a low ERF group and high ERF group. The mediating effect of technological innovation in these two groups is researched in this paper. Referring to Wen & Ye (2014), hierarchical regression analysis is used to test the mediating effect [50].
Table 7 shows the regression results of the group of low ERF. The regression coefficients of ER in model 5 and model 6 (β = −0.176, p < 0.05); β = −0.572, p < 0.001), and the technological innovation (β = 0.059, p < 0.001) in model 7 are significant. It shows that under the inflexible ER, technological innovation has a significant mediating effect on the relationship between ER and business performance.
The regression results of the group of high ERF are shown in Table 8. As model 10 shows, the regression coefficient of technical innovation is not significant (β = 0.14, p > 0.001), and it fails to pass the sobel test. The model also shows that under the high flexible ER, technological innovation has no significant mediating effect on the relationship between ER and business performance.
The above results further prove that the mediating effect of technological innovation is negatively adjusted by the ERF.

4.4. Discussion of Statistical Results

Based on the results of regression analysis, this study on the relationship between ER and business performance, which takes technological innovation as a mediator variable and ERF as a moderator variable, has the following major statistical results.
First, ER is negatively correlated with business performance, and technological innovation has a significant mediating effect on the relationship between them. The reasons are as follows: (1) ER make enterprises spend extra environmental protection such as pollution control, which increases the cost of enterprises, limits the investment of technological innovation, affects the market competitiveness of products, and thus leading to the lower business performance of enterprises. (2) ER will distract enterprise managers from coping with various environmental inspections and divert their attention from technological innovation, affecting enterprise management efficiency, which adversely affects enterprise business performance. (3) The constraint of ER will force some polluting enterprises to move to areas with weak ER [51], but these areas often lack basic resources and necessary conditions for technological innovation, making it difficult for enterprises to improve their business performance through technological innovation.
Second, the mediating effect of technological innovation between ER and business performance is negatively adjusted by ERF. The main reasons for this are as follows: (1) The more flexible ER sets challenging goals for enterprises and provides sufficient time for technological innovation [52]. Instead of being forced to follow strict ER, some enterprises with technological innovation capability are willing to increase investment in technological innovation to make them more competitive and improve their business performance. (2) With the increasing intensification of green consumerism, enterprises with a green image and environmental protection products have stronger market competitiveness [53]. At this time, the more flexible ER provides more favorable conditions for enterprises to carry out environmental protection technology innovation. By increasing investment in technology innovation, enterprises can establish the image of green enterprises in the market with cleaner and more environmentally friendly technological processes and green products, while hedging the adverse impact of ER with “innovation compensation”. (3) The more flexible ER is attractive to foreign direct investment (FDI) [51]. FDI provides financial support for technological innovation of enterprises, filling the technological innovation capital gap caused by ER, and enabling enterprises to improve business performance through technological innovation. (4) Under the overly flexible ER, there are some “gray areas” that are not conducive to the effective implementation of ER, which will give rise to a large number of “speculative behaviors”, “power rent-seeking” and so on. Therefore, enterprises cannot offset the compliance cost through “innovation compensation”, which will also weaken the mediating effect of technological innovation.

5. Conclusions

Based on the empirical analysis of the relationship among ER, technological innovation and business performance, as well as the moderating effect of ERF, several conclusions and implications can be drawn.
Firstly, both the mediating effect of technological innovation and moderating effect of ERF should be considered when analyzing the impact of ER on business performance. In the recent era, global environmental problems have been increasingly critical, and the world economy has been continuously experienced economic recession [54]. How to find an optimal balance between environmental protection and economic development has become an important issue of common concern to the governments and environmental protection organizations of all countries. In existing studies, both supporters and opponents of the PH only emphasize the positive or negative effects of ER, which cannot address this issue in the most effective way. This paper suggests that the key to achieving a “win-win” situation between environmental protection and economic development lies in the reasonable design of the degree of ERF. This can further promote technological innovation to produce a beneficial intermediary effect. When the requirements of ER are relatively strict, adopting a more flexible ER mode can effectively unlock the constraints of ER on technological innovation. This means enterprises have the motivation and ability to achieve the improvement of business performance through technological innovation. However, when the requirements of ER are relatively loose, flexible ER may cause enterprises to have “speculative behavior” and reduce the investment in technological innovation, thus affecting the sustainable development of enterprise business performance.
Secondly, this study indicates the existence of an effective range of ERF degree. In this study, the mediating effect of technological innovation is significant when the ERF is low, while the mediating effect could not be achieved when the ERF was high. The result indicates that there may be a “flexible boundary” for the effectiveness of ER. Only within the scope of moderate flexibility can ER affect the business performance by influencing the technological innovation behaviors of enterprises. In environmental protection, enterprises should serve the main participants of environmental protection consciously. However, enterprises are always profit-driven, aiming at the continuous improvement of business performance. Therefore, governments need to find the appropriate degree of ERF within the “flexible boundary” during the decision-making process. Only in this way can we ensure that ERs are not only restrictive but also helpful to enterprises.
Finally, the paper has the following limitations. First, the content analysis method is used in the measurement of ERF. However, some environmental policies on the official website of the Ministry of Environmental Protection in China’s provinces are not public, resulting in the incompleteness of the policies. Therefore, it is necessary to adopt a more scientific method for the measurement of ERF in future studies and verify the results of this paper. Then, in addition to the mediating effect of technology innovation and the moderating effect of ERF, there are other influence factors for the controversy over the PH, such as industry differences, regional economic development, the base of enterprise technology innovation and so on. There may also be various interaction mechanisms among various factors, all of which need further in-depth and systematic research to solve.

Author Contributions

These authors contributed equally to this work. All authors read and approved the final manuscript.

Funding

This research was funded by the National Natural Science Foundation of China, grant number 71702118; and the Chengdu Social Science Planning Project, grant number 2018R13.

Conflicts of Interest

The authors declare no conflict of interest.

References

  1. Alola, A.A. The trilemma of trade, monetary and immigration policies in the United States: Accounting for environmental sustainability. Sci. Total Environ. 2019, 658, 260–267. [Google Scholar] [CrossRef]
  2. He, B.-J.; Zhao, D.-X.; Zhu, J.; Darko, A.; Gou, Z.-H. Promoting and implementing urban sustainability in China: An integration of sustainable initiatives at different urban scales. Habitat Int. 2018, 82, 83–93. [Google Scholar] [CrossRef]
  3. Palmer, K.; Oates, W.E.; Portney, P.R. Tightening environmental standards—The benefit-cost or the no-cost paradigm. J. Econ. Perspect. 1995, 9, 119–132. [Google Scholar] [CrossRef]
  4. Greenstone, M.; List, J.A.; Syverson, C. The Effects of Environmental Regulation on the Competitiveness of U.S. Manufacturing. NBER Work. Pap. 2012, 93, 431–435. [Google Scholar] [CrossRef]
  5. Rexhaeuser, S.; Rammer, C. Environmental innovations and firm profitability: Unmasking the Porter Hypothesis. Environ. Resour. Econ. 2014, 57, 145–167. [Google Scholar] [CrossRef]
  6. Testa, F.; Iraldo, F.; Frey, M. The effect of environmental regulation on firms’ competitive performance: The case of the building & construction sector in some EU regions. J. Environ. Manag. 2011, 92, 2136–2144. [Google Scholar] [CrossRef]
  7. Zhang, N.; Choi, Y. Environmental energy efficiency of China’s regional economies: A non-oriented slacks-based measure analysis. Soc. Sci. J. 2013, 50, 225–234. [Google Scholar] [CrossRef]
  8. Porter, M.E. Towards a dynamic theory of strategy. Strat. Manag. J. 1991, 12, 95–117. [Google Scholar] [CrossRef] [Green Version]
  9. Rubashkina, Y.; Galeotti, M.; Verdolini, E. Environmental regulation and competitiveness: Empirical evidence on the Porter Hypothesis from European manufacturing sectors. Energy Policy 2015, 83, 288–300. [Google Scholar] [CrossRef] [Green Version]
  10. Zhu, X.; Zeng, A.; Zhong, M.; Huang, J.; Qu, H. Multiple impacts of environmental regulation on the steel industry in China: A recursive dynamic steel industry chain CGE analysis. J. Clean. Prod. 2019, 210, 490–504. [Google Scholar] [CrossRef]
  11. Rassier, D.G.; Earnhart, D. Effects of environmental regulation on actual and expected profitability. Ecol. Econ. 2015, 112, 129–140. [Google Scholar] [CrossRef]
  12. Jorgenson, D.W.; Wilcoxen, P.J. Environmental-regulation and United-States enconomic-growth. Rand J. Econ. 1990, 21, 314–340. [Google Scholar] [CrossRef]
  13. Christainsen, G.B.; Haveman, R.H. The contribution of environmental-regulations to the slowdown in productivity growth. J. Environ. Econ. Manag. 1981, 8, 381–390. [Google Scholar] [CrossRef]
  14. Wang, Y.D.; Wang, D. Porter hypothesis, environmental regulation and technological innovation in enterprises—A comparative analysis of the central and eastern regions. China Soft Sci. 2011, 1, 100–112. [Google Scholar] [CrossRef]
  15. Zhao, X.; Sun, B. The influence of Chinese environmental regulation on corporation innovation and competitiveness. J. Clean. Prod. 2016, 112, 1528–1536. [Google Scholar] [CrossRef]
  16. Clausen, T.H. Firm heterogeneity within industries: How important is ‘industry’ to innovation? Technol. Anal. Strateg. Manag. 2013, 25, 527–542. [Google Scholar] [CrossRef]
  17. Ramiah, V.; Pichelli, J.; Moosa, I. The Effects of Environmental Regulation on Corporate Performance: A Chinese Perspective. Rev. Pac. Basin Financ. Mark. Policies 2015, 18. [Google Scholar] [CrossRef]
  18. Porter, M.E.; Vanderlinde, C. Toward a new conception of the environment-competitiveness relationship. J. Econ. Perspect. 1995, 9, 97–118. [Google Scholar] [CrossRef]
  19. Krysiak, F.C. Environmental regulation, technological diversity, and the dynamics of technological change. J. Econ. Dyn. Control 2011, 35, 528–544. [Google Scholar] [CrossRef]
  20. Lanoie, P.; Laurent-Lucchetti, J.; Johnstone, N.; Ambec, S. Environmental policy, innovation and performance: New insights on the Porter Hypothesis. J. Econ. Manag. Strateg. 2011, 20, 803–842. [Google Scholar] [CrossRef]
  21. Bu, M.; Liu, Z.; Wagner, M.; Yu, X. Corporate social responsibility and the pollution haven hypothesis: Evidence from multinationals’ investment decision in China. Asia-Pac. J. Account. Econ. 2013, 20, 85–99. [Google Scholar] [CrossRef]
  22. Zhao, S.L.; Cacciolatti, L.; Lee, S.H.; Song, W. Regional collaborations and indigenous innovation capabilities in China: A multivariate method for the analysis of regional innovation systems. Technol. Forecast. Soc. Chang. 2015, 94, 202–220. [Google Scholar] [CrossRef] [Green Version]
  23. Ramanathan, R.; Black, A.; Nath, P.; Muyldermans, L. Impact of environmental regulations on innovation and performance in the UK industrial sector. Manag. Decis. 2010, 48, 1493–1513. [Google Scholar] [CrossRef]
  24. Jimenez-Jimenez, D.; Sanz-Valle, R. Innovation, organizational learning, and performance. J. Bus. Res. 2011, 64, 408–417. [Google Scholar] [CrossRef]
  25. Visnjic, I.; Wiengarten, F.; Neely, A. Only the brave: Product innovation, service business model innovation, and their impact on performance. J. Prod. Innov. Manag. 2016, 33, 36–52. [Google Scholar] [CrossRef]
  26. Teeter, P.; Sandberg, J. Constraining or Enabling Green Capability Development? How Policy Uncertainty Affects Organizational Responses to Flexible Environmental Regulations. Br. J. Manag. 2017, 28, 649–665. [Google Scholar] [CrossRef]
  27. Soderholm, K.; Soderholm, P.; Helenius, H.; Pettersson, M.; Viklund, R.; Masloboev, V.; Mingaleva, T.; Petrov, V. Environmental regulation and competitiveness in the mining industry: Permitting processes with special focus on Finland, Sweden and Russia. Resour. Pol. 2015, 43, 130–142. [Google Scholar] [CrossRef]
  28. Novak, P.J.; Arnold, W.A.; Henningsgaard, B.; Hozalski, R.M.; Kessler, K.; LaPara, T.L.; Parrella, A.; Rogacki, L.; Thompson, C.; Thorson, R.; et al. Innovation promoted by regulatory flexibility. Environ. Sci. Technol. 2015, 49, 13908–13909. [Google Scholar] [CrossRef]
  29. Li, R.; Ramanathan, R. Exploring the relationships between different types of environmental regulations and environmental performance: Evidence from China. J. Clean. Prod. 2018, 196, 1329–1340. [Google Scholar] [CrossRef]
  30. Gerigk, J.; MacKenzie, I.A.; Ohndorf, M. A Model of Benchmarking Regulation: Revisiting the Efficiency of Environmental Standards. Environ. Resour. Econ. 2015, 62, 59–82. [Google Scholar] [CrossRef]
  31. Blackman, A.; Li, Z.; Liu, A.A. Efficacy of Command-and-Control and Market-Based Environmental Regulation in Developing Countries. Annu. Rev. Resour. Econ. 2018, 10, 381–404. [Google Scholar] [CrossRef]
  32. Ren, S.; Li, X.; Yuan, B.; Li, D.; Chen, X. The effects of three types of environmental regulation on eco-efficiency: A cross-region analysis in China. J. Clean. Prod. 2018, 173, 245–255. [Google Scholar] [CrossRef]
  33. Jaffe, A.B.; Palmer, K. Environmental regulation and innovation: A panel data study. Rev. Econ. Stat. 1997, 79, 610–619. [Google Scholar] [CrossRef]
  34. Yabar, H.; Uwasu, M.; Hara, K. Tracking environmental innovations and policy regulations in Japan: Case studies on dioxin emissions and electric home appliances recycling. J. Clean. Prod. 2013, 44, 152–158. [Google Scholar] [CrossRef]
  35. Ramanathan, R.; Ramanathan, U.; Bentley, Y. The debate on flexibility of environmental regulations, innovation capabilities and financial performance—A novel use of DEA. Omega Int. J. Manag. Sci. 2018, 75, 131–138. [Google Scholar] [CrossRef]
  36. Feng, Z.; Chen, W. Environmental regulation, green innovation, and industrial green development: An empirical analysis based on the spatial durbin model. Sustainability 2018, 10, 223. [Google Scholar] [CrossRef]
  37. Sheng, S.; Zhou, K.Z.; Li, J.J. The effects of business and political ties on firm performance: Evidence from China. J. Mark. 2011, 75, 1–15. [Google Scholar] [CrossRef]
  38. Hategan, C.-D.; Sirghi, N.; Curea-Pitorac, R.-I.; Hategan, V.-P. Doing well or doing good: The relationship between corporate social responsibility and profit in Romanian companies. Sustainability 2018, 10, 41. [Google Scholar] [CrossRef]
  39. Johnstone, K.M.; Bedard, J.C. Audit firm portfolio management decisions. J. Acc. Res. 2004, 42, 659–690. [Google Scholar] [CrossRef]
  40. Altman, E.I. Financial ratios, discriminant analysis and prediction of corporate bankruptcy. J. Financ. 1968, 23, 589–609. [Google Scholar] [CrossRef]
  41. Zhang, C.; Lu, Y.; Guo, L.; Yu, T.S. Environmental regulation intensity and production technology progress. Econ. Res. 2011, 2, 113–124. [Google Scholar]
  42. Gray, W.B. The Cost of Regulation: OSHA, EPA and the Productivity Slowdown. Am. Econ. Rev. 1987, 77, 998–1006. [Google Scholar]
  43. Hu, D.; Wang, Y.; Huang, J.; Huang, H. How do different innovation forms mediate the relationship between environmental regulation and performance? J. Clean. Prod. 2017, 161, 466–476. [Google Scholar] [CrossRef]
  44. Jiang, F.X.; Wang, Z.J.; Bai, J.H. The double effect of environmental regulation on technological innovation: An empirical study based on the dynamic panel data of manufacturing industry in Jiangsu province. China Ind. Econ. 2013, 7, 44–45. [Google Scholar]
  45. Huang, X.; Zhao, D.; Brown, C.G.; Wu, Y.; Waldron, S.A. Environmental Issues and Policy Priorities in China: A Content Analysis of Government Documents. China Int. J. 2010, 8, 220–246. [Google Scholar] [CrossRef]
  46. Holsti, O.R. Content Analysis for the Social Sciences and Humanities; Addison-Wesley: Boston, MA, USA, 1969; p. 608. [Google Scholar]
  47. Jie, M.H.; Wang, J.; Liu, D.M. Environmental regulation, technological innovation and business performance. Nankai Manag. Rev. 2014, 17, 106–113. [Google Scholar] [CrossRef]
  48. Wen, Z.L.; Zhang, L.; Hou, J.T. Mediating mediators and mediating mediators. J. Psychol. 2006, 3, 448–452. [Google Scholar]
  49. Chaplin, W.F. The next generation of moderator research in personality psychology. J. Personal. 1991, 59, 143–178. [Google Scholar] [CrossRef]
  50. Wen, Z.L.; Ye, B.Y. Analyses of Mediating Effects: The Development of Methods and Models. Adv. Psychol. Sci. 2014, 22, 731–745. [Google Scholar] [CrossRef]
  51. Millimet, D.L.; Roy, J. Empirical tests of the pollution haven hypothesis when environmental regulation is endogenous. J. Appl. Econom. 2016, 31, 652–677. [Google Scholar] [CrossRef]
  52. Lee, K.-H.; Saen, R.F. Measuring corporate sustainability management: A data envelopment analysis approach. Int. J. Prod. Econ. 2012, 140, 219–226. [Google Scholar] [CrossRef]
  53. Sindhi, S.; Kumar, N. Corporate environmental responsibility—Transitional and evolving. Manag. Environ. Qual. Int. J. 2012, 23, 640–657. [Google Scholar] [CrossRef]
  54. Stavropoulos, S.; Wall, R.; Xu, Y. Environmental regulations and industrial competitiveness: Evidence from China. Appl. Econ. 2018, 50, 1378–1394. [Google Scholar] [CrossRef]
Figure 1. The research model.
Sustainability 11 02214 g001
Table 1. Content analysis unit and its content.
Level 1 NumberProvinceLevel 2 NumberPolicy
1Beijing1.1Regulations on prevention and control of water pollution in Beijing
1.2Regulations on prevention and control of air pollution in Beijing
1.3Measures for the prevention and control of environmental noise pollution in Beijing
2Tianjin2.1Regulations on environmental protection in Tianjin
2.2Regulations on Marine environmental protection in Tianjin
2.3Regulations on the promotion of cleaner production in Tianjin
Note: Considering page limitations, the content analysis unit is omitted.
Table 2. Content analysis keywords.
DimensionKeyword
Economic IncentivesReward
Commend
Economic PenaltiesFine
Punish
Compensate
Policy IncentivesEncourage
Support
Table 3. Keyword frequency analysis.
ProvincePolicy NumberDimensionKeywordFrequencyScoreTotal Score
Beijing5Economic IncentivesReward71.4012.27
Commend30.60
Economic PenaltiesFine9318.60
Punish5110.20
Compensate102.00
Policy IncentivesEncourage153.00
Support51.00
Tianjin19Economic IncentivesReward341.793.79
Commend50.26
Economic PenaltiesFine633.32
Punish623.26
Compensate120.63
Policy IncentivesEncourage221.16
Support180.95
Note: Considering page limitations, the content analysis unit is omitted.
Table 4. The impact of ER on business performance.
VariableModel 1
BP
βVIF
LDV0.0261.049
IC0.070 *1.036
EN−0.204 ***1.025
ER−0.112 **1.073
ERF0.0001.056
R20.022
F11.790 ***
Note: N = 2621; * p < 0.05; ** p < 0.01; *** p < 0.001.
Table 5. The mediating effect of technological innovation.
VariableModel 2Model 3
TIBP
βVIFβVIF
LDV0.301 ***1.0490.0141.058
IC−0.0141.0360.071 *1.036
EN0.388 ***1.025−0.220 ***1.039
ER−0.394 ***1.073−0.096 *1.084
ERF0.0121.056−0.0011.056
TI 0.040 ***1.036
R20.0350.029
F18.972 ***12.783 ***
Note: N = 2621; * p < 0.05; ** p < 0.01; *** p < 0.001.
Table 6. The Moderating Effect of ERF.
VariableModel 4
BP
βVIF
LDV0.0171.059
IC0.071 *1.036
EN−0.216 ***1.041
ER−0.095 *1.084
ERF0.145 **134.331
TI0.102 ***6.436
ERF*TI−0.008 **143.230
R20.031
F12.119 ***
Note: N = 2621; * p < 0.05; ** p < 0.01; *** p < 0.001.
Table 7. The mediating effect under low ERF.
VariableModel 5Model 6Model 7
BPTIBP
βVIFβVIFβVIF
LDV0.0301.0800.310 ***1.0800.0121.090
IC0.0621.045−0.0311.0450.0641.045
EN−0.175 ***1.0570.383 ***1.057−0.198 ***1.070
ER−0.176 *1.073−0.572 ***1.073−0.1431.083
TI 0.059 ***1.024
R20.0140.0230.024
F5.314 ***8.943 ***7.578 ***
Note: N = 2621; * p < 0.05; ** p < 0.01; *** p < 0.001.
Table 8. The mediating effect under high ERF.
VariableModel 8Model 9Model 10
BPTIBP
βVIFβVIFβVIF
LDV0.0371.1330.325 **1.1330.0321.145
IC0.089 *1.0340.0701.0340.088 *1.034
EN−0.239 ***1.0290.415 ***1.029−0.244 ***1.025
ER−0.086 *1.073−0.352 ***1.123−0.081 *1.138
TI 0.1401.051
R20.0510.0480.052
F14.754 **13.937 ***12.116 ***
Note: N = 2621; * p < 0.05; ** p < 0.01; *** p < 0.001.

