Incorporating Rarity and Accessibility Factors into the Cultural Ecosystem Services Assessment in Mountainous Areas: A Case Study in the Upper Reaches of the Minjiang River


Abstract
1. Introduction
2. Methodology
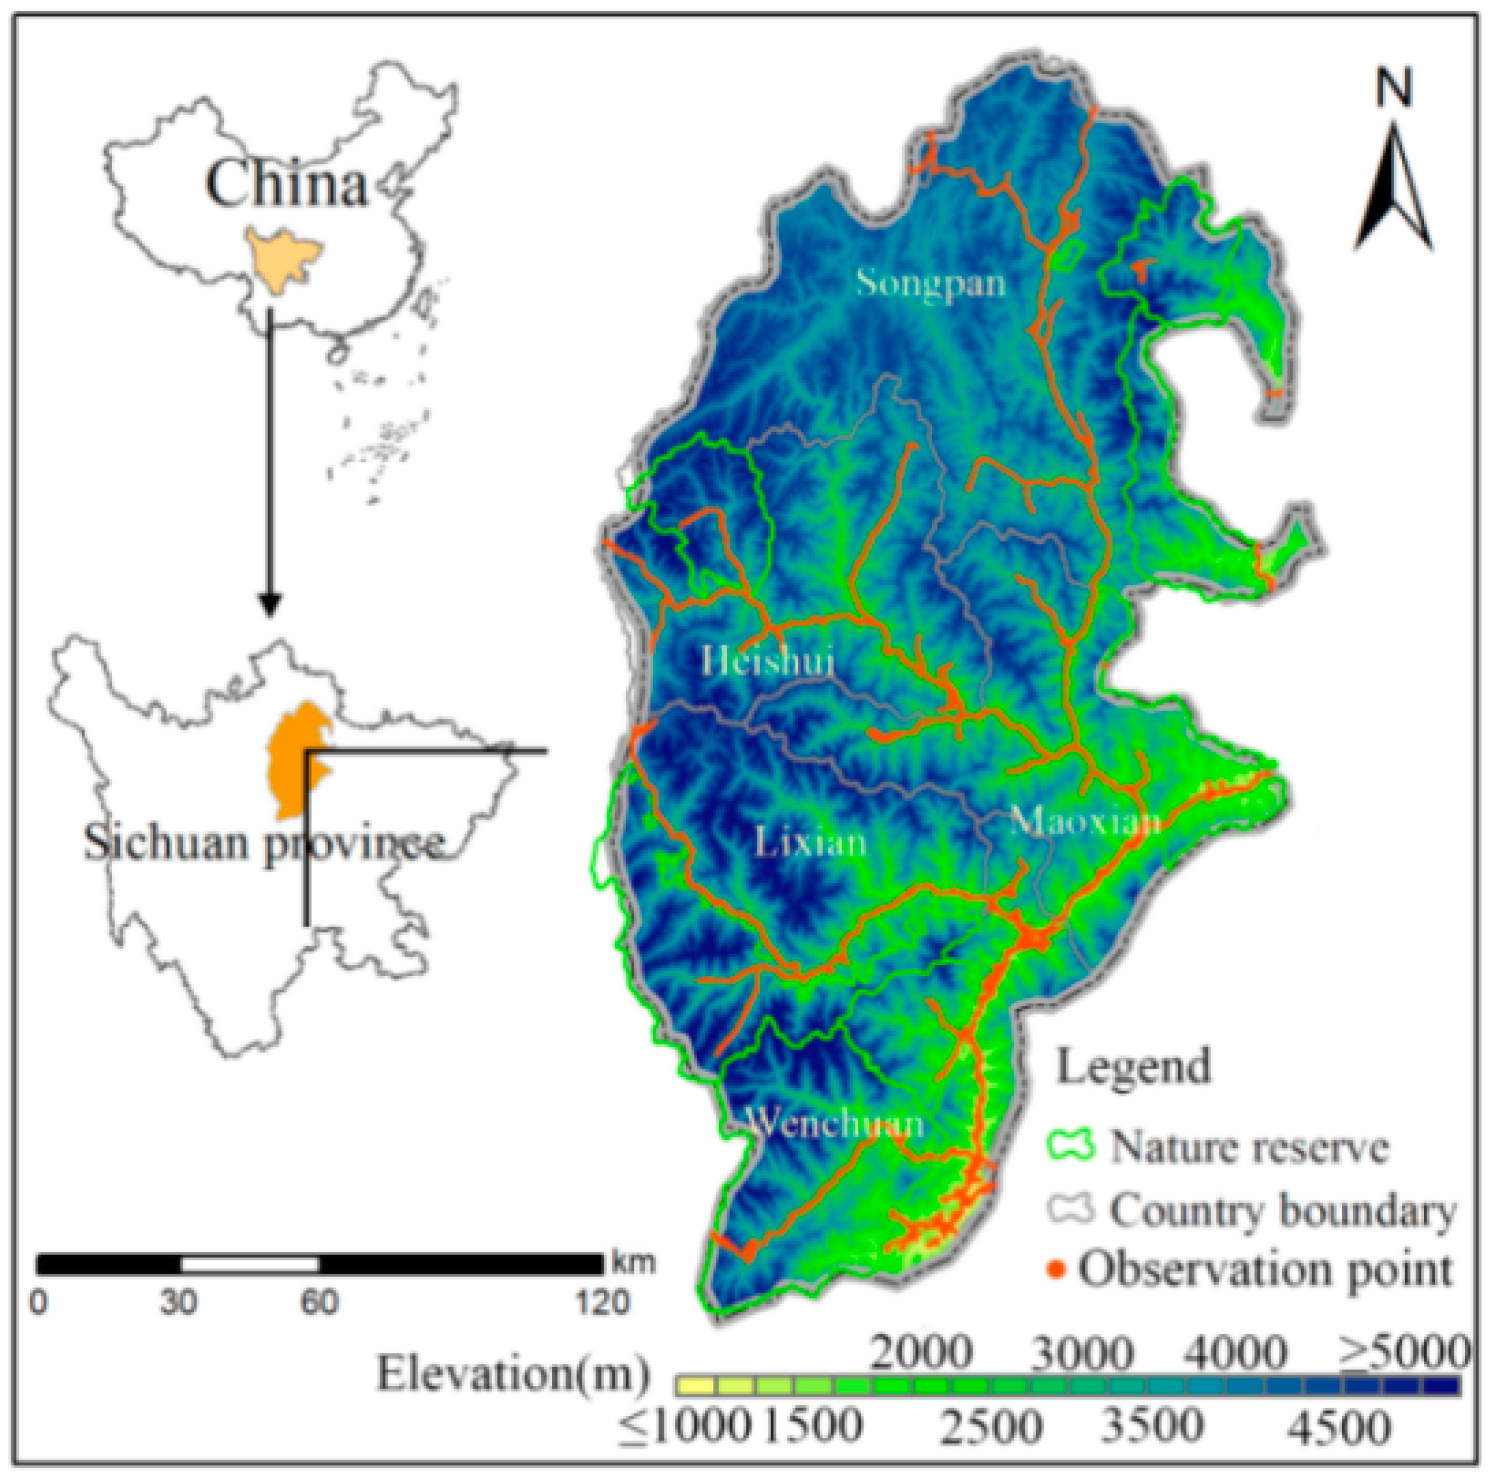
2.1. Study Area
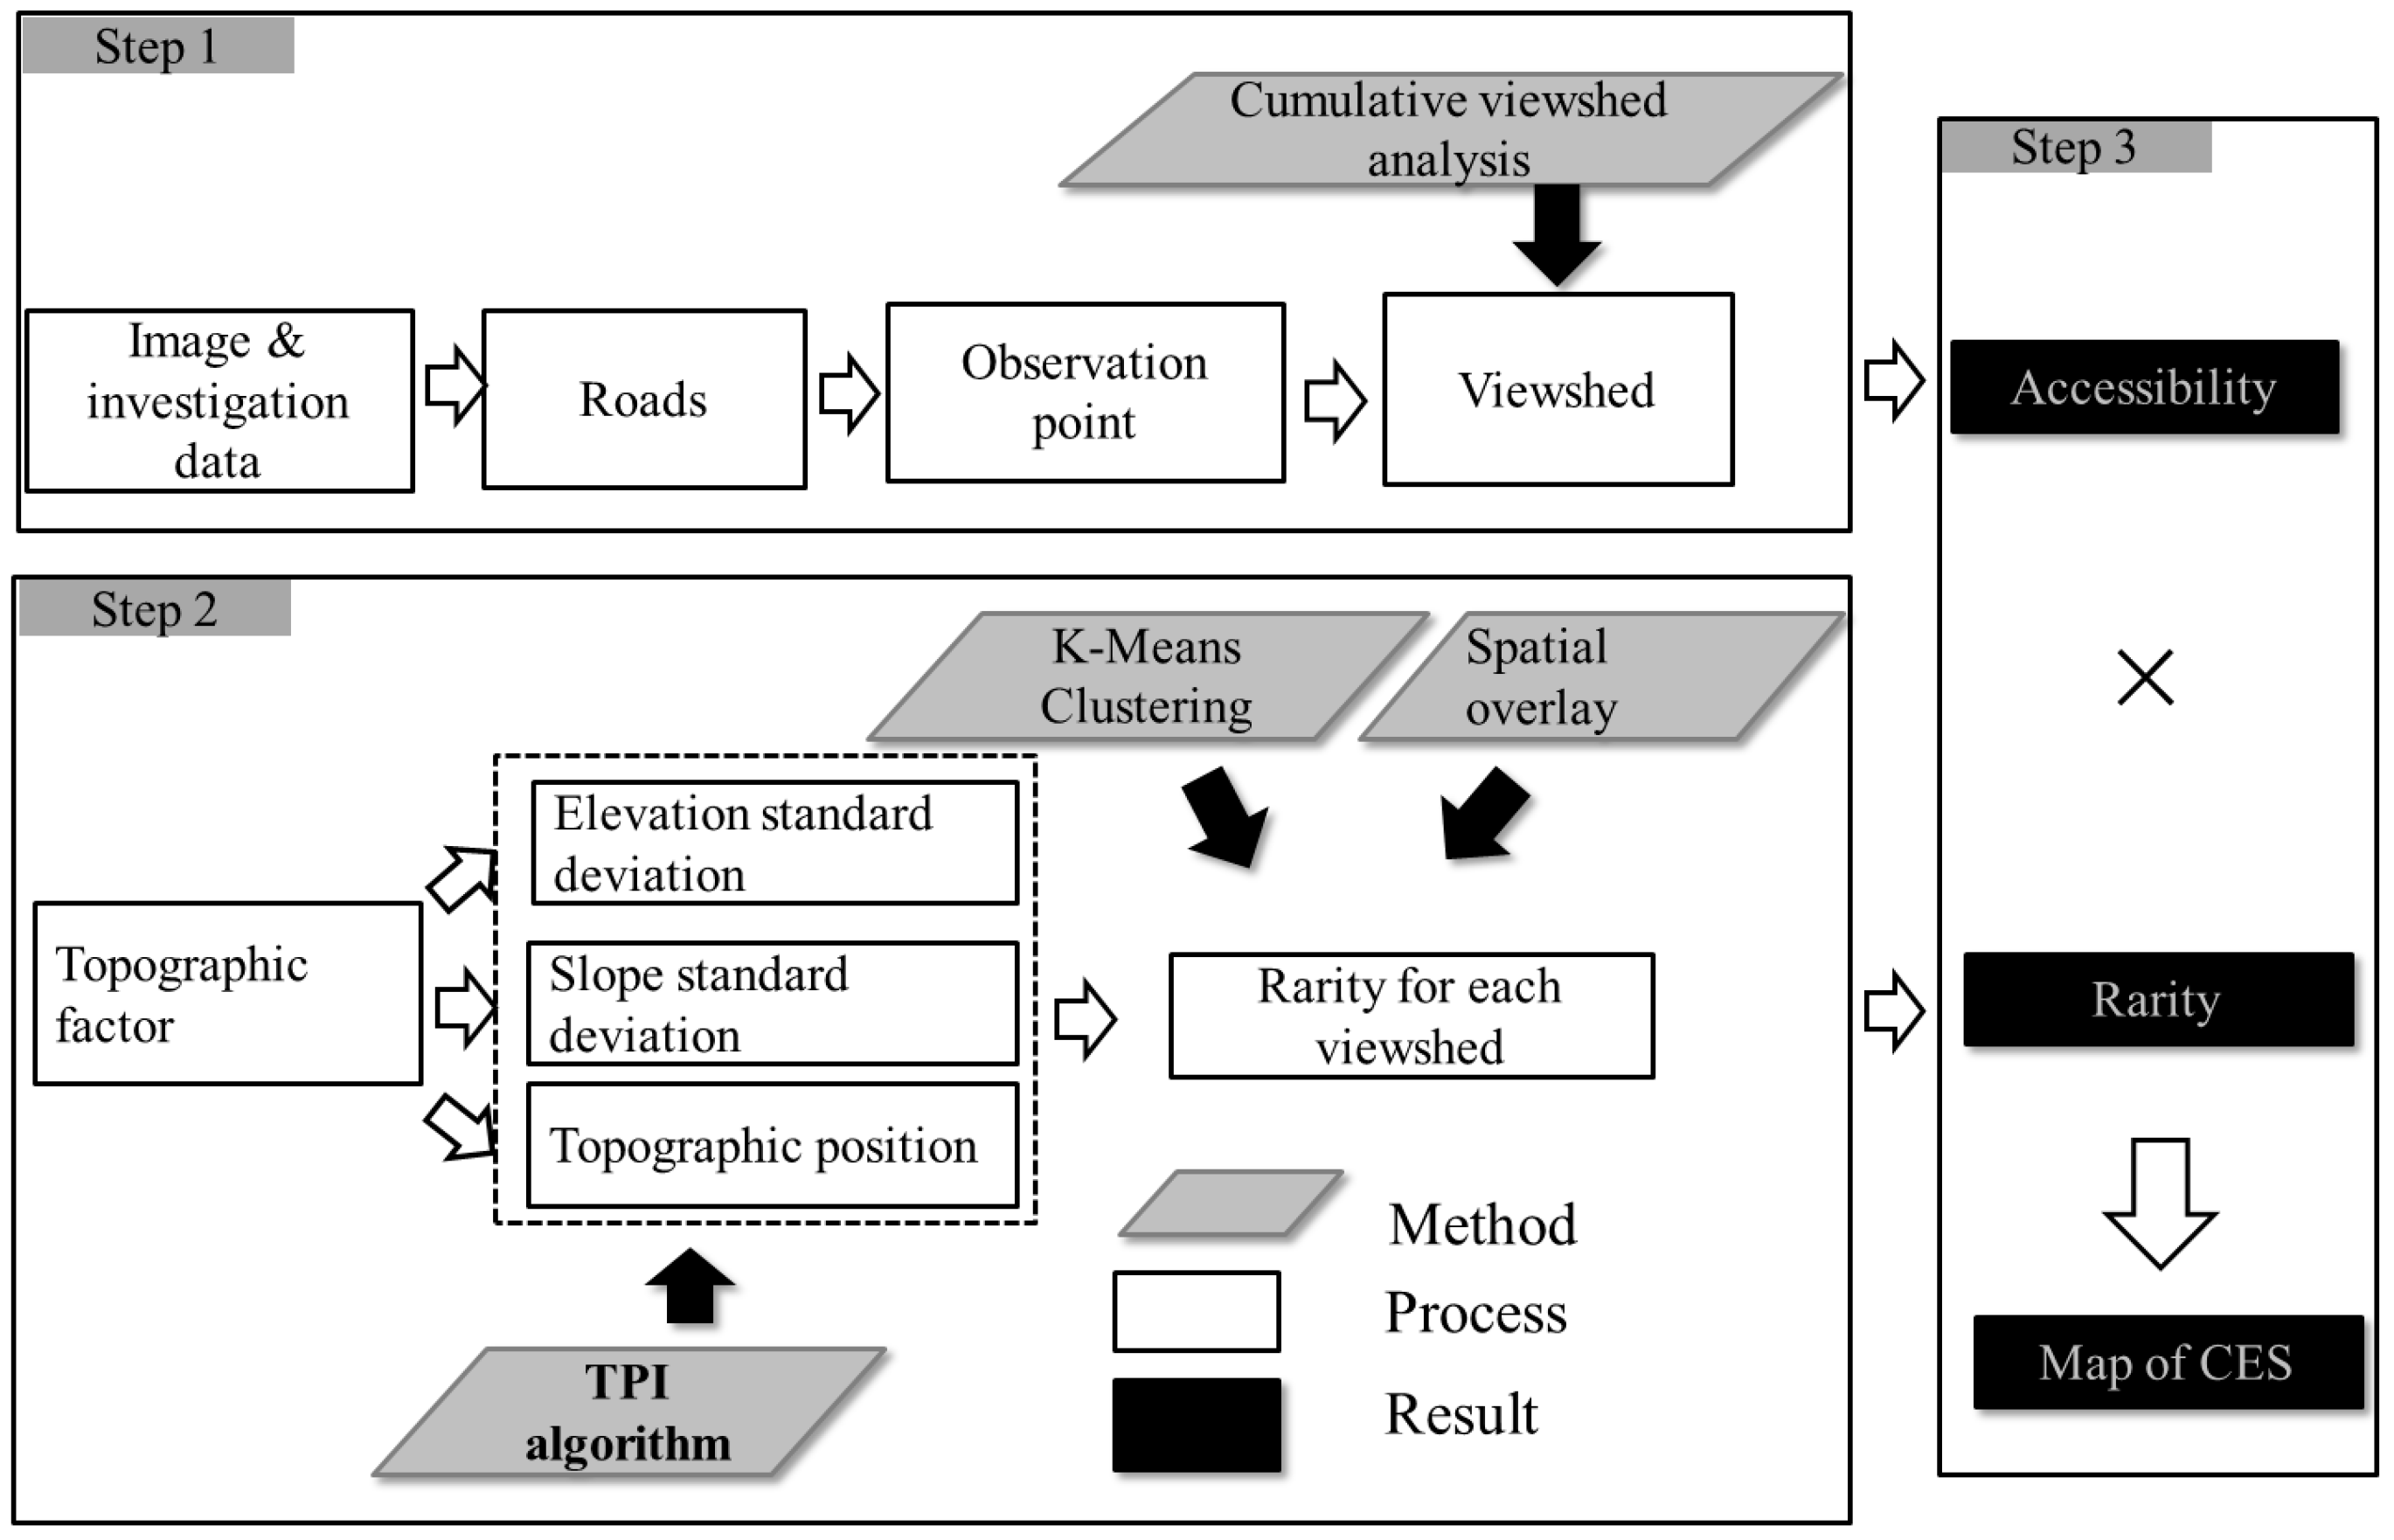
2.2. Methodology
2.3. Assessment Framework
2.4. Models
2.5. Data
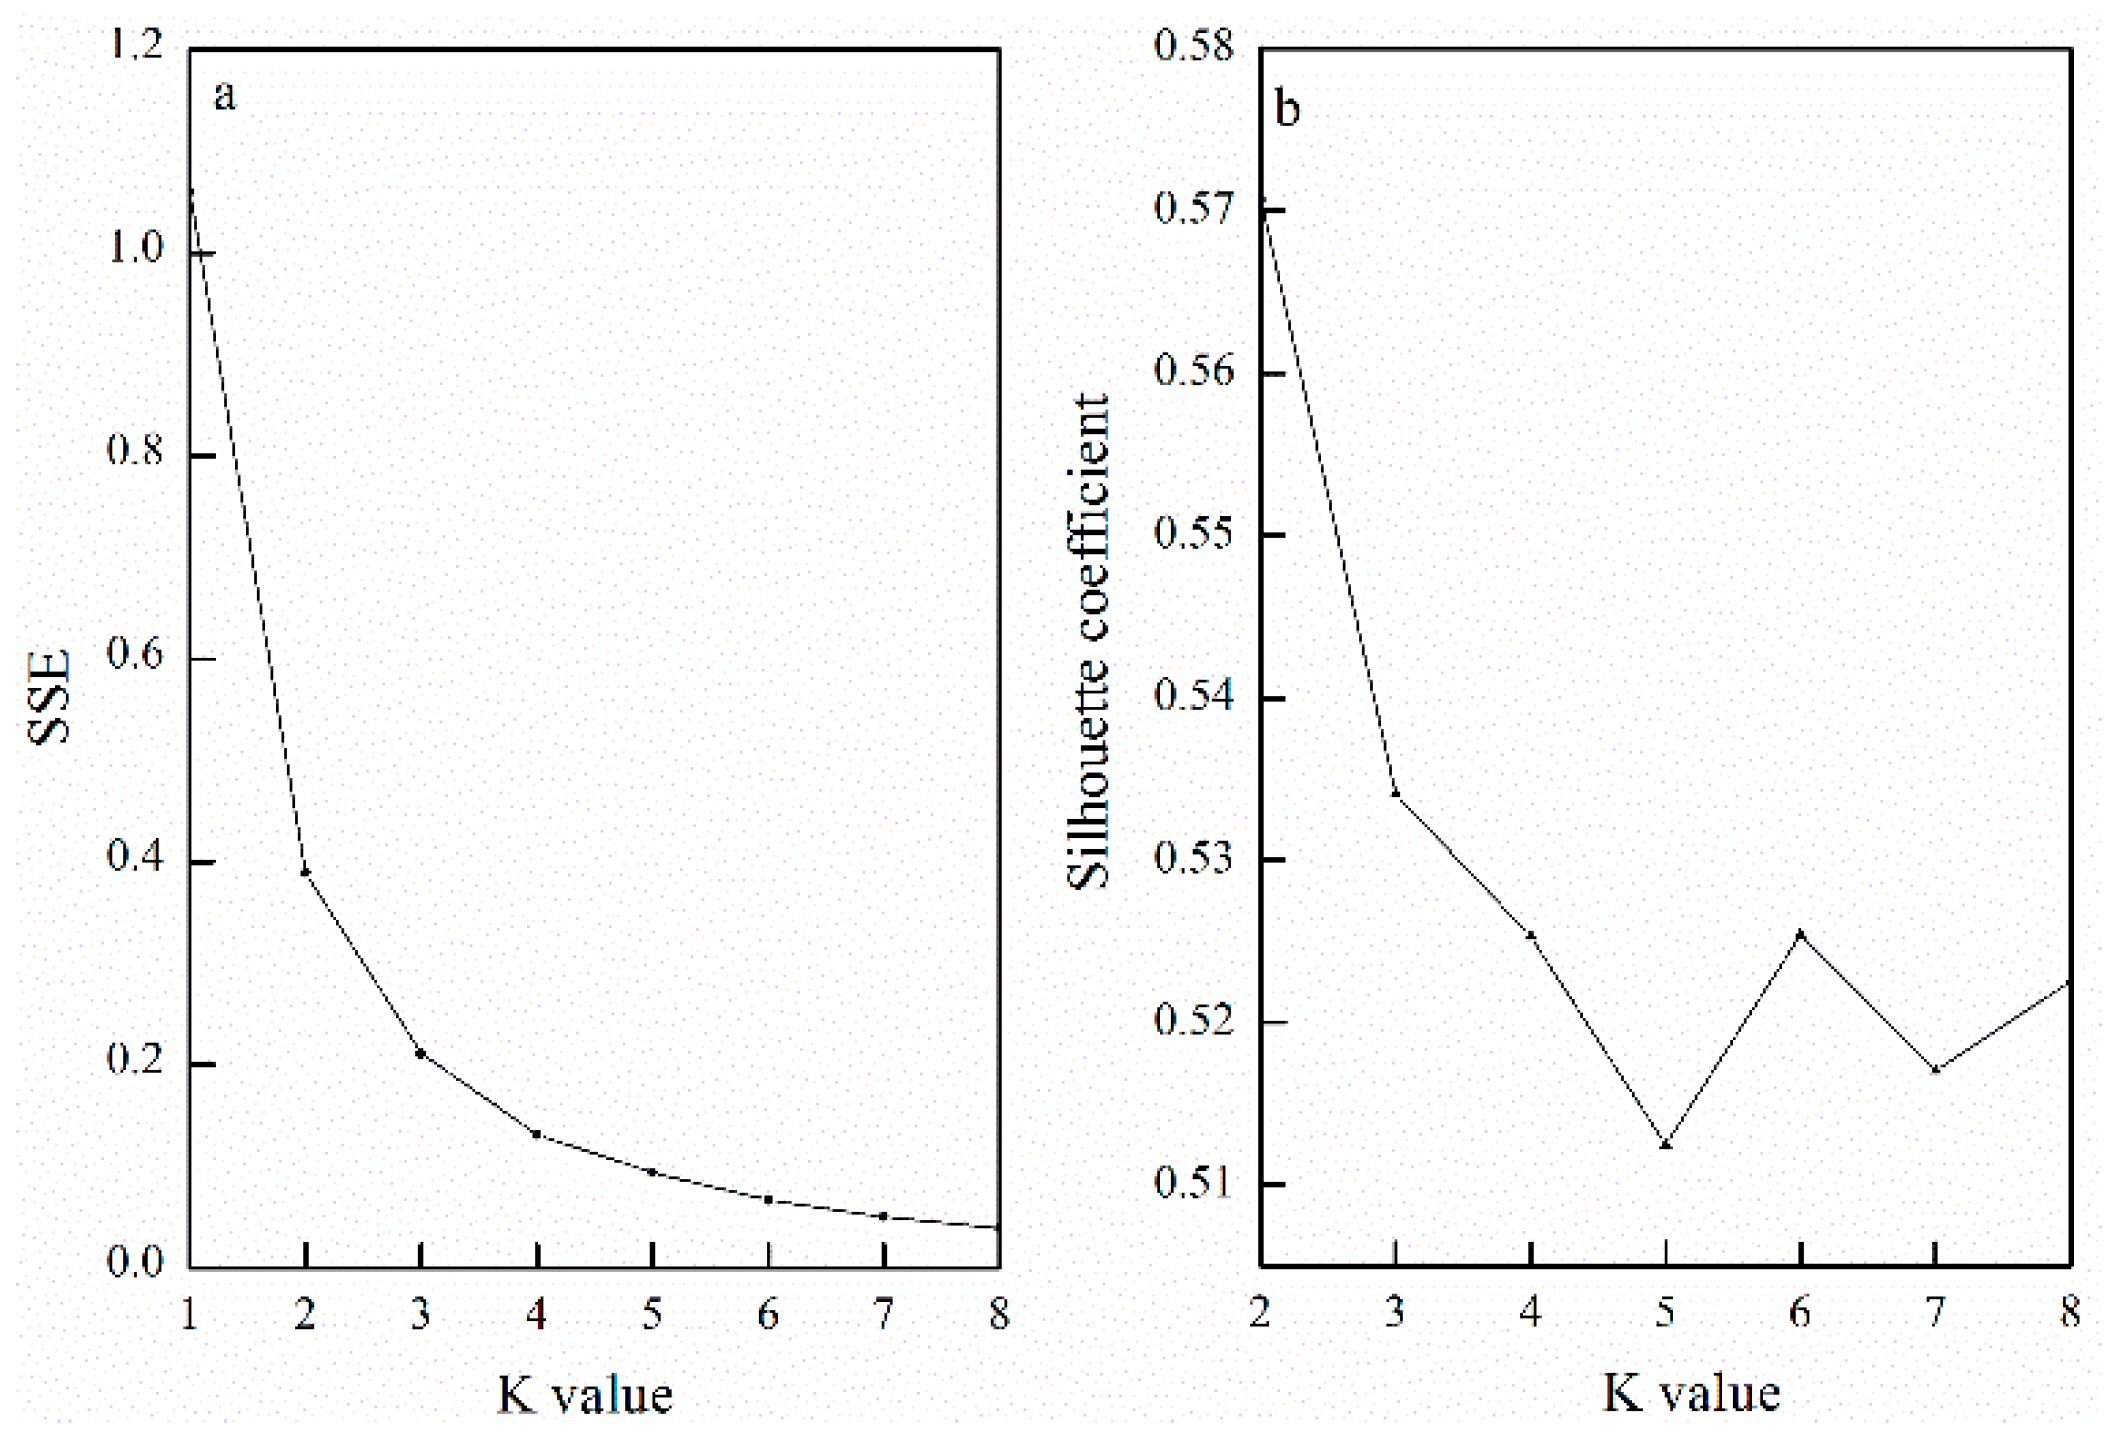
2.6. Parameters
3. Results
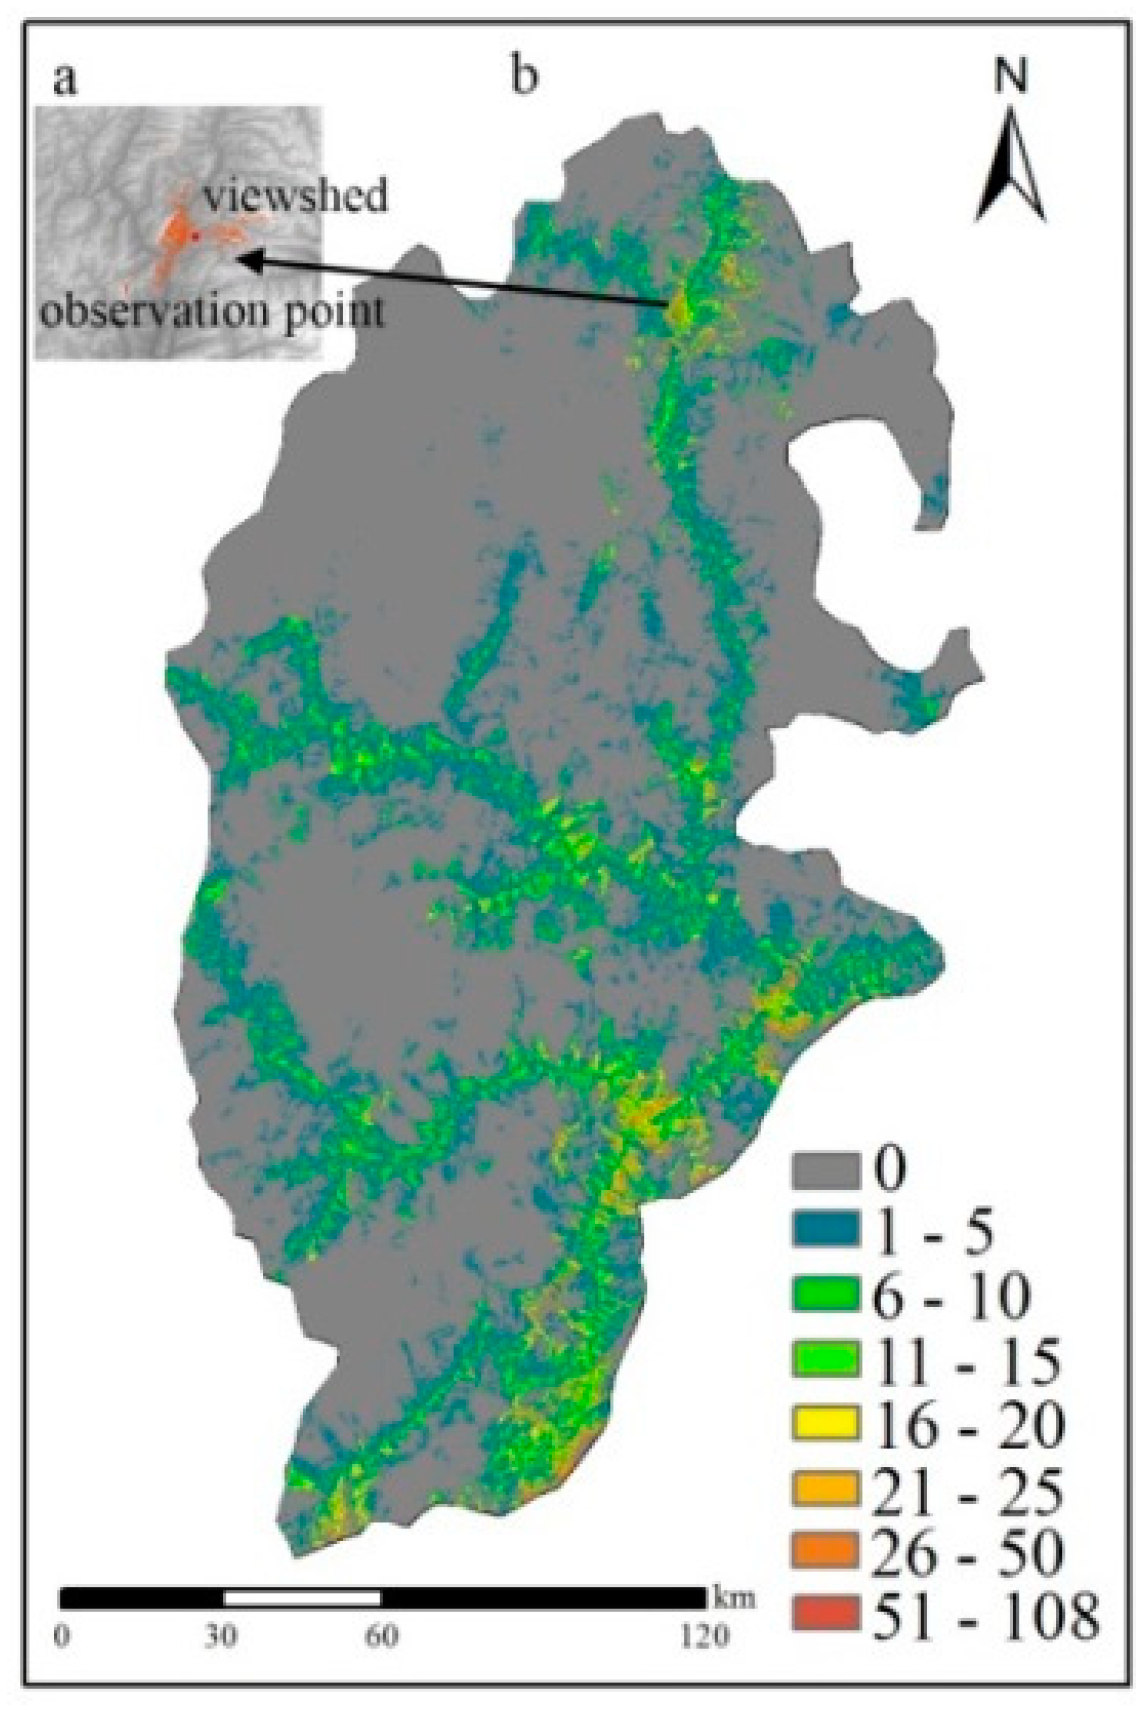
3.1. Cumulative Viewshed
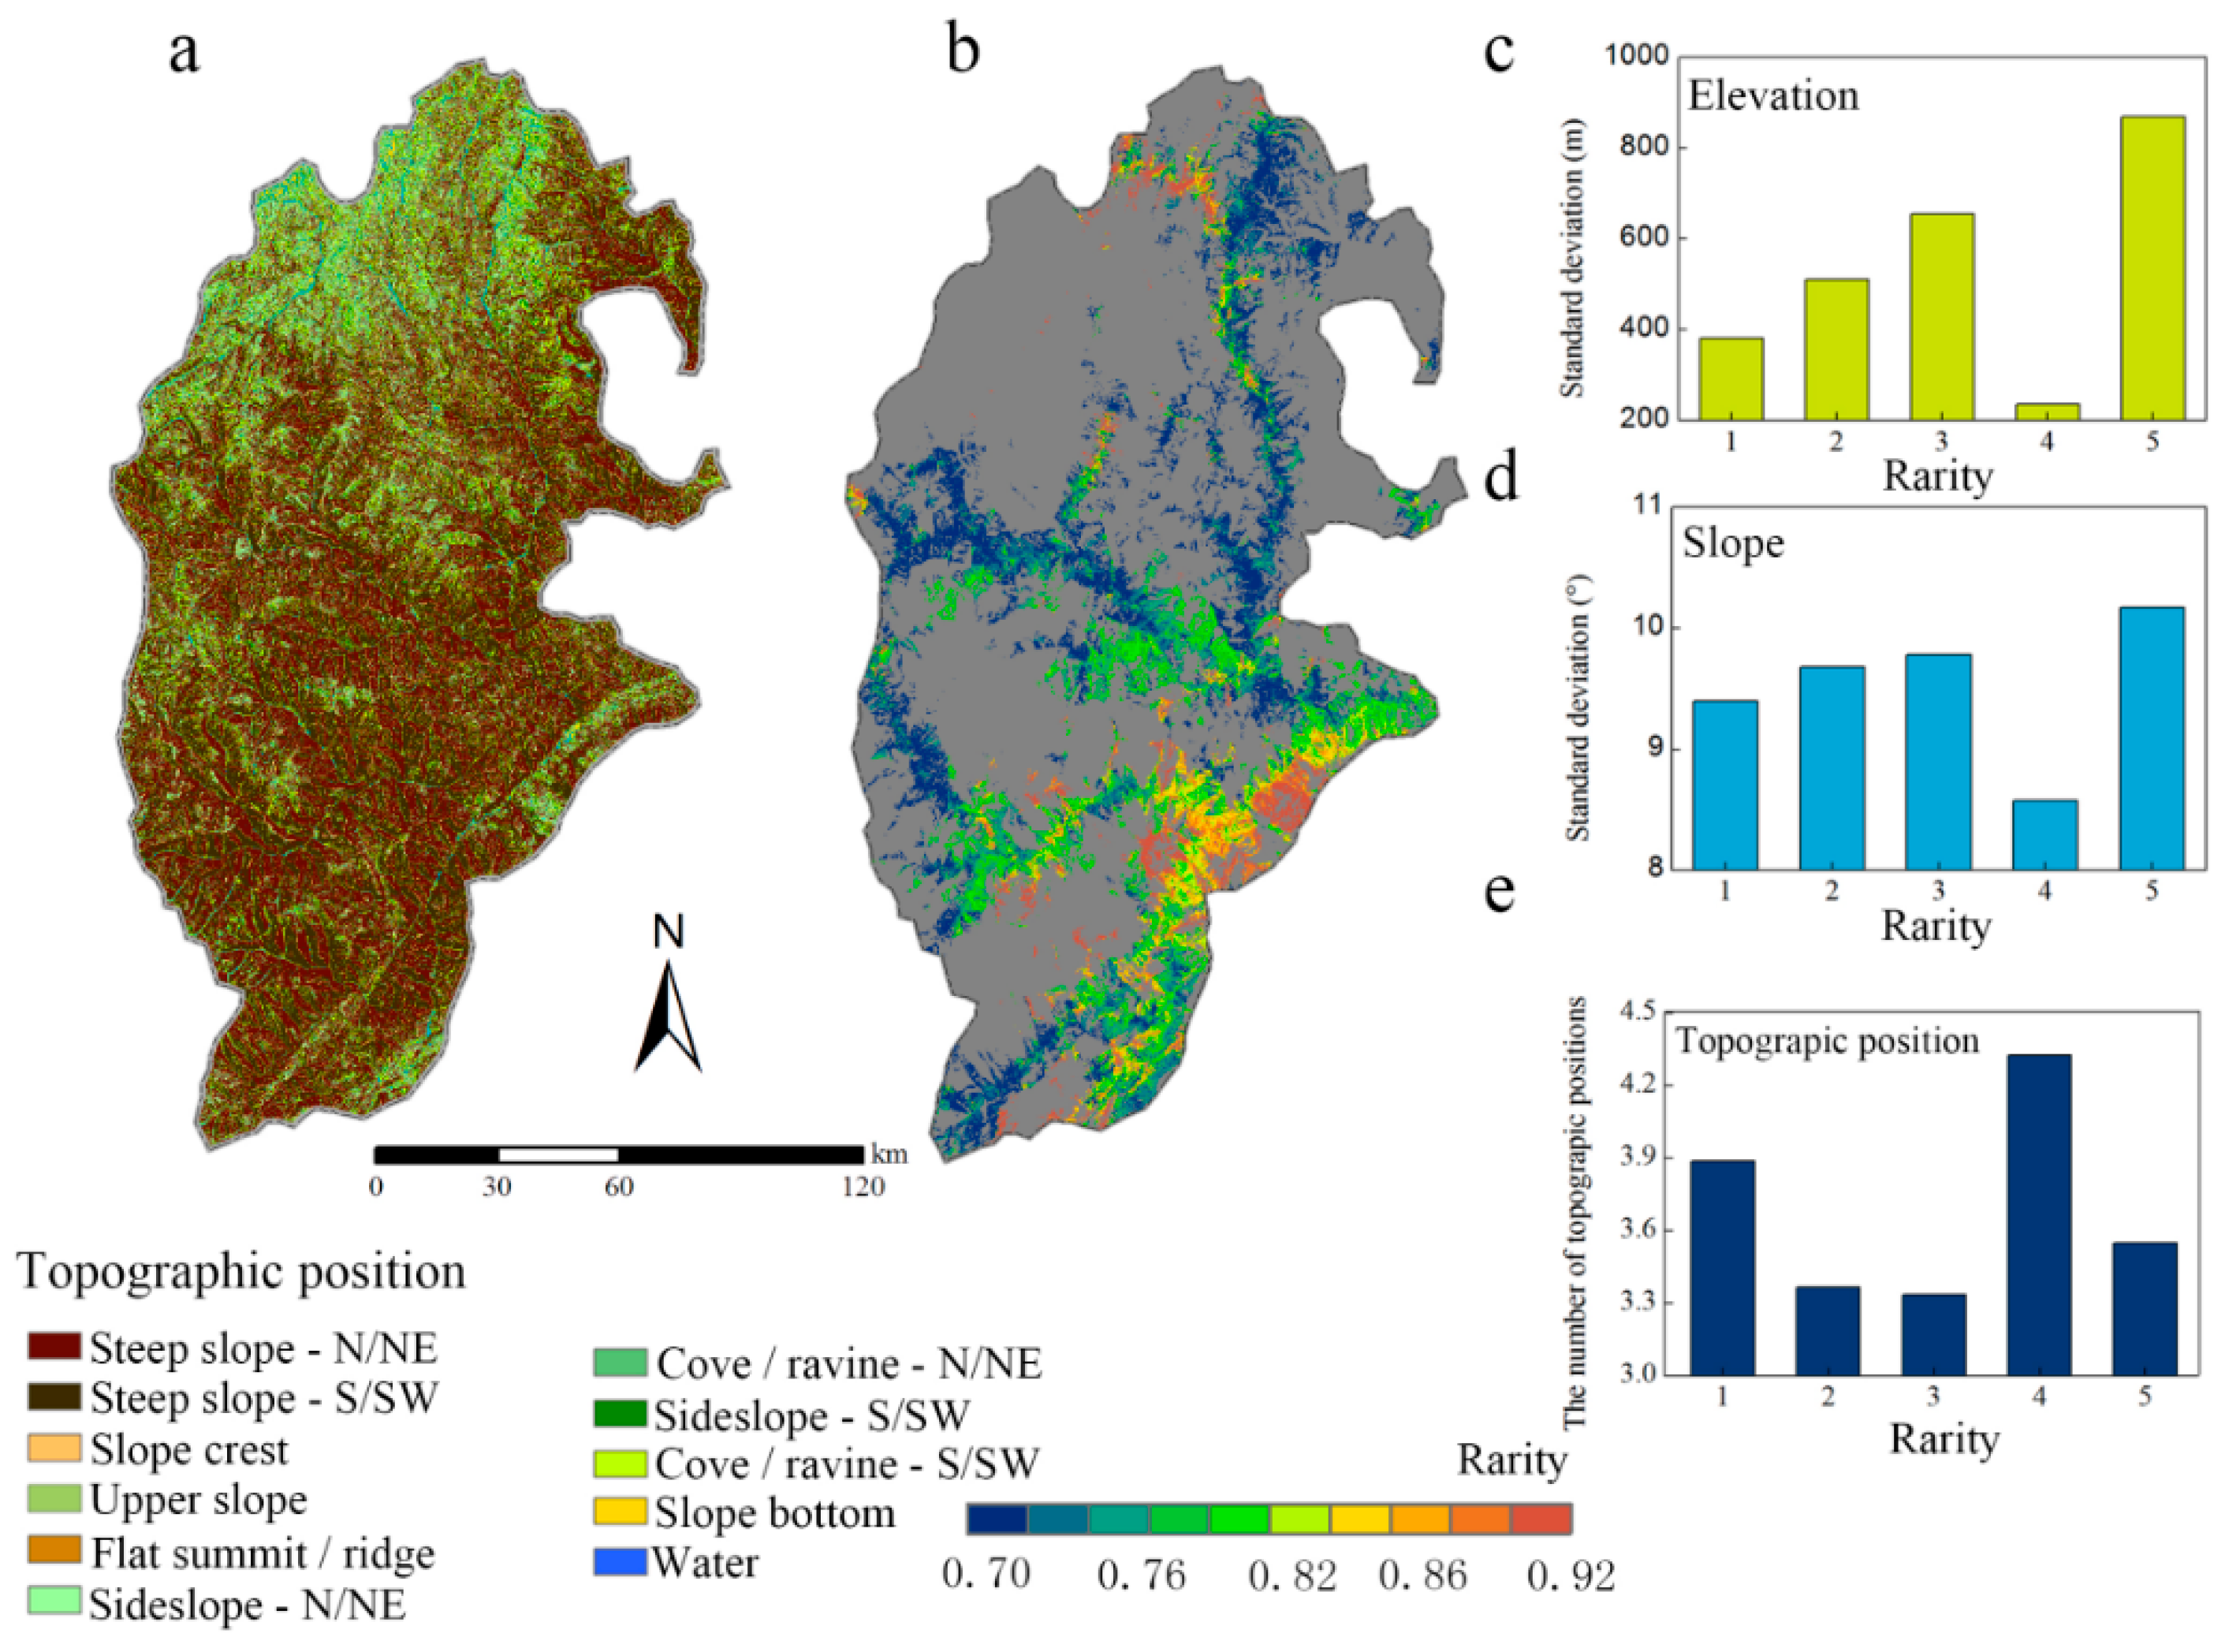
3.2. The Distribution of Rarity
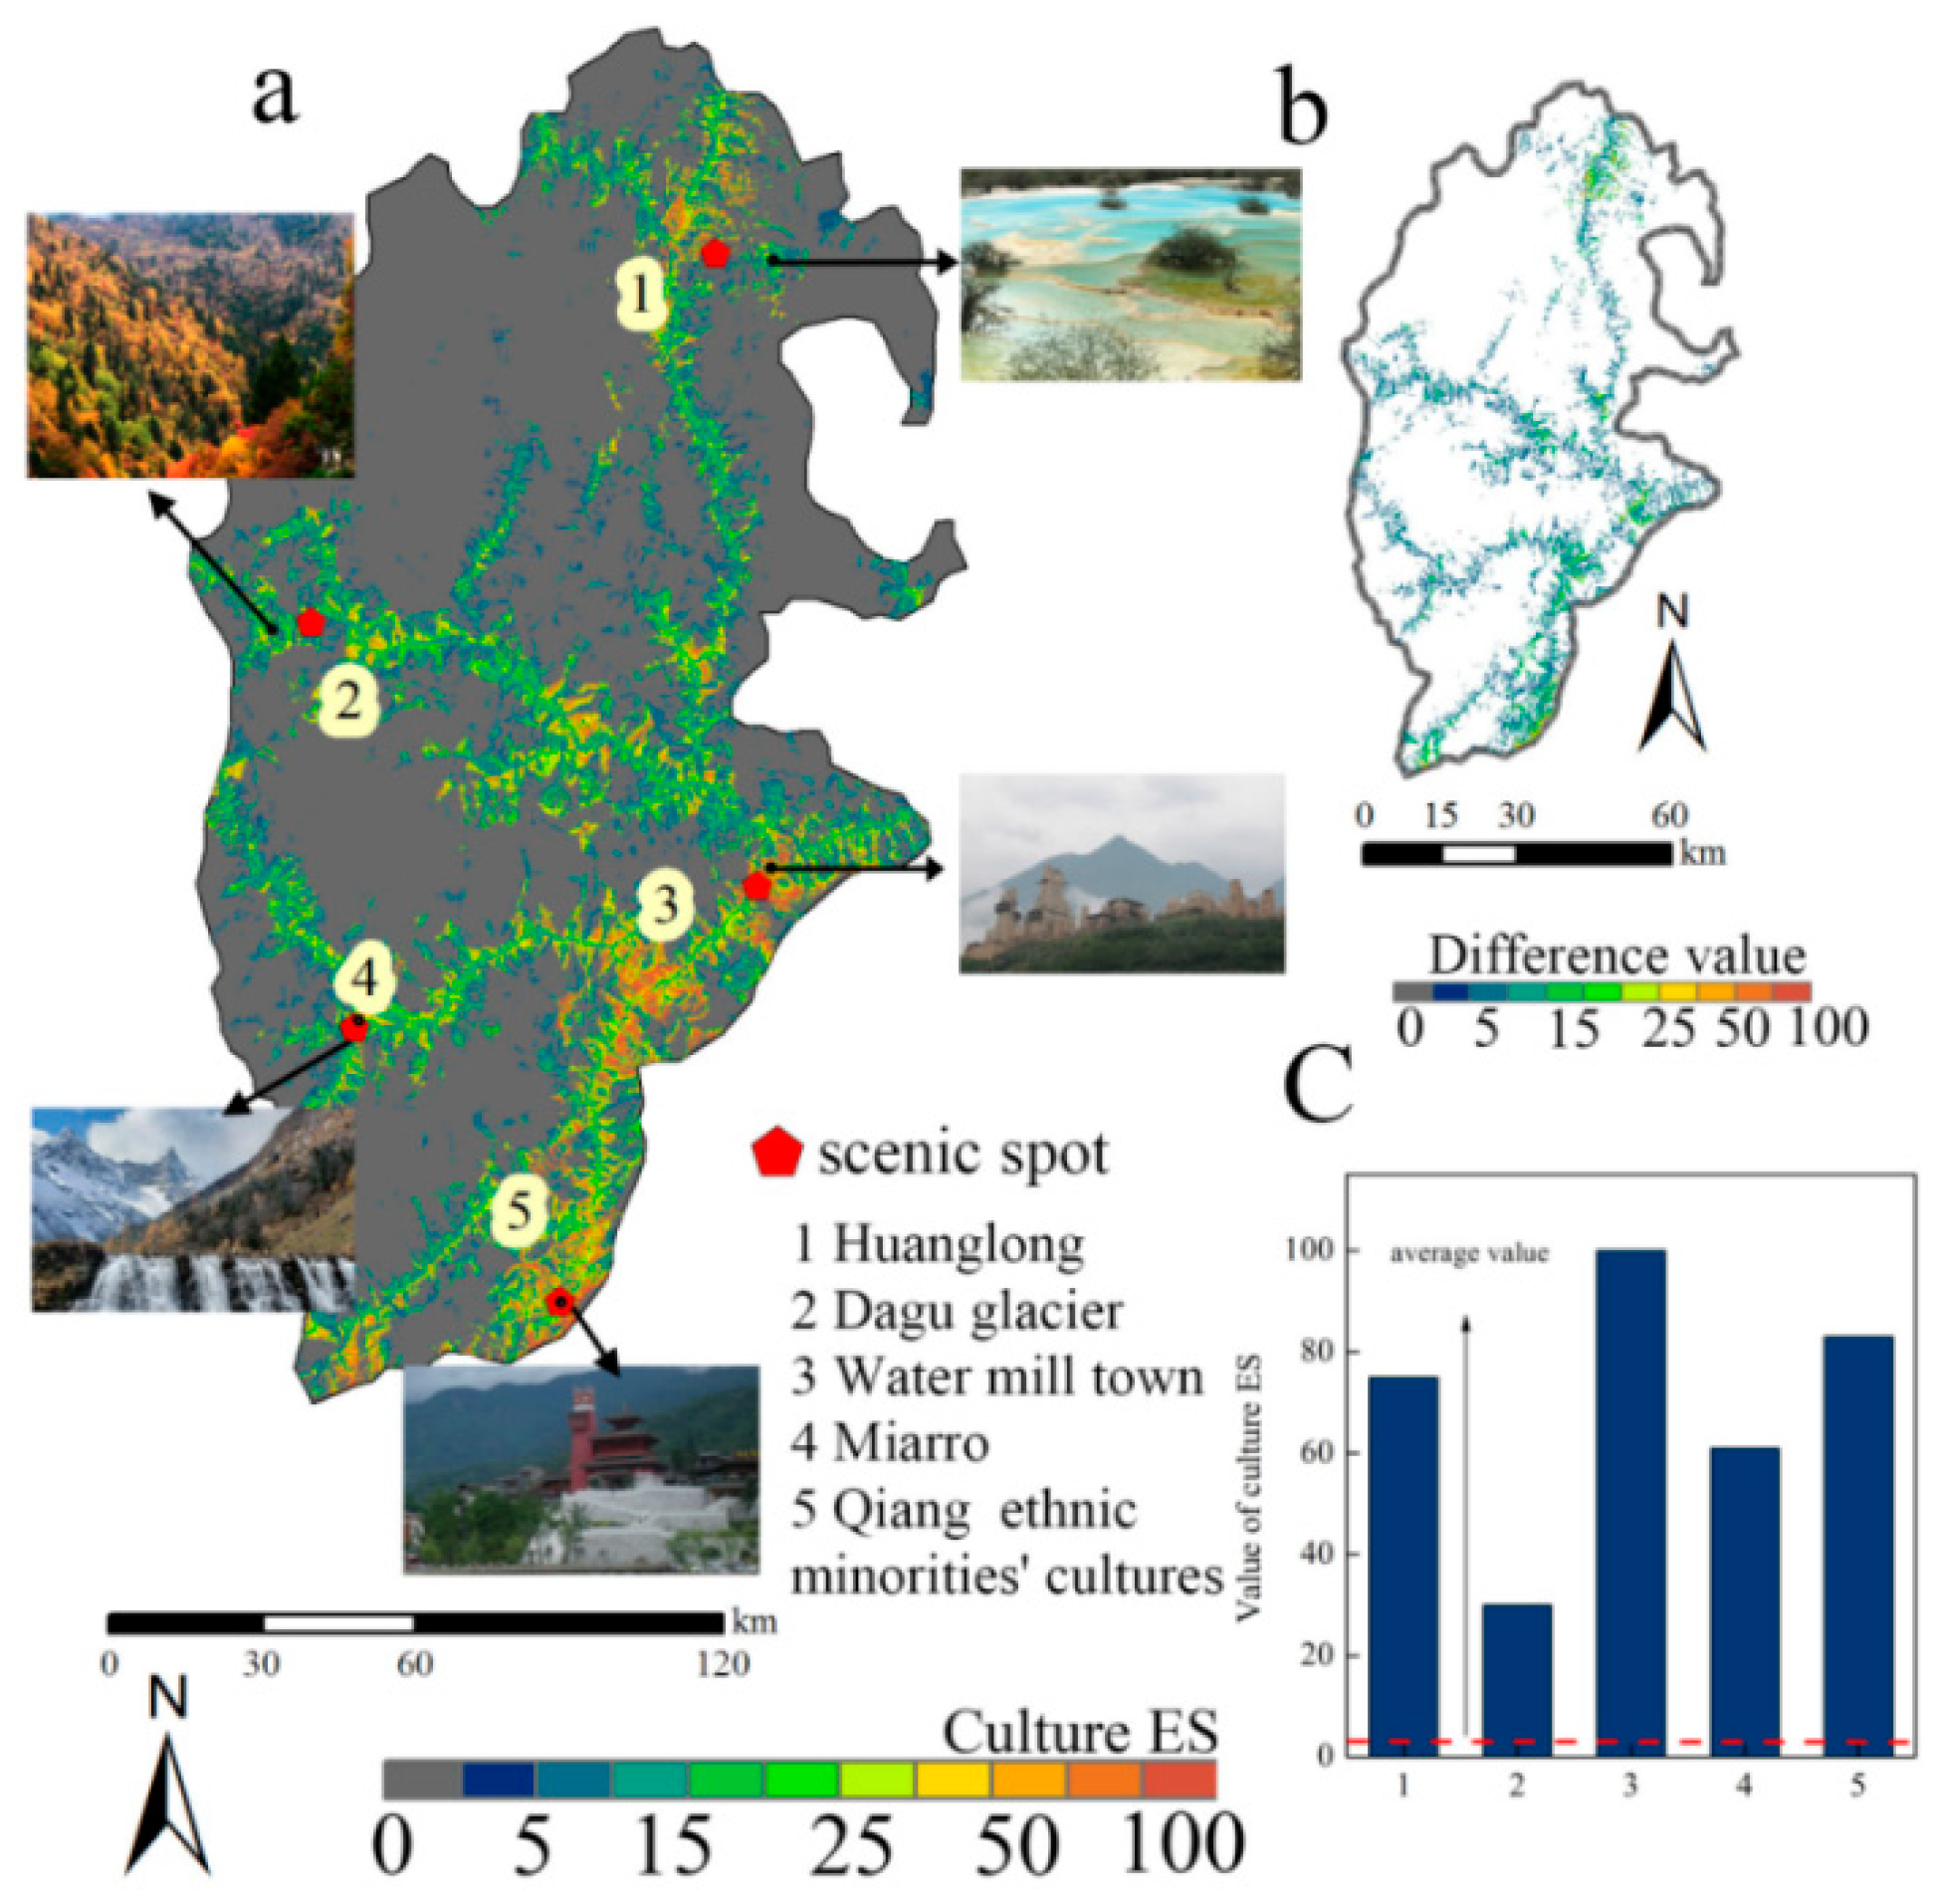
3.3. CES in the Upper of Minjiang River
4. Discussion
4.1. The Impacts of Roads on CES
4.2. The Effects of Complex Topography
4.3. Enhancing the Capacity of CES
5. Conclusions
Author Contributions
Funding
Acknowledgments
Conflicts of Interest
References
- Guo, Z.; Zhang, L.; Li, Y. Increased dependence of humans on ecosystem services and biodiversity. PLoS ONE 2010, 5, e13113. [Google Scholar] [CrossRef]
- Liu, Y. Introduction to land use and rural sustainability in China. Land Use Policy 2018, 74, 1–4. [Google Scholar] [CrossRef]
- Daniel, T.C.; Muhar, A.; Arnberger, A.; Aznar, O.; Boyd, J.W.; Chan, K.M.; Costanza, R.; Elmqvist, T.; Flint, C.G.; Gobster, P.H. Contributions of cultural services to the ecosystem services agenda. Proc. Natl. Acad. Sci. USA 2012, 109, 8812–8819. [Google Scholar] [CrossRef] [PubMed]
- Van Berkel, D.B.; Carvalho-Ribeiro, S.; Verburg, P.H.; Lovett, A. Identifying assets and constraints for rural development with qualitative scenarios: A case study of Castro Laboreiro, Portugal. Landsc. Urban Plan. 2011, 102, 127–141. [Google Scholar] [CrossRef]
- Kong, L.; Zheng, H.; Xiao, Y.; Ouyang, Z.; Li, C.; Zhang, J.; Huang, B. Mapping ecosystem service bundles to detect distinct types of multifunctionality within the diverse landscape of the yangtze river basin, China. Sustainability 2018, 10, 857. [Google Scholar] [CrossRef]
- Fagerholm, N.; Käyhkö, N.; Ndumbaro, F.; Khamis, M. Community stakeholders’ knowledge in landscape assessments–Mapping indicators for landscape services. Ecol. Indic. 2012, 18, 421–433. [Google Scholar] [CrossRef]
- De Groot, R.S.; Alkemade, R.; Braat, L.; Hein, L.; Willemen, L. Challenges in integrating the concept of ecosystem services and values in landscape planning, management and decision making. Ecol. Complex. 2010, 7, 260–272. [Google Scholar] [CrossRef]
- Eigenbrod, F.; Armsworth, P.R.; Anderson, B.J.; Heinemeyer, A.; Gillings, S.; Roy, D.B.; Thomas, C.D.; Gaston, K.J. The impact of proxy-based methods on mapping the distribution of ecosystem services. J. Appl. Ecol. 2010, 47, 377–385. [Google Scholar] [CrossRef]
- Lautenbach, S.; Kugel, C.; Lausch, A.; Seppelt, R. Analysis of historic changes in regional ecosystem service provisioning using land use data. Ecol. Indicators 2011, 11, 676–687. [Google Scholar] [CrossRef]
- Gimona, A.; van der Horst, D. Mapping hotspots of multiple landscape functions: A case study on farmland afforestation in Scotland. Landsc. Ecol. 2007, 22, 1255–1264. [Google Scholar] [CrossRef]
- Plummer, M.L. Assessing benefit transfer for the valuation of ecosystem services. Front. Ecol. Environ. 2009, 7, 38–45. [Google Scholar] [CrossRef]
- Brown, G.; Montag, J.M.; Lyon, K. Public participation GIS: A method for identifying ecosystem services. Soc. Nat. Resour. 2012, 25, 633–651. [Google Scholar] [CrossRef]
- Nahuelhual, L.; Carmona, A.; Lozada, P.; Jaramillo, A.; Aguayo, M. Mapping recreation and ecotourism as a cultural ecosystem service: An application at the local level in Southern Chile. Appl. Geogr. 2013, 40, 71–82. [Google Scholar] [CrossRef]
- Plieninger, T.; Dijks, S.; Oteros-Rozas, E.; Bieling, C. Assessing, mapping, and quantifying cultural ecosystem services at community level. Land Use Policy 2013, 33, 118–129. [Google Scholar] [CrossRef]
- Van Berkel, D.B.; Verburg, P.H. Spatial quantification and valuation of cultural ecosystem services in an agricultural landscape. Ecol. Indic. 2014, 37, 163–174. [Google Scholar] [CrossRef]
- De Agar, P.M.; Ortega, M.; de Pablo, C.L. A procedure of landscape services assessment based on mosaics of patches and boundaries. J. Environ. Manag. 2016, 180, 214–227. [Google Scholar] [CrossRef] [PubMed]
- Hou, J.; Ye, A.; You, J.; Ma, F.; Duan, Q. An estimate of human and natural contributions to changes in water resources in the upper reaches of the Minjiang River. Sci. Total Environ. 2018, 635, 901–912. [Google Scholar] [CrossRef]
- Sati, V.; Wei, D.; Xue-Qian, S. Options and strategies for livelihood sustainability in mountainous region of the upper Minjiang River basin, Sichuan Province, China. Span. J. Rural Dev. 2015, 6, 45–56. [Google Scholar] [CrossRef]
- Liu, M.; Hu, Y.; Chang, Y.; He, X.; Zhang, W. Land use and land cover change analysis and prediction in the upper reaches of the Minjiang River, China. Environ. Manag. 2009, 43, 899–907. [Google Scholar] [CrossRef]
- Aben, J.; Pellikka, P.; Travis, J.M. A call for viewshed ecology: Advancing our understanding of the ecology of information through viewshed analysis. Methods Ecol. Evol. 2018, 9, 624–633. [Google Scholar] [CrossRef]
- Weiss, A. Topographic position and landforms analysis. In Proceedings of the Poster Presentation, ESRI User Conference, San Diego, CA, USA, 9–13 July 2001. [Google Scholar]
- Lletı, R.; Ortiz, M.C.; Sarabia, L.A.; Sánchez, M.S. Selecting variables for k-means cluster analysis by using a genetic algorithm that optimises the silhouettes. Anal. Chim. Acta 2004, 515, 87–100. [Google Scholar] [CrossRef]
- Su, T.; Dy, J. A deterministic method for initializing k-means clustering. In Proceedings of the 16th IEEE International Conference on Tools with Artificial Intelligence (ICTAI 2004), Boca Raton, FL, USA, 15–17 November 2004. [Google Scholar]
- Pastur, G.M.; Peri, P.L.; Lencinas, M.V.; García-Llorente, M.; Martín-López, B. Spatial patterns of cultural ecosystem services provision in Southern Patagonia. Landsc. Ecol. 2016, 31, 383–399. [Google Scholar] [CrossRef]
- Fung, T.; Wong, F.-K. Ecotourism planning using multiple criteria evaluation with GIS. Geocarto Int. 2007, 22, 87–105. [Google Scholar] [CrossRef]
- Chhetri, P. Modelling the attractiveness potential of scenic views: A case study of the Grampians National Park, Australia. Tour. Recreat. Res. 2006, 31, 101–107. [Google Scholar] [CrossRef]
- Irl, S.D.; Harter, D.E.; Steinbauer, M.J.; Gallego Puyol, D.; Fernández-Palacios, J.M.; Jentsch, A.; Beierkuhnlein, C. Climate vs. topography–spatial patterns of plant species diversity and endemism on a high-elevation island. J. Ecol. 2015, 103, 1621–1633. [Google Scholar] [CrossRef]
- Vellend, M.; Geber, M.A. Connections between species diversity and genetic diversity. Ecol. Lett. 2005, 8, 767–781. [Google Scholar] [CrossRef]
- García-Llorente, M.; Martín-López, B.; Iniesta-Arandia, I.; López-Santiago, C.A.; Aguilera, P.A.; Montes, C. The role of multi-functionality in social preferences toward semi-arid rural landscapes: An ecosystem service approach. Environ. Sci. Policy 2012, 19, 136–146. [Google Scholar] [CrossRef]
- Abildtrup, J.; Garcia, S.; Olsen, S.B.; Stenger, A. Spatial preference heterogeneity in forest recreation. Ecol. Econ. 2013, 92, 67–77. [Google Scholar] [CrossRef]
- Zagarola, J.-P.A.; Anderson, C.B.; Veteto, J.R. Perceiving Patagonia: An assessment of social values and perspectives regarding watershed ecosystem services and management in southern South America. Environ. Manag. 2014, 53, 769–782. [Google Scholar] [CrossRef]
- Wood, S.A.; Guerry, A.D.; Silver, J.M.; Lacayo, M. Using social media to quantify nature-based tourism and recreation. Sci. Rep. 2013, 3, 2976. [Google Scholar] [CrossRef]
- Higuera, D.; Martín-López, B.; Sánchez-Jabba, A. Social preferences towards ecosystem services provided by cloud forests in the neotropics: Implications for conservation strategies. Reg. Environ. Chang. 2013, 13, 861–872. [Google Scholar] [CrossRef]


© 2019 by the authors. Licensee MDPI, Basel, Switzerland. This article is an open access article distributed under the terms and conditions of the Creative Commons Attribution (CC BY) license (http://creativecommons.org/licenses/by/4.0/).
Share and Cite
Lu, Y.; Li, Q.; Xu, P.; Wang, Y. Incorporating Rarity and Accessibility Factors into the Cultural Ecosystem Services Assessment in Mountainous Areas: A Case Study in the Upper Reaches of the Minjiang River. Sustainability 2019, 11, 2203. https://doi.org/10.3390/su11082203
Lu Y, Li Q, Xu P, Wang Y. Incorporating Rarity and Accessibility Factors into the Cultural Ecosystem Services Assessment in Mountainous Areas: A Case Study in the Upper Reaches of the Minjiang River. Sustainability. 2019; 11(8):2203. https://doi.org/10.3390/su11082203
Chicago/Turabian StyleLu, Yafeng, Qinwen Li, Pei Xu, and Yukuan Wang. 2019. "Incorporating Rarity and Accessibility Factors into the Cultural Ecosystem Services Assessment in Mountainous Areas: A Case Study in the Upper Reaches of the Minjiang River" Sustainability 11, no. 8: 2203. https://doi.org/10.3390/su11082203
APA StyleLu, Y., Li, Q., Xu, P., & Wang, Y. (2019). Incorporating Rarity and Accessibility Factors into the Cultural Ecosystem Services Assessment in Mountainous Areas: A Case Study in the Upper Reaches of the Minjiang River. Sustainability, 11(8), 2203. https://doi.org/10.3390/su11082203