Abstract
The effects of exogenously applied Moringa oleifera leaf extract (MLE), nitrogen and potassium were studied on the productivity and quality of two cotton cultivars (CIM-573) and transgenic Bt cotton (CIM-598). The Randomized Complete Block Design (RCBD) factorial experiment was conducted at Bahauddin Zakariya University, Multan, Pakistan (30.2639 °N, 71.5101 °E; 123 m asl), during 2016 and 2017, with three replications. The analysis of variance revealed the significance of cotton cultivars and foliar applications for the majority of traits studied, in both years. The CIM-573 had superiority for most of the traits studied in 2016 and 2017 trials, while the CIM-598 cultivar had significantly higher record for chlorophyll content, seed cotton yield, mean boll weight, and seed index in 2016 and sympodial branches per plant in 2017. Foliar application of Moringa Leaf Extract (MLE) and synthetic fertilizers showed significant differences for the traits studied compared to the distilled water. Exogenous application of MLE has a positive effect on photosynthetic and enzymatic activities that improve the efficiency of nutrients that are utilized, thereby improving the growth, seed cotton yield and quality of cotton cultivars tested. All the interaction effects had a significant influence on the traits studied, except ginning percentage in 2016. The interaction between the conventional cotton cultivar (CIM 573) and exogenous application of MLE + nitrogen + potassium had significantly higher effect on plant height, cotton yield, staple length, fiber maturity, and fiber strength for the 2017 trial and was superior for the quality parameters in 2017. The interaction of the Bt cotton cultivar (CIM 598) and the foliar application of MLE + nitrogen + potassium had superiority in cotton yield, yield components and the quality parameters in the 2017 trial. Both the CIM 573 and CIM 598 cotton cultivars had consistent expressions for all quality traits studied, although they did fluctuate in their expression to these agronomic traits between the field trials of 2016 and 2017. Additive gene effects could be the explanation for the unstable effects of yield and the related traits in the different environmental conditions of the field trials in the two years. Our results suggest that the exogenous application of MLE alone and in combination with nitrogen and potassium could be used to improve the productivity and the quality of these cotton cultivars. The correlation coefficients indicate strong associations between the agronomic and quality traits, indicating that one or more yield parameters could be used as selection criteria to improve the productivity and quality of cotton.
1. Introduction
Cotton (Gossypium hirsutum L.), a natural fiber plant, is a prominent cash crop that is grown commercially for agricultural and industrial purposes in more than 80 countries around the world [1,2] with a major contribution from India (6,205,000 metric tons), followed by China, USA, Brazil, and Pakistan for 2017 [3]. Cotton is a subtropical and perennial plant that belongs to Malvaceae family, with more than 52 species, 45 diploid (2x) and 7 tetraploids (4x) [4]. It produces excellent unicellular fiber comprised of a secondary cellulose wall [5].
Even though the overall production of cotton is increasing yearly in Pakistan, the productivity per unit area is increasing marginally. These marginal increases could be due to various constraints, such as soil moisture stress that reduces the availability of nutrients from soil at critical stages of crop. Any nutrient deficiency in the soil adversely affects the growth and productivity of crops even when other nutrients are of the optimum amount in the soil [6]. An adequate supply of nutrients is required for normal growth and improving productivity [7].
It is well known that nitrogen is the most important nutrient to improve the growth and yield of cotton [8]. Foliar application of nitrogen has a vital role in the growth, development, yield, and fiber quality of cotton. Nitrogen application prevents the abscission of squares and bolls; mobilization and accumulation of photosynthates are stimulated in newly formed bolls, thus it increases the number of bolls and their weight [9].
Potassium plays a significant role in cotton yield production and fiber quality determination. Introduction of high yielding cultivars and the improvement in cropping intensity have quickly exhausted soil potassium reserves [10]. Potassium deficiency negatively affects the productivity of cotton by reducing the leaf area and photosynthesis, which results in an overall reduction in the necessary amount of photosynthetic assimilates for growth [11]. Foliar application of potassium offers an opportunity for rapid and effective mid-season scarcities correction, particularly in the season when potassium application to soil may not be effective [12,13]. Potassium is considered essential for the growth and development of a plant, having a positive relationship with quality attributes due to its versatile role in biochemical and physiological activities of plants [11,14]. It plays essential roles in protein synthesis, enzymes activation, stress resistance, stomatal movements, cation-anion balance, osmoregulation, and photosynthesis [15].
Moringa leaf extract (MLE) is known to be among the natural growth enhancers that improve the growth, yield and quality of different plants, such as senna [16], alfalfa, clitoria, and mung bean [17]. MLE being rich in K, Ca, Fe, amino acids, ascorbate, and growth-regulating hormones like zeatin, is an ideal plant growth enhancer [18]. MLE extract is an ideal plant growth enhancer for different plant species such as cotton, wheat and tomato, allowing to increase the yield by 20–35% [18,19]. Fiber quality of cotton is influenced by genotype [20], however, the agronomic practices and environmental conditions affect fiber quality [21]. This study evaluates the comparative performance of foliar application of nitrogen and potassium fertilizers and MLE natural growth enhancer in improving the productivity and fiber quality of cotton.
2. Materials and Methods
2.1. Experimental Detail
A field trial was conducted at a research field of Bahauddin Zakariya University, Multan, Pakistan (30.2639 °N, 71.5101 °E; 123 m asl) during 2016 and 2017, to study the growth and yield performance of cotton cultivars under exogenous application of fertilizers and natural growth promoter. This study was arranged in a randomized complete block design with factorial experiment having three replications. The treatments included two cotton cultivars CIM-573 (non Bt) and CIM-598 (Bt) and exogenous application of bio-stimulant (MLE) and fertilizers (nitrogen and potassium).
2.2. Soil Analysis
Composite soil samples were collected from the study area before sowing and examined for physico–chemical features. The soil texture of the experimental site was silt loam, having EC 1.1 and 1.02 dS m−1, pH 8.07 and 8.2, organic matter 0.71 and 0.69%, total nitrogen 0.053 and 0.032%, available phosphorus 7.05 and 6.23 ppm and exchangeable potassium 148 and 180 ppm during first and second growing seasons, respectively.
2.3. Preparation of Moringa Leaf Extract (MLE)
Fresh leaves and tender twigs of Moringa oleifera plants grown in botanical garden of Bahauddin Zakariya University, Multan was harvested and washed several times with distilled water. Moringa sample material was frozen (−5 °C) for 12 hours and pressed for extraction according to the procedure described by Yasmeen et al. (2018). The extract was filtered twice by using Whatman No.1 filter paper and then centrifuged at 8000 g for 15 min and diluted 30 times with distilled water.
2.4. Crop Husbandry
A fine seedbed was prepared by cultivating the soil three times. The plot size was 7 m × 5.0 m and consisted of four beds. Seeds of cotton cultivars (CIM-573 and CIM-598) were dibbled manually during the last week of March 2016 and 2017. Planting was processed, keeping 75 cm row-to-row and 30 cm intervals. To ensure successful seed germination and emergence, the furrows were irrigated 72 h after planting. Then, subsequent irrigations were applied depending on the crop requirement until maturity. For the optimum number of plants per unit area, gap filling and thinning was performed on the 10th and 22nd day after emergence, respectively, making a recommended plant density of 40,000 plants ha−1. Full doses of phosphorus and potassium (56 kg P ha−1 and 62 kg K ha−1) were applied at sowing time. Nitrogen (145 kg N ha−1) was applied in three splits at sowing time, beginning of bloom and peak flowering stage. Weeds were controlled with the application of pre-emergence herbicide of Pendimethalin (Stomp-330E at 2.5 L ha−1), with two-hand weeding at the 25th and 35th days after sowing. Insect and pest control was achieved with spray assessments based on threshold scouting. All other agronomic practices were followed using recommended state package practices for raising the crop.
2.5. Foliar Application
MLE (30 times diluted), nitrogen (2%) and potassium (2%) were exogenously applied either alone or in combination and with distilled water spray being taken as control. Foliar treatments were applied 120 and 150 days after sowing using a hand sprayer.
2.6. Data Collection
After 30 days of sowing, 10 plants were randomly selected from each plot and tagged to record the plant height (cm), sympodial branches per plant, number of harvested bolls, mean boll weight (g), and seed index (g). Manual harvesting of seed cotton was performed twice in the middle two rows. The first picking was made when the cotton bolls were about 60% opened and the final harvesting was done in the last week of November for both years. After picking, a bulk sample of 200 g seed cotton was taken from each experimental unit. Two clean and dry sub samples of 50 g each were weighed and then ginned separately with a single roller electric gin. The lint obtained from each sample was weighed and lint percentage was calculated by using the following formula:
GOT % = Weight of lint (g)/Weight of seed cotton (g) × 100
After ginning, 15 g of lint samples were used in determining fiber quality parameters by using fibro graph HVI-900. It is a computerized high volume instrument which provides the comprehensive profile of raw fiber according to the International Trading Standards [22].
2.7. Statistical Procedure
All data were subjected to the analysis of variance (ANOVA) adopting the software of XLStat Premium v2016.02.28451. Correlation coefficient and regression plots were conducted using MINITAB (Release 16). Means of the different treatments were compared by DMR test at a probability level of 5% [23].
3. Results
The analysis of variance of the studied characteristics showed that cotton cultivars had a significant effect on all the traits except ginning percentage (Table 1).

Table 1.
Source of variance and standard deviation for growth and yield traits of cotton, 2016.
Exogenous applications significantly affected the sympodial branches per plant, mean boll weight seed index, fiber fineness, staple length, and fiber maturity ratio for the first yield trial (2016). However, none of the traits showed significant differences for the cultivars and foliar application interaction (Table 2). Cotton cultivars significantly affected all the traits except sympodial branches per plant during the second growing season (2017). Foliar applications also significantly affected the majority of traits studied (Table 3 and Table 4).
Table 2.
Source of variance and standard deviation for quality traits of cotton, 2016.
Table 3.
Source of variance and standard deviation for growth and yield traits of cotton, 2017.
Table 4.
Source of variance and standard deviation for quality traits of cotton, 2017.
Results in Table 5 and Table 6 indicate that CIM-573 is a better performing cultivar than CIM-598 for most of the traits studied in 2017, while the opposite result was recorded for chlorophyll content, seed cotton yield, mean boll weight, and seed index.
Table 5.
Means and comparison (Duncan) of the cultivars, foliar applications and their interaction for the growth traits, yield and its components of cotton grown in 2016.
Table 6.
Means and comparison (Duncan) of the cultivars, foliar applications and their interaction for the fiber quality traits of cotton grown in 2016.
No significant differences were recorded between the two cultivars for ginning percentage. For the experiment conducted in 2017, CIM-573 recorded significantly higher result for all traits except sympodial branch-plant, which was also higher in CIM-573 but not significant (Table 7 and Table 8). Both genotypes were significantly different in plant height, given that they exceeded height by 21 cm and 28.5 cm for CIM 573 compared to CIM 598 at both years of field trials, respectively.
Table 7.
Means and comparison (Duncan) of the cultivars, foliar applications and their interaction for the growth traits, yield and its components of cotton grown in 2017.
Table 8.
Means and comparison (Duncan) of the cultivars, foliar applications and their interaction for the fiber quality traits of cotton grown in 2017.
Foliar applications of MLE and fertilizers had significant differences for most of the traits studied at both years of field trials (Table 7 and Table 8). Levels of foliar applications indicated significant effects for the traits studied except staple length and fiber uniformity in 2017 (Table 8). The result of foliar applications and their interaction with the cotton cultivars affirmed that the interaction of MLE with nitrogen had more effect on plant height than the other interaction. This could be attributed to the fact that the application of MLE and Nitrogen has encouraging effects as an activator of numerous enzymes involved in the cell division and enlargement that makes their effect more promising for the plant height trait.
All the interaction effects had a significant influence on the traits studied, except ginning percent, for the first year (2016), when compared to the foliar application of distilled water combined with the cultivars for both trials. The interaction between V1 x F8 (conventional cotton cultivar CIM 573 x foliar application of moringa leaf extract + nitrogen + potassium) had the highest and a significant effect on the plant height and all other fiber quality traits, while for other traits the V2 x F8 (Bt cotton cultivar CIM 598 x foliar application of moringa leaf extract + nitrogen + potassium) interaction had superiority for both years.
In studying quality-related parameters, higher fiber fineness (less micronare value of 3.76 and 3.77 µg inch−1) was obtained from CIM 573 cultivars for both years. In the interaction of this cultivar with different foliar applications, the V1 x F8 was recorded to have the highest and a significant influence with other combinations at both years of field trials.
Association between the Traits
Correlation coefficient of cotton yield, its contributing components and fiber traits are necessary to be detected in order to determine the suitable selection criteria required for the improvement of seed cotton yields. There are strong correlations between the traits studied in this investigation, ranging from the highest positive correlation of r = 0.988 (between staple length and fiber strength) to the highest negative value of r = −0.823 (between chlorophyll content and staple length), as shown in Table 9. Such an association will assist breeders in the future selection program of cotton genotypes.
Table 9.
Relationship between traits of the study (average of both years data), based on the Pearson’s correlation analysis showing correlation and P values.
Framing a relationship between the traits and distortion strength of their parameters could be figured out via the regression line. Plant height and fiber uniformity are identified to have a high adjusted regression value of 86.6% (Figure 1) for their relation (r = 935). Chlorophyll content also has a significant direct association (P value = 0.000) to seed cotton yield, giving a reasonable regression value in the regression plot between these two traits (Figure 2).
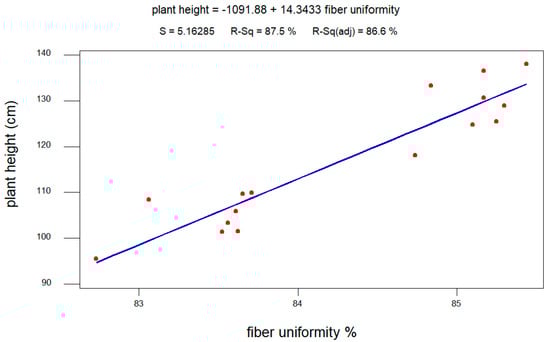
Figure 1.
Regression plot of plant height versus fiber uniformity observed from morphological data of cotton genotypes applied with foliar applications.
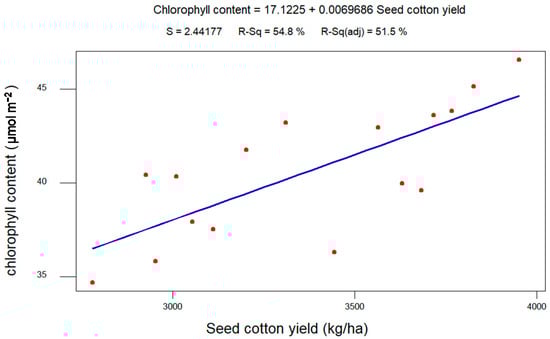
Figure 2.
Regression plot of chlorophyll content versus seed cotton yield observed from morphological data of cotton genotypes applied with foliar applications.
4. Discussion
MLE being rich source of growth regulating hormones such as zeatin, antioxidants including phenolics, ascorbate and nutrients (K, Ca, Mg, Zn, Fe) significantly improved the growth, yield and fiber quality traits [18]. Exogenous application of MLE might alter the endogenous cytokinin levels; the enhanced contents stimulate cell division resulting in significantly higher growth and yield-contributing parameters [19]. These facts have been reflected to give the highest seed cotton yield for CIM-598 cultivar when MLE is combined with N and K in both years. This combination made the photosynthetic and enzyme activity increase [19]. Part of the activities are due to the vital role of MLE in the growth and development of cotton yield and fiber quality [24]. Foliar spray of MLE and nitrogen prevents the abscission of squares and bolls, thus increasing the number of bolls and also stimulating the mobilization and accumulation of photosynthates in newly formed bolls, making the number of bolls and their weight increase [25]. Potassium also contributes positively to the quality of cotton that has been affirmed by the production of longer cotton fiber under sufficient potassium nutrition [26].
The variation in growth, yield and fiber quality parameters between the two cotton cultivars is attributed to the use of different types of genetic material and efficient utilization of inputs and natural resources [27]. A more significant increase in the number of harvested bolls for CIM 573 than in CIM 598 was realized in both years. Differences in the performance of this trait were realized due to the effect of foliar applications and also for their interaction with both cotton cultivars. A higher number of bolls per plant was observed with the application of MLE. This might be due to the richness of MLE in micro and macro-nutrients and zeatin as a growth-promoting hormone. They had a positive effect on the photosynthesis rate that accelerated the blossoming and formation of a higher number of bolls [28]. This could be due to the available zeatin that allows the plant to stay green for a longer period of time giving adequate time to express their genetic power for flowering and boll formation [29]. The combination of three application elements (MLE+N+K) had the highest boll number in both years. Increasing photosynthetic rate and assimilation of carbohydrate supply during the reproductive phase into the bolls could be among the main reasons for increasing the productivity of boll number and cotton yield [25]. Reverse action of the low productivity of photosynthetic assimilation and transportation toward the bolls might be a reason for low productivity in control treatment [30]. Combined application of MLE +N+K returned more net benefits from both cotton cultivars in both years. This combination has enhanced the yield either by altering the distribution pattern of dry matter or by regulating the growth attributes in crop plants [31].
Tensile strength is affected by the length and strength of cotton. Low strength fiber makes the manufacturing process of fiber difficult. The fiber strength was valued more in CIM 573 for both years of experimental trials, indicating the effect of genotypes on fiber strength of cotton. The other investigation exhibits a difference in fiber strength among variable cotton genotypes [32]. Influencing of fiber strength by both genetics and environmental conditions was also reported previously [33].
The three elements of MLE+N+K had a realized role in fiber development and hence the foliar spray of this combination improved the fiber properties of cotton. Development of micronaire, staple length, fiber maturity and uniformity, and fiber strength, in our result showed consistency in the response of fiber quality parameters to this combination in both years of field trials, by playing a significant role in fiber development and improved cell elongation [34]. Differences in micronaire values due to different genotypes have also been reported by other researchers [35].
To determine the effect of year trials on the studied characteristics, both cotton cultivars had consistent expression for all quality traits studied. CIM 573 cultivar was superior having highly significant effect on cotton quality traits compared to CIM 598 in both year trials, while the cultivars had different scenarios for agronomic traits during both field trials. CIM 598 gave higher seed cotton yield and exceeded the yield of CIM 573 by 285 kg/ha for the first year, while in 2017, CIM 573 showed better expression in the ambient environment as it exceeded CIM 598 in the seed cotton yield by more than a ton/ha. This expression could be related to the persistency of quality traits of cotton cultivars to different environmental conditions in 2016 and 2017, and these traits are explained to be under the effect of single or few genes, while the agronomic traits were more fluctuated with different environmental conditions in both years due to multi-gene controls of the agronomic traits [36]. The persistency of such expression patterns for both cotton cultivars was reflected in their interaction effects with different foliar applications for both years. In terms of the effect of foliar application on the expression of the traits studied for both years, the application of MLE +N+K had a consistent pattern in having a highly significant effect on agronomic and quality traits of cotton during 2016 and 2017 field trials.
Plant height was found to have a strong and positive correlation with the quality parameters, having the highest correlation with fiber uniformity (r = 0.935). This association was also affirmed via the regression plot between these parameters giving a highly adjusted regression value of r2 = 86.6% (Figure 1). Same trend of association between the plant height, yield and its components in cotton was observed by Nizamani et al. [37]. Staying for adequate time in the growing period made the plants have enough time, while it positively improved the quality of bolls and fiber quality. Other traits such as symbodial branch/plant, number of harvested boll, chlorophyll content, seed cotton yield, mean boll weight, ginning percent, and seed index have a negative correlation with the quality parameter traits. In another study conducted by Erande et al. [38] micronaire value was found to exhibit a negative association with seed cotton yield. Chlorophyll content can be used as a strong indicator in advance to predict the quality parameter. It is also a reasonable signal for the yield and its component traits, which is affirmed here in this correlation matrix (Figure 2). Both the yield and quality parameters in cotton have to be developed simultaneously, while their negative associations make the selection program difficult, as the mating progress will be necessary to break this linkage [39].
5. Conclusions
Exogenous application of MLE alone and in combination with nitrogen and potassium could be used to improve the productivity and quality of cotton. Exogenous application of MLE has a great effect on photosynthetic and enzymatic activities that appropriate the efficiency of utilizing nutrients and thereby improve the growth and seed cotton yield and quality characters in cotton. Different applications created variable environmental conditions to allow the genetic potential of the cotton cultivars to be expressed. The cotton cultivars indicated consistent expression for the all quality traits studied in 2016 and 2017 field trials. The conventional cotton cultivar (CIM 573) was superior for the yield in 2017 trial and for cotton quality traits at both year trials. The fluctuation in the cultivars’ expression of an agronomic trait is referring to the additive gene effect for controlling yield and most of the yield-related traits. This behavior of both cotton cultivars had similar patterns in their interactions with different foliar applications during the field trials. The correlation coefficient indicated a strong association between the agronomic and quality traits. This fact is also clear in the regression analysis between plant height and fiber uniformity with a highly adjusted regression value of 86.6. There is a high association between the studied characteristics suggesting that one or more yield traits can be used as selection criteria to improve the yield and quality of cotton.
Author Contributions
Conceived and designed the experiment: M.A., N.H. and A.Y. Analyzed the data: N.S.A., S.H.S.K. and S.N. Contributed materials/analysis tools: A.A., J.I., G.A.S. and M.A. Wrote the paper: N.S.A. and M.A.
Funding
This research received no external funding.
Conflicts of Interest
The authors declare no conflict of interest.
References
- Parveen, S.; Iqbal, R.M.; Akram, M.; Iqbal, F.; Tahir, M.; Rafay, M. Improvement of growth and productivity of cotton (Gossypium hirsutum L.) through foliar applications of naphthalene acetic acid. Semina Ciências Agrárias 2017, 38, 2. [Google Scholar] [CrossRef]
- Singh, P. Cotton Breeding; Kalyani Publishers: New Delhi, India, 2008. [Google Scholar]
- Statista, Cotton Production by Country Worldwide. 2018. Available online: https://www.statista.com/statistics/263055/cotton-production-worldwide-by-top-countries/ (accessed on 18 January 2019).
- Chandnani, R.; Zhang, Z.; Patel, J.D.; Adhikari, J.; Khanal, S.; He, D.; Brown, N.; Chee, P.W.; Paterson, A.H. Comparative genetic variation of fiber quality traits in reciprocal advanced backcross populations. Euphytica 2017, 213, 241. [Google Scholar] [CrossRef]
- Dewdar, M. Return of soil and foliar applications of potassium fertilization on potential and fiber quality traits for two Gossypium barbadense (L.) varieties in Egypt. Sch. J. Agric. Sci. 2013, 3, 94–98. [Google Scholar]
- Soleymani, A.; Shahrajabian, M.H. The effects of Fe, Mn and Zn foliar application on yield, ash and protein percentage of forage sorghum in climatic condition of Esfahan. Int. J. Biol. 2012, 4, 92. [Google Scholar] [CrossRef]
- Jamal, Z.; Hamayun, M.; Ahmad, N.; Chaudhary, M.F. Effect of soil and foliar application of different concentrations of NPK and foliar application of (NH4)2SO4 on different yield parameters in wheat. J. Agron. 2006, 5, 251–256. [Google Scholar]
- Baraich, A.; Jamali, L.; Salarzi, A. Effect of nitrogen application rates on growth and yield of cotton varieties. Pak. J. Agric. Agric. Eng. Vet. Sci. 2012, 28, 115–123. [Google Scholar]
- Ahmad, S.; Raza, I.; Muhammad, D.; Ali, H.; Hussain, S.; Dogan, H.; Haq, M.Z.U. Radiation, water, and nitrogen use efficiencies of Gossypium hirsutum L. Turk. J. Agric. For. 2015, 39, 825–837. [Google Scholar] [CrossRef]
- Akhtar, M.E.; Sardar, V.; Ashraf, M.; Akhtar, M.; Khan, M.Z. Effect of potash application on seed cotton yield and yield components of selected cotton varieties-I. Asian J. Plant Sci. 2003, 2, 602–604. [Google Scholar]
- Wang, N.; Hua, H.; Eneji, A.E.; Li, Z.; Duan, L.; Tian, X. Genotypic variations in photosynthetic and physiological adjustment to potassium deficiency in cotton (Gossypium hirsutum). J. Photochem. Photobiol. B 2012, 110, 1–8. [Google Scholar] [CrossRef]
- Samejima, H.; Kondo, M.; Ito, O.; Nozoe, T.; Shinano, T.; Osaki, M. Characterization of root systems with respect to morphological traits and nitrogen-absorbing ability in the new plant type of tropical rice lines. J. Plant Nutr. 2005, 28, 835–850. [Google Scholar] [CrossRef]
- Arshad, M. Evaluating factors affecting cotton tolerance to potassium deficiency stress using path analysis. Int. J. Agric. Biol. 2008, 10, 511–516. [Google Scholar]
- Wang, L.; Chen, F. Genotypic variation of potassium uptake and use efficiency in cotton (Gossypium hirsutum). J. Plant Nutr. Soil Sci. 2012, 175, 303–308. [Google Scholar] [CrossRef]
- Chérel, I. Regulation of K+ channel activities in plants: From physiological to molecular aspects. J. Exp. Bot. 2004, 55, 337–351. [Google Scholar] [CrossRef]
- Balakumbahan, R.; Rajamani, K. Effect of bio stimulants on growth and yield of senna (Cassia angustifolia var. KKM. 1). J. Hortic. Sci. Ornam. Plants 2010, 2, 16–18. [Google Scholar]
- Abohassan, R.A.; Abusuwar, A.O. Effects of Moringa olifera leaf extracts on growth and productivity of three leguminous crops. Legume Res. Int. J. 2018, 41, 114–119. [Google Scholar]
- Yasmeen, A.; Arif, M.; Hussain, N.; Malik, W.; Qadir, I. Morphological, Growth and Yield Response of Cotton to Exogenous Application of Natural Growth Promoter and Synthetic Growth Retardant. Int. J. Agric. Biol. 2016, 18, 1109–1121. [Google Scholar] [CrossRef]
- Yasmeen, A.; Basra, S.M.A.; Farooq, M.; Rehman, H.U.; Hussain, N. Exogenous application of moringa leaf extract modulates the antioxidant enzyme system to improve wheat performance under saline conditions. Plant Growth Regul. 2013, 69, 225–233. [Google Scholar] [CrossRef]
- Bakhsh, A.; Rehman, M.; Salman, S.; Ullah, R. Evaluation of cotton genotypes for seed cotton yield and fiber quality traits under water stress and non-stress conditions. Sarhad J. Agric. 2019, 35, 161–170. [Google Scholar] [CrossRef]
- Subhan, M.; Khan, H.U.; Ahmed, R. Population analysis of some agronomic and technological characteristics of upland cotton (Gossypium hirsutum L.). Pak. J. Biol. Sci. 2001, 1, 120–123. [Google Scholar]
- Sundaram, V.; Krishna, I.K.R.; Sreenivasan, S. Hand Book of Methods of Tests for Cotton Fibers, Yarns and Fabrics, Part I: Ginning Tests, Fiber Tests, Moisture Tests, and Structural Studies; Central Institute for Research on Cotton Technology, ICAR: Mumbai, India, 2002; pp. 1–19. [Google Scholar]
- Duncan, D.B. Multiple range and multiple F tests. Biometrics 1955, 11, 1–42. [Google Scholar] [CrossRef]
- Yasmeen, A.; Arif, M.; Hussain, N.; Naz, S.; Anwar, A. Economic analyses of sole and combined foliar application of moringa leaf extract (MLE) and k in growth and yield improvement of cotton. Int. J. Agric. Biol. 2018, 20, 857–863. [Google Scholar]
- Blaise, D.; Singh, J.; Bonde, A. Response of rainfed cotton (Gossypium hirsutum) to foliar application of potassium. Indian J. Agron. 2009, 54, 444. [Google Scholar]
- Pettigrew, W.T. Relationships between insufficient potassium and crop maturity in cotton. Agron. J. 2003, 95, 1323–1329. [Google Scholar] [CrossRef]
- Wang, F.; Peng, S.; Cui, K.; Nie, L.; Huang, J. Field performance of ‘Bt’ transgenic crops: A review. Aust. J. Crop Sci. 2014, 8, 18. [Google Scholar]
- Moyo, B.; Masika, P.J.; Hugo, A.; Muchenje, V. Nutritional characterization of Moringa (Moringa oleifera Lam.) leaves. Afr. J. Biotechnol. 2011, 10, 12925–12933. [Google Scholar]
- Iqbal, M.A.; Hussain, M.; Rehman, M.; Ali, M.; Rizwan, M.; Fareed, M. Allelopathy of Moringa. A review. Sci. Agric. 2013, 3, 9–12. [Google Scholar]
- Pettigrew, W.T. Potassium influences on yield and quality production for maize, wheat, soybean and cotton. Physiol. Plant. 2008, 133, 670–681. [Google Scholar] [CrossRef]
- Hassanpouraghdam, M.B.; Elamery, E.; Mazid, M. Note on the enzyme activities, productivity and quality parameters of chickpea cultivars under influence of diverse synthetic plant growth promoters. Indian J. Agric. Res. 2015, 49, 327–332. [Google Scholar] [CrossRef]
- Asif, M.U.; Mirza, J.I.; Zafar, Y. Genetic analysis for fiber quality traits of some cotton genotypes. Pak. J. Bot. 2008, 1, 1209–1215. [Google Scholar]
- Bednarz, C.W.; Shurley, W.D.; Anthony, W.S.; Nichols, R.L. Yield, quality, and profitability of cotton produced at varying plant densities. Agron. J. 2005, 97, 235–240. [Google Scholar]
- Aladakatti, Y.; Hallikeri, S.; Nandagavi, R. Yield and fiber qualities of hybrid cotton (Gossypium hirsutum) as influenced by soil and foliar application of potassium. Karnataka J. Agric. Sci. 2011, 24, 133–136. [Google Scholar]
- Harijan, Y.; Nishanth, G.; Katageri, I.; Khadi, B. Comparative Study for Seed Cotton Yield and Fibre Quality Parameters in Cotton (Gossypium sp. L.). Int. J. Pure Appl. Biosci. 2017, 5, 519–525. [Google Scholar] [CrossRef]
- Huang, C.; Nie, X.; Shen, C.; You, C.; Li, W.; Zhao, W.; Zhang, X.; Lin, Z. Population structure and genetic basis of the agronomic traits of upland cotton in China revealed by a genome-wide association study using high-density SNP s. Plant Biotechnol. J. 2017, 15, 1374–1386. [Google Scholar] [CrossRef] [PubMed]
- Nizamani, F.; Baloch, M.; Baloch, A.; Buriro, M.; Nizamani, G.; Nizamani, M.; Baloch, I. Genetic distance, heritability and correlation analysis for yield and fibre quality traits in upland cotton genotypes. Pak. J. Biotechnol. 2017, 14, 29–36. [Google Scholar]
- Erande, C.; Kalpande, H.; Deosarkar, D.; Chavan, S.; Patil, V.; Deshmukh, J.; Chinchane, V.; Kumar, A.; Dey, U.; Puttawar, M. Genetic variability, correlation and path analysis among different traits in desi cotton (Gossypium arboreum L.). Afr. J. Agric. Res. 2014, 9, 2278–2286. [Google Scholar]
- Meredith, W.R.; Bridge, R. Breakup of Linkage Blocks in Cotton, Gossypium hirsutum L. 1. Crop Sci. 1971, 11, 695–698. [Google Scholar] [CrossRef]
© 2019 by the authors. Licensee MDPI, Basel, Switzerland. This article is an open access article distributed under the terms and conditions of the Creative Commons Attribution (CC BY) license (http://creativecommons.org/licenses/by/4.0/).