Modeling American Household Fluid Milk Consumption and their Resulting Greenhouse Gas Emissions


School of Packaging, Michigan State University, East Lansing, MI 48824-1223, USA
*
Author to whom correspondence should be addressed.
Sustainability 2019, 11(7), 2152; https://doi.org/10.3390/su11072152
Submission received: 2 March 2019
/
Revised: 21 March 2019
/
Accepted: 8 April 2019
/
Published: 11 April 2019
(This article belongs to the Special Issue Packaging Sustainability - The Role of Packaging in Reducing Food Waste)
Abstract
:U.S. consumers are the largest contributors to food waste generation (FWG), but few models have explained how households waste food. This study examines how discrete-event simulation (DES) can identify areas for reducing FWG through packaging and consumer milk consumption behavioral changes. Household model parameters included: amount and type of consumption, type and number of containers bought, buying behavior, and shelf life of milk. Simulations comparing the purchase of quart, half gallon, and gallon milk containers were run for 10,000 days to identify which package type reduced waste for 50 1, 2 and 4-person households. Based on consumption averages from the U.S. National Dairy Council, results suggest that if 1 and 4-person households change their purchasing behavior from 1 half-gallon to 1 quart and 2 gallons to 3 half-gallons, they can reduce their greenhouse gas (GHG) emissions from milk consumption by 33% and 12%, respectively, without reducing their total milk consumption. Purchasing enough smaller containers to be equivalent to a larger size decreased spoilage, but not enough to reduce a consumer’s total milk consumption GHG emissions. Results showed that packaging accounts for 5% of the total milk consumption GHG emissions; most of a consumer’s impact comes from milk spoilage and consumption.

1. Introduction
Food waste has become an increasing concern due to the growing population, increasing food requirements, limited arable land, and rapidly filling landfills. Industrialized nations have been examined for wasting food more than non-industrialized nations, specifically at the consumer level [1]. Food waste (FW), which is the amount of food wasted at the consumer and retail level and does not include production and processing losses [2], accounts for 31% of the U.S. food supply [3]. Food wasted in the U.S. amounts to 60 billion kilograms, accounting for $162 billion U.S. dollars lost each year [3]. Similarly, food production accounts for 80%, or 68 trillion liters, of all freshwater use in the U.S., which means 17% of that fresh water, or 11.6 trillion liters, is wasted each year [4,5]. Feed crops comprised the largest portion of total fresh water use in the U.S., or 64% of the total, amounting to 44 trillion gallons per year [5].
From an environmental standpoint, not all food is created equal. Fresh fruits and vegetables account for the lowest impact while products from ruminants have the highest environmental impact [6,7]. Hence, reducing food waste for higher environmental impact food products, such as meat and dairy, could provide the largest opportunity for environmental footprint reductions in the food supply chain [8]. Previous research suggested that specific food products should be targeted for food waste reduction efforts [9,10]. Thus, cow’s milk was chosen as the primary target in this study. Although milk is less impactful than meat, it is consumed in large quantities and accounts for 13%—7.7 billion kg—of the total 60 billion kg of U.S. food waste [3]. Consumers account for the largest portion of fluid milk waste generation, 20%, compared to retailers, which account for 12% [3]. For every kg of fluid milk consumed, approximately 2.05 kg of CO2e are emitted including package end of life [11]; thus, consumption of milk accounts for 50 billion kg of CO2e each year. If 20% of milk is wasted, then consumer milk waste amounts to 10 billion kg of CO2e released annually.
There are a variety of reasons why consumers waste milk, including: Hurdles of everyday life, convenience, lifestyle choices, planning, expiration risk, storage, and packaging [12,13,14,15,16,17,18]. However, it is not known which of these attributes contributes to the largest portion of waste. According to Hebrok and Boks, the three dominating solutions for reducing consumer food waste are: (1) Technology that helps people plan, share, and keep an overview of stock, (2) packaging and storing solutions that extend shelf life, and (3) information and awareness campaigns [12]. Licciardello found that the relative environmental impact of milk packaging is small, 8% on average, compared to the impact of milk [19]. A review of food LCAs has identified that greater attention must be paid to packaging’s impact on the life cycle of a food product [20]. In addition, user behavior must be considered when determining the environmental impacts of a food packaging system [21]. Therefore, it is crucial to consider the package’s relative impact compared to the food product when determining how to reduce the total environmental impact of a food-packaging system [7,8,19,22].
Data on current U.S. food waste generation is based on total food supply estimates from the USDA Economic Research Service (ERS); they do not estimate waste within individual households [23]. Research conducted to understand U.K. consumers used discrete event simulation (DES) for the first time to model food waste in the home; particularly to generate data on consumer milk wastage, shopping behavior, package size, consumption, and shelf life to determine which of these factors affect fluid milk waste generation [24]. This DES model provided unique insights of the U.K. milk consumer behavior and our model was based on this framework. However, the U.K. DES model did not account for different household member types, meaning that all individuals within a house were defined with the same consumption habits. In addition, the model did not account for different consumer market shopping probabilities. Lastly, packaging data from the simulations was not considered when analyzing the GHG emissions of increased packaging use for decreasing milk spoilage. This paper conducts a similar DES modeling; however, it considers differences in container sizes, living arrangements, and shopping behavior to identify parameters that will decrease waste generation and GHG emissions for U.S. consumers.
2. Materials and Methods
2.1. Discrete Event Simulation
DES models queuing systems as they progress through time; it was chosen as the modeling method because consumers purchase and consume at random moments in time. Utilizing the DES method, people’s consumption and shopping habits are treated as entities. Entities, or individual items, flow through a series of queues and activities, where they are modified. Attributes are data assigned to entities to represent specific features of that entity. Events are discrete instances in time when changes are made to the system and affect the entities. Therefore, time does not move in a linear manner within the model; rather it jumps forward when events occur. This type of behavior is useful when modeling people because consumption or food purchasing can happen at any time.
Entity queues are areas where entities wait to be worked on or serviced. DES models often include randomness within the amount of time that an activity takes, the time that an event occurs, or generation of entities. Randomness within a model allows for the simulation of multiple samples, each with their own assigned random criteria and values [25]. SimEvents® (The MathWorks, Inc., Natick, MA, U.S.) [26] software was chosen because it simplifies DES modeling into a series of blocks and provides flexibility to model complicated simulation behavior using custom code. Table A1 and Table A2 (Appendix A) indicate each of the different terms and symbols that were used within the developed SimEvents® software.
2.2. How the Consumer Was Modeled Using DES
Figure 1 provides a high-level overview of the model used to simulate consumer consumption behavior.
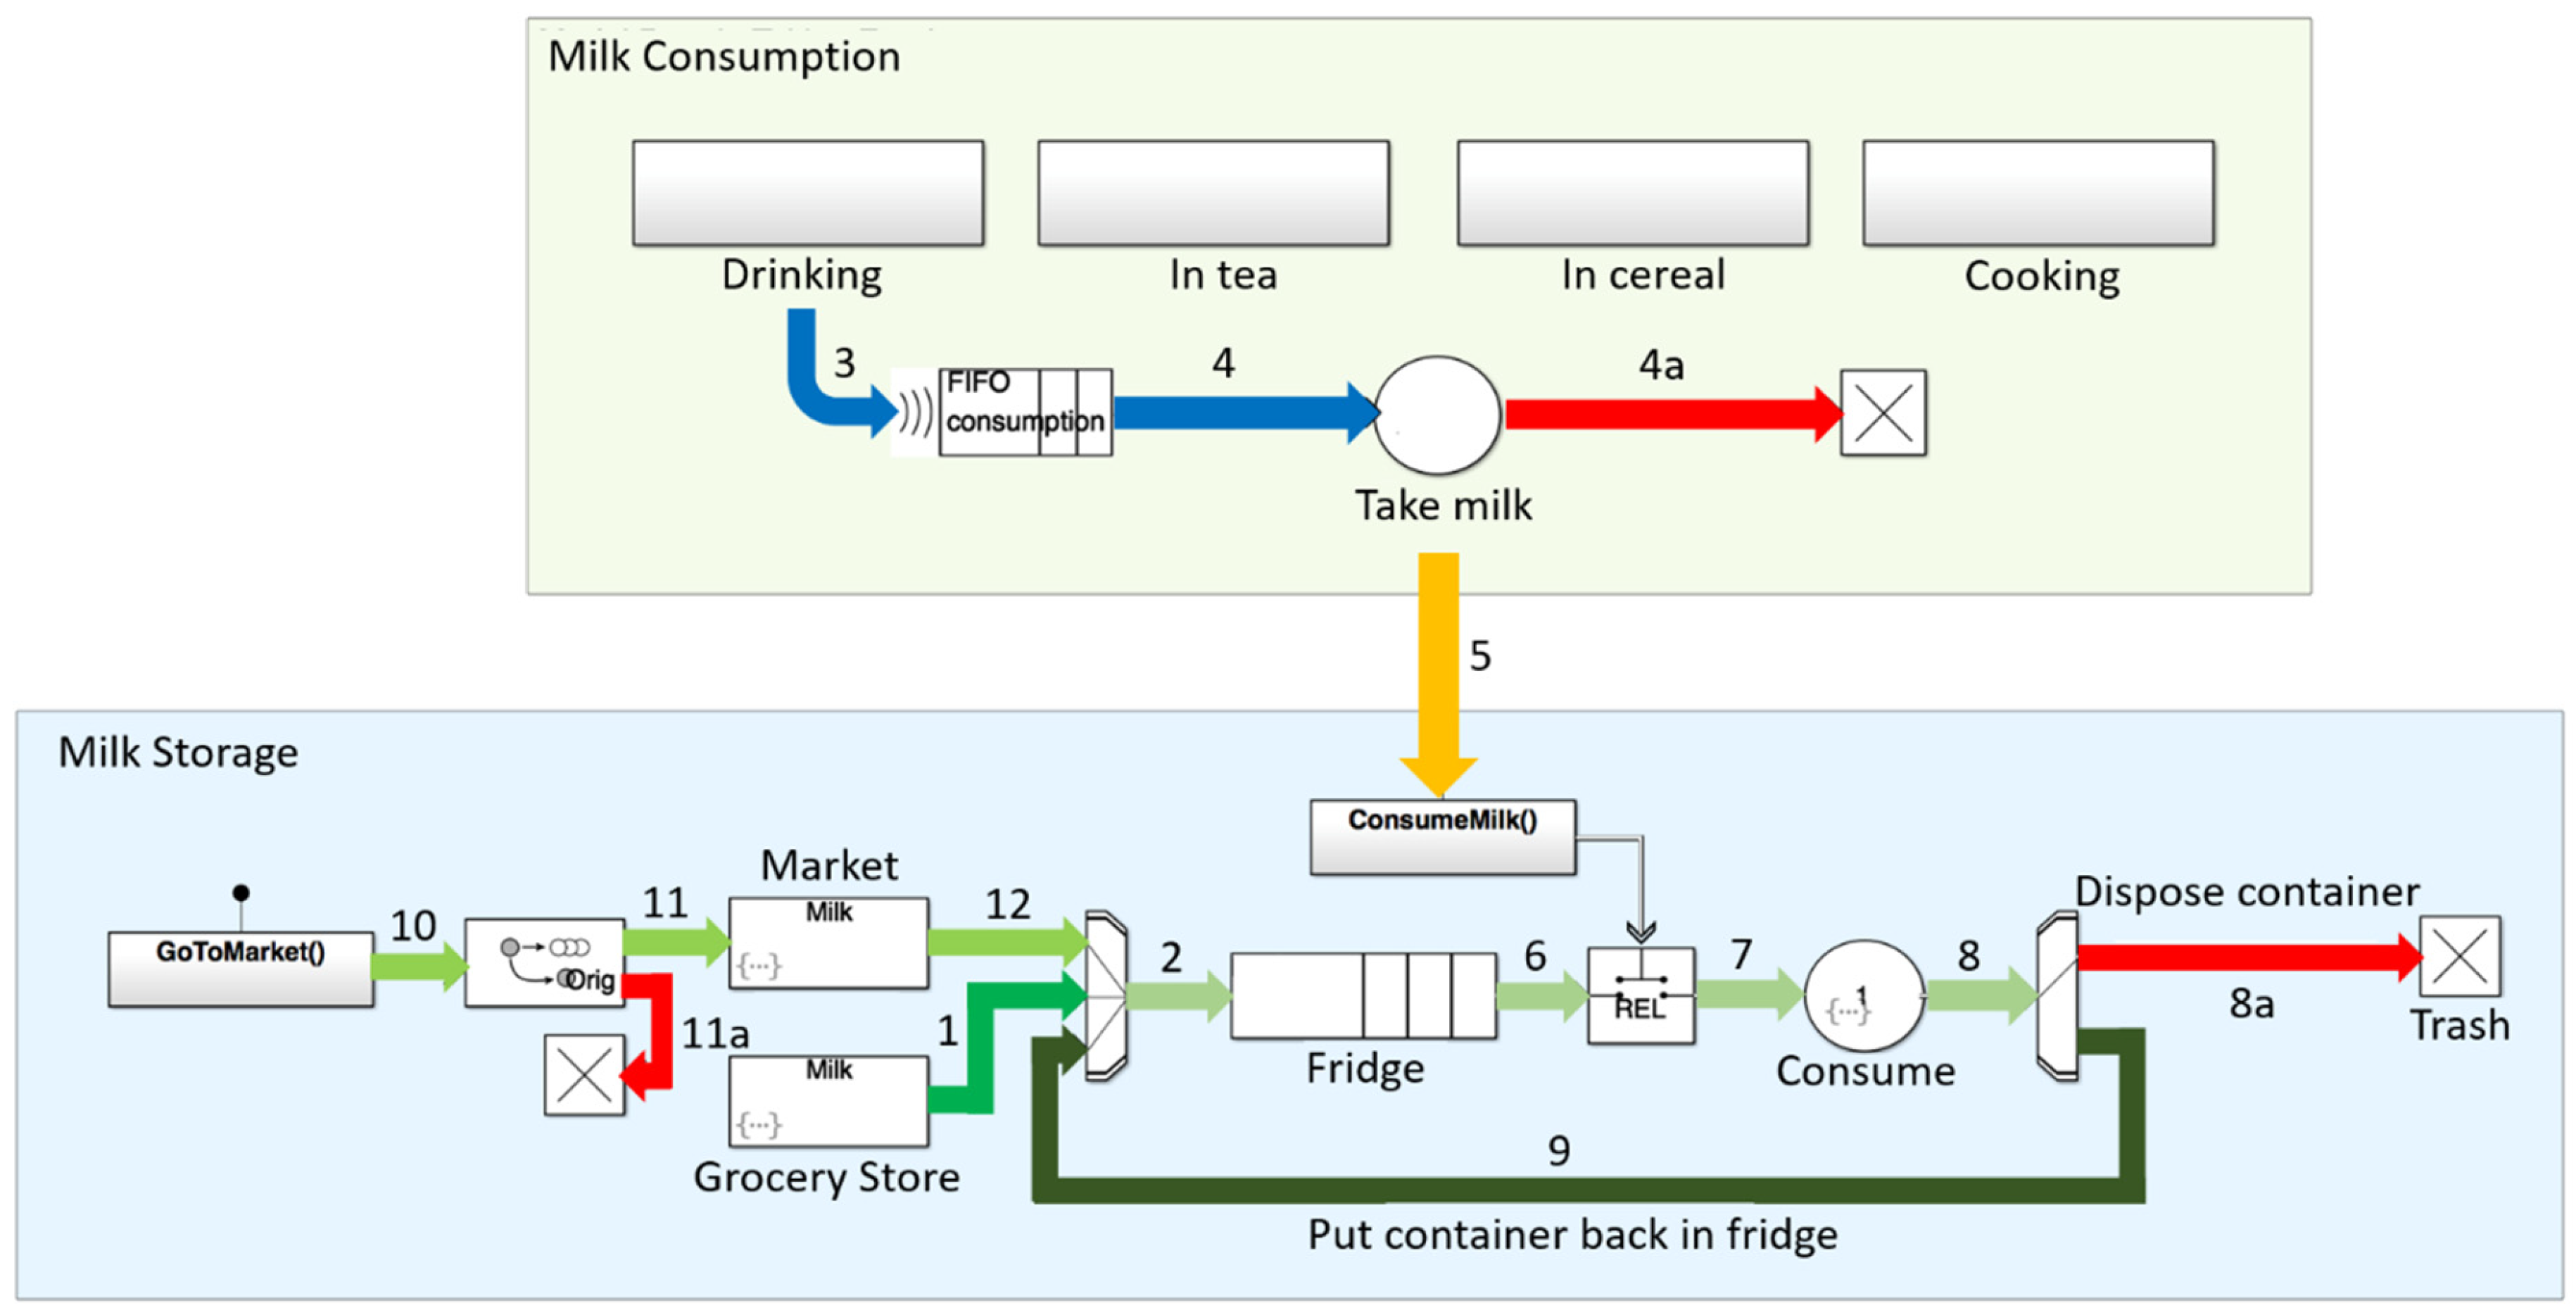
The refrigerator system (blue) is modeled in parallel with the consumption event system (green). First (1) consumers must purchase milk from the grocery store (e.g., weekly shopping trips). After purchasing, consumers put milk in their refrigerator (2) and each milk container is assigned a “Best before date”, which represents spoilage time. For example, milk spoils at 14 days after purchase or at 7 days after opening, whichever comes first. Therefore, if milk is opened on day 1, then it expires on day 8, whereas if it is opened on day 13, the milk expires on day 14. To represent variability within milk spoilage, a standard deviation of 2 days was used. Once purchased, milk travels through the gate (2) and enters a sorting queue. Numbers 10, 11 and 12 represent a similar function but instead mimic top-up shop purchases. Containers purchased from the top-up shop are non-periodic purchases that occur on-demand when the consumer runs out of milk. Upon purchase, containers are uniquely identified as shown in Table A3 (Appendix A). The likelihood of someone going top-up shopping is determined by a probability function, as it is assumed consumers do not go top-up shopping each time there is no milk available. For milk to be consumed, milk must be requested (3) via an entity generator. In the example shown in Figure 1, milk is requested to be drunk by the consumer (Block “Drinking”). Consumption events that occur are routed into a first in first out queue (FIFO), Figure 1 (4). The queue keeps consumption events in order and prevents them from disrupting one another. Upon leaving the queue, a consumption event entity enters a server that holds onto the entity and performs some actions. The server checks each event to ensure that the amount of milk requested by the consumer is available in their refrigerator. If there is enough milk in the refrigerator (2), then the request (5) is relayed to the “ConsumeMilk()” Simulink® [26] function and the server triggers the model to remove the requested amount of milk from the refrigerator (2). If the amount requested is greater than the amount available, then a running total is kept of the total amount of milk unavailable. If the probability function for the top-up shop is met, then the consumer will go top-up shopping. The consumption event entity then exits the server and is terminated from the model (4a).
Next, the REL gate—see Table A2 (Appendix A) for SimEvents® blocks description—ensures that milk is being consumed after a container has been taken out of the refrigerator (6). The sorting queue ensures that the oldest milk is used first, before newly purchased milk (2, Refrigerator). The UseBy attribute (Table A3—Appendix A) is used to store the “Best before date” for each container entity. Both the consumption request and container enter the “Consume” server, where it is decided whether the milk in the container is spoiled or not. If the milk has spoiled, then it travels through the gate into the trash (8a). If the milk is good, then the amount requested is consumed. The amount consumed is subtracted from the container volume, and then the container travels through the gate (9), where it is put back into the refrigerator. Once each household type was simulated for 10,000 days, data was outputted from Matlab® (The MathWorks, Inc., Natick, MA, U.S.) for each of the response variables listed in Table A4 (Appendix A). Data was then transferred into R for all data analysis. Further information on how the data was analyzed and packages used within R can be found in the supplementary information.
2.3. Determining Model Parameters
Four different types of milk consumption events were modeled initially based on U.K. consumer habits and the WRAP Milk Model [24]. These include adding milk to coffee or tea, drinking a glass of milk, pouring milk into cereal, and using milk in cooking. Each type of consumption event is defined in the model using three parameters: consumption amount, average consumption frequency, and probability of consumption. Table A5 (Appendix A) lists the specific parameter values used for each person in a 1, 2 or 4-person household. Detailed data inputs for each consumption type are listed in Figure A1 (Appendix A).
During simulation, entities are randomly generated to represent each type of consumption event. The intergeneration time, or time between consecutive entities as described in Table A1 (Appendix A), is modeled with an exponential distribution function:
where χ is a uniformly distributed random number between 0 and 1. The variable μ is the average consumption period:
which uses the average times per day value specified for each consumption event, as outlined in Table A5 (Appendix A). After an event is generated, there is a probability associated with whether that specific event happens or not. Defined as:
Figure A2 (Appendix A) represents the “Drinking” block (“3” in Figure 4), which contains the “ConsumptionEvent” entity generator. Intergeneration time and probability of an event occurring, indicated in Equation (3), are executed within the “Drinking” block. Upon generation of a “ConsumptionEvent” entity, the model generates data with values that are specific to that entity (“consumption” event). These data, known as the entity’s attributes, include:
- Type—Number used to indicate the type of consumption event (1 = coffee/tea, 2 = drink, 3 = cereal, 4 = cooking)
- Amount—Number to indicate the amount of milk in mL to be consumed
- Path—Number used to route the entity through the model
Upon generation of a “ConsumptionEvent” entity, the model determines if that consumption event happens or not, which depends on a probability (Table A5—Appendix A). If the probability of consumption is met, then milk is consumed, and the entity’s Path attribute is set to 1, as shown in Figure A1. For example, if the probability of drinking milk is 35%, then 35% of the time milk will be drunk and 65% of the time the consumption event will be terminated. Inputs for the probability of consumption events happening are listed in Table A5—Appendix A.
Random numbers are used throughout the model to better represent the consumers’ behavior. Each person simulated must be different; this is achieved through randomness within consumption, waste generation, spoilage time, and purchasing of milk. Random numbers are generated based on initial random seed values (a seed represents a consumer). The values of the seed provide a set of numbers that are used by the Matlab® [26] algorithm (mt19937ar) to generate random numbers. When the seed is changed, the random numbers change as well. An indication of how the random numbers change from person to person is portrayed in Figure A3 (Appendix A); each color represents a different person. One seed value was assigned to each household type; therefore, there were 150 unique seed values used to represent each household.
2.4. Representing Different Household Types
Random numbers follow a uniform distribution after repeated sampling over an indefinite amount of time, but when looking at one instance in time the random values generated differ between one another. Thus, when seed values change between simulations, people with different habits are represented. Time between consumption events can be predicted based on the mean consumption events per day and the probability of them occurring as described in Equation (4), whereas average times and daily probabilities of events are defined in Table A5 (Appendix A).
The observed average time between consumption events is based on results from the model, which may differ from the predicted intergeneration time due to randomness. However, when simulating over a long period, the observed values will asymptote about the predicted average intergeneration time, calculated by Equation (4) and shown in Figure A4 (Appendix A).
Like consumption events, buying behavior is also based on a probability of buying a certain size of container. Households are assigned 1 of 3 container sizes: a quart, half gallon, and gallon based on a probability, as outlined in Table A6 (Appendix A). The frequency of buying from the grocery store in our model is set to every seven days but can be adjusted (Figure A1—Appendix A). Purchases from the top-up shop are only initiated, determined by a probability function, when there is not enough milk available in the refrigerator. For example, an individual can be assigned with a probability of 0.50, meaning that 50% of the time people will go top-up shopping to buy more milk when there is none available (Figure A1—Appendix A). Note that the amount of milk unavailable is recorded when the individual chooses not to go top-up shopping.
3. Results
Three common U.S. milk package sizes were modeled based on their percentage of market share (Table A7—Appendix A); quart, half gallon, and gallon containers (all made of high-density polyethylene—HDPE). Households of 1 person bought quart containers, while 2 and 4-person households purchased half gallon containers when top-up shopping for milk (Table A6—Appendix A). Milk spoilage was modeled based on three different shelf-lives—7, 14, and 21 days. Previous research indicates high temperature short time (HTST) pasteurized milk in the U.S. has a shelf-life between 17 and 21 days [27]. Milk waste from not finishing a bowl of cereal or a glass of milk was not included in this analysis as the amounts wasted were assumed to be insignificant compared to the waste generated from milk spoilage. Therefore, it is assumed that persons within a household consume all the milk that is poured from the container. In addition, waste due to consumer error, such as leaving milk out for too long or throwing away leftovers with milk in them were not included in the model. Analysis for this paper was mostly focused on a 14-d shelf-life to avoid overestimation of milk spoilage. Families modeled included 1 and 2-person non-family households, and 4-person family households (Table A5—Appendix A). The U.S. Census data indicates that 1 and 2-person non-family households make up most of the non-family household population, while 2, 3, and 4-person households make up most family households (Figure A5—Appendix A) [28]. For modeling purposes, it was assumed that 2-person households are comprised of 2 adults. Four-person households were assumed to have 2 adults and 2 children—child 1 was between 2–3 and child 2 was between 9–18 [29] (Table A5—Appendix A).
3.1. Understanding How Packaging Affects Milk Consumption and Spoilage
After simulating household consumption for 10,000 days (Figure A4—Appendix A), average yearly consumption was assessed to better understand how people consume based on different package sizes, shelf lives, and probability of top-up shopping. Figure 2 shows that spoilage increases with the purchase of more milk, as expected, while the amount of milk unavailable to the consumer decreases with the purchase of larger containers.
Secondly, model results indicate that as the probability of going top-up shopping trip increases, the amount of milk unavailable decreases, also as expected. A shelf-life of seven days was included to exemplify cases in which retailers discount milk at the end of its life. Consumers must then use the milk within seven days to avoid spoilage. Purchase of milk with a 7-day shelf life increases the amount of spoilage in 4-person households when they purchase a gallon container (Figure 2). If consumers want milk that will not spoil within the week, they should always purchase “fresher” containers (i.e., longer than a 7-d shelf-life). One and 4-person households were shown to be the best candidates for changes in purchasing behavior to avoid spoiled milk, as indicated by Figure 3.
When 1 and 4-person households purchase fewer smaller containers, their milk consumption does not decrease, but their spoilage decreases significantly. The amount of milk unavailable to the consumer decreases when the probability of going top-up shopping increases from 25% to 50%. Spoilage does not increase with increased top-up shopping trips since consumers are purchasing smaller containers when there is not milk available and it is likely consumed right away (Figure 3). Two-person households were not simulated for the purchase of 1 HG container as the amount unavailable would be too large. In the case of 4-person households, spoilage is not reduce when purchasing 4 HGs because it is too much milk for a family of 4.
3.2. Greenhouse Gas Emissions of Milk Consumption, Packaging, and Spoilage
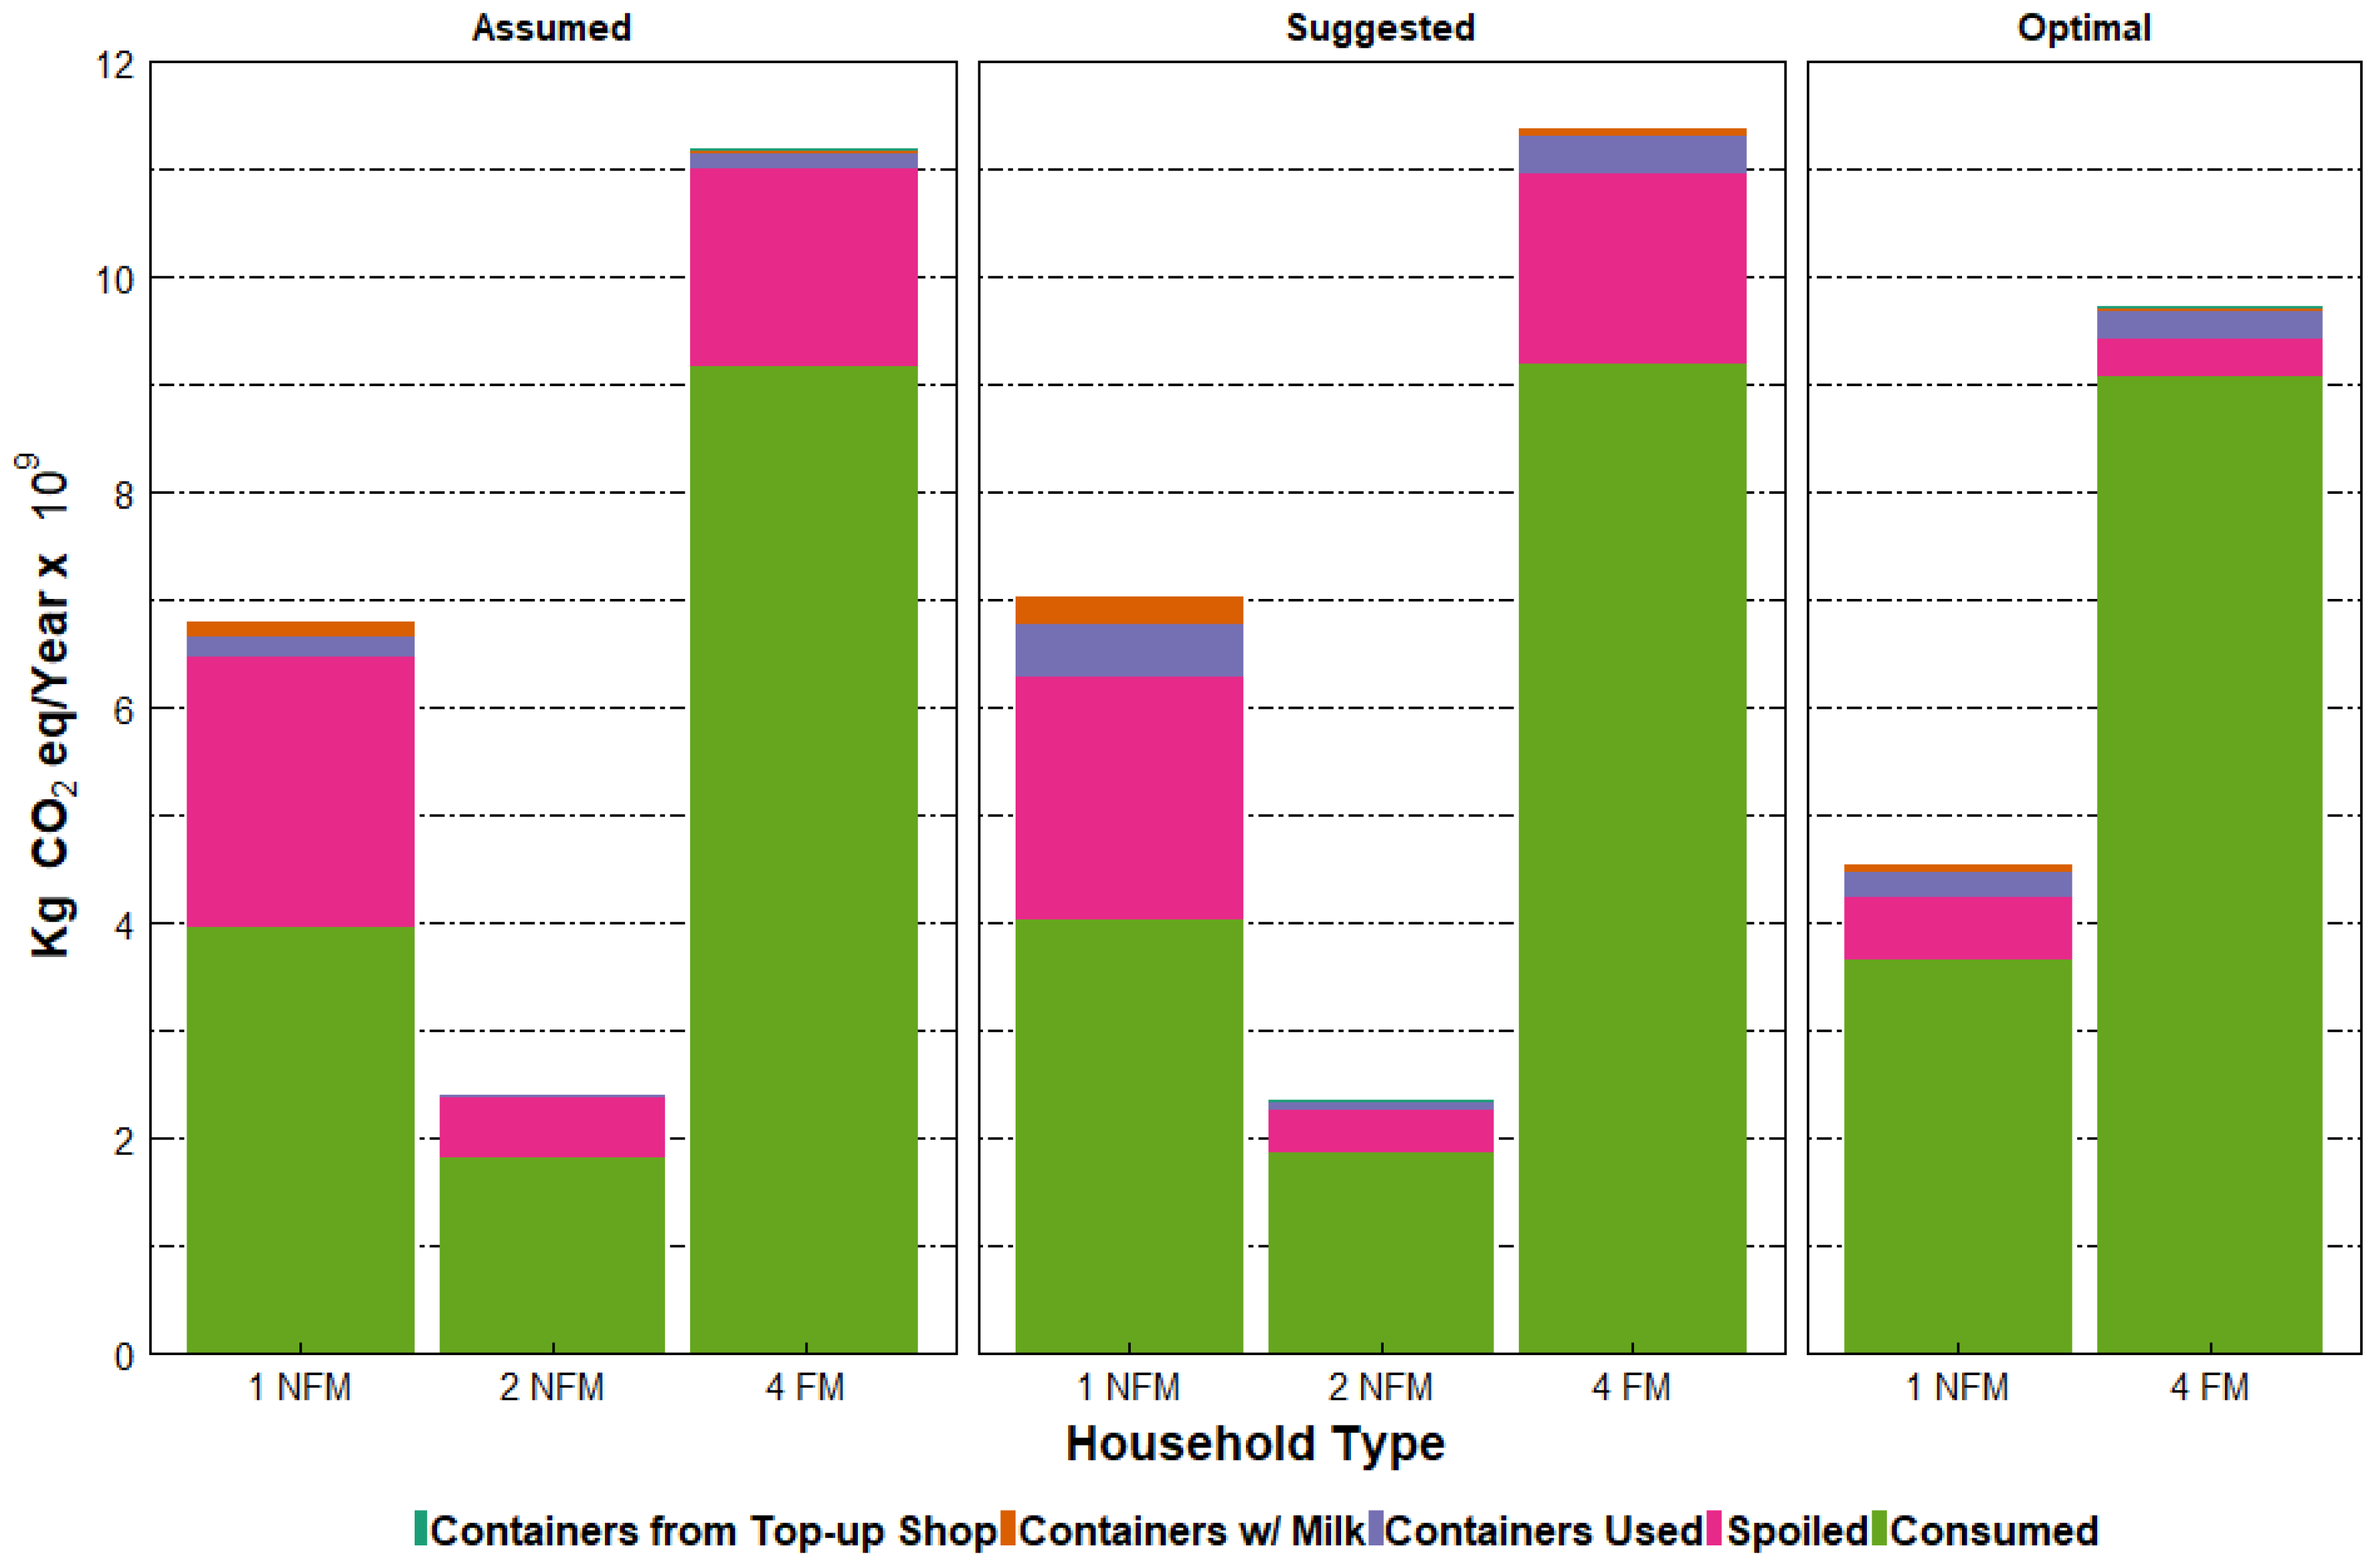
The U.S. Census estimations for 1 (32 million) and 2-person (6 million) non-family households and 4-person (15 million) family households were used to assess climate change impacts for three different package delivery systems [28]. Packaging impacts were based on the GHG emissions estimated previously for HDPE containers in the U.S. [30]; it is assumed that these households are only purchasing containers of this type. HDPE gallon and half-gallon milk containers were targeted, as they make up the largest market share 65% and 10% of total milk sales, respectively (Table A7—Appendix A). Analysis of container purchases was differentiated into three different categories: Containers used from regular shopping trips, containers purchased during top-up shopping, and containers thrown away with spoiled milk. Packaging waste was then totaled for a year representing the total GHG emissions for both consumed and spoiled milk and their disposed containers. Detailed information about how GHG emissions were calculated for 1 and 2-person non-family households and 4-person family households is provided in the supplementary information. Figure 3 shows that packaging is the smallest contributor to total GHG emissions, as previously identified by others [7,15,19].
Packaging accounts for no more than 5% of the total GHGs. Our work reinforces why the focus should be on reducing the total amount of food waste rather than only minimizing packaging waste. Furthermore, model results provided in Figure 3 indicate that consumers purchase more milk than they consume when opting for larger package sizes. Figure 4 indicates that when 1-person households purchased a quart of milk, rather than 2 quarts of milk, their total GHG emissions decreased by 33%. In contrast, purchasing 2 quarts, rather than 1 half gallon, produced a larger impact due to increased packaging, and minimal reduction in milk spoilage. When looking at the amount of milk spoiled between these three scenarios, decreasing the amount of milk purchased significantly reduced spoilage without a considerable increase in the amount of milk unavailable (See Figure 3); thus, the GHG emissions from a 1-person household can be decreased with increased top-up shopping trips. GHG emissions associated with increased transportation were not included in this analysis since top-up shopping can easily be done during other needed trips, such as returning from work. The trend for milk waste optimization in family households of 4 was similar to 1-person households. When purchasing 2 gallons or 4 half gallons of milk, spoilage was approximately the same. In contrast, when 4-person households purchased 3 half gallon containers, their total spoilage decreased significantly, thus decreasing their total GHG emissions without increasing the amount of unavailable milk (see Figure 2). For 1-person non-family households and 4-person family households, spoilage reductions were large enough to justify the purchase of less milk in smaller containers [8]. Model results indicate that consumers are purchasing too much milk, leading to overconsumption [9]. Non-family households of 2 use most of the milk that is available to them regardless of the container size, but when purchasing 2 half-gallons, the extension of shelf-life leads to decreased spoilage due to increased time for milk consumption.
4. Discussion
Modeling consumers can be difficult due to the many variables that affect how people consume food—for example, cooking at home vs eating out, number and age of children, and food preferences. Therefore, it is necessary to determine which of these parameters are most likely to decrease waste by selecting different combinations of the parameters as shown with the DES model and similar work done with “fuzzy” modeling [31]. Fuzzy cognitive mapping (FCM) can be used to map the relationships among different variables and identify how they affect a specific problem. Researchers can simulate different policy conditions by changing values of the policy variables to identify whether they will influence FWG [25]. Although this method is useful for understanding large scale policy effects, it does not provide valuable information for how consumers can change their purchasing/consumption behavior on a household level. Machine learning algorithms, such as the “Boruta” algorithm, have been used on U.K. consumer food waste data to assess which variables affect household FWG the most [27]. This algorithm was run until all considered variables were confirmed/rejected [29]. Of the fifty variables analyzed, only six were chosen in the final model: Fussy eaters, employment status, household size, local authority, home ownership status, and age. Household size was found to be the most important explanatory variable of household FWG [27]. Households are composed of a variable number of people, ages and socioeconomic classes, which are important to consider when modeling consumer behavior. Although these modeling methods identify explanatory variables that affect FWG, they do not provide valuable information on what individual households can do to reduce their waste generation and GHG emissions.
DES was chosen in this work to model consumers’ consumption based on its extensive use in the health-care industry for assessing resource needs and allocation [32]. Like patients needing treatment in a health-care institution at a random moments in time, consumption events are sometimes planned, triggering an event, but not always. Therefore, consumption events are recorded during simulation when they happen at random moments. Household variables—like consumption averages or container sizes—can be modified to answer ‘what if’ questions, for example, how does packaging affect the consumption and spoilage in different household types.
Although previous research claimed that consumers perceive themselves as knowledgeable and engaged about food waste, the DES model indicates that current consumption behavior can be changed to significantly reduce food waste [12]. Evidence from the model suggests that people should make time for top-up shopping trips to pick up milk if needed, rather than purchase milk in bulk on weekly shopping trips to avoid large spoilage amounts —similar results were found for the U.K. population [19]. Other research has also indicated that shopping and planning routines are two of the most important factors in food waste reduction [26] while the EPA and WRAP determined that increased shopping trips lead to less waste [27,28]. In addition, if consumers are informed about what package size they should purchase for their household type, they can avoid guilt associated with throwing food away [27]. Results from this study suggest that packaging has a small impact, 5%, on the total GHG of a milk-packaging system. If consumers are willing to have better milk inventory management and make more top-up shopping trips for milk when they run out, then they will likely decrease their total milk waste and GHG emissions for milk consumption. The DES model suggests that changes in packaging size, shelf-life, and purchasing behavior of milk resulted in predictions of decreased household milk spoilage and GHG emissions, while maintaining levels of recommended milk consumption. Large grocery retailers should consider stocking and discounting smaller package sizes, to entice consumers to purchase smaller quantities of milk, as indicated by previous survey results [13,33]. If consumer fluid milk demand decreases, milk producers could divert fluid milk towards value added products, like cheese and yogurt, which have seen increased demand in the last decade [18].
5. Conclusions
Packaging has been placed under the spotlight recently due to environmental concerns, but the whole food-packaging system must be fully understood to reduce the environmental emissions of a food product [7,19]. This model was created as a tool for simulating household food consumption behavior for milk and can be extended to other food products. To the best of the authors’ knowledge, DES provides one of the best methods for modeling consumers household consumption habits. Ultimately, a household’s food consumption could be modeled to optimize packaging, food waste, and environmental emissions from consumption. Evidence from DES modeling could then be used to suggest and to educate consumers on what package sizes they should purchase based on their household type [34]. The simulations presented here and in previous work provide a framework for future researchers to extrapolate how changes in consumption and purchasing behavior affect expenditure on food, nutritional requirements, and a household’s total environmental footprint. This tool provides researchers with the ability to model other common household foods with a high environmental impact and a short shelf, such as meat products. DES modeling provides researchers with a full life cycle perspective of a product, including packaging, and consumer scenarios giving a more holistic approach to understanding food waste generation within the home. Although this model does not provide verified food consumption and waste data, it does provide estimates of where large portions of waste generation are coming from, which can be validated with established collected data such as national databases -- NHANES. This allows researchers to simulate different scenarios before performing field experiments, saving both time and resources. In addition, this model pays special attention to packaging and behavior, which have often been ignored in other environmental food studies.
Supplementary Materials
The following are available online at https://www.mdpi.com/2071-1050/11/7/2152/s1.
Author Contributions
Conceptualization, S.K.S. and R.A.; methodology, S.K.S. and S.S; software, S.K.S.; validation, S.K.S., R.A. and S.S.; formal analysis, S.K.S.; investigation, S.K.S and R.A.; resources, S.K.S.; data curation, S.K.S.; writing—original draft preparation, S.K.S.; writing—review and editing, S.K.S. and R.A.; visualization, S.K.S.; supervision, R.A.; project administration, R.A.; funding acquisition, R.A.
Funding
S.K.S. received a fellowship for undergraduate research from the School of Packaging.
Acknowledgments
The authors acknowledge Brian Neiswander (Mathworks®) for assistance with creating the model using Simevents® and Matlab®, and the School of Packaging for providing funding through the Undergraduate Research Program. The MSU High Performance computing facility at iCER made simulations possible. Authors would like to thank The Waste and Resources Action Programme of the U.K. (WRAP) for providing initial modeling material. R.A. thanks the USDA R Auras Hatch Project.
Conflicts of Interest
The authors declare no conflict of interest.
Appendix A

Table A1.
Common definitions used in discrete event simulation language (DES). Definitions were taken from MathWorks® documentation on DES.
Table A1.
Common definitions used in discrete event simulation language (DES). Definitions were taken from MathWorks® documentation on DES.
| Terms | Definitions |
|---|---|
| Event | An observation of an instantaneous incident that may change a state variable, an output, and/or the occurrence of other events. Events can correspond to changes in the state of an entity. |
| Entity | Pass through a network of queues, servers, gates, and switches during a simulation. Entities can carry data, known in SimEvents software as attributes. |
| Intergeneration times for entities | The intergeneration time is the time interval between successive entities that the block generates. You can have a generation process that is: periodic, sampled from a random distribution, and from custom code. |
| Seed | Value used by the random number generator to generate random numbers within the model. |
Table A2.
SimEvents® blocks used to develop the model. Definitions for block functions were taken from MathWorks® documentation. Each block is used within the model to represent the consumption of milk within a consumer home.
Table A2.
SimEvents® blocks used to develop the model. Definitions for block functions were taken from MathWorks® documentation. Each block is used within the model to represent the consumption of milk within a consumer home.
| Symbol | Definition |
|---|---|
 Entity Generator | Generate entities using intergeneration times from dialog or upon arrival of events. |
 Entity Server | Serve multiple entities independently for a period and then attempt to output each entity through the output port. If the output port is blocked, the pending entity stays in this block until the port becomes unblocked. You can specify the service time, which is the duration of service. |
 Entity Terminator | Accept and destroy entities. |
 Entity Queue | Store entities in a queue. The entity at the head of the queue departs when the downstream block is ready to accept it. You can specify the queue capacity and queuing policy. |
 Entity Output Switch | Route entities to 1 of the multiple output ports. The port selected for departures can change during the simulation. |
 Entity Input Switch | Allows for arrival of multiple entities at its ports. Outputs 1 entity at a time. The selected entity input port can change during the simulation. |
 Entity Gate | Controls the flow of entities by opening and closing a gate. Allows 1 entity to advance for each message that arrives on the control port. |
 Out 1 | Provide an output port for a subsystem or model. |
 In 1 | Provide an input port for a subsystem or model. |
Table A3.
Entities are assigned values for the following attributes.
| Attributes | Definition |
|---|---|
| ContainerID | Unique identification number assigned to each container |
| ContainerVolume | Number indicating the amount of milk the container can hold in mL |
| MilkVolume | Number indicating the amount of milk in the container in mL |
| UseBy | Number indicating the use-by date |
| IsOpen | Number used to indicate of the container has been opened (0 = unopened, 1 = opened) |
| MilkVolume | Number indicating the amount of milk in the container in mL |
| Path | Number used to route the entity through the model |
Table A4.
Parameters inputted into the model for all household types. Response variables indicate the data was outputted from the model. Each of the response variables were assigned with values in accordance with the time that they occurred.
Table A4.
Parameters inputted into the model for all household types. Response variables indicate the data was outputted from the model. Each of the response variables were assigned with values in accordance with the time that they occurred.
| Parameters | Shelf Life* in Days (7, 14, 21) | Probability of Going to Market (0.25, 0.5, 1) | Size of Container (Quart, Half Gallon, Gallon) | Number of Containers (1, 2, 3) | |
|---|---|---|---|---|---|
| Response Variables | Amount Unavailable | Amount Available | Amount Requested | Amount Consumed | Containers Available |
| Milk from Grocery store | Milk from Market | Amount Spoiled | Amount Wasted | ||
Table A5.
Parameters used to model adults older than 19, children between 2 and 3, and children between 9 and 18. “TD” defines the amount of times per day that the consumption event happens. “Pr” is the probability of consumption for each consumption type. “Amount” specifies the amount of milk consumed on average during each consumption event.
| Child 2–3 | Child 9–18 | Adult 19+ | |||||||
|---|---|---|---|---|---|---|---|---|---|
| TD | Pr (%) | Amount (mL) | TD | Pr (%) | Amount (mL) | TD | Pr (%) | Amount (mL) | |
| Coffee/Tea | 0 | 0 | 0 | 0 | 0 | 0 | 2 | 50 | 20 |
| Drinking | 3 | 50 | 250 | 2 | 35 | 250 | 1 | 35 | 200 |
| Cereal | 1 | 50 | 300 | 1 | 50 | 300 | 1 | 50 | 200 |
| Cooking | 1 | 15 | 300 | 1 | 15 | 300 | 1 | 15 | 600 |
Figure A1.
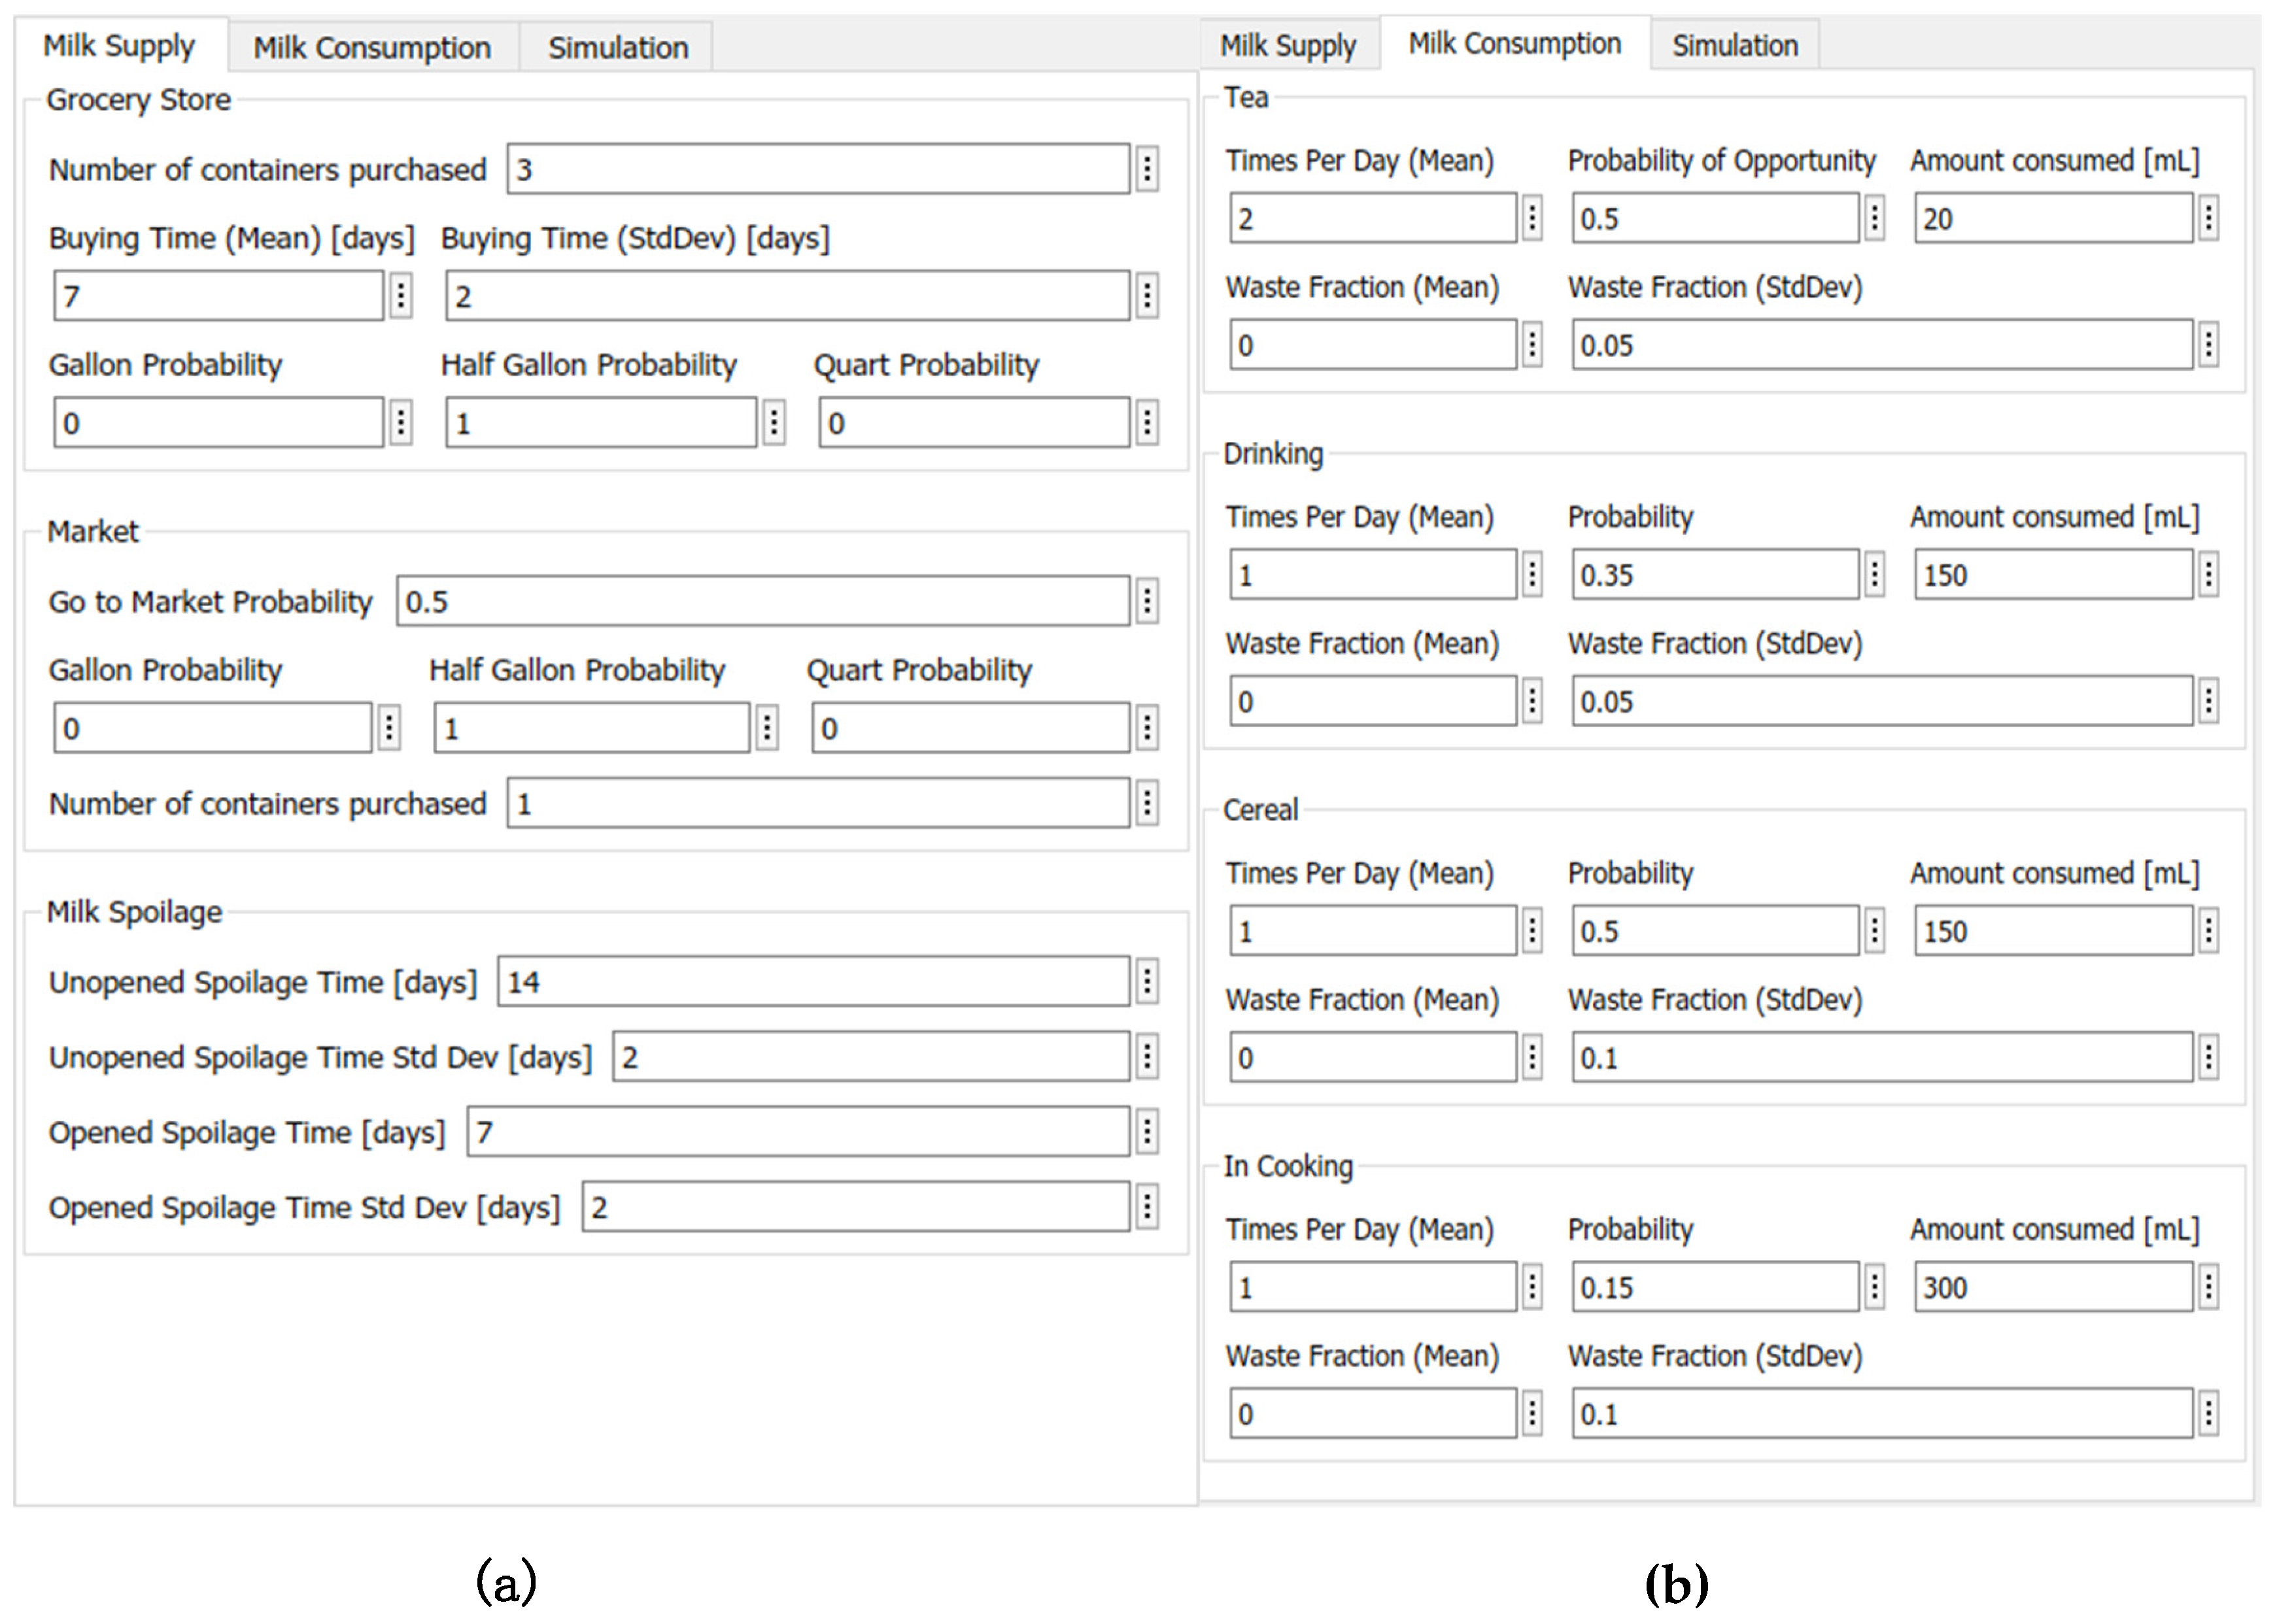
Model inputs dialog boxes. Parameters in the DES model are entered into each of the boxes listed above. Purchasing behavior for grocery stores and top-up shops is specified on the left (a). In addition, spoilage is specified on the bottom left (a). Values for consumption can be specified within the Tea, Drinking, Cereal and In Cooking tabs (b). The box on the right represents the consumption parameters for 1 adult over the age of 18.
Figure A1.
Model inputs dialog boxes. Parameters in the DES model are entered into each of the boxes listed above. Purchasing behavior for grocery stores and top-up shops is specified on the left (a). In addition, spoilage is specified on the bottom left (a). Values for consumption can be specified within the Tea, Drinking, Cereal and In Cooking tabs (b). The box on the right represents the consumption parameters for 1 adult over the age of 18.

Figure A2.
Output from Simevents® representing how drinking events are generated. Within the “Drinking” Block there is a subsystem. The subsystem consists of an entity generator, a gate and a broadcasting signal blocks. Consumption entities that occur travel through path 1 of the gate to the consumption broadcasting signal.
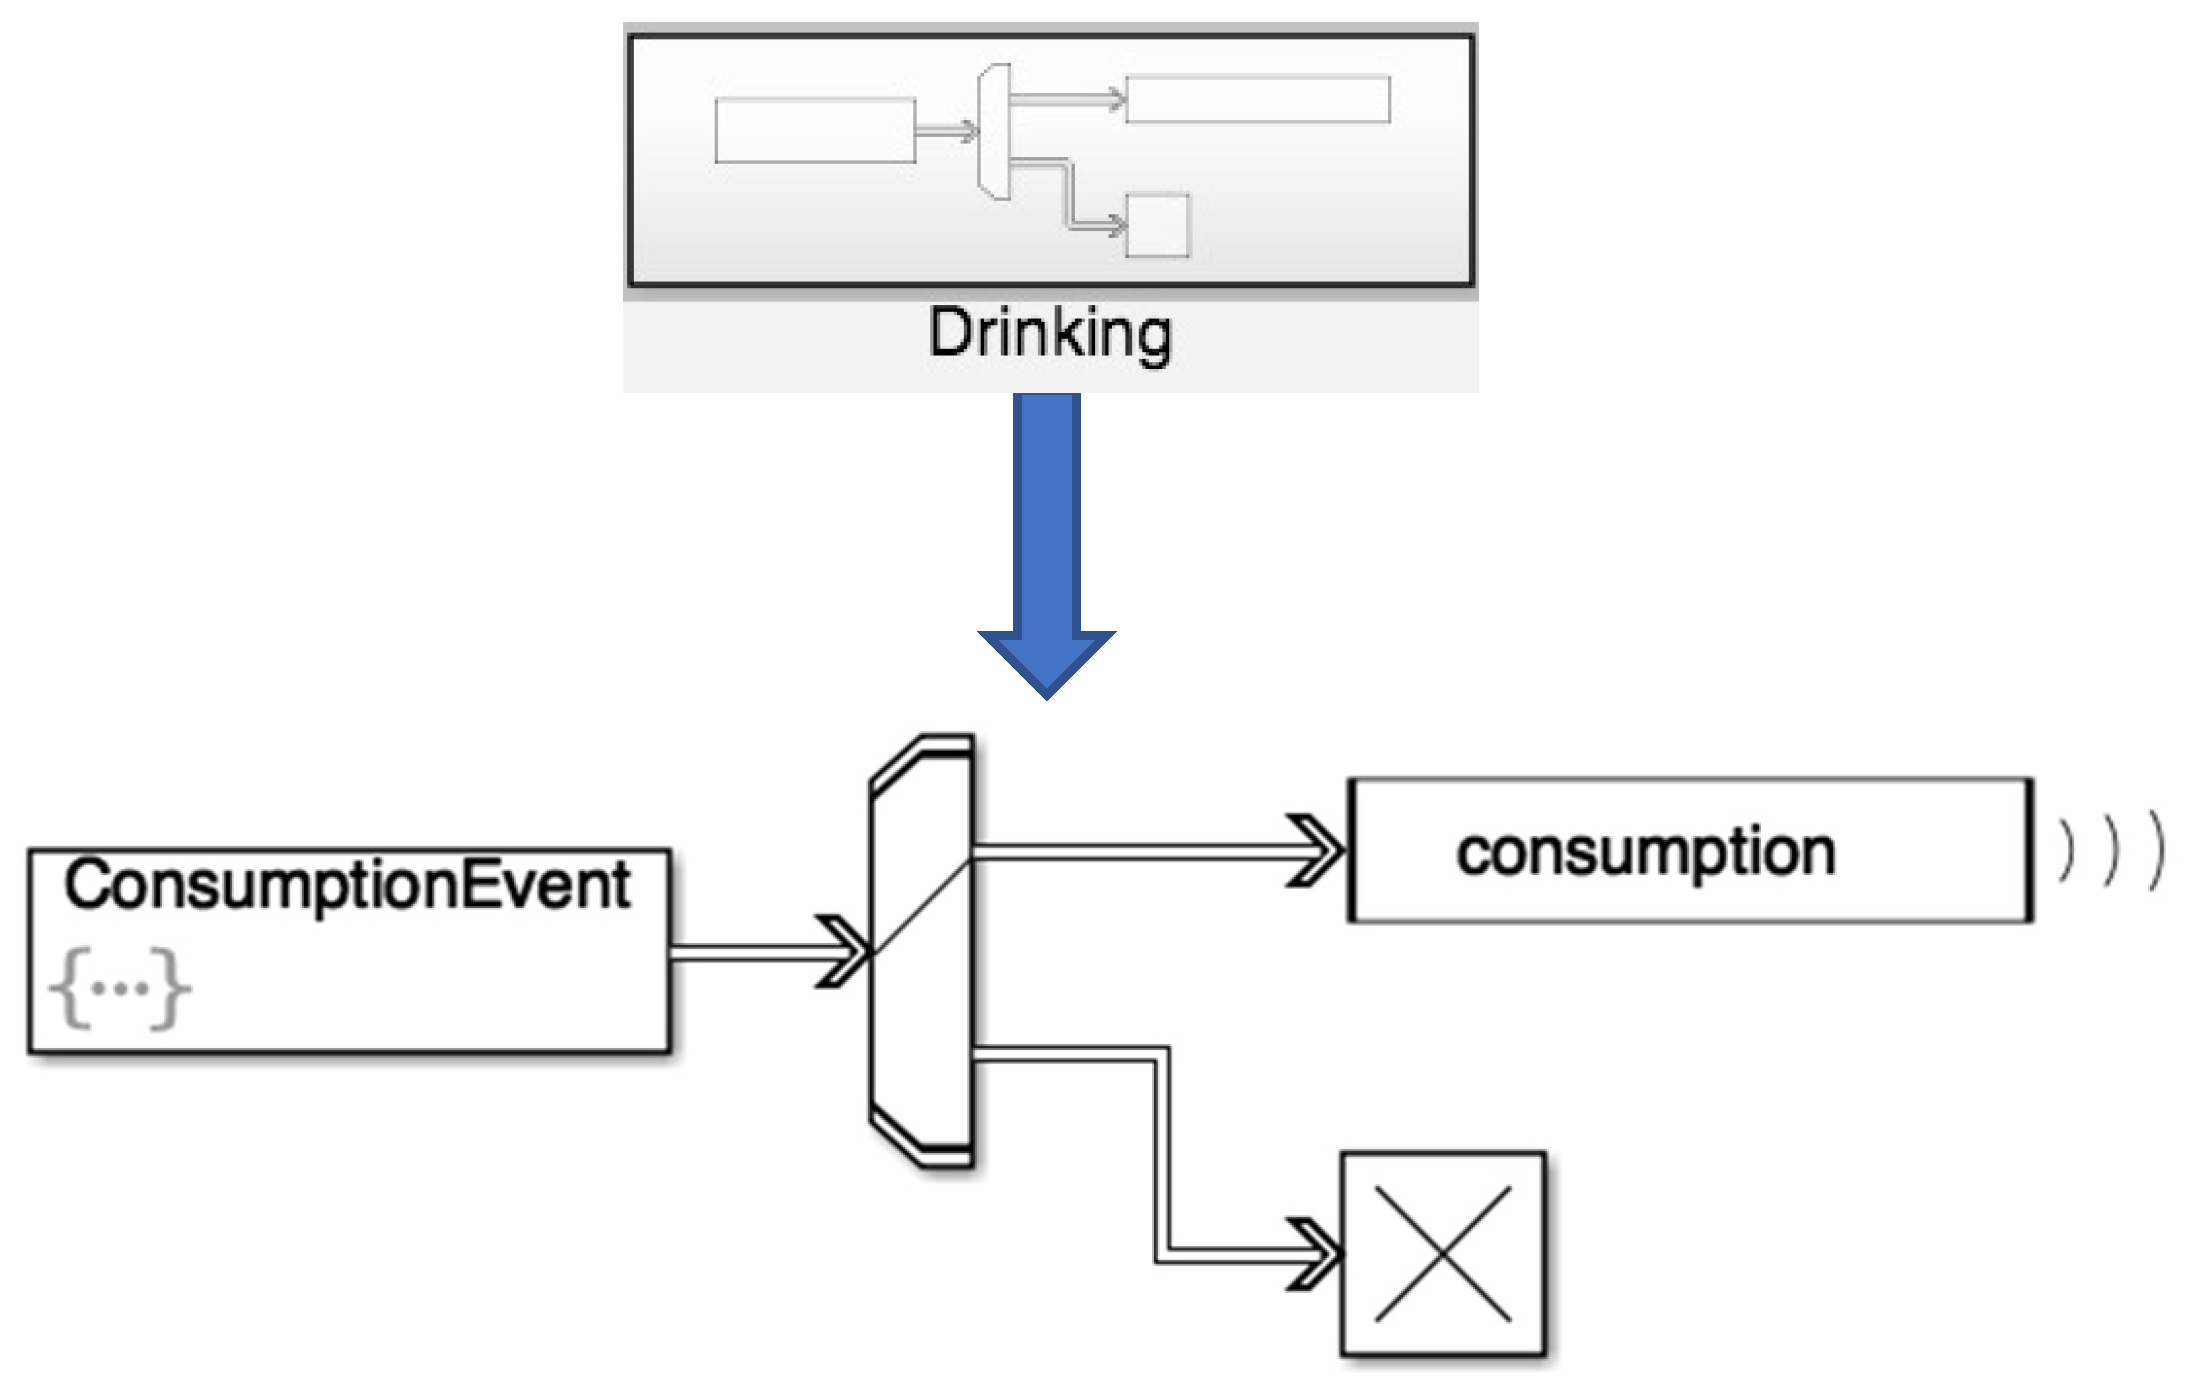
Figure A3.
Indication of random generation used to represent different household types. Random numbers were logged for the “Drinking Milk” consumption event. When the seed values were changed, the random numbers generated also changed. Frequency of use indicates how many times the random number was used in the model over the simulated time of 10,000 days.
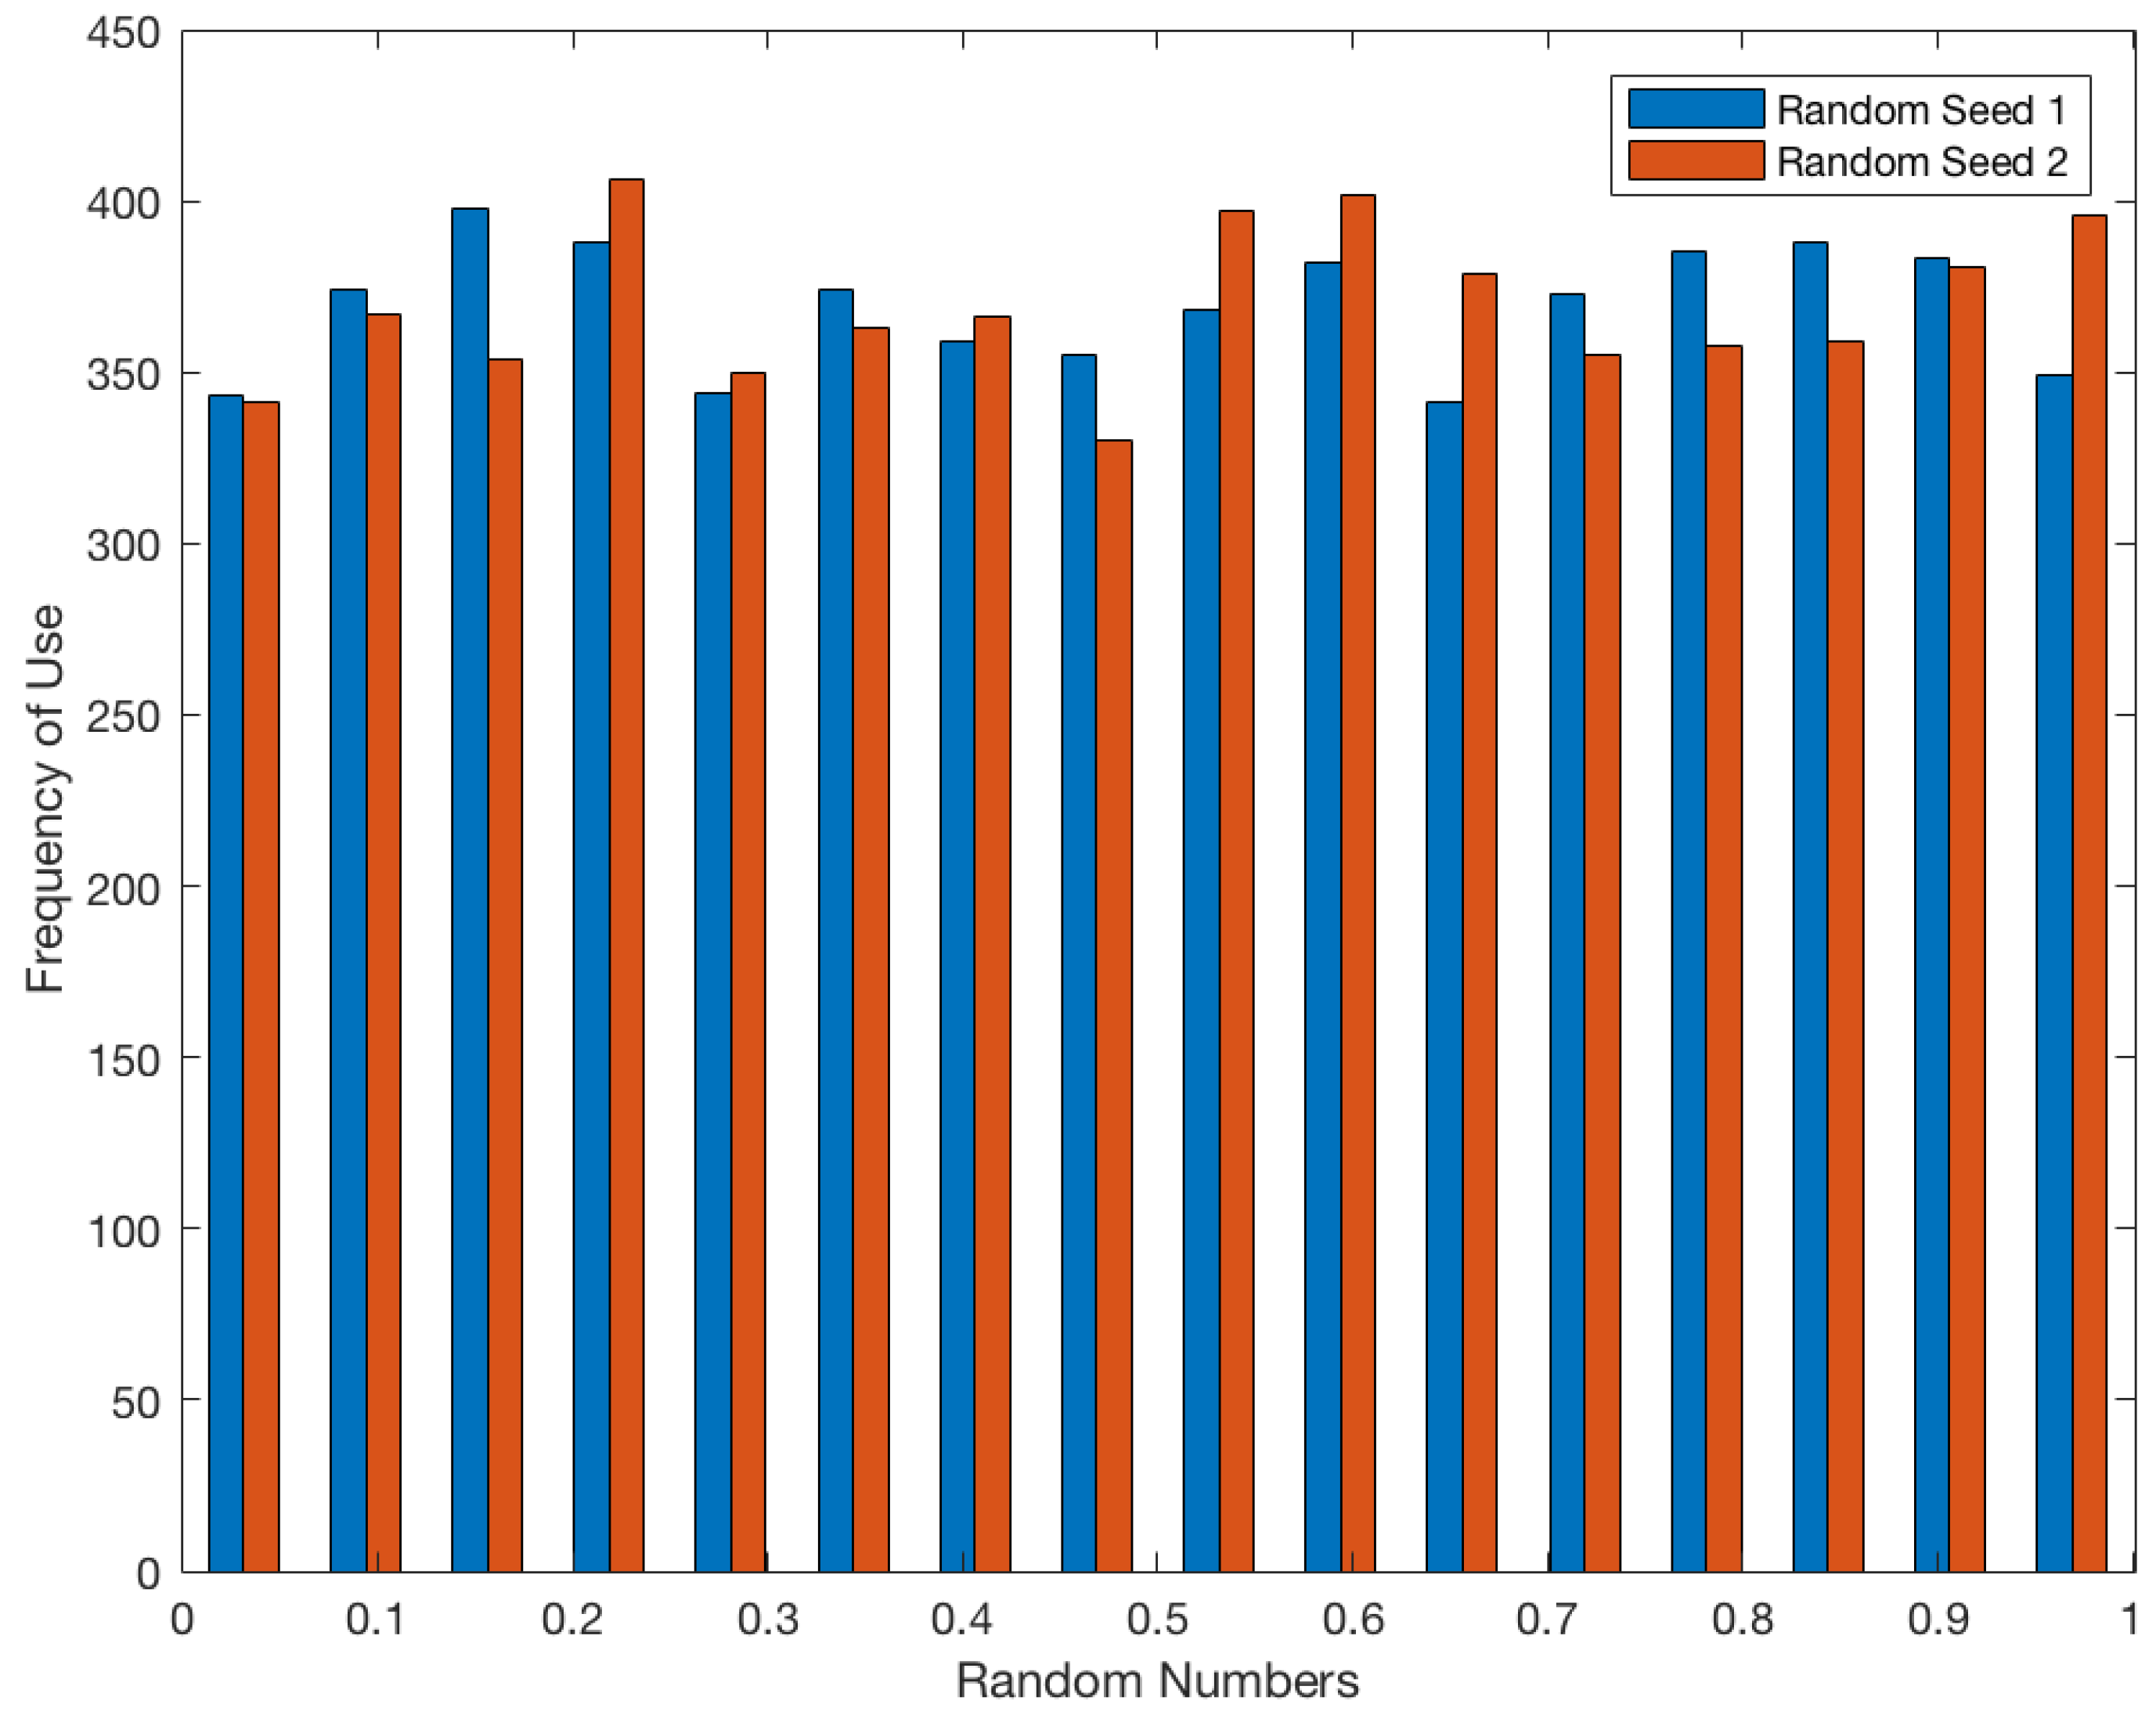
Figure A4.
Indication of variability generated by the model. Average spoilage from 50 1-person households was plotted over 10,000 days to understand model variability. The legend, “randseed”, represents the different seed values that were used on a gradient scale. Values of average spoilage converge at around 10,000 days.
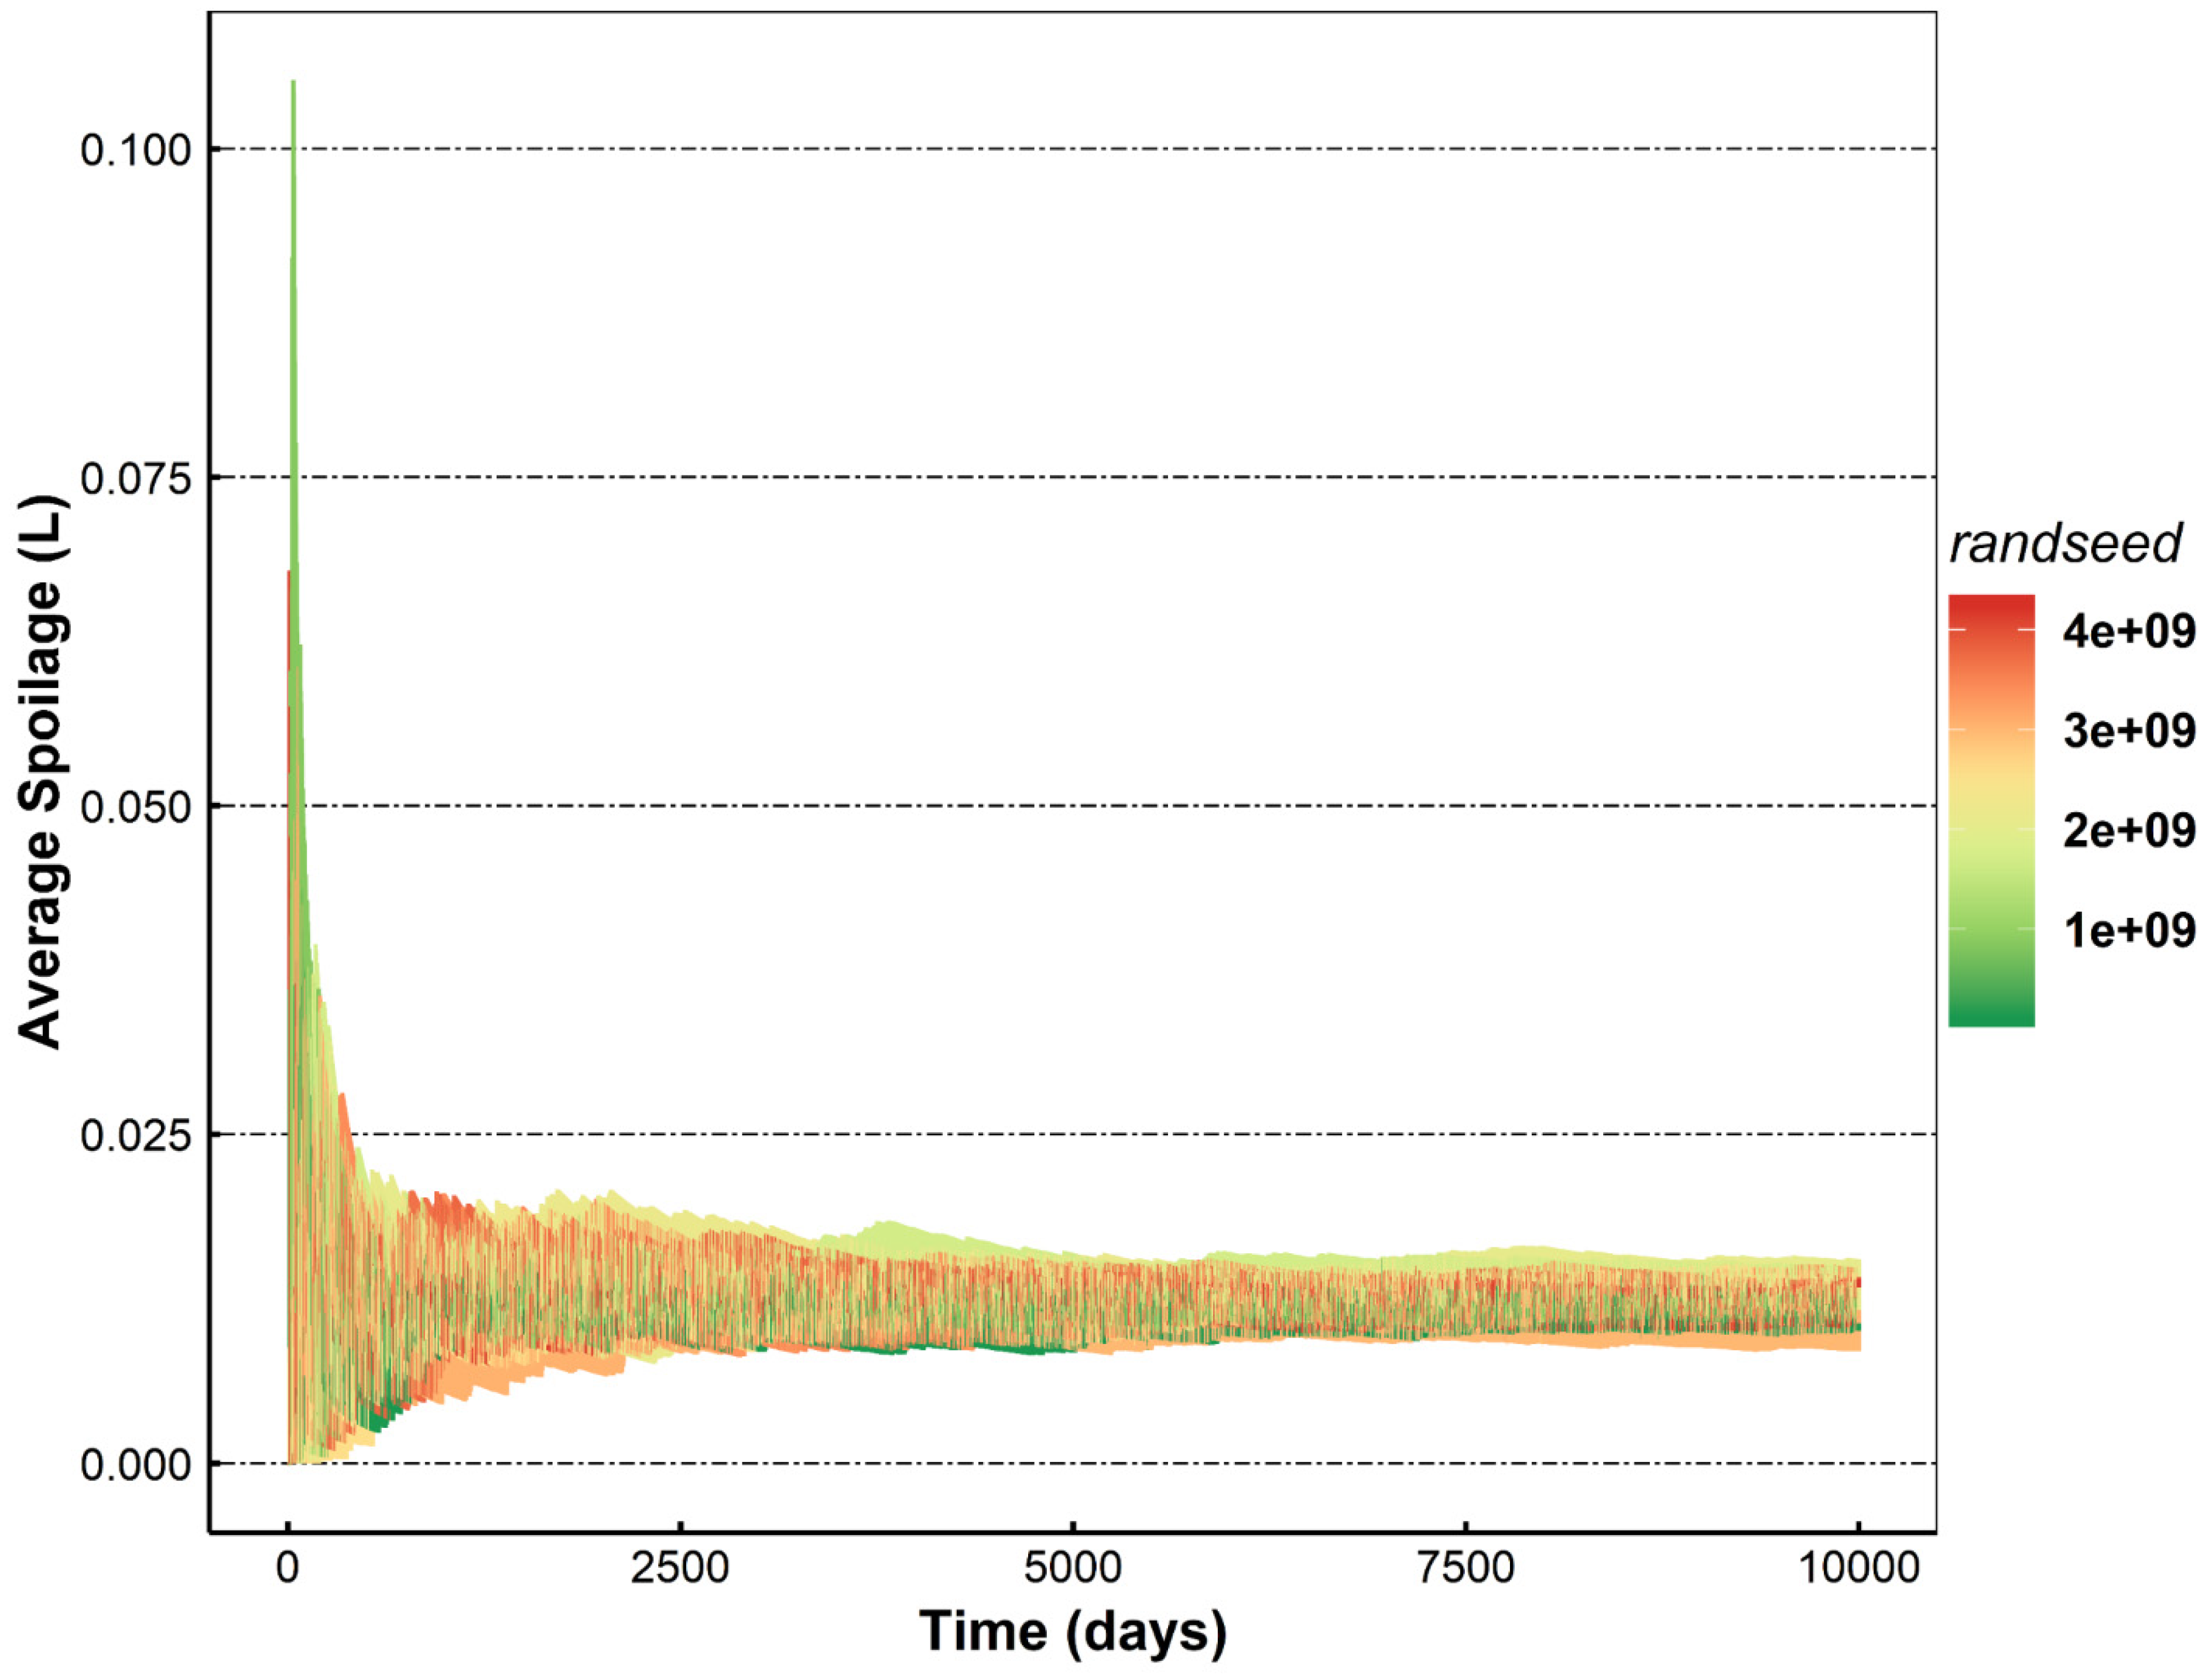
Table A6.
Probability of buying a certain container type. Probabilities can be adjusted within model to simulate different scenarios. “1P” (1-person non-family), “2P” (2-person non-family), and “4P” (4-person family) households are depicted with the probability of purchasing a container at a grocery store, versus at a top-up shop.
| Container Type | Probability of Purchase at Grocery Store (%) | Probability of Purchase at Top-up Shop (%) | ||||
|---|---|---|---|---|---|---|
| Household Type | 1P | 2P | 4P | 1P | 2P | 4P |
| Half Gallon | 0 | 100 | 0 | 0 | 100 | 100 |
| Gallon | 0 | 0 | 100 | 0 | 0 | 0 |
| Quart | 100 | 0 | 0 | 100 | 0 | 0 |
Table A7.
Market share data for 1 gallon and half gallon containers [33].
Table A7.
Market share data for 1 gallon and half gallon containers [33].
| Container Type | Market Share (%) |
|---|---|
| Monolayer HDPE chilled 1 gallon | 65 |
| Monolayer HDPE chilled 1/2 gallon | 10 |
| Gable Top carton chilled 1/2 gallon | 8 |
| Monolayer HDPE chilled quart | 1.5 |
| Others * | 15.5 |
* Note: Others includes stackable HDPE, aseptic bricks, PET, pillow pouches, smaller sizes of gable top cartons, and multilayer HDPE containers.
Figure A5.
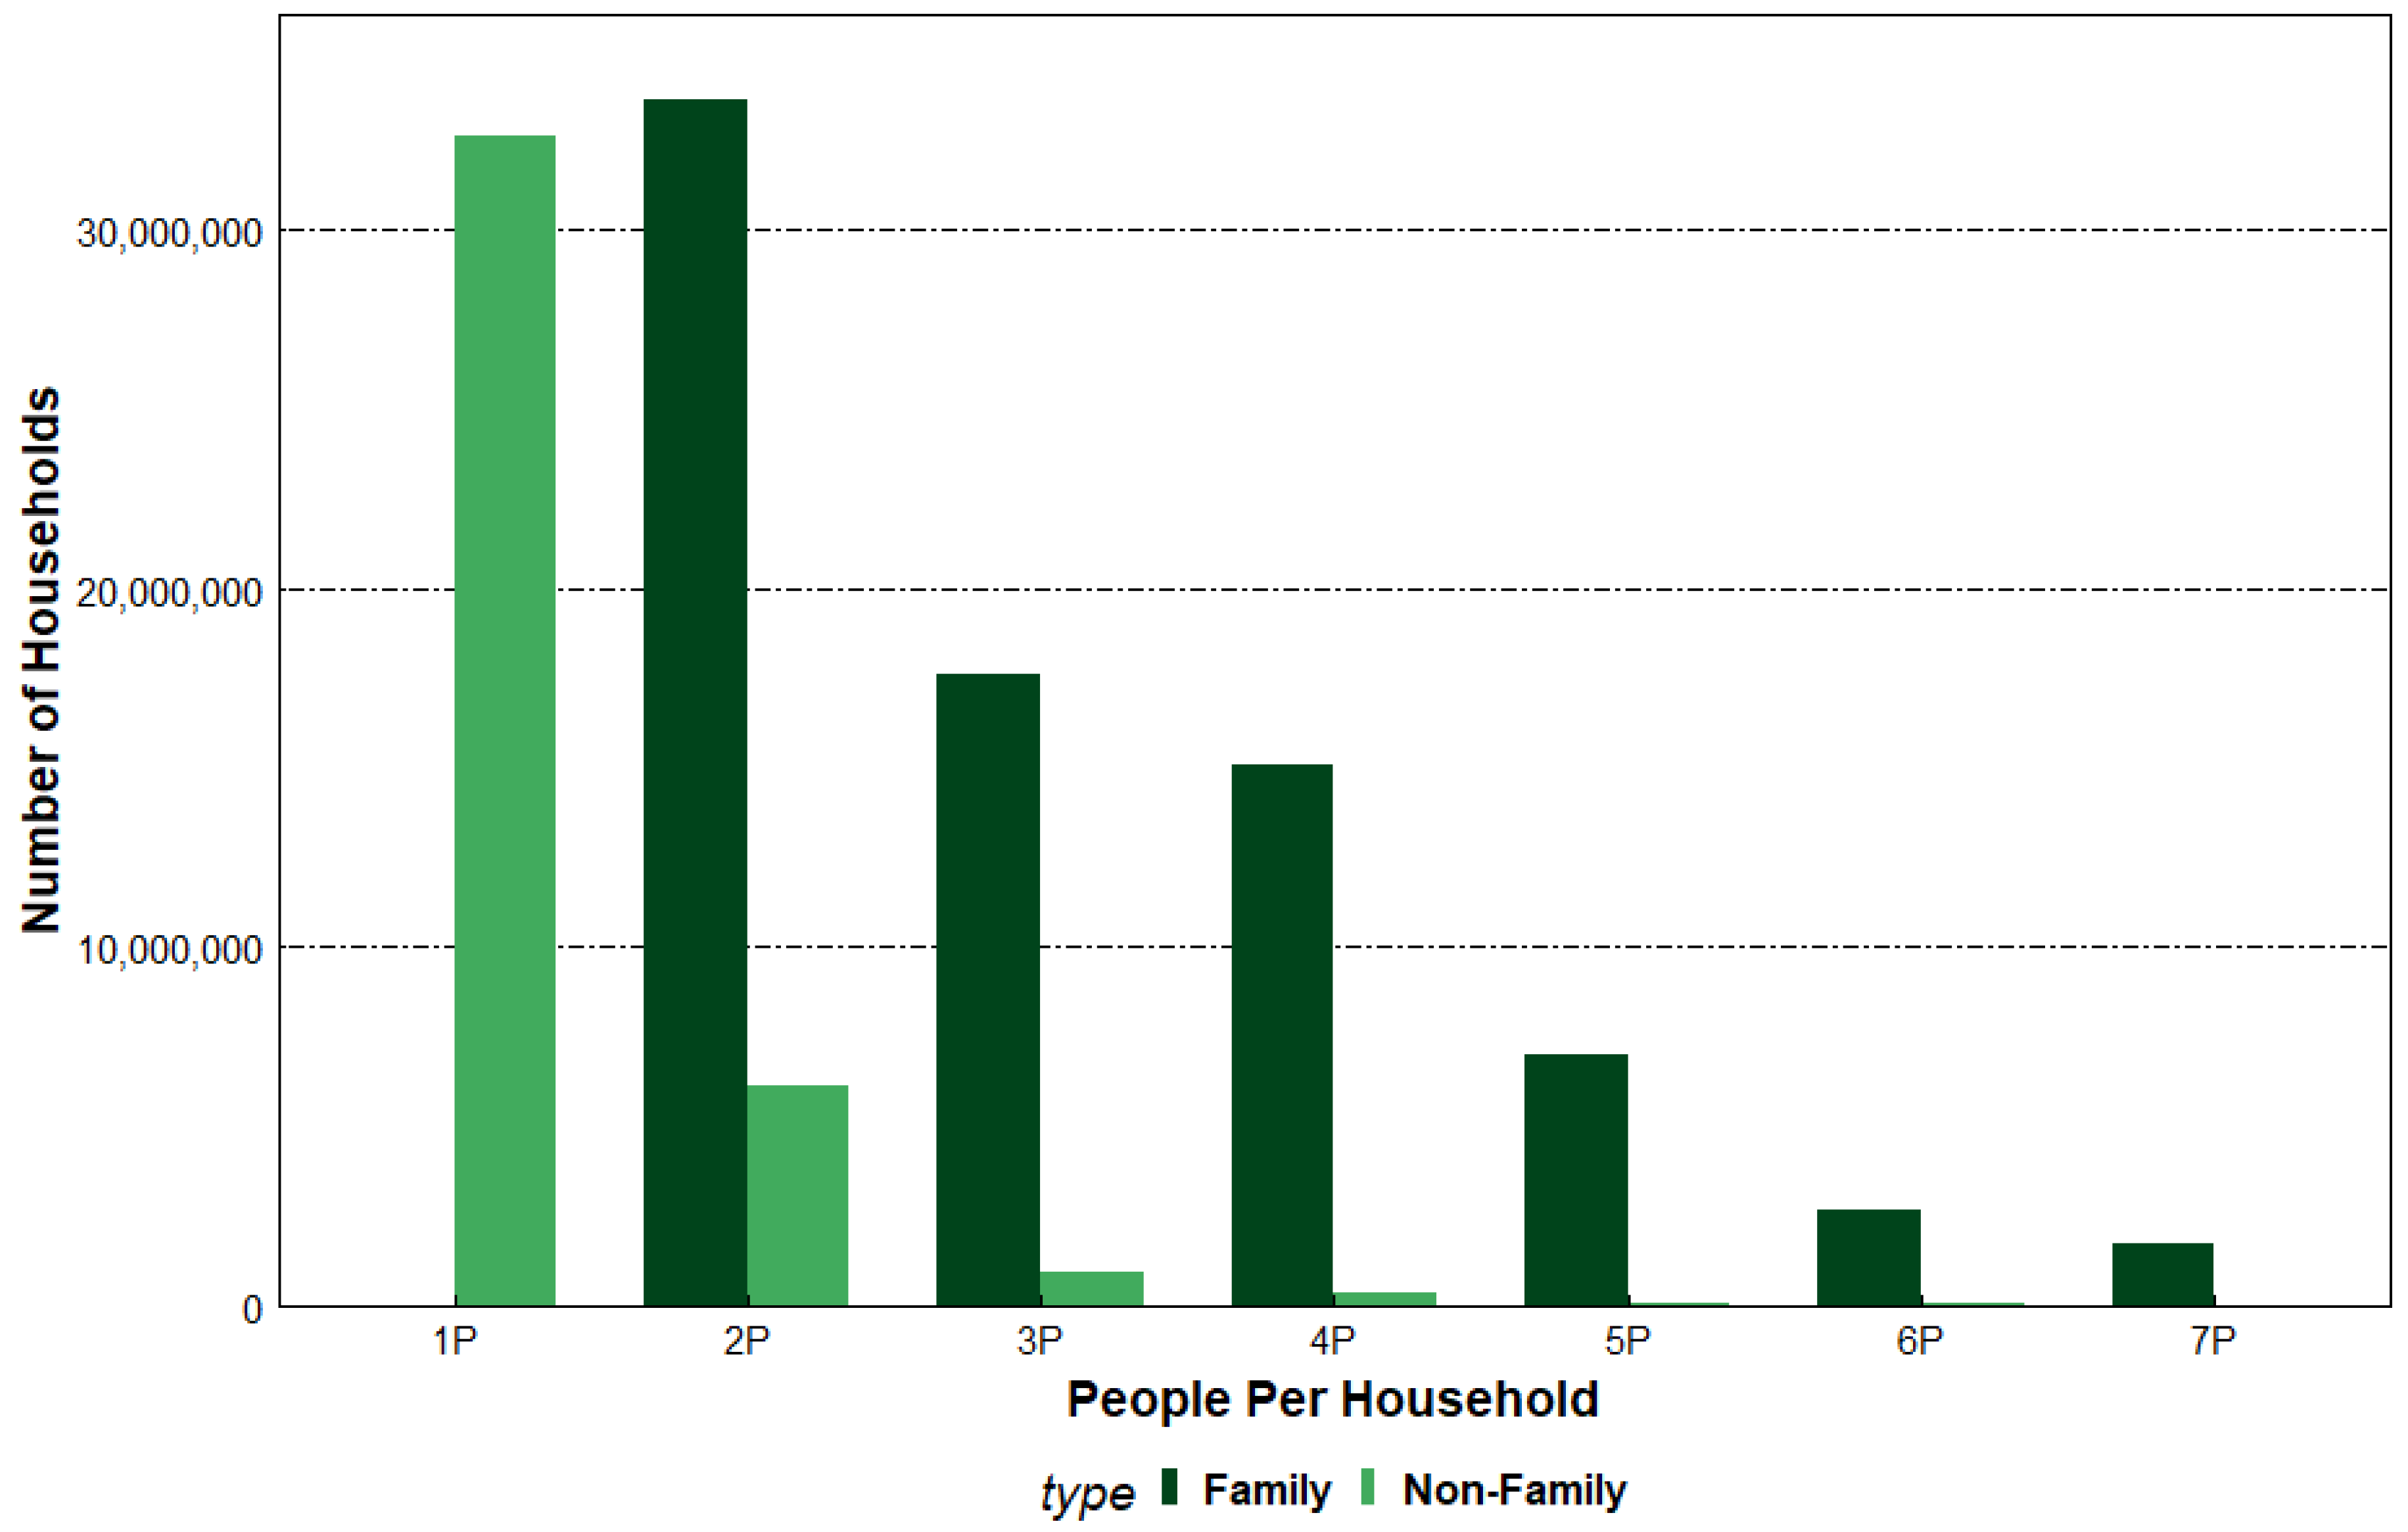
U.S. Census Bureau data for family (dark green) and non-family households (light green), data obtained from the American Community Survey by the U.S. Census Bureau [28].
Figure A5.
U.S. Census Bureau data for family (dark green) and non-family households (light green), data obtained from the American Community Survey by the U.S. Census Bureau [28].

References
- Gustavsson, J.; Cederberg, C.; Sonesson, U.; Meybeck, A.; van Otterdijk, R. Global Food Losses and Food Waste; Food and Agriculture Organization of the United Nations: Rome, Italy, 2011. [Google Scholar]
- Mandyck, J.M.; Schultz, E.B. Food Foolish: The Hidden Connection Between Food Waste, Hunger and Climate Change, 1st ed.; Carrier Corp: Farmington, CT, USA, 2015; ISBN 0692456325. [Google Scholar]
- Buzby, J.C.; Hyman, J. Total and per capita value of food loss in the United States. Food Policy 2012, 37, 561–570. [Google Scholar] [CrossRef]
- Bigelow, P.D.; Borchers, A. Major Uses of Land in the United States. 2017. Available online: https://naldc.nal.usda.gov/download/CAT93502180/PDF (accessed on 9 April 2019).
- Toth, J.D.; Dou, Z. Wasted Food, Wasted Resources: Land, Irrigation Water, and Nutrients Associated with Food Wastage in the U.S. In Food Waste Across the Supply Chain: A US Perspective On a Global Problem; Dou, Z., Ferguson, J.D., Galligan, D.T., Kelly, A.M., Finn, S.M., Giegengack, R., Eds.; Council for Agricultural Science and Technology: Ames, IA, USA, 2016; pp. 57–71. ISBN 978-1532835070. [Google Scholar]
- Clune, S.; Crossin, E.; Verghese, K. Systematic review of greenhouse gas emissions for different fresh food categories. J. Clean. Prod. 2017, 140, 766–783. [Google Scholar] [CrossRef] [Green Version]
- Williams, H.; Wikström, F. Environmental impact of packaging and food losses in a life cycle perspective: A comparative analysis of five food items. J. Clean. Prod. 2011, 19, 43–48. [Google Scholar] [CrossRef]
- Møller, H.; Soukka, R.; Wikström, F.; Olsson, A.; Auras, R.; Kvalvåg Pettersen, M.; Wever, R.; Williams, H.; Verghese, K.; Grönman, K. Packaging Strategies That Save Food: A Research Agenda for 2030. J. Ind. Ecol. 2018. [Google Scholar] [CrossRef]
- Schmidt, K.; Matthies, E. Where to start fighting the food waste problem? Identifying most promising entry points for intervention programs to reduce household food waste and overconsumption of food. Resour. Conserv. Recycl. 2018, 139, 1–14. [Google Scholar] [CrossRef]
- Aschemann-Witzel, J.; de Hooge, I.; Amani, P.; Bech-Larsen, T.; Oostindjer, M. Consumer-Related Food Waste: Causes and Potential for Action. Sustainability 2015, 7, 6457–6477. [Google Scholar] [CrossRef] [Green Version]
- Thoma, G.; Popp, J.; Nutter, D.; Shonnard, D.; Ulrich, R.; Matlock, M.; Kim, D.S.; Neiderman, Z.; Kemper, N.; East, C.; et al. Greenhouse gas emissions from milk production and consumption in the United States: A cradle-to-grave life cycle assessment circa. Int. Dairy J. 2013, 31, S3–S14. [Google Scholar] [CrossRef]
- Hebrok, M.; Boks, C. Household food waste: Drivers and potential intervention points for design—An extensive review. J. Clean. Prod. 2017, 151, 380–392. [Google Scholar] [CrossRef]
- Neff, R.A.; Spiker, M.L.; Truant, P.L. Wasted food: U.S. consumers’ reported awareness, attitudes, and behaviors. PLoS ONE 2015, 10, e0127881. [Google Scholar] [CrossRef]
- Wilson, N.L.W.W.; Rickard, B.J.; Saputo, R.; Ho, S.T. Food waste: The role of date labels, package size, and product category. Food Qual. Prefer. 2017, 55, 35–44. [Google Scholar] [CrossRef] [Green Version]
- Williams, H.; Wikström, F.; Otterbring, T.; Löfgren, M.; Gustafsson, A. Reasons for household food waste with special attention to packaging. J. Clean. Prod. 2012, 24, 141–148. [Google Scholar] [CrossRef] [Green Version]
- Schanes, K.; Dobernig, K.; Gözet, B. Food waste matters—A systematic review of household food waste practices and their policy implications. J. Clean. Prod. 2018, 182, 978–991. [Google Scholar] [CrossRef]
- Karli, V.; Helen, L.; Simon, L.; Helen, W. The Role of Packaging in Minimising Food Waste in the Supply Chain of the Future; RMIT University: Melbourne, Australia, 2013. [Google Scholar]
- Quested, T.E.; Marsh, E.; Stunell, D.; Parry, A.D. Resources, Conservation and Recycling Spaghetti soup: The complex world of food waste behaviours. Resour. Conserv. Recycl. 2013, 79, 43–51. [Google Scholar] [CrossRef]
- Licciardello, F. Packaging, blessing in disguise. Review on its diverse contribution to food sustainability. Trends Food Sci. Technol. 2017, 65, 32–39. [Google Scholar] [CrossRef]
- Molina-Besch, K.; Wikström, F.; Williams, H. The environmental impact of packaging in food supply chains—Does life cycle assessment of food provide the full picture? Int. J. Life Cycle Assess. 2019, 24, 37–50. [Google Scholar] [CrossRef]
- Wikström, F.; Williams, H.; Venkatesh, G. The influence of packaging attributes on recycling and food waste behaviour—An environmental comparison of two packaging alternatives. J. Clean. Prod. 2016, 137, 895–902. [Google Scholar] [CrossRef]
- Wikström, F.; Williams, H.; Verghese, K.; Clune, S. The influence of packaging attributes on consumer behaviour in food-packaging life cycle assessment studies—A neglected topic. J. Clean. Prod. 2014, 73, 100–108. [Google Scholar] [CrossRef]
- Buzby, J.C.; Farah-Wells, H.; Hyman, J. The Estimated Amount, Value, and Calories of Postharvest Food Losses at the Retail and Consumer Levels in the United States; U.S. Department of Agriculture, Economic Research Service: Washington, DC, USA, 2014. [Google Scholar]
- Quested, T. The Milk Model: Simulating Food Waste in the Home; WRAP: Banbury, UK, 2013. [Google Scholar]
- Robinson, S. Discrete-event simulation: A primer. In Discrete-Event Simulation and System Dynamics for Management Decision Making; Brailsford, S., Churilov, L., Dangerfield, B., Eds.; John Wiley & Sons, Ltd.: Loughborough, UK, 2014; pp. 10–25. [Google Scholar]
- MATLAB and Simulink Toolbox R2018a; The MathWorks, Inc.: Natick, MA, USA, 2018.
- Barbano, D.M. A 100-Year Review: The production of fluid (market) milk. J. Dairy Sci. 2017, 100, 9894–9902. [Google Scholar] [CrossRef]
- American Community Survey 5-Year Detailed Tables. Available online: https://api.census.gov/data/2016/acs/acs5/tags/household.html (accessed on 27 February 2019).
- Average Daily Servings of Dairy Foods by Ethnicity and Age Group (NHANES 2011–2014); NHANES: Atlanta, GA, USA, 2014.
- Burek, J.; Kim, D.; Nutter, D.; Selke, S.; Auras, R.; Cashman, S.; Sauer, B.; Thoma, G. Environmental Sustainability of Fluid Milk Delivery Systems in the United States. J. Ind. Ecol. 2017, 22, 180–195. [Google Scholar] [CrossRef]
- Morone, P.; Falcone, P.M.; Lopolito, A. How to promote a new and sustainable food consumption model: A fuzzy cognitive map study. J. Clean. Prod. 2018, 208, 563–574. [Google Scholar] [CrossRef]
- Jun, J.B.; Jacobson, S.H.; Swisher, J.R. Application of Discrete-Event Simulation in Health Care Clinics: A Survey. J. Oper. Res. Soc. 1999, 50, 109–123. [Google Scholar] [CrossRef]
- USDA. Packaged Fluid Milk Sales in Federal Milk Order Markets: By Size and Type of Container and Distribution Method During November 2005; USDA: Washington, DC, USA, 2005.
- Thyberg, K.L.; Tonjes, D.J. Drivers of food waste and their implications for sustainable policy development. Resour. Conserv. Recycl. 2016, 106, 110–123. [Google Scholar] [CrossRef]
Figure 1.
DES modeling of fluid milk consumption. Consumption is modeled using blocks from the Simevents® software. Arrows and numbers indicate the path that consumption, purchases, and milk containers take within the model. Captions below blocks indicate what the block is simulating, i.e. refrigerator, grocery store, etc.

Figure 2.
Amount of milk, in liters, spoiled (A) and unavailable (B) for a 4-person household. Error bars indicate the standard deviation. Comparison of two different sizes, “G” indicates a gallon container, while “HG” signifies a half-gallon. Centered across the top of the figure is the number of containers purchased by the household on their regular shopping trips. The probability of going to a top-up shop when there is not enough milk available is represented on the right side of the figure. The number of containers purchased is represented on the top of the graph. Households of 4 purchased 1, 2, or 3 containers of each size.

Figure 3.
Summary of consumption, spoilage, and amount unavailable for 1 person, 2 person, and 4 person households. The right axis indicates the amount consumed, spoiled, and unavailable milk. Error bars indicate the standard deviation. Each column represents a different household size, while the colors coordinate with a 25% and 50% chance of going to top-up shopping. Each container size simulated is represented on the x-axis. “Q” indicates a quart size container, “HG” indicates a half-gallon, and “G” signifies a gallon container. Results were averaged over a 1-year time frame.
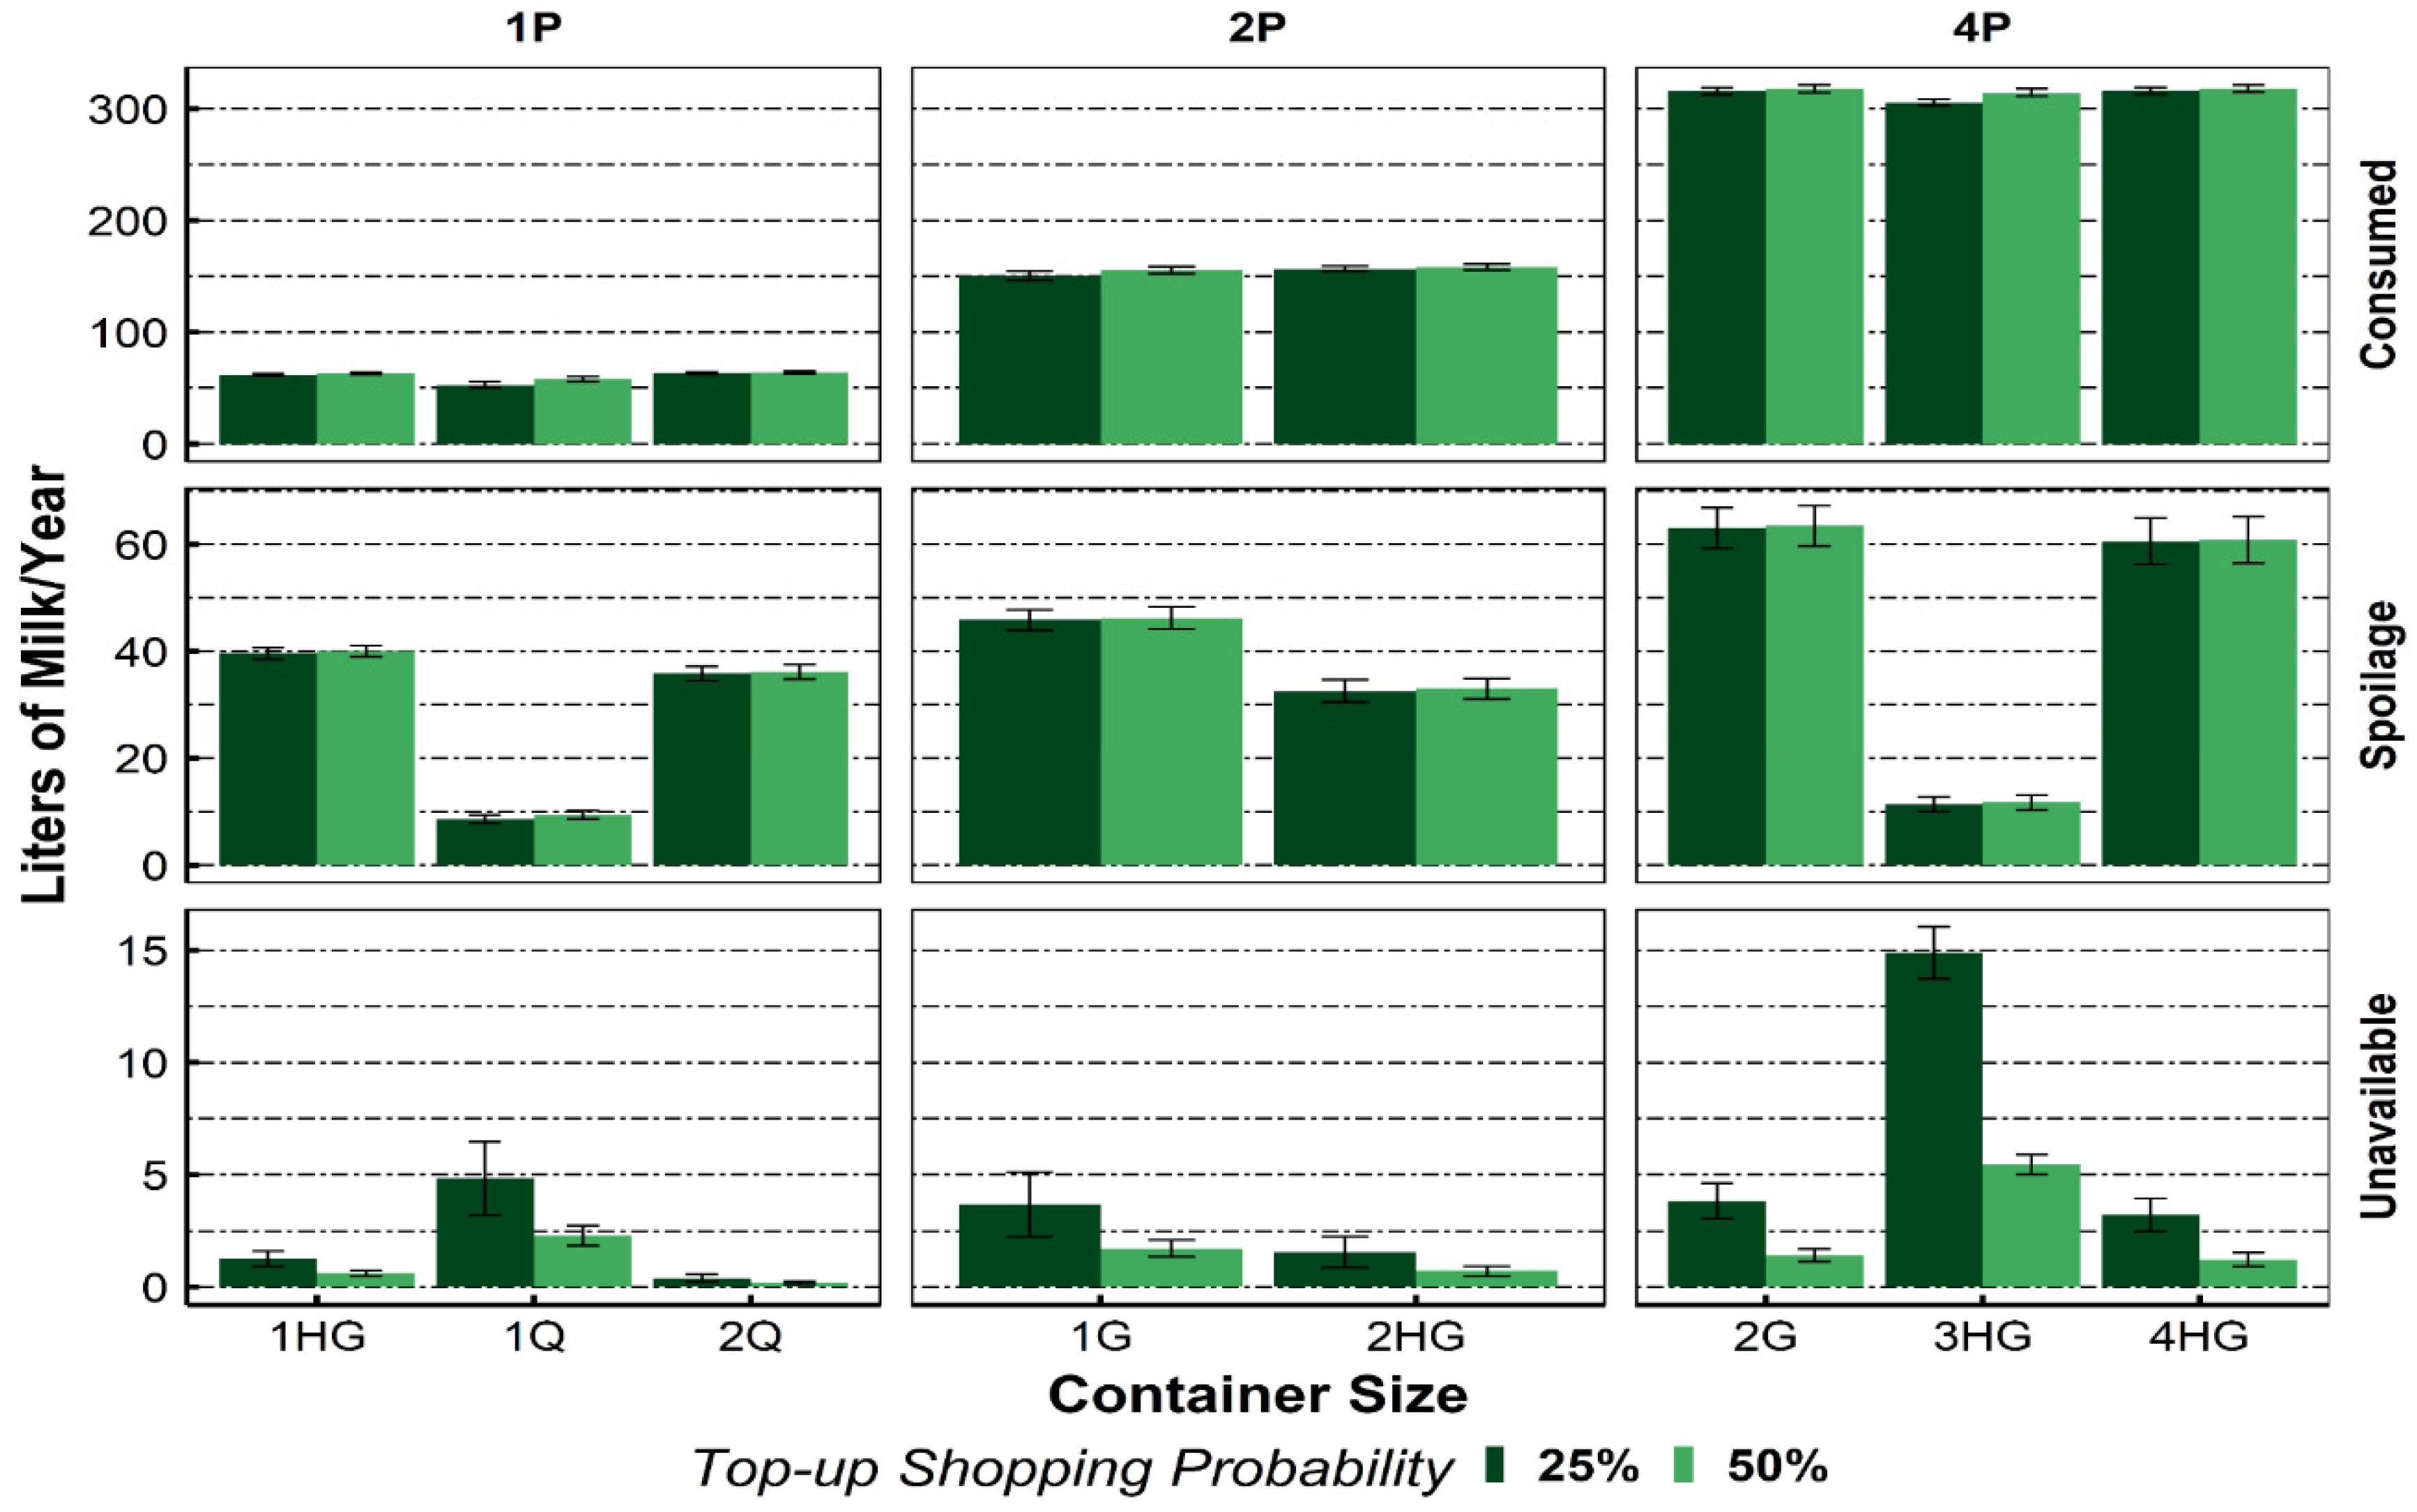
Figure 4.
Total GHG emissions of 1 (32 million, 1NFM), 2 (6 million, 2NFM), and 4-person (15 million, 4FM) U.S. households. “FM” stands for family, while “NFM” stands for non-family household. Columns are separated by the container size purchased. “Assumed” containers represent what is currently assumed to be purchased by households, new containers were the initially “Suggested” purchasing changes, and “Optimal” represents the optimized container purchase. 1NFM, 2NFM, and 4FM households were assumed to purchase 1HG, 1G, and 2G containers, respectively. 1NFM, 2NFM, and 4FM households were suggested to purchase 2Qs, 2HGs, and 4 HGs, respectively. Lastly, 1NFM and 4FM households were optimized for consumption and spoilage when purchasing 1Q and 3 HGs, respectively.
© 2019 by the authors. Licensee MDPI, Basel, Switzerland. This article is an open access article distributed under the terms and conditions of the Creative Commons Attribution (CC BY) license (http://creativecommons.org/licenses/by/4.0/).
Share and Cite
MDPI and ACS Style
Stankiewicz, S.K.; Auras, R.; Selke, S. Modeling American Household Fluid Milk Consumption and their Resulting Greenhouse Gas Emissions. Sustainability 2019, 11, 2152. https://doi.org/10.3390/su11072152
AMA Style
Stankiewicz SK, Auras R, Selke S. Modeling American Household Fluid Milk Consumption and their Resulting Greenhouse Gas Emissions. Sustainability. 2019; 11(7):2152. https://doi.org/10.3390/su11072152
Chicago/Turabian StyleStankiewicz, Sebastian K., Rafael Auras, and Susan Selke. 2019. "Modeling American Household Fluid Milk Consumption and their Resulting Greenhouse Gas Emissions" Sustainability 11, no. 7: 2152. https://doi.org/10.3390/su11072152
Note that from the first issue of 2016, this journal uses article numbers instead of page numbers. See further details here.