Article

Effect of Carbon/Nitrogen Ratio, Temperature, and Inoculum Source on Hydrogen Production from Dark Codigestion of Fruit Peels and Sewage Sludge

by
Lirio María Reyna-Gómez
1,2,
Carlos Eduardo Molina-Guerrero
2,3,
Juan Manuel Alfaro
1,*,
Santiago Iván Suárez Vázquez
2,
Armando Robledo-Olivo
4 and
Arquímedes Cruz-López
2,*
1
Facultad de Ciencias Químicas, Universidad Autónoma de Nuevo León, Av. Pedro de Alba S/N, Ciudad Universitaria, San Nicolás de los Garza 66455, Mexico
2
Facultad de Ingeniería Civil, Universidad Autónoma de Nuevo León, Departamento de Ingeniería Ambiental, Av. Universidad S/N, Ciudad Universitaria, San Nicolás de los Garza 66455, Mexico
3
Depto. Ingenierías Química, Electrónica y Biomédica. División de Ciencias e Ingenierías, Campus León, Universidad de Guanajuato, Loma del Bosque 103, Col. Lomas del Campestre, León 37150, Mexico
4
Universidad Autónoma Agraria Antonio Narro, Calzada Antonio Narro 1923, Buena Vista, Saltillo 25315, Mexico
*
Authors to whom correspondence should be addressed.
Sustainability 2019, 11(7), 2139; https://doi.org/10.3390/su11072139
Submission received: 6 March 2019 / Revised: 3 April 2019 / Accepted: 3 April 2019 / Published: 10 April 2019
(This article belongs to the Section Energy Sustainability)

Abstract

:
This paper studies the use of fruit peel biomass and waste sludge from municipal wastewater treatment plants in the metropolitan area of Monterrey, Mexico as an alternative way of generating renewable energy. Using a Plackett–Burman experimental design, we investigated the effects of temperature, inoculum source, and the C/N (Carbon/Nitrogen) ratio on dark fermentation (DF). The results indicate that it is possible to produce hydrogen using fruit peels codigested with sewage sludge. By adjusting the C/N ratio in response to the physicochemical characterization of the substrates, it was revealed that the quantities of carbohydrates and nitrogen were sufficient for the occurrence of the fermentation process with biogas production greater than 2221 ± 5.8 mL L−1Reactor and hydrogen selectivity of 23% (366 ± 1 mL H2·L−1Reactor) at the central point. The kinetic parameters (Hmax= 86.6 mL·L−1, Rm = 2.6 mL L−1 h−1, and λ = 1.95 h) were calculated using the modified Gompertz model. The quantification of soluble metabolites, such as acetic acid (3600 mg L−1) and ethyl alcohol (3.4 ± 0.25% v/v), confirmed the presence of acetogenesis in the generation of hydrogen.

Graphical Abstract

1. Introduction

The energy needs of economic activities have increased exponentially in the last few years, whereas fossil fuel reserves have diminished. According to the predictions from the U.S. Energy Information Administration (EIA), twice the current amount of energy will be needed by 2040 if we maintain the current annual growth rate of the U.S. Gross Domestic Product (GDP) of 2.6% [1]. Therefore, to halt the negative effects on the environment due to carbon dioxide (CO2) emissions and contribute to the generation of clean energy, it is necessary to develop renewable sources [2,3]. Presently, various research groups throughout the world are exploring sustainable resources for obtaining dihydrogen (H2) as an energy carrier [2,4,5].
Since 2000, H2 has been considered one of the most viable alternative energy carriers for the future [6] due to its inherent characteristics, such as a higher energy content of 122 MJ kg−1, which is approximately 2.75 times greater than that of its closest competitor, gasoline [2,7]. Dihydrogen can be used directly in fuel cells for electricity generation [8,9] and produces only water as a byproduct from its combustion [10]. From an environmental standpoint, the production of H2 from biological processes that involve organic waste is an important area of opportunity in the production of bioenergy [11,12]. In such cases, the H2 produced is also called biohydrogen. Although biohydrogen can be generated through various processes, a number of investigators have described the fundamentals of the biological production of H2 using photolysis or dark fermentation (DF). The latter is considered a simpler method and has the advantage of using municipal, agricultural, and industrial wastes as starting materials [13,14,15,16].
Gómez-Romero has described the use of different municipal wastes or industrial wastewater as substrates for DF [17]. Data obtained in these studies show that the production of biohydrogen could be reduced or even inhibited due to some specific characteristics of wastewater or organic wastes, such as deficient buffer capacity, nutrient imbalance, and the presence of microbial populations that may consume biohydrogen or produce methane. One strategy to overcome these problems is the use of codigestion processes, due to the positive synergistic effect of the mixed material with complementary optimizing conditions for hydrogen production: controlling pH, and optimizing the C/N ratio [18]. In fact, the C/N ratio (20 to 40) is used as a reference parameter associated with the enhancement of the buffer capacity of the system [17,19,20,21]. Currently, some geographic regions in the world have been using biowaste as a resource in anaerobic codigestion processes for H2 production. This includes cheese whey–vegetables or vinasse–nejayote in Mexico [17,22], fruit–vegetable–fish waste in Tunisia [23], coffee residues–sugarcane–vinasse in Brazil [24], or mozzarella cheese whey and buttermilk in Italy [25].
The most recent publications have proposed the use of fruit wastes as substrates that are rich in carbohydrates, which provide a nutritional balance with other substrates that are rich in polysaccharides and proteins [19,26], in addition to providing a convenient habitat for the proliferation of H2, producing its natural microflora [27,28]. Saidi et al. were able to duplicate hydrogen production (28 mmol h−1 L−1) in a batch reactor in the presence of Thermotoga maritima with a C/N ratio of 22, which was increased three-fold due to the codigestion of fruit–vegetable–fish waste [23]. On the other hand, Gómez-Romero demonstrated that the adaptation of the predominant microbial community of Bifidobacterium was 85.4%, followed by Klebsiella (9.1%), Lactobacillus (0.97%), Citrobacter (0.21%), Enterobacter (0.27%), and Clostridium (0.18%) in a reactor fed with milk serum and fruit wastes at different C/N ratios (5 < C/N < 46). The highest specific biohydrogen production rate was 10.68 mmol h−1 L−1 for a C/N ratio of 21 [17]. Furthermore, Bikram also studied the codigestion of fruit and vegetables mixed with cottage cheese serum, which obtained a maximal hydrogen productivity of 118.12 ± 1.05 mmol L−1 with a C/N ratio of 68 [21]. In contrast with the results reported by Gómez-Romero, the predominant species were Escherichia coli, Clostridium butyricum, and Streptococcus henryi.
In developing countries, the majority of municipal solid wastes comprise fruit peels and vegetable wastes according to the literature [29,30]. The metropolitan area of Monterrey (MAM), generated approximately 800 thousand tons of organic waste in 2017 [31]. This amount of biomass with a high content of hydrolysable carbohydrates was an attractive criterion for selecting fruit peels as strong substrates for the production of biofuels, in combination with sewage sludge produced from the biological process. Generally, sewage sludge is treated by an anaerobic digestion process to produce methane; however, hydrogen is an important intermediate product in this process. Thence, both wastes can be conveniently processed and valorized in a dark codigestion process, because the raw materials are abundant throughout the year and there is zero cost.
Based on the above, this paper describes an exploratory study of dark codigestion using fruit peels (FP) with sewage sludge (SS) generated from a municipal wastewater-treatment plant. For this, three variables—temperature, two sources of inoculum, and the C/N ratio—were studied, employing a Plackett–Burman (PB) experimental design to identify the influence of these parameters on the degradation of the organic wastes for producing H2 as a renewable energy source.

2. Materials and Methods

2.1. Substrate Preparation

The DF process was developed using a codigestion procedure on a mixture of different FP, such as melon (Cucumis spp.), papaya (Papaya spp.), and pineapple (Ananas spp.), which were obtained from a vegetarian restaurant in the locality, and SS from a municipal wastewater-treatment plant in the city of Monterrey, Nuevo León. This allowed us to meet the nutritional contribution of the substrate. Fruit peels were separated and ground using an industrial blender (Waring Laboratory Science, BLENDOR model). The SS was thermally treated at 100 °C for 1 h [32]; after this, the FP and SS were combined and the proportions were adjusted to obtain C/N ratios of 20, 30, and 40.

2.2. Inoculum Source

Two inoculum sources were used for the production of biohydrogen. The first source derived from the anaerobic sludge (AS) obtained from the wastewater-treatment plant of Monterrey Water and Drainage Services (Servicios de Agua y Drenaje de Monterrey—SADM), whereas the second source, granular anaerobic sludge (GAS), was recovered from the wastewater-treatment plant of a beverage company found in the locality. The physicochemical characteristics are listed in Table 1, revealing that GAS presents a major percentage of biomass. The inocula were treated separately in a water bath at 100 °C for 1 h to inhibit methanogenic microorganisms and guarantee the selective production of biohydrogen [32].

2.3. Batch Bioreactors

A PB experimental design was used to evaluate the productivity of the codigestion process in the production of hydrogen. The different combinations of the three factors: temperature (25, 37, and 55 °C), the C/N ratio (20, 30, and 40), and inoculum source (AS and GAS), are summarized in Table 2. For each of the 18 combinations, vessels with 124 mL of total volume were used as bioreactors, with a working volume of 80 mL.
The nutritive solution used to grow the hydrogen-producing bacteria consisted of a combination of macronutrients and micronutrients composed of the following, which was adapted from reference [33] (g L−1): NH4Cl (0.5) (Monterrey Chemical Products: Productos Químicos Monterrey—PQM, Monterrey, Mexico), K2HPO4 (0.25) (PQM), MgCl2·6H2O (0.3) (Sigma Aldrich), KH2PO4 (0.25), FeCl3 (0.025) (Sigma Aldrich, Toluca, Mexico), CoCl6·H2O (0.025) (J.T. Baker, Monterrey, Mexico), and NiSO4 (0.016) (J.T. Baker, Monterrey, Mexico). The initial pH of the mixture was adjusted to 5.5 using 0.1 N H2SO4. Bioreactors were flushed with nitrogen gas to ensure anaerobic conditions before they were sealed with rubber septum and aluminum rings [34].

2.4. Analytical Techniques

The following parameters were calculated during the process of characterizing the substrates: Total Solids (TS); Volatile Solids (VS); Total Carbohydrates (TCH); and pH. These parameters were analyzed according to standard methods [35]. Chemical Oxygen Demand (COD) was measured using the Hach standard method, which was based on the digestion of the sample with potassium dichromate at a temperature of 150 °C under acidic conditions [36]. The phenol–sulfuric method, which involves the hydrolyzing of sugars by the addition of acid to form colored complexes with phenol [37], and the Lowry method, which adds reactants containing Cu2+ to form blue complexes with proteins [38], were used to analyze the composition of carbohydrates and proteins, respectively, in the FP.
The total volume of biogas was measured at each time interval by the plunger displacement method utilizing syringes, ranging from 10 to 50 mL [39]. The amount of hydrogen in the gas was quantified in a gas chromatograph (SRI 8610C) with a Thermal Conductivity Detector (TCD) and two packed columns, a silica gel and a molecular sieve, both of which had dimensions of 6′ × 1/8′. The temperatures of the injector and detector were 90 °C and 150 °C, respectively. The gas carrier was nitrogen at a flow rate of 20 mL min−1. Acetic acid was monitored during DF using distillation–titration [40,41]. The other parameters analyzed were pH, TCH, COD [35,36,37], and ethanol, which was measured with a digital refractometer (Wago, Model PET109, Monterrey, Mexico).

2.5. Data Analysis

The PB design was used to explore key factors in the production of biogas and hydrogen by the codigestion of FP and SS. Three variables were studied (C/N ratio, temperature, and inoculum source) and the biogas and H2 cumulative volumes were selected as the dependent output across 18 runs. The software used was MINITAB ver. 15. The design matrix is presented in Table 2.
Cumulative biogas production curves were obtained from the experimental design and analyzed employing the modified Gompertz model to acquire the hydrogen production potential (Hmax), the hydrogen production rate, and the lag phase [42,43].
H = Hmax exp[−exp[(Rm e/Hmax)(λ − t) + 1]],
where H is the cumulative hydrogen production (mL L−1), Hmax is the hydrogen production potential (mL L−1), Rm is the maximal hydrogen production rate (mL L−1 h−1), λ is the lag phase time (h), t is the time (h), and e is the Euler constant (2.71821). The kinetic parameters were determined by fitting the cumulative hydrogen production curve by minimizing the ratio of the sum of the square error to the correlation coefficient (r2) using the Solver function in Microsoft Excel ver. 10.

3. Results and Discussion

3.1. Characterization of Substrates

The physical and chemical characteristics of the FP are essential for the design and operation of anaerobic digesters, because they will affect the production of biogas and the stability of the DF process. Table 3 shows the results of the physicochemical characterization of the FP and the SS. Both substrates had a high humidity (ranging from 89.61 to 92.43%), which can facilitate the degradation process [34]. The amount of nitrogen increased when SS was used. The C/N ratio is important, as it is closely related to the ability to produce hydrogen [40]. Furthermore, nitrogen is the most essential nutrient, in that a proper supply of nitrogen could maximize microbial growth but excessive addition could cause ammonia inhibition [44].

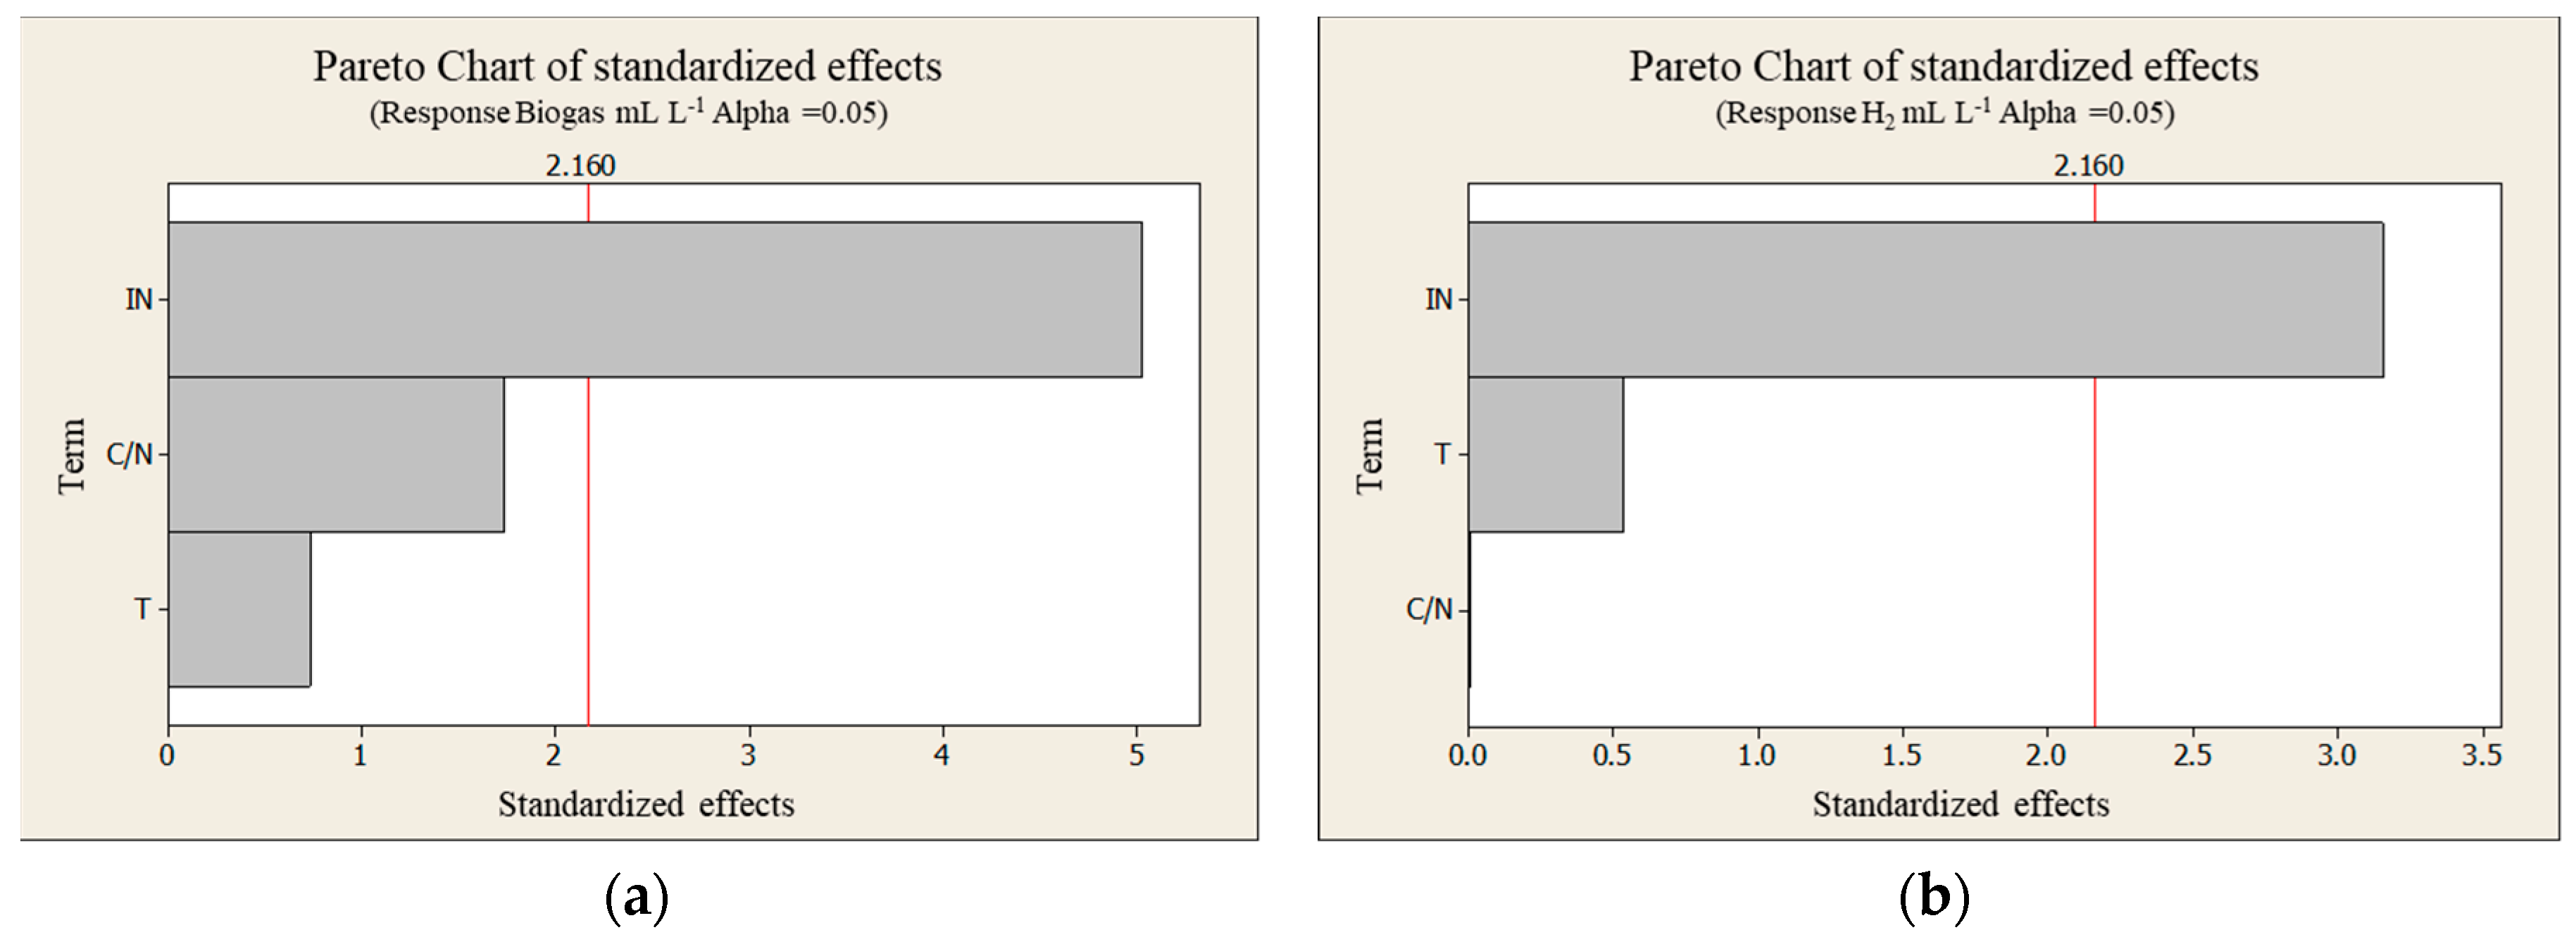
3.2. Measuring Biogas

The progress of the 18 bioreactors was closely monitored. The microbial activity in the production of biogas was greater at 25 °C than at 55 °C. The cumulative volume of biogas after 140 h is presented in Table 4. The greatest cumulative gas volumes correspond to the central points of the PB matrix, with an average value of 2221 ± 5.8 mL·L−1 Reactor for the R6, R14, and R16 reactors. The most effective reactors are located at the central points of the experimental design with the following parameters: C/N ratio of 30, temperature of 37 °C, and GAS inoculum. This C/N ratio is consistent with ratios found by other authors in anaerobic processes for methane production, which permits us to theorize that DF and anaerobic digestion can be performed utilizing the same C/N ratio [45]. When the same C/N ratio and temperature were used with AS, biogas production decreased by 30%. This result is consistent with the least productive series of reactors (<500 mL L−1 Reactor), which was also inoculated with AS and incubated at 55 °C.
The Pareto charts of the standardized effects in Figure 1a reveal that the type of inoculum is the most significant factor determining the volume of gas produced. The efficiency of GAS can likely be attributed to the spherical form of the granules (<2 mm), which distributes the different microorganisms in layers [46]. According to Hernández et al., the fermentative bacteria are distributed in the outer layers of the granule, facilitating direct contact with the substrates. In contrast, the intermediate layers contain acetogenic bacteria, including those that produce hydrogen, where the population dynamics aid in the oxidation–reduction processes [47].
Figure 1b shows the Pareto chart for H2 production. The inoculum source used was again the most important factor, followed by temperature. A C/N ratio of 30 promoted the greatest production of H2 in the codigestion, which was attributed to the synergistic effects of the nutritive balance and the buffer capacity that the sludge contributes to the mix to control pH naturally. Thus, this avoids acidification of the reactors and the inhibition of hydrogen production [47].

3.3. Biohydrogen Production

The chromatographic analysis of biogas samples showed that H2 and CO2 were reaction products and methane was not detected in any of the samples. The production of H2 exhibited trends similar to those of the generation of biogas, with a selectivity of 20–23% in tests of R2, R17, R18, R6, R14, and R16. Other reactors, including R4, R9, and R13, which had lower (<8%) selectivity in the production of H2, were activated with the same inoculum source but required a C/N ratio of 40 and temperature of 25 ± 2 °C. These results are no better than those in the literature or in comparison to the stoichiometry of the reaction, but they demonstrate that it is possible to use SS to generate renewable energy. The conventional management and treatment of SS implies a worldwide problem in finding locations for its ultimate disposal and a risk of groundwater pollution [48]; therefore, this is a promising alternative treatment [49].
The kinetic parameters obtained from the experimental data of the reactors are described in Table 5 using the Gompertz model (Equation (1)).
The behavior of the H2 production for all treatments was adequately described by the model, with a correlation coefficient (r2) of around 1.0. Lag time ranged from 1.95 to 22 h depending on the C/N ratio. For the R14 studied at 37 °C (C/N = 30), Hmax was 86.6 mL L−1. For R7 and R13 with C/N ratios of 20 and 40 analyzed at 25 °C, Hmax values were 33 and 17.5 mL L−1, respectively. Finally, for R15 at 55 °C, Hmax was 26.9 mL L−1 h−1. The highest hydrogen production rate was 2.6 mL L−1 h−1 from R14. This result could be explained by the positive synergism established between the mixture of organic substrates (FP and SS) and the inoculum. However, the hydrolysis of fruit peels, such as melon or pineapple, could be a limiting step in anaerobic codigestion, which should be overcome in order to improve its performance [17].

3.4. Monitoring Parameters during DF

As part of the study, the development of the reactors inoculated with GAS, pH, TCH, and COD was monitored (see Table 6). First, pH is one of the most important environmental factors that can affect the metabolic pathway and the efficiency of the production of H2. In this study, the pH of all of the reactors was adjusted to 5.5 and, at the end of the reaction, the trials with the greatest H2 production (R6, R14, and R16) had a final pH of 5.1 (Figure 2). Figure 2 shows that the pH range for maximal H2 production is 5.2–6.0, whereas the reactors showing lower biogas and hydrogen production had final pH values as low as 4.3. These values represent the acidification of the reactors as a result of the generation of other soluble metabolites, such as acetic acid (Figure 3) and ethanol. The production of hydrogen occurs primarily during the exponential growth phase of Clostridium, whereas during the stationary phase, there is a change from acidogenesis to solvent production [50]. These changes in microbial metabolism occur at pH values below 4.5 [51], which are the same pH values observed in the reactors at the end of the DF process.
All of the reactions consumed 45–60% of the total carbohydrates during the 140-h incubation. The greatest change occurred during the first 24 h, especially in reactors with a C/N ratio of 40. Despite a link between carbohydrate consumption and energy transformation, there was no evidence of this effect in these results.
Soluble COD represents the organic content of biodegradable substrates. Therefore, its removal is an indicator of the degree of hydrolysis achieved by the acidogenic bacteria [40]. In this study, it was evident that the concentrations of COD exhibited the same trends as the carbohydrates due to their average decrease of 60%. The greatest COD decrease was observed in the first 40 h of codigestion and coincided with the adaptation and exponential growth stages of the microorganisms.
Table 7 depicts the optimal operation condition and hydrogen yield (HY) from different codigestion studies using different organic substrates. As shown in Table 7, the HY obtained in this study is slightly lower than that reported in other papers using mixtures of codigestion in batch reactors; however, the removal percentage of COD (50%) was the highest. It is noteworthy that HY depends not only on the rate of existing carbohydrates but also on the group of operation conditions of the reactor, such as pH, COD, and inoculum.
In fact, pH control within an optimal interval is decisive for the growth of biohydrogen-producing bacteria [17,28,34,52]. Even taking this into account, the development of this proposal in Monterrey, Mexico comprises a preceding action for the achievement of wastes as valuable resources for the generation of economical clean energies. In addition, the findings related to the operational conditions in this work can apply for the production of other bioenergetics, such as methane.

3.5. Production of Soluble Metabolites

As reported in the literature, fermentation can produce solvents such as ethanol, and volatile fatty acids such as acetic acid, butyric acid, and propionic acid. According to Equation (2), 4 moles of hydrogen can be obtained together with acetic acid, whereas only 2 moles are obtained together with butyric acid (Equation (3)).
C6H12O6 + 2H2O → 2CH3COOH + 2CO2 + 4H2,
C6H12O6 → 2CH3CH2CH2COOH + 2CO2 + 2H2.
Evidence of hydrogen production during DF was obtained in part by quantifying acetic acid and ethanol in the reactors. The entire series of experiments (Table 6) demonstrated an increase in the production of acetic acid, primarily in reactor R6 (3600 mg L−1), followed by reactors R4, R9, and R14, in which the production was 45–60% lower. This is consistent with an analysis reported in the literature, in which the production of hydrogen was shown to be linked with that of volatile fatty acids, specifically acetic acid [53]. In contrast, the presence of ethanol is indicative of the dominance of the acidogenesis process in the reaction. Reactors R6, R14, and R16 maintained a constant concentration of ethanol (3.25 ± 0.25% v/v) throughout the entire experiment. Reactors run at 55 °C did not show any clear trends.

4. Practical Application and Future Perspectives

The codigestion of FP biomass and waste sludge from municipal treatment plants for producing biofuels involves different biochemical reactions during anaerobic degradation. From this derives the importance of balancing the nutritional support of the substrates in the feeding process, because these latter exert an influence on the nature of the microbial communities that prosper and that direct the selectivity of the biological processes. In this exploratory work, we studied the interaction of the mixed microbial consortium (GAS) and the operational variables of the reactor (C/N ratio, temperature) as determining factors in the production of hydrogen. However, the work also allowed us to determine the presence of other parallel reactions with sub-products with a different commercial value and industrial use. Therefore, the results of this study can also be applied successfully as a useful tool for achieving total control of the physical, chemical, and anaerobic process in order to increase selectivity in terms of the production of a specific, final metabolite.

5. Conclusions

From the results from the PB experimental design, we concluded that the factors of greatest significance for the codigestion of fruit peel biomass and waste sludge from municipal treatment plants were the inoculum source for biogas production as well for hydrogen production, followed by a C/N ratio for the latter.
The codigestion of the reactor batch with the C/N = 30 ratio and using GAS inoculum produced the greatest accumulative volume of biogas of 2221 ± 5.8 mL L−1 reactor, with selectivity of hydrogen of 23% and H2 yield of 27 mL H2 gVS−1.
The production of acetic acid increased during the development of codigestion as probable evidence that the mixture follows, among others, the metabolic route of acetogenesis where hydrogen production is favored.
The kinetic model of dark fermentation was adjusted to the Gompertz model, in particular the microreactors (R6, R14, and R16), with a C/N ratio = 30, GAS inoculum with yield of H2 max = 86.6 mL L−1, Rm = 2.6 mL L−1 h−1, and λ = 1.95 h.

Author Contributions

Conceptualization, L.M.R.-G., A.C.-L., and J.M.A.; methodology, L.M.R.-G. and C.E.M.-G.; formal analysis, L.M.R.-G., A.C.-L., and A.R.-O.; investigation, L.M.R.-G. and C.E.M.-G.; resources, A.C.-L.; data curation, A.C.-L.; writing—original draft preparation, L.M.R.-G., S.I.S.V., and A.C.-L.; writing—review and editing, A.R.-O., C.E.M.-G., and J.M.A.; project administration, S.I.S.V. and A.C.-L.; funding acquisition, A.C.-L.

Funding

This research was funded by Project 249908 of the CONACyT-SENER-Sustentabilidad Energética.

Acknowledgments

The authors thank the Laboratories of Environmental Engineering of the IIC-FIC for the use of their facilities, and LIPATA, UNAM, Campus Juriquilla for support in the CG-TCD analysis and Project PAIFIC/2018-15.

Conflicts of Interest

The authors declare no conflict of interest.

References

  1. Available online: www.eia.gov/forecasts/ieo (accessed on 25 February 2019).
  2. Ntaikou, I.; Antonopoulou, G.; Lyberatos, G. Biohydrogen production from biomass and wastes via dark fermentation: A review. Waste Biomass Valoriz. 2010, 1, 21–39. [Google Scholar] [CrossRef]
  3. Gandía, L.M.; Arzamendi, G.; Diéguez, P.M. Chapter 1—Renewable Hydrogen Energy: An Overview. In Renewable Hydrogen Technologies; Gandía, L.M., Arzamendi, G., Diéguez, P.M., Eds.; Elsevier: Amsterdam, The Netherlands, 2013; pp. 1–17. [Google Scholar]
  4. Cruz-López, A.; Pozos, A.C.L.; Vázquez, S.; Zanella, R.; Gómez, R. Zn-Ge oxynitride based nano-photocatalyst for hydrogen production under visible light. Mater. Res. Bull. 2016, 83, 603–608. [Google Scholar] [CrossRef]
  5. Poggi-Varaldo, H.M.; Muñoz-Páez, K.M.; Escamilla-Alvarado, C.; Robledo-Narváez, P.N.; Ponce-Noyola, M.T.; Calva-Calva, G.; Ríos-Leal, E.; Galindez-Mayer, J.; Estrada-Vázquez, C.; Ortega-Clemente, A.; et al. Biohydrogen, biomethane and bioelectricity as crucial components of biorefinery of organic wastes: A review. Waste Manag. Res. 2014, 32, 353–365. [Google Scholar] [CrossRef] [PubMed]
  6. Zerta, M.; Schmidt, P.; Stiller, C.; Ludwig, H.L. Alternative World Energy Outlook and the Role of hydrogen in a Changing Energy Landscape. In Proceedings of the 2nd World Congress of Young Scientist on Hydrogen Energy Systems, Turin, Italy, 6–8 June 2007. [Google Scholar]
  7. Mohan, S.V.; Pandey, A. Chapter 1—Biohydrogen Production: An Introduction. In Biohydrogen; Pandey, A., Chang, J.-S., Hallenbeck, P.C., Larroche, C., Eds.; Elsevier: Amsterdam, The Netherlands, 2013; pp. 1–24. [Google Scholar]
  8. Kim, S.H.; Han, S.K.; Shin, H.S. Feasibility of biohydrogen production by anaerobic co-digestion of food waste and sewage sludge. Int. J. Hydrog. Energy 2004, 29, 1607–1616. [Google Scholar] [CrossRef]
  9. Ghimire, A.; Valentino, S.; Frunzo, L.; Trabli, E.; Escudié, R.; Pirozzi, F.; Lens, N.L.; Esposito, G. Biohydrogen production from food waste by coupling semi-continuous dark-photofermentation and residue post-treatment to anaerobic digestion: A synergy for energy recovery. Int. J. Hydrog. Energy 2015, 40, 16045–16055. [Google Scholar] [CrossRef]
  10. Ortigueira, J.; Pinto, T.; Gouveia, L.; Moura, P. Production and storage of biohydrogen during sequential batch fermentation of Spirogyra hydrolyzate by Clostridium butyricum. Energy 2015, 88, 528–536. [Google Scholar] [CrossRef] [Green Version]
  11. Nzihou, A. Toward the valorization of waste and biomass. Waste Biomass Valoriz. 2010, 1, 3–7. [Google Scholar] [CrossRef]
  12. Ghimire, A.; Frunzo, L.; Pirozzi, F.; Trably, E.; Escudié, R.; Lens, P.N.L.; Esposito, G. A review on dark fermentative biohydrogen production from organic biomass: Process parameters and use of by-products. Appl. Energy 2015, 144, 73–95. [Google Scholar] [CrossRef]
  13. Hallenbeck, P.C.; Bennemann, J.R. Special Processes for Products Fuel and Energy in the Encyclopedia of Life Support Systems, 1st ed.; Doelle, H.W., Rokem, S., Berovic, M., Eds.; Encyclopedia of Life Support Systems-United Nations Educational, Scientific and Cultural Organization (e-book Academic Collection EOLSS-UNESCO): Singapore, 2009; pp. 338–362. [Google Scholar]
  14. Akinbomi, J.; Taherzadeh, M. Evaluation of Fermentative Hydrogen Production from Single and Mixed Fruit Wastes. Energies 2015, 8, 4253–4272. [Google Scholar] [CrossRef] [Green Version]
  15. Alexandropoulou, M.; Antonopoulou, G.; Lyberatos, G. Food Industry Waste’s Exploitation via Anaerobic Digestion and Fermentative Hydrogen Production in an Up-Flow Column Reactor. Waste Biomass Valoriz. 2016, 7, 711–723. [Google Scholar] [CrossRef]
  16. Valta, K.; Damala, P.; Angeli, E.; Antonopoulou, G.; Malamis, D.; Haralambous, K.J. Current Treatment Technologies of Cheese Whey and Wastewater by Greek Cheese Manufacturing Units and Potential Valorisation Opportunities. Waste Biomass Valoriz. 2017, 8, 1649–1663. [Google Scholar] [CrossRef]
  17. Gómez-Romero, J.; González-García, A.; Chairez, I.; Torres, L.; García-Peña, E.I. Selective adaptation of an anaerobic microbial community: Biohydrogen production by co-digestion of cheese why and vegetables fruit wastes. Waste Manag. 2015, 43, 144–151. [Google Scholar] [CrossRef]
  18. De Gioannis, G.; Muntoni, A.; Polettini, A.; Pomi, R. A review of dark fermentative hydrogen production from biodegradable municipal waste fractions. Waste Manag. 2013, 33, 1345–1361. [Google Scholar] [CrossRef] [PubMed]
  19. Prapinagsorn, W.; Sittijunda, S.; Reungsang, A. Co-digestion of napier grass and its silage with cow dung for bio-hydrogen and methane production by two-stage anaerobic digestion process. Energies 2018, 11, 47. [Google Scholar] [CrossRef]
  20. Ferreira, A.; Marques, P.; Ribeiro, B.; Assemany, P.; Vieira, H.; Barata, A.; Oliveira, A.C.; Reis, A.; Pinheiro, H.M.; Gouveia, L. Combining biotechnology with circular bioeconomy: From poultry, swine, cattle, brewery, dairy and urban wastewaters to biohydrogen. Environ. Res. 2018, 164, 32–38. [Google Scholar] [CrossRef]
  21. Basak, B.; Fatima, A.; Jeon, B.-H.; Ganguly, A.; Chatterjee, P.K.; Dey, A. Process kinetic studies of biohydrogen production by co-fermentation of fruit-vegetable wastes and cottage cheese whey. Energy Sustain. Dev. 2018, 47, 39–52. [Google Scholar] [CrossRef]
  22. García-Depraect, O.; Gómez-Romero, J.; León-Becerril, E.; López-López, A. A novel biohydrogen production process: Co-digestion of vinasse and Nejayote as complex raw substrates using a robust inoculum. Int. J. Hydrog. Energy 2017, 42, 5820–5831. [Google Scholar] [CrossRef]
  23. Saidi, R.; Liebgott, P.P.; Hamdi, M.; Auria, R.; Bouallagui, H. Enhancement of fermentative hydrogen production by Thermotoga maritima through hyperthermophilic anaerobic co-digestion of fruit-vegetable and fish wastes. Int. J. Hydrog. Energy 2018, 43, 23168–23177. [Google Scholar] [CrossRef]
  24. Maciel Pinto, M.P.; Mudhoo, A.; Alencar Neves, T.; Donizeti Berni, M.; Forster-Carneiro, T. Co–digestion of coffee residues and sugarcane vinasse for biohythane generation. J. Environ. Chem. Eng. 2018, 6, 146–155. [Google Scholar] [CrossRef]
  25. Pagliano, G.; Vertorino, V.; PAnico, A.; Romano, I.; Robertiello, A.; Pirozzi, F.; Pepe, O. The effect of bacterial and archaeal populations on anaerobic process fed with mozzarella cheese whey and buttermilk. J. Environ. Manag. 2018, 217, 110–122. [Google Scholar] [CrossRef] [PubMed]
  26. Cai, M.; Liu, J.; Wei, Y. Enhanced biohydrogen production from sewage sludge with alkaline pretreatment. Environ. Sci. Technol. 2004, 38, 3195–3202. [Google Scholar] [CrossRef] [PubMed]
  27. Argun, H.; Dao, S. Bio-hydrogen production from waste peach pulp by dark fermentation: Effect of inoculum addition. Int. J. Hydrog. Energy 2017, 42, 2569–2574. [Google Scholar] [CrossRef]
  28. Cappai, G.; De Gioannis, G.; Muntoni, A.; Spiga, D.; Boni, M.R.; Polettini, A.; Pomi, R.; Rossi, A. Biohydrogen production from food waste: Influence of the inoculum-to-Substrate ratio. Sustainability 2018, 10, 4506. [Google Scholar] [CrossRef]
  29. Pérez-Denicia, E.; Fernández-Luqueño, F.; Vilariñi-Ayala, D.; Montaño-Zetina, L.M.; Maldonado-López, L.A. Renewable energy sources for electricity generation in Mexico: A review. Renew. Sustain. Energy Rev. 2017, 78, 597–613. [Google Scholar] [CrossRef]
  30. Moya, D.; Aldás, C.; López, G.; Kaparaju, P. Municipal solid waste as a valuable renewable energy resource: A worldwide opportunity of energy recovery by using Waste-to-Energy technologies. Energy Procedia 2017, 134, 286–295. [Google Scholar] [CrossRef]
  31. Available online: https://www.elfinanciero.com.mx/monterrey/incineraran-basura-para-generar-mas-energia-limpia (accessed on 25 February 2019).
  32. Bansal, S.K.; Sreekrishnan, T.R.; Singh, R. Effect of heat pretreated consortia on fermentative biohydrogen production from vegetable waste. Natl. Acad. Sci. Lett. 2013, 36, 125–131. [Google Scholar] [CrossRef]
  33. Buitrón, G.; Carvajal, C. Biohydrogen production from Tequila vinasses in an anaerobic sequencing batch reactor: Effect of initial substrate concentration, temperature and hydraulic retention time. Bioresour. Technol. 2010, 101, 9071–9077. [Google Scholar] [CrossRef]
  34. Garcia-Peña, I.E.; Canul-Chan, M.; Chairez, I.; Salgado-Manjarez, E.; Aranda-Barradas, J. Biohydrogen production based on the evaluation of kinetic parameters of a mixed microbial culture using glucose and fruit-vegetable waste as feedstocks. Appl. Biochem. Biotechnol. 2013, 171, 279–293. [Google Scholar] [CrossRef]
  35. American Public Health Association; American Water Works Association. Standard Methods for the Examination of Water and Wastewater, 21th ed.; American Public Health Association: Washington, DC, USA, 1998. [Google Scholar]
  36. Budiman, P.M.; Wu, T.Y.; Ramanan, R.N.; Jahim, J. Improvement of Biohydrogen Production through Combined Reuses of Palm Oil Mill Effluent Together with Pulp and Paper Mill Effluent in Photofermentation. Energy Fuels 2015, 29, 5816–5824. [Google Scholar] [CrossRef]
  37. Dubois, M.; Giles, K.A.; Hamilton, J.; Rebers, P.A.; Simith, F. Colorimetric method for determination of sugars and related substances. Anal. Chem. 1956, 28, 350–356. [Google Scholar] [CrossRef]
  38. Lowry, O.H.; Rosebrough, N.J.; Farr, L.A.; Randall, R.J. Protein measurement with the folin phenol reagent. J. Biol. Chem. 1951, 193, 265–275. [Google Scholar] [PubMed]
  39. Zhang, J.; Sun, H.; Pan, C.; Fan, Y.; Hou, H. Optimization of Process Parameters for Directly Converting Raw Corn Stalk to Biohydrogen by Clostridium sp. FZ11 without Substrate Pretreatment. Energy Fuels 2016, 30, 311–317. [Google Scholar] [CrossRef]
  40. Vijayaraghavan, K.; Ahmad, D.; Soning, C. Bio-hydrogen generation from mixed fruit peel waste using anaerobic contact filter. Int. J. Hydrog. Energy 2007, 32, 4754–4760. [Google Scholar] [CrossRef]
  41. Lin, Y.; Wu, S.; Wang, D. Hydrogen-methane production from pulp & paper sludge and food waste by mesophilic-thermophilic anaerobic co-digestion. Int. J. Hydrog. Energy 2013, 38, 15055–15062. [Google Scholar]
  42. Yossan, S.; O-Thong, S.; Prasertsan, P. Effect of initial pH, nutrients and temperature on hydrogen production from palm oil mill effluent using thermotolerant consortia and corresponding microbial communities. Int. J. Hydrog. Energy 2012, 37, 13806–13814. [Google Scholar] [CrossRef]
  43. Mishra, P.; Roy, S.; Das, D. Comparative evaluation of the hydrogen production by mixed consortium, synthetic co-culture and pure culture using distillery effluent. Bioresour. Technol. 2015, 198, 593–602. [Google Scholar] [CrossRef]
  44. Kim, D.-H.; Kim, S.H.; Kim, K.Y.; Shin, H.S. Experience of a pilot-scale hydrogen-producing anaerobic sequencing batch reactor (ASBR) treating food waste. Int. J. Hydrog. Energy 2010, 35, 1590–1594. [Google Scholar] [CrossRef]
  45. Valdez-Vazquez, I.; Torres-Aguirre, G.J.; Molina, C.; Ruiz-Aguilar, G.M.L. Characterization of a Lignocellulolytic Consortium and Methane Production from Untreated Wheat Straw: Dependence on Nitrogen and Phosphorous Content. BioResources 2016, 11, 4237–4251. [Google Scholar] [CrossRef]
  46. Vijayaraghavan, K.; Ahmad, D.; Ibrahim, M.K.B. Biohydrogen generation from jackfruit peel using anaerobic contact filter. Int. J. Hydrog. Energy 2006, 31, 569–579. [Google Scholar] [CrossRef]
  47. Hernández-Mendoza, C.E.; Moreno-Andrade, I.; Buitrón, G. Comparison of hydrogen-producing bacterial communities adapted in continuous and discontinuous reactors. Int. J. Hydrog. Energy 2014, 39, 14234–14239. [Google Scholar] [CrossRef]
  48. Oh, Y.K.; Raj, S.M.; Jung, G.Y.; Park, S. Current status of the metabolic engineering of microorganisms for biohydrogen production. Bioresour. Technol. 2011, 102, 8357–8367. [Google Scholar] [CrossRef] [PubMed]
  49. Sivagurunathan, P.; Lin, C.Y. Enhanced biohydrogen production from beverage wastewater: Process performance during various hydraulic retention times and their microbial insights. RSC Adv. 2016, 6, 4160–4169. [Google Scholar] [CrossRef]
  50. Zhang, B.; Li, G.; Cheng, P.; Jim, T.-C.Y.; Hong, M. Landfill Risk Assessment on Groundwater Based on Vulnerability and Pollution Index. Water Resour. Manag. 2016, 30, 1465–1480. [Google Scholar] [CrossRef]
  51. Bao, M.; Su, H.; Tan, T. Biohydrogen production by dark fermentation of starch using mixed bacterial cultures of Bacillus sp and Brevumdimonas sp. Energy Fuels 2012, 26, 5872–5878. [Google Scholar] [CrossRef]
  52. Garcia-Peña, E.I.; Parameswaran, P.; Kang, D.W.; Canul-Chan, M.; Krajmalnik-Brown, R. Anaerobic digestion and co-digestion processes of vegetable and fruit residues: Process and microbial ecology. Bioresour. Technol. 2011, 102, 9447–9455. [Google Scholar] [CrossRef] [PubMed]
  53. Abubackar, H.N.; Keskin, T.; Yazgin, O.; Gunay, B.; Arslan, K.; Azbar, N. Biohydrogen production from autoclaved fruit and vegetable wastes by dry fermentation under thermophilic condition. Int. J. Hydrog. Energy 2019. [Google Scholar] [CrossRef]
Figure 1. (a) Pareto chart of standardized effects for Biogas production, and (b) Pareto chart of standardized effects for H2 production.
Sustainability 11 02139 g001
Figure 2. pH measurements at central point reactors during DF.
Sustainability 11 02139 g002
Figure 3. Acetic acid production at central point reactors during DF.
Sustainability 11 02139 g003
Table 1. Characteristics of inoculum sources.
ASGAS
pH7.207.83
TS (%)36.646.6
VS (%)28.235.4
COD (g L−1)56.266.3
TKN (g L−1)4.13.14
TS Total Solids; VS Volatile Solids; COD Chemical Oxygen Demand; TKN Total Kjeldhal Nitrogen.
Table 2. Packett–Burman experimental design matrix.
ReactorC/N RatioTemperature °CInoculum Source
12055AS
23037AS
32025AS
44025AS
54055GAS
63037GAS
72055GAS
82055GAS
94025GAS
102025AS
114025AS
122055AS
132025GAS
143037GAS
154055AS
163037GAS
173037AS
183037AS
AS: Anaerobic Sludge; GAS: Granular Anaerobic Sludge.
Table 3. Substrate characterization.
Parameter Melon (Cucumis spp.)Papaya (Papaya spp.)Pineapple (Ananas spp.)Sewage Sludge
pH 5.95 (0.15)6.3 (1.4)4.18 (0.12)7.57 (0.03)
Humidity%92.1 (1.10)89.61 (1.3)87.45 (1.9)92.43 (0.03)
TS%7.51 (1.10)10.33 (1.29)12.55 (1.92)6.38 (0.27)
VS%6.54 (0.95)8.83 (1.19)11.5 (1.86)3.96 (0.02)
TCHg Glucose 100 g−1 substrate10.4 (0.24)6 (0.14)12.5 (0.3)-
CODg g−1 sub-strate3.6 (0.5)6.9 (0.5)7.5 (0.5)133.7 (0.5) a
Proteinsmg g−1substrate3.7 (0.18)3.5 (0.18)1.8 (0.18)1180 (60) b
a g L−1; b TKN (mg L−1).
Table 4. Biogas and per H2 production bioreactor.
ReactorC/N RatioTemperature °CInoculum SourceBiogasH2
mL L−1 ReactormL L−1 ReactormL g−1VS
12055AS268--
23037AS1556223-
32025AS700--
44025AS875-
54055GAS1025--
63037GAS222536621.52
72055GAS787846.24
82055GAS787--
94025GAS713363.24
102025AS700--
114025AS567--
122055AS331--
132025GAS700201.6
143037GAS221536530.6
154055AS3625
163037GAS222536728.67
173037AS1556223-
183037AS1558212-
Table 5. Gompertz equation coefficients for hydrogen production at different C/N ratio evaluations.
ReactorRatio C/NTemperature °CHmax mL L−1Rm mL L−1 h−1λ hr2
R9402517.55.023<0.90
R132025330.7211.0
R14303786.6 2.6 1.950.99
R7205526.91.9200.7
R54055n.c.n.c.n.c.n.c.
n.c. = not calculated.
Table 6. Dark fermentation (DF) control parameters.
Reactor R4R5R6R7R8R9R13R14R16
pHI05.55.55.55.55.55.55.55.55.5
F3.754.275.14.264.244.33.85.15.1
COD g L−1I060.449.144.334.634.368.739.744.344.3
F30.127.321.914.71831.719.121.723.6
TCH mg glucose L−1I0217721562500755910231288925002500
F798882123541154092264012501200
Ethyl alcohol %v/vI054.73.933.34.73.355
F4.453.41.31.94.53.73.53.5
SV g L−1I045.745.547.346.946.345.346.147.347.3
F31.736.830.333.4533.934.234.135.434.5
Acetic acid mg L−1I0800880680880960960560800800
F300043203600212024001880140035803600
I0 = Initial value; F = Final value.
Table 7. Comparison of the hydrogen yield (HY) from different codigestion studies.
Reactor Operation ModeType of Substrate or CodigestionInoculum/PretreatmentConditionsH2 Yield mL H2 gVS−1% COD RemovalReference
BatchFruit–Vegetable wasteAnaerobic digester sludge, HSTC/N = Not reported
pH = 5.5 *
T = 35 °C
V = 0.5 L
37 g COD L−1
6025[34]
BatchCheese whey—fruit vegetables wasteAnaerobic digester sludge, HSTC/N = 21,
pH = 5.5 *
T = 37 °C
V = 2 L
144.133 g COD L−1
449.8 mL H2 g−1 COD16[17]
CSTRFood wasteEnriched mixed culture, without HSTC/N = 15
T = 39 °C,
pH = 6.5 *
4.5 L
89.8Not reported[52]
BatchOrganic Fraction of Municipal Solid Waste–Food WasteCow manure, without HSTC/N = Not reported
pH = 4.0
T = 30 °C
V = 0.125 L
100 g vs. Kg−1
14Not reported[53]
BatchFruit Peels–Sewage SludgeGAS, HSTC/N = 30
pH = 5.5
T = 37 °C
V = 0.1 L
44.3 g COD L−1
2550%This work
* pH control; HST = Heat Shock Treatment; CSTR = Continuous Stirred-Tank Reactor.

