Article

An Empirical Analysis of Brand as Symbol, Perceived Transaction Value, Perceived Acquisition Value and Customer Loyalty Using Structural Equation Modeling

1
Department of Food & Beverage Management, Toko University, Puzi 61363, Taiwan
2
Department of Wood-Based Materials and Design, National Chiayi University, Chiayi 60004, Taiwan
3
Department of Visual Communication Design, Ming Chi University of Technology, New Taipei 24301, Taiwan
*
Authors to whom correspondence should be addressed.
Sustainability 2019, 11(7), 2116; https://doi.org/10.3390/su11072116
Submission received: 3 March 2019 / Revised: 1 April 2019 / Accepted: 2 April 2019 / Published: 9 April 2019
(This article belongs to the Section Economic and Business Aspects of Sustainability)

Abstract

:
Today consumers’ demands and choices of products or services are constantly changing rapidly in the internet environment of information technology. The markets emphasize quality, service, and customization, which has been changing the consumption patterns in the decision-making process or companies’ production patterns. The enterprises are essential to respond the changes of the consumption side and production side in order to achieve sustainable development. Moreover, it is important to focus on the relationship of interaction with consumers. This study was intended to explore the influence of brand as symbol on consumer behavior to understand the relations between brand as symbol, perceived transaction value, perceived acquisition value, message-response involvement, and customer loyalty. The empirical analysis is performed by using Structural Equation Modeling (SEM), including measurement and structural models. The measurement models are examined with Confirmatory Factor Analysis (CFA) to identify the relations between latent variables and observed variables whereas the structural models are used to find out the relations between latent variables. Meanwhile, path analysis is adopted to understand the influence between the variables. A questionnaire survey was carried out on customers of chain beverage stores in the Chiayi area through convenient sampling 400 copies were administered and 387 valid samples were retrieved. The response rate was 97%. The results indicate that brand as symbol has significant positive influence on perceived transaction value, perceived acquisition value, and customer loyalty. This means brand as symbol alone can have an effect on customer loyalty and will not be influenced by the level of message-response involvement. This conclusion can be applied to help brand managers to establish close relations with consumers when performing brand design.

1. Introduction

Today, brand management has become an important direction in management development for enterprises around the world. In the internet environment of information technology, consumers′ demands and choices of products or services are constantly changing rapidly. The markets emphasize quality, service, and customization, this has been changing the consumption patterns of consumers in the decision-making process or companies’ production patterns. For the sustainable development of enterprises, it is necessary to understand the change in the consumption side and production side, and more focused on the relationship of interaction with consumers. In brand design, symbols are important elements in brand management and image building. A brand designer able to make the symbol of a brand more precise will be more likely to create the sense of brand value in consumers and strengthen brand image. Wang [1] points out, in the field of design, brand identity plays a very important role in the creation of brand value and brand symbols can help brand managers express the value of their brands. The semantics of design should focus on communication and interaction with consumers. Krippendorff and Butter [2] suggest symbols in design semantics and the ways they are presented will have an effect on user perceptions and preferences. Therefore, brand symbol design is extremely important because it sets the direction of management. Many scholars [3,4,5] propose the idea that brand identity can help enterprises connect to consumers. Haghighi et al. [6] believe customer loyalty is the key to success and profitability for restaurant businesses [7]. How to increase customer loyalty has become a hot issue for business operators and scholars [8]. Hence, enterprises can enhance their brand design by using good brand symbols to attract consumers. In related studies conducted in the past, most researchers [9,10,11] focused on brand image, brand equity, and brand personality. It is few worked on brand symbols. This study is principally intended to discuss and understand the influence of brand symbols on consumer behavior and to offer the results as references for brand designers and managers.

2. Literature Review

2.1. Brand as Symbol

Brand identity leads to unique brand association and allow brand designers and managers to create and strengthen brand positioning [12]. Establishment of brand image relies on the performance of marketing. Identity, advertising, and public relations can all be adopted as communication interfaces to create brand symbols and convey the ideas associated with the brand name [1]. Park et al. [13] put forth the concept of forming brand image through the functional, symbolic, and experiential aspects. Chang et al. [14] conclude in their study that recognition and rating of brands are mainly the result of the symbolic meanings the brand emphasizes. It is better for enterprises to diversify their strategies in order to fully utilize the advantages of brand association. The idea of brand as symbol proposed by Aaker [12] refers to consumers’ recognition of the value of a brand, including the image and content of the brand perceived by consumers, the extended spirit behind the brand, and expression of customers’ self-image.

2.2. Perceived Value

Perceived value has been considered by many scholars as an important factor in consumers’ choice of products and purchasing behavior [15,16,17]. McDougall and Levesque [18] pointed out perceived value can be regarded as the profit consumers gain from the difference between the cost and what is actually acquired. In addition, many scholars concur the concept of “perceived acquisition value” is the perception of the net gain from a product or service and the concept of “perceived transaction value” is the level of satisfaction or pleasant feeling derived from the transaction [19]. The perceived value of consumers includes evaluation between expected value and gained value while customer learning, perception, preferences, and evaluation are emphasized [20]. A satisfaction and loyalty survey reveals the definition of perceived value is the overall value perceived by users after browse a website. Understanding perceived value can facilitate enterprises to improve customer satisfaction and loyalty [21].

2.3. Message-Response Involvement

Message-response involvement refers to the level of interest consumers feel when receiving and processing advertising messages. It is also called advertising involvement [22]. Zaichkowsky [23] suggests advertising involvement will cause consumers to have more arguments or viewpoints about advertising messages. The study by Yang and Kuo [24] reveals the level of consumers’ advertising involvement has influence on the effect of advertisements. Cheng [25] proposes the level of interest of consumers in processing marketing messages and the degree such messages are processed are a kind of message involvement. When message involvement is not high, it means consumers are not interested in the advertising or marketing activity and will process the advertising in a simple way or just look the other way. Therefore, the level of consumers’ involvement can be extremely low or extremely high. In their study of the influence of message presentation approaches and consumers’ involvement levels on the willingness to make purchases. Using statistics to present negative messages and stories to convey messages, Hsu et al. [26] achieve the conclusion that consumers with higher involvement are more willing to make purchases than consumers with lower involvement.

2.4. Consumer Loyalty

Haghighi et al. [6] mentions consumer loyalty is one important factor enterprises need to take into consideration when determining their marketing strategies. Hallowell [7] points out there are two definitions of customer loyalty in marketing literature from the past. The first one defines loyalty as an attitude, the overall feeling created in personal perception toward a product, service, or organization. The other defines loyalty as something to be assessed according to behavioral performance [27], including continued service purchases, better relations, or recommendation. Jones and Sasser [28] propose, in the broad sense, customer loyalty refers to the feeling of consumers about an enterprise and its products or services and this emotion is expressed in their behavior. Hence, customer loyalty is the perception of customers that they are willing to purchase again, recommend to others and spend more money [29].

3. Study Methods

3.1. Study Framework

The study framework is showed in the Figure 1.

3.2. Study Hypotheses

Dodds et al. [17] reveal that consumers apply the information of brand names to search and recall, and obtain perceived value. Moreover, Ryu et al. [30] indicate that the image of the restaurant has significant impact on perceived value. Cretu and Bordie [31] point out in their study that brand image has positive influence on perceived value and customer loyalty. Prior researches have discovered perceived value as an important determinant of customer loyalty. Yang and Peterson [32] have proposed that companies should focus primarily on perceived value in order to acquire customer loyalty. Research reports showed that restaurants strengthen customer loyalty by improving price perception, and customer satisfaction [29]. Based on the results of literature review, the following hypotheses are proposed in this study:
H1:
Brand as symbol has significant positive influence on perceived transaction value.
H2:
Perceived transaction value has significant positive influence on customer loyalty.
H3:
Brand as symbol has significant positive influence on perceived acquisition value.
H4:
Perceived acquisition value has significant positive influence on customer loyalty.
H5:
Brand as symbol has significant positive influence on customer loyalty.
H6:
Message-response involvement has a mediating effect between brand as symbol and customer loyalty.

3.3. Operational Definition and Measurement of Variables in the Study

3.3.1. Brand as Symbol

This study is conducted mainly in accordance with the concept of brand as symbol put forth by Aaker [12] to suggest consumers’ identification with brand value mainly includes consumers’ recognition of the image and content associated with a brand, the extended brand spirit and expression of customers’ self-image. The visual image also has the two aspects of metaphor and brand name continuity which can be applied as measurement indexes. The items to be measured include (1) I think the brand of the store symbolizes a kind of taste which allows me to express myself; (2) the content of the brand of the store conveys a brand spirit; and (3) the visual effect of the brand of the store feels good to me. The results of measurement of these items can indicate what consumers think of the design of brand as symbol for a store.

3.3.2. Message-Response Involvement

Message-response involvement is the level of interest of consumers after receiving and processing advertising messages. Zaichkowsky [23] proposes the idea of adopting the structure of involvement to develop a personal involvement inventory (PII) to include ten items, namely important, interesting, suitable, exciting, means a lot to me, appealing, fascinating, valuable, involving and needed, to understand the level of interest of consumers after they receive and process advertising messages.

3.3.3. Perceived Value

Based on the ideas of earlier researchers, Grewal et al. [19] propose perceived acquisition value is the perception about the net gain from a product or service. Meanwhile, perceived transaction value is the level of satisfaction or pleasant feeling derived from a transaction. The questionnaire in this study is designed in reference to the study by Grewal et al. [19], including three questions associated with perceived transaction value and nine with perceived acquisition value, to measure the perceived acquisition value and perceived transaction value of consumers.

3.3.4. Customer Loyalty

The definition of customer loyalty in this study and the corresponding questions in the questionnaire are established in reference to the study by Han and Ryu [29] to evaluate how consumers feel about the beverage store in a certain area and whether they will visit the same beverage store again and spend more money, recommend them to others, and show their loyalty. To understand the loyalty of consumers, the items measured include “I will come again at this beverage store”; “I will recommend this beverage store to friends or other people”; and “I am willing to spend more than my budget in this beverage store”.

3.4. Study Design

The questionnaire survey was carried out on consumers shopping at chain beverage stores in the Chiayi area. Convenient sampling was adopted in this study. Four hundred questionnaire copies were administered and 389 valid copies were retrieved, making the response rate 97%. The operational definition of the variables and assessment of questionnaire result were decided in reference to the literature reviewed. A 7-point Likert scale was designed, including “Agree very much” 7 points, “Agree” 6 points, “Kind of agree” 5 points, “Do not agree or disagree” 4 points, “Kind of disagree” 3 points, “Disagree” 2 points, and “Disagree very much” 1 point.
The Cronbach’s α is adopted as the reliability indicator in the reliability tests conducted on the scale to check the internal reliability of each dimension. A reliability test is performed to find out whether a certain level of consistency exists in the results of the test scale. Before the questionnaire survey was officially administered, a preliminary test was carried out to ascertain whether the semantics and questions of the questionnaire were appropriate and make necessary revisions and adjustments to finalize the questionnaire. 100 copies of questionnaire were administered for the preliminary test and the Cronbach’s α was adopted to test the internal reliability of each dimension.
According to the criteria established by Nunnally [33], when the Cronbach’s α value is larger than 0.7, it means the reliability of the questionnaire contents is decent. The results of the preliminary test indicated the Cronbach’s α value of brand as symbol was 0.892, the Cronbach’s α value of perceived acquisition value 0.895, the Cronbach’s α value of perceived transaction value 0.881, the Cronbach’s α value of message-response involvement 0.947 and the Cronbach’s α value of customer loyalty 0.72. All of them were larger than 0.7, indicating the reliability of the contents of the questionnaire was decent.

3.5. Analytic Methods Used in the Study

Structural Equation Modeling (SEM), mainly including measurement and structural models, is applied to perform empirical analysis in this study. Confirmatory factor analysis, which can be applied independently and is therefore one of the most valuable instruments in quantitative analysis, is used on the measurement models to understand the relations between the latent variables and observed variables and test the accuracy of the latent variable scale to assure the measurement can correctly reflect the characteristics of the latent variables and set the basis for subsequent advanced statistical tests on reliability and validity and confirm the effectiveness of the theory. As for the structural models, they are adopted to examine the relations between latent variables, path analysis in other words, to analyze the influence between the variables and the results.

4. Data Analysis

4.1. Analysis Using Descriptive Statistics

Among the 389 people surveyed, there were 201 males, 51% of the total samples, and 188 females, 48.3% of the total samples. 120 people, 30.8%, ranged between 25 and 34 years old, forming the largest age group. In educational background, 216 people had college or higher degrees, accounting for 55.5% of the total samples. Also, 216 people made less than NT$20,000 a month, making up 31.4% of the total samples.

4.2. The Pearson Correlation Test

The larger the absolute value of the Pearson correlation coefficient, the stronger the level of correlation is. The test results indicate the significance of brand as symbol, perceived transaction value, perceived acquisition value, message-response involvement, and customer loyalty is p < 0.01, meaning the correlations between the variables are significantly positive. The correlation coefficient between the brand as symbol and perceived acquisition value is 0.722, the largest, followed by the 0.646 between perceived transaction value and customer loyalty, the 0.616 between perceived acquisition value and customer loyalty, the 0.601 between the brand as symbol and customer loyalty, the 0.517 between perceived acquisition value and message-response involvement, the 0.568 between the brand as symbol and perceived transaction value, the 0.564 between perceived transaction value and perceived acquisition value, the 0.508 between the brand as symbol and message-response involvement, the 0.409 between perceived acquisition value and message-response involvement, and the 0.380 between message-response involvement and customer loyalty.

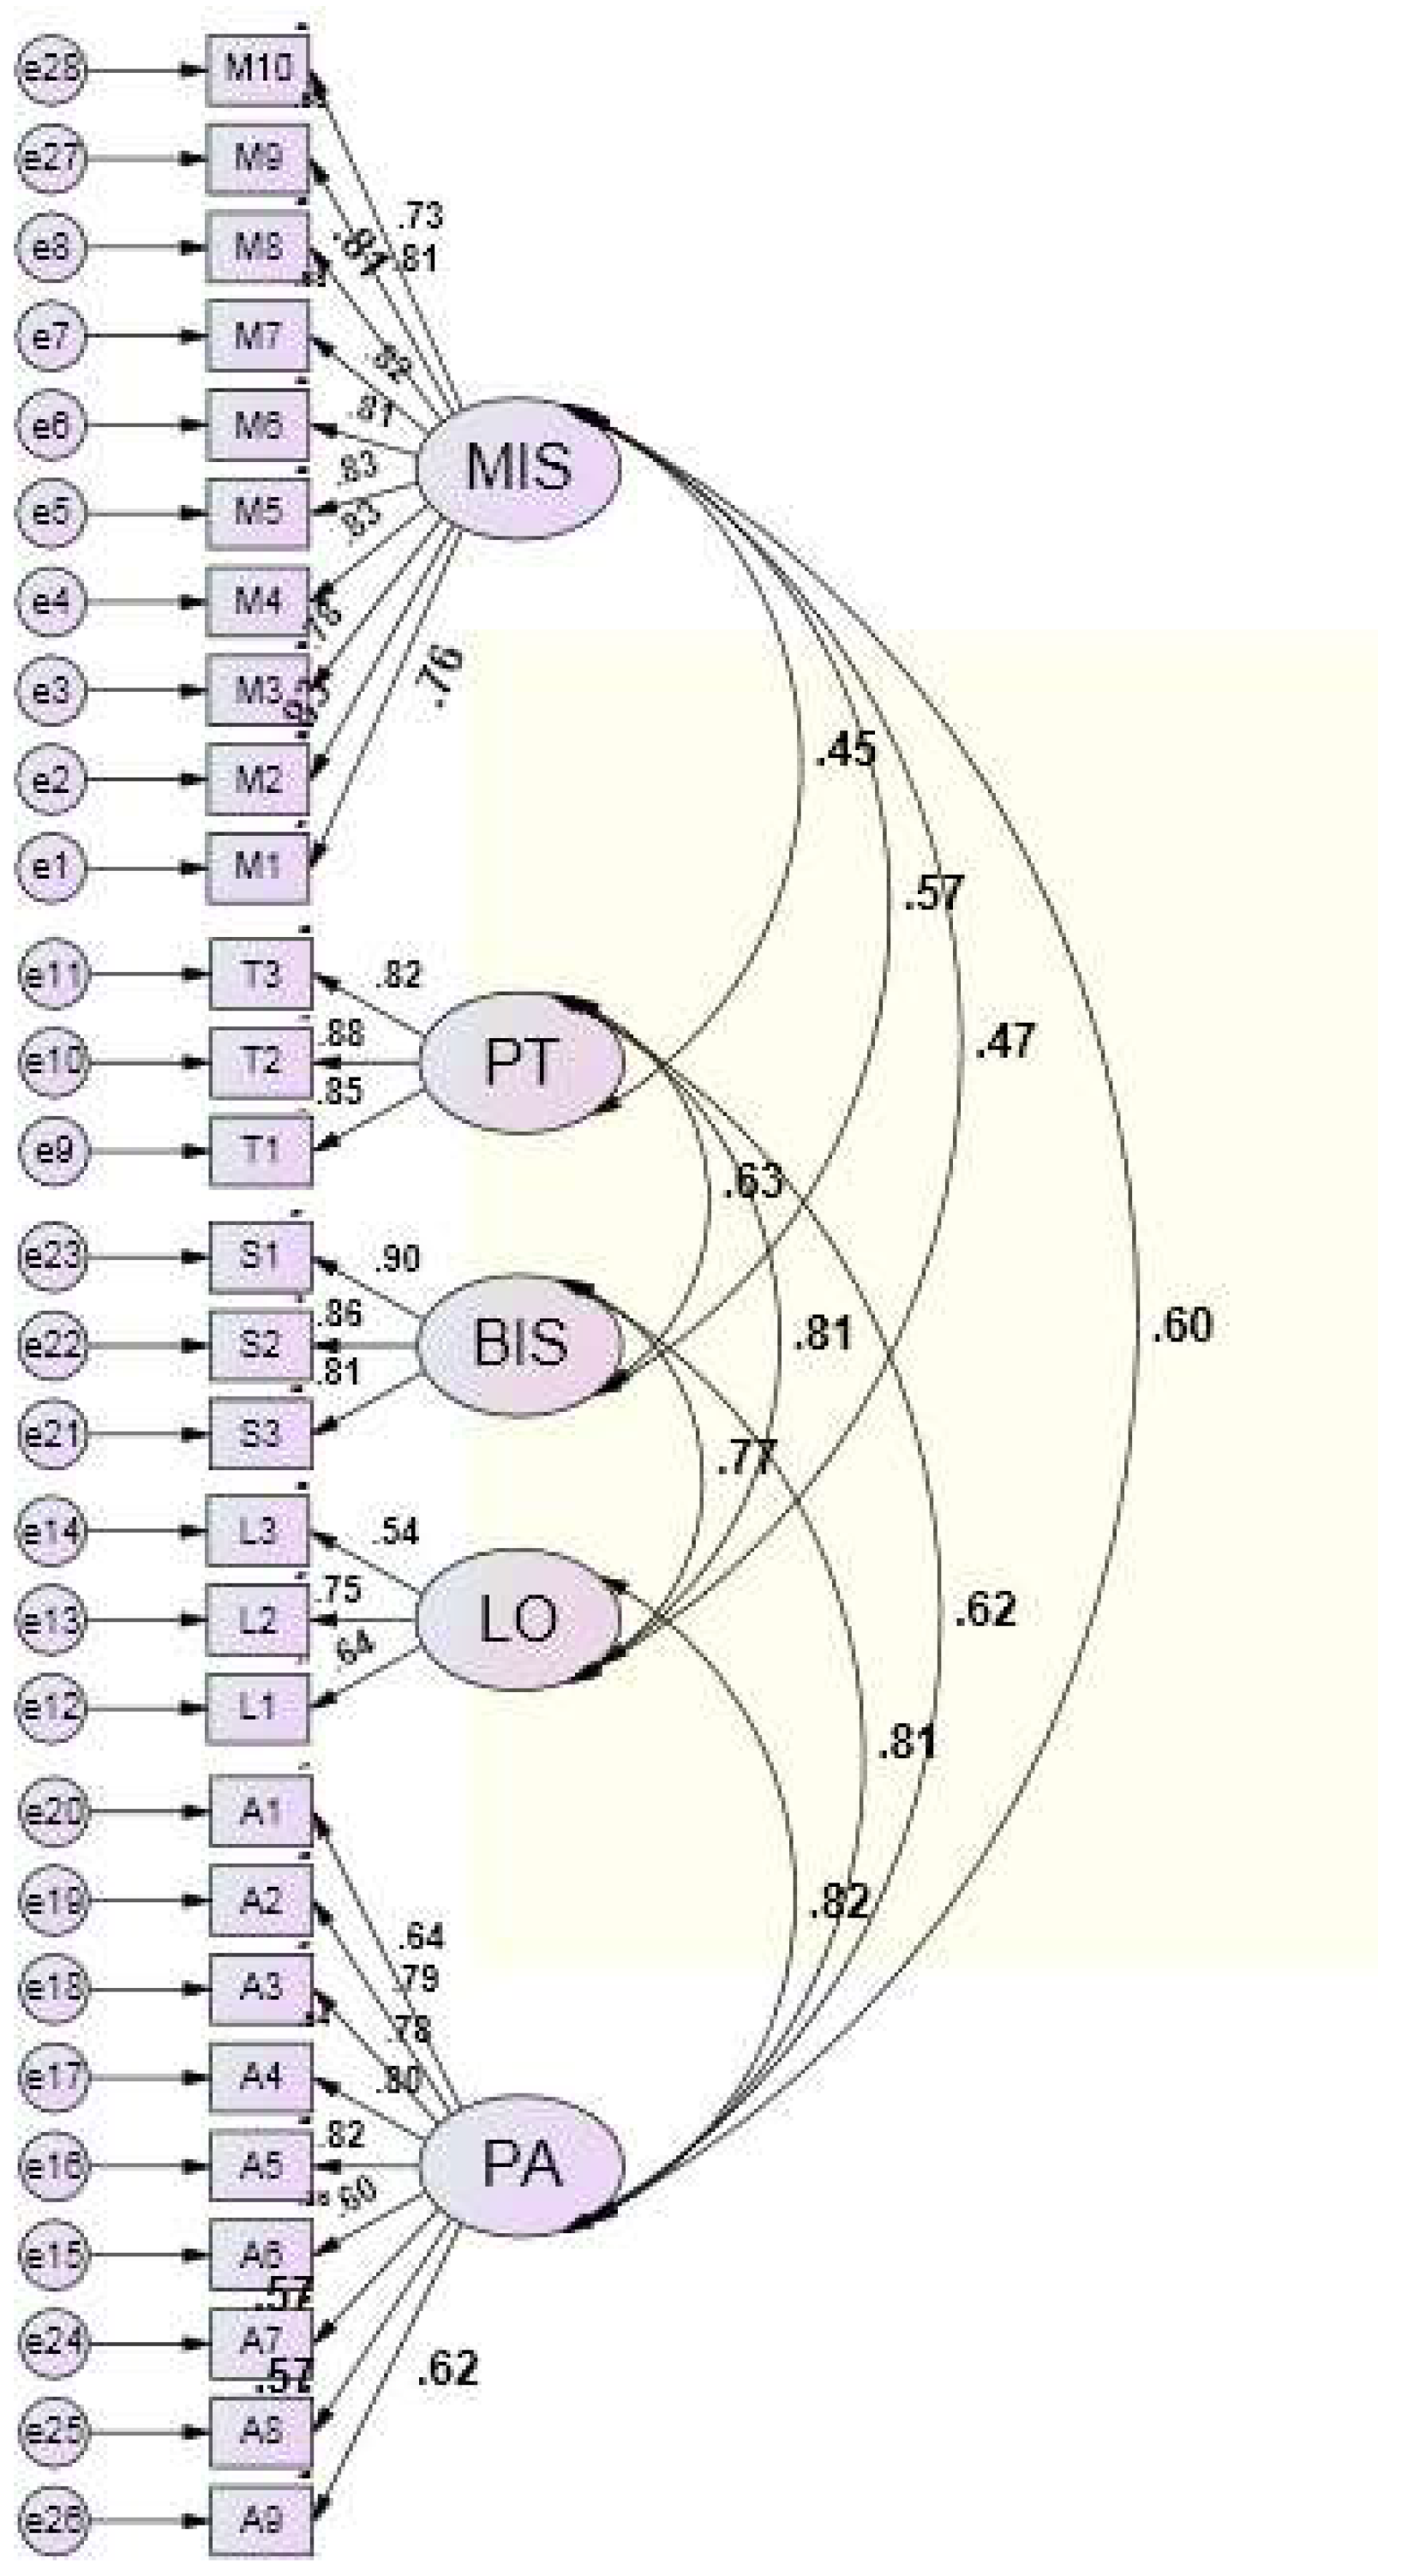
4.3. Confirmatory Factor Analysis

The main function of confirmatory factor analysis (CFA) is to understand the relations between latent variables and observed variables. Tests are conducted on the “covariance matrix of the hypothetical model and the covariance matrix of the samples to examine the hypothetical relations between the measured variables and latent variables. CFA is one of the most valuable functions of SEM. For this reason, it is initially applied to test the measurement models. Generally, the factor loading should be larger than 0.7. A value of 0.6 is acceptable, but the question should be deleted if the value is smaller than 0.5. As shown in Figure 2 and Table 1, the factor loading of each question complies with the standard. Hence, convergent validity exists and there is no need to delete any question.

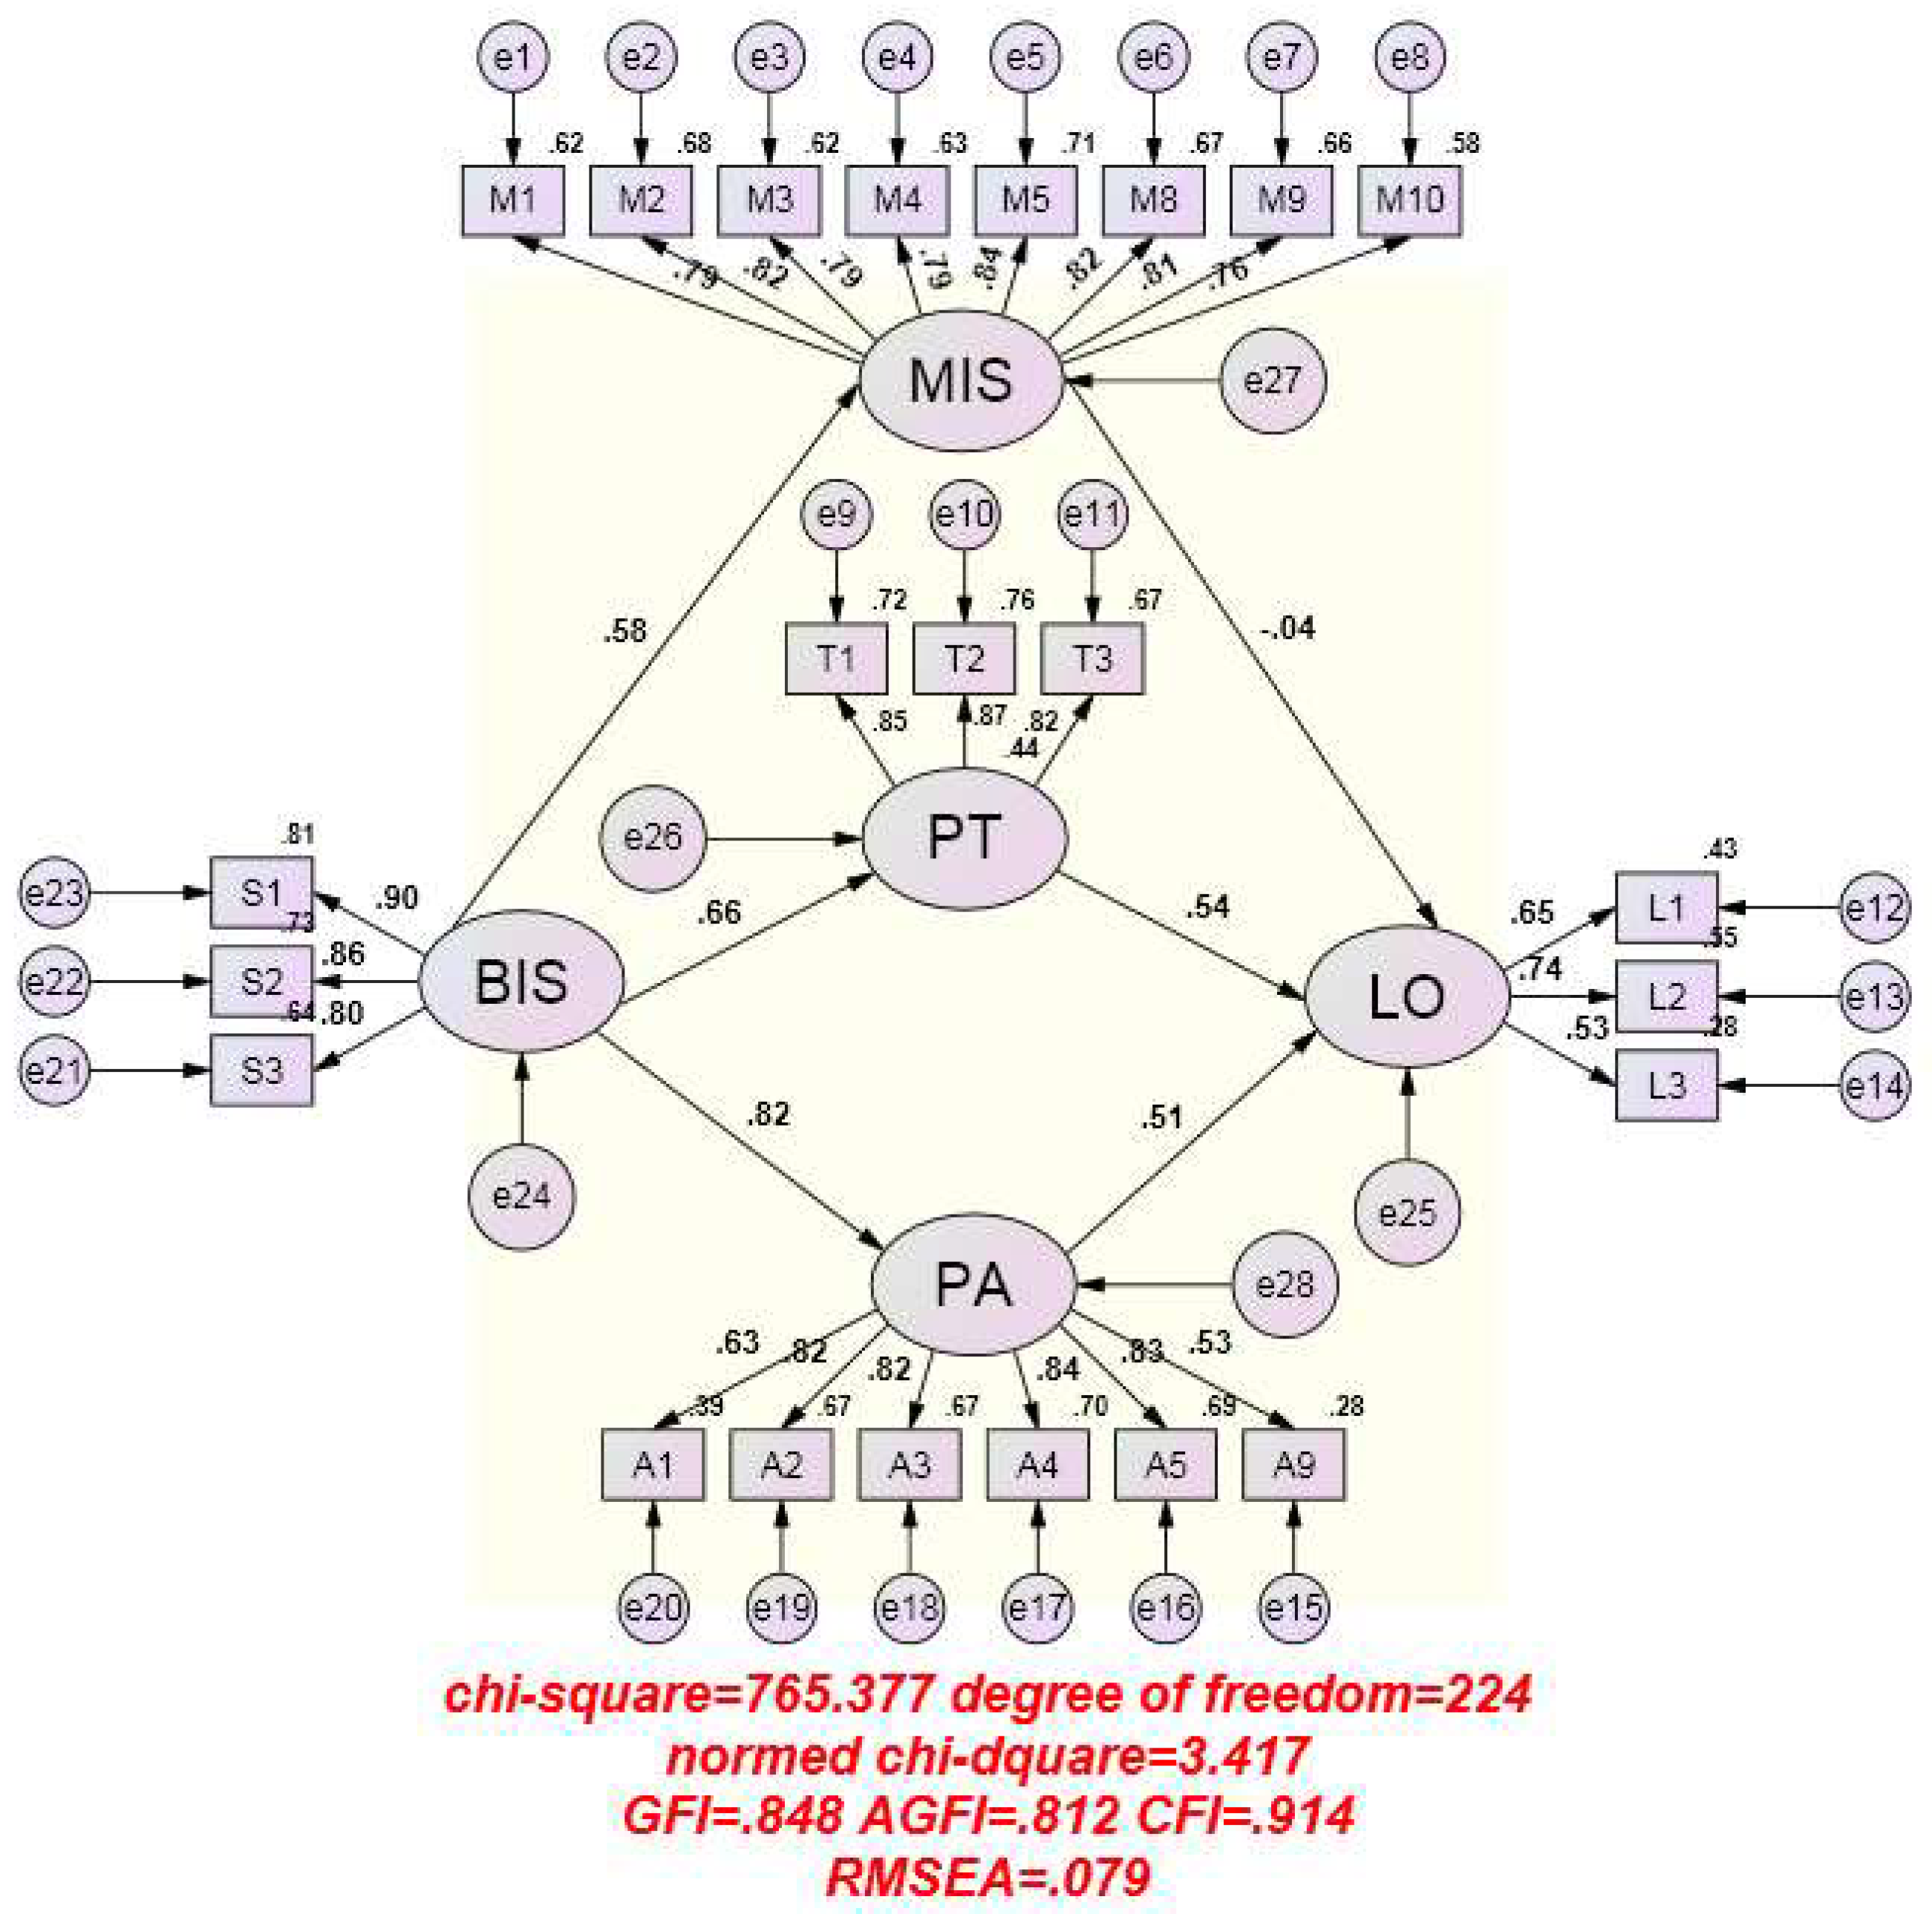
4.4. SEM Goodness-of-Fit Analysis

The goodness-of-fit test performed on the SEM hypothetical models proves the measurement indices can reflect the characteristics of the latent variables, as shown in Figure 3. Hence, the SEM goodness of fit, including brand as symbol, perceived acquisition value, perceived transaction value, message-response involvement, and customer loyalty, is χ2/df = 4.566. RMSEA = 0.96; GFI = 0.747; AGFI = 0.701; CFI = 0.848. Overall, the SEM goodness of fit in this study is close to the general goodness-of-fit index, meaning the models can still use some modification. When the models are modified to improve the goodness of fit, it appears the modification indices of M6, M7, A6, A7, and A8 are rather high and these questions are therefore deleted to decrease the chi-square value and improve the goodness of fit. After modification and deletion, the goodness of fit of the models becomes rather decent. χ2/df = 3.417, meeting the standard of falling between 1 and 5. RMSEA = 0.079, complying with the standard of being smaller than 0.08; GFI = 0.848, larger than the 0.8 index; AGFI = 0.812, larger than the 0.8 index; and CFI = 0.914, larger than the 0.9 index, as shown in Table 2. The post-modification goodness of fit is rather decent and no further modification is required.

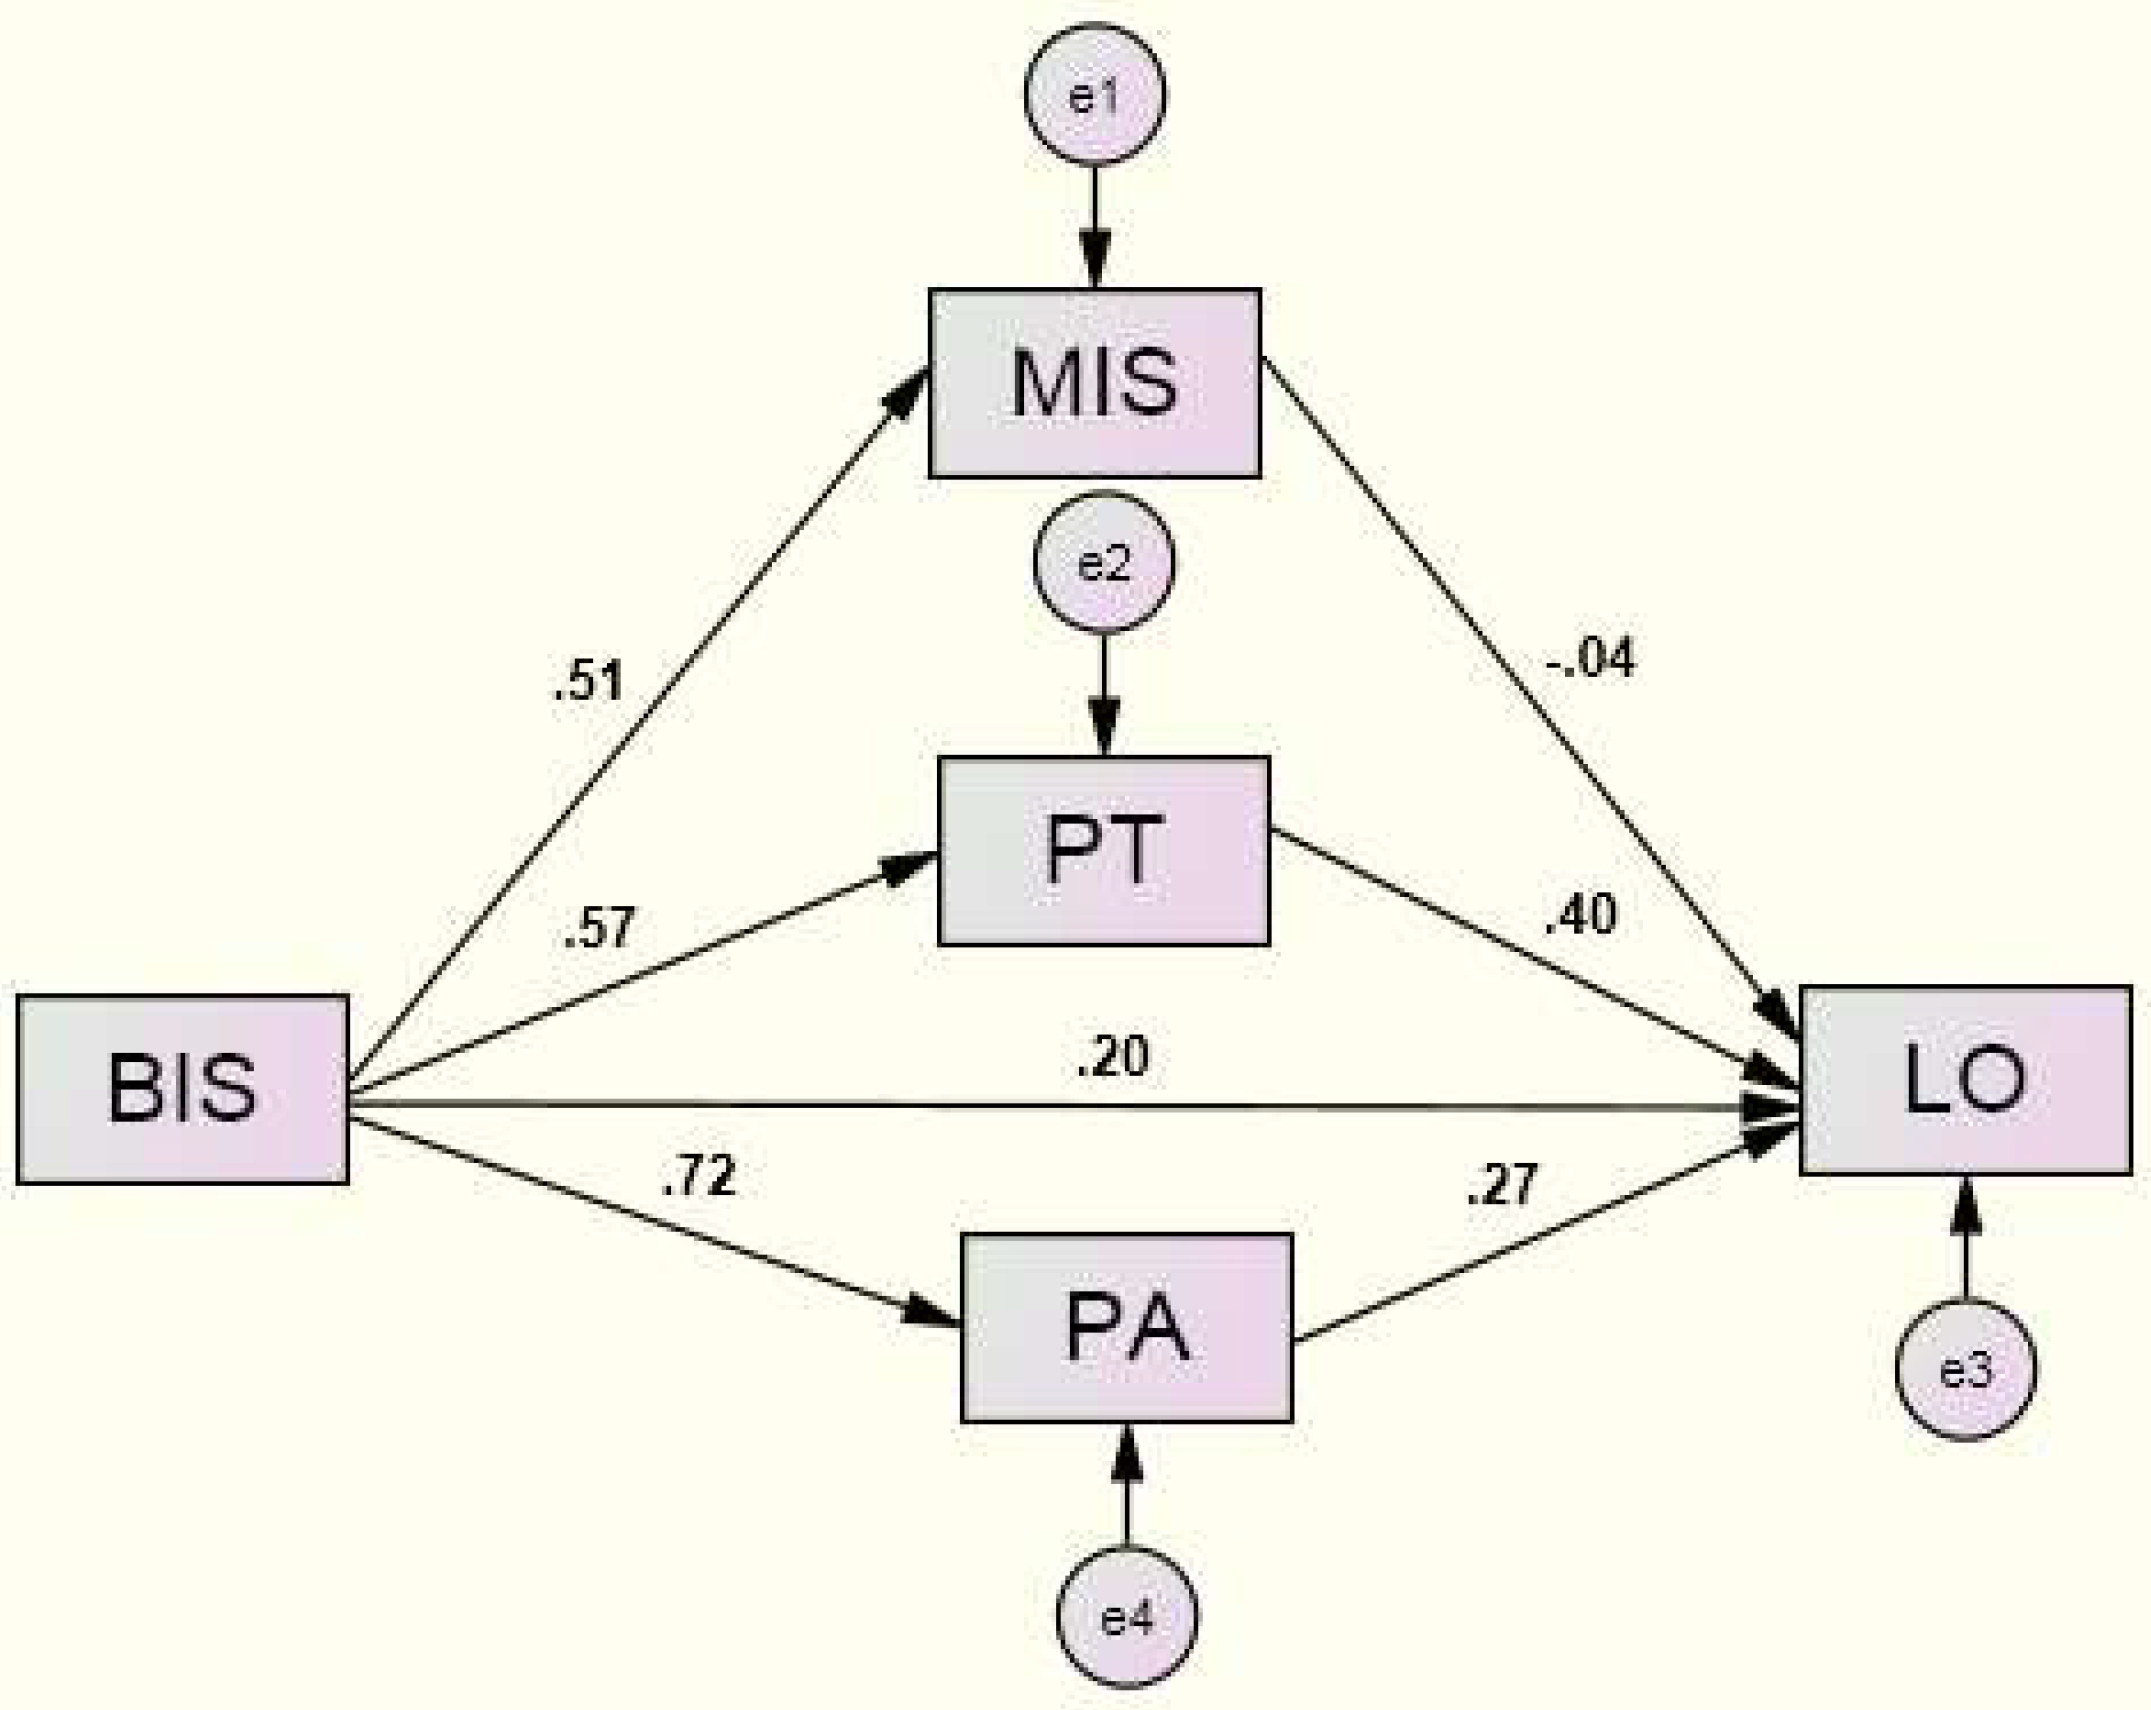
4.5. Path Analysis of Brand as Symbol, Perceived Transaction Value, Perceived Acquisition Value, Message-Response Involvement and Customer Loyalty

As shown in Table 3 and Figure 4, Tests conducted reveal the path coefficient β of brand as symbol → perceived transaction value is 0.57 and the significance value p < 0.00, indicating the influence of brand as symbol on perceived transaction value is positive and achieves significance, and H1 is valid.
The path coefficient β of perceived transaction value → customer loyalty is 0.4 and the significance value p < 0.001, meaning the influence of perceived transaction value on customer loyalty is positive and achieves significance, and H2 is valid. The path coefficient β of brand as symbol → perceived acquisition value is 0.72 and the significance value p < 0.001, suggesting the influence of brand as symbol on perceived acquisition value is positive and achieves significance, and H3 is valid. The path coefficient β of perceived acquisition value → customer loyalty is 0.27 and the significance value p < 0.001, meaning the influence of perceived acquisition value on customer loyalty is positive and achieves significance, and H4 is valid. The path coefficient β of brand as symbol → customer loyalty is 0.20 and the significance value p < 0.001, meaning the influence of brand as symbol on customer loyalty is positive and achieves significance, and H5 is valid.
Tests are also conducted to examine whether message-response involvement has any mediating effect between brand as symbol and customer loyalty. Based on the results of path analysis of each dimension, the effect of independent variable brand as symbol on message-response involvement is first tested. It turns out p < 0.001, showing significance. Subsequent examination of the effect on the dependent variable customer loyalty also indicates p < 0.001, meaning there is significant influence. However, the effect of message-response involvement on customer loyalty does not achieve significance, p = 0.319 > 0.05. Therefore, the influence of brand as symbol on customer loyalty includes the direct effect BS→LO 0.146 and the indirect effect 0.015 “0.535*(−0.028)” In the meantime, as the influence of MIS on LO is not significant, message-response involvement has no mediating effect. Hence, H6 is not valid.

5. Conclusions and Discussion

The results of this study indicate brand as symbol has significant positive influence on perceived transaction value; perceived transaction value has significant positive influence on customer loyalty; brand as symbol has significant positive influence on perceived acquisition value; perceived acquisition value has significant positive influence on customer loyalty; and brand as symbol has significant positive influence on customer loyalty. This conclusion is consistent with the concept established in the studies by Park et al. [13] and Wang [1] that development of brand image relies on different types of marketing performance. Identity design can be adopted by businesses as the communication interface to create brand symbols and convey the ideas behind the brand. Roy and Banerjee [34] also suggest enterprises need to establish brand identity when marketing their brands to shape the information and image they intend to convey in the minds of consumers and assure customers can keep a decent impression of their brands. Consumers’ recognition and rating of brand symbols are the result of the symbolic meanings of a brand; therefore, correct use of brand association can lead to advantages of higher levels [14]. Ku et al. [21] believe studying and understanding users’ perceived value can help businesses improve customer satisfaction and loyalty. In addition, Haghighi et al. [6] point out in their study consumer perception can influence customer trust and customer satisfaction can have an effect on customer loyalty. The study on the relations between recognition of store’s brands and customers’ shopping behavior by Park and Kim [35] reveals that restaurant brand identity has significant influence on consumers’ willingness to visit the same restaurants again. However, understanding and developing consumer loyalty has become a major issue for practitioners and academics [36]. The results of this study indicate brand as symbol has significant positive influence on perceived transaction value, perceived acquisition value, and customer loyalty. However, as the mediating effect of message-response involvement between brand as symbol and customer loyalty is not significant, it means brand as symbol alone can influence customer loyalty without being subject to the level of consumers’ message-response involvement. In other words, when engaging in brand design, brand managers need to emphasize the important elements in brand as symbol to improve customer loyalty and maintain profitability and achieve management targets. The outcome of this study can help brand managers establish closer relations with consumers when performing brand design.

5.1. Managerial Implications

In this study, it can be found that the enterprises can obtain the consumer′s favorite through the design of brand as symbol. Furthermore, the brand design manager can use the brand as symbol to inspire and represent the brand value. The semantic meaning of the design should be more focused on the relationship between the consumer’s communications. In the model of marketing, the enterprises enhance customer loyalty by delivering brand as symbol to consumers’ perceived transaction value and perceived acquisition value, which can be strengthen the creation of brand design.

5.2. Research Limitations and Future Research Directions

This study uses a questionnaire survey to conduct an analysis of the impact of brand as symbol, perceived transaction value, perceived acquisition value, and customer loyalty. Therefore, the conclusions and recommendations of this study are not fully applicable to other regions. It can also be explored in other relevant fields to understand consumers in other different areas by brand as symbol, perceived transaction value, perceived acquisition value, and customer loyalty using Structural Equation Modeling in the future research.

Author Contributions

H.N.L. designed the model, analysed the data and carried out the implementation. H.N.L. and A.S.L. performed the calculations. A.S.L. and Y.W.L. helped shape the research, and analysed the data. All authors provided critical feedback and discussions.

Funding

This research received no external funding.

Conflicts of Interest

The authors declare no conflict of interest.

References

  1. Wang, K.T. The Application of Similarity Association for Brand Symbolism Design: Vividö Brand Symbolism. J. Des. Stud. 2007, 10, 53–71. [Google Scholar]
  2. Krippendorff, K.; Butter, R. Product Semantics-Exploring the Symbolic Qualities of Form. Innovation 1984, 3, 4–9. [Google Scholar]
  3. Kotler, P.; Keller, K.L. Marketing Management, 12th ed.; Pearson Prentice Hall: Upper Saddle River, NJ, USA, 2006. [Google Scholar]
  4. Aaker, D. Improve your brand ID. Mark. News 2010, 44, 12. [Google Scholar]
  5. Azoulay, A.; Kapferer, J.N. Do brand personality scales really measure brand personality? Brand Manag. 2003, 11, 143–155. [Google Scholar] [CrossRef]
  6. Haghighi, M.; Dorosti, A.; Rahnama, A.; Hoseinpour, A. Evaluation of factors affecting customer loyalty in the restaurant industry. Afr. J. Bus. Manag. 2012, 6, 5039–5046. [Google Scholar]
  7. Hallowell, R. The relationships of customer satisfaction, customer loyalty, and profitability: An empirical study. Int. J. Serv. Ind. Manag. 1996, 7, 27–42. [Google Scholar] [CrossRef]
  8. Heskett, J.L.; Jones, T.O.; Loveman, G.W.; Sasser, W.E.; Schlesinger, L.A. Putting the service-profit chain to work. Harv. Bus. Rev. 1994, 72, 164–174. [Google Scholar]
  9. Bian, X.; Moutinho, L. The role of brand image, product involvement, and knowledge in explaining consumer purchase behaviour of counterfeits: Direct and indirect effects. Eur. J. Mark. 2011, 45, 191–216. [Google Scholar] [CrossRef]
  10. Bruwer, J.; Buller, C. Country-of-origin (COO) brand preferences and associated knowledge levels of Japanese wine consumers. J. Prod. Brand Manag. 2012, 21, 307–316. [Google Scholar] [CrossRef]
  11. Aaker, J.L.; Benet-Martinez, V.; Garolera, J. Consumption symbols as carriers of culture: A study of Japanese and Spanish brand personality constucts. J. Pers. Soc. Psychol. 2001, 81, 492–508. [Google Scholar] [CrossRef] [PubMed]
  12. Aaker, D.A. Building Strong Brands; The Free Press—A division of Simon & Schuster Inc.: New York, NY, USA, 1996. [Google Scholar]
  13. Park, C.W.; Jaworski, B.J.; Maclnnis, D.J. Strategic brand concept-image management. J. Mark. 1986, 135–145. [Google Scholar] [CrossRef]
  14. Chang, H.H.; Hsu, T.K.; Chiu, C.W. The Effect of Functional and Symbolic Brand Concept on Brand Extension Evaluation. Manag. Inf. Comp. 2017, 6, 44–51. [Google Scholar]
  15. Aufahrt, H.; Franz, H. The Evolution of Loyalty Intentions. J. Mark. 2006, 70, 122–132. [Google Scholar]
  16. Zeithaml, V.A. Consumer Perceptions of Price, Quality, and Value: A Means-End Model and Synthesis of Evidence. J. Mark. 1988, 52, 2–22. [Google Scholar] [CrossRef]
  17. Dodds, W.B.; Monroe, K.B.; Grewal, D. Effects of price, brand, and store information on buyers’ product evaluations. J. Mark. Res. 1991, 28, 307–319. [Google Scholar]
  18. McDougall, G.H.G.; Levesque, T. Customer satisfaction with services: Putting perceived value into the equation. J. Serv. Mark. 2000, 14, 392–410. [Google Scholar] [CrossRef]
  19. Grewal, D.; Monroe, K.B.; Krishnan, R. The effects of price-comparison advertising on buyers’ perceptions of acquisition value, transaction value, and behavioral intentions. J. Mark. 1998, 62, 46–59. [Google Scholar]
  20. Woodruff, R.B. Customer value: The next source for competitive advantage. J. Acad. Mark. Sci. 1997, 25, 139–153. [Google Scholar] [CrossRef]
  21. Ku, Y.C.; Li, C.Y.; Huang, H.L. Is Service Quality Enough? The Impact of Customer Experience on Website Satisfaction. Sun Yat-Sen Manag. Rev. 2013, 21, 479–509. [Google Scholar]
  22. Lin, J.H. An Introduction to Consumer Behavior; Hwatai Publishing: Taipei, Taiwan, 2013. [Google Scholar]
  23. Zaichkowsky, J.L. Measuring the involvement construct. J. Consum. Res. 1985, 341–352. [Google Scholar] [CrossRef]
  24. Yang, C.M.; Kuo, K.T. The Impact of Music Type in TV Commercial at Different Degrees of Advertising Involvement on Advertising Effect. J. Des. 2013, 18, 25–47. [Google Scholar]
  25. Cheng, K.F. Consumer Behavior: Life and Marketing; Future Career Publishing Corporation: Taipei, Taiwan, 2014. [Google Scholar]
  26. Hsu, T.K.; Chen, C.L.; Chung, H.H. The effects of ad appealing, ad message presentation and consumer involvement on restaurant’s advertisement purchasing intention. J. Hosp. Home Econ. 2006, 3, 269–287. [Google Scholar]
  27. Tepeci, M. Increasing brand loyalty in the hospitality industry. Int. J. Cont. Hosp. Manag. 1999, 11, 223–230. [Google Scholar] [CrossRef]
  28. Jones, T.O.; Sasser, W.E. Why satisfied customers defect. Harv. Bus. Rev. 1995, 73, 88–99. [Google Scholar] [CrossRef]
  29. Han, H.; Ryu, K. The roles of the physical environment, price perception, and customer satisfaction in determining customer loyalty in the restaurant industry. J. Hosp. Tour. Res. 2009, 33, 487–510. [Google Scholar] [CrossRef]
  30. Ryu, K.; Han, H.; Kim, T.H. The relationships among overall quick-casual restaurant image, perceived value, customer satisfaction, and behavioral intentions. Int. J. Hosp. Manag. 2008, 27, 459–469. [Google Scholar] [CrossRef]
  31. Cretu, A.E.; Brodie, R.J. The influence of brand image and company reputation where manufacturers market to small firms: A customer value perspective. Ind. Mark. Manag. 2007, 36, 230–240. [Google Scholar] [CrossRef]
  32. Yang, Z.; Peterson, R.T. Customer perceived value, satisfaction, and loyalty: The role of switching costs. Psychol. Mark. 2004, 21, 799–822. [Google Scholar] [CrossRef]
  33. Nunnally, J.C. Psychometric Theory, 2nd ed; McGraw-Hill: New York, NY, USA, 1995. [Google Scholar]
  34. Roy, D.; Banerjee, S. CARE- ing Strategy for Integrat ion of Brand Identity with Brand Image. Int. J. Commun. Manag. 2007, 17, 140–148. [Google Scholar]
  35. Park, J.H.; Kim, J.E. The Effect of Family Restaurant Brand Identity on the Purchase Intention of Consumer. J. Korean Soc. Food Cult. 2009, 24, 245–255. [Google Scholar]
  36. Yoo, J.; Park, M. The effects of e-mass customization on consumer perceived value, satisfaction, and loyalty toward luxury brands. J. Bus. Res. 2016, 69, 5775–5784. [Google Scholar] [CrossRef]
Figure 1. Study Framework.
Sustainability 11 02116 g001
Figure 2. Multifactor confirmatory factor analysis (CFA)—the factor loadings of brand as symbol, perceived acquisition value, perceived transaction value, message-response involvement, and customer loyalty.
Sustainability 11 02116 g002
Figure 3. Structural Equation Modelling (SEM) of brand as symbol, perceived acquisition value, perceived transaction value, message-response involvement, and customer loyalty.
Sustainability 11 02116 g003
Figure 4. The paths of brand as symbol, perceived transaction value, perceived acquisition value, message-response involvement, and customer loyalty.
Sustainability 11 02116 g004
Table 1. The factor loadings of brand as symbol, perceived acquisition value, perceived transaction value, message-response involvement, and customer loyalty.
Study DimensionQuestion No.Factor Loading
Message-response Involvement (MIS)M10.76
M20.83
M30.78
M40.83
M50.83
M60.81
M70.82
M80.81
M90.81
M100.73
Perceived Transaction Value (PT)T10.85
T20.88
T30.82
Brand as Symbol (BS)S10.90
S20.86
S30.81
Customer Loyalty (LO)L10.64
L20.75
L30.54
Perceived Acquisition Value (PA)A10.64
A20.79
A30.78
A40.80
A50.82
A60.60
A70.57
A80.57
A90.62
Table 2. Study Model Goodness of Fit after Modification.
Model Goodness-of-Fit IndexRMSEAχ2/dfGFICFIAGFI
<0.081~5>0.8>0.9>0.8
Before modification0.0964.5660.7470.8480.701
After modification0.0793.4170.8480.9140.812
Table 3. The unstandardized coefficients and path coefficients of brand as symbol, perceived transaction value, perceived acquisition value, message-response involvement, and customer loyalty.
EstimateS.E.C.R.pStandardized Regression Weights
BISMIS0.5350.04611.628***0.51
BISPT0.5320.03913.582***0.57
BISPA0.6290.03120.572***0.72
PTLO0.3080.0339.357***0.40
MISLO−0.0280.028−0.9960.319−0.04
PALO0.2260.0425.364***0.27
BISLO0.1460.0433.370***0.20
Note: * p < 0.05, ** p < 0.01, *** p < 0.001.

