Next Article in Journal
How Does Energy Misallocation Affect Carbon Emission Efficiency in China? An Empirical Study Based on the Spatial Econometric Model
Previous Article in Journal
Sustainable Infrastructure in Conflict Zones: Police Facilities’ Impact on Perception of Safety in Afghan Communities
 
 
Erratum published on 1 July 2019, see Sustainability 2019, 11(13), 3623.
Article

Gas Multiple Flow Mechanisms and Apparent Permeability Evaluation in Shale Reservoirs

1
Key Laboratory of Shale Gas and Geoengineering, Institute of Geology and Geophysics, Chinese Academy of Sciences, Beijing 100029, China
2
Institutions of Earth Science, Chinese Academy of Sciences, Beijing 100029, China
3
University of Chinese Academy of Sciences, Beijing 100049, China
*
Author to whom correspondence should be addressed.
Sustainability 2019, 11(7), 2114; https://doi.org/10.3390/su11072114
Submission received: 14 February 2019 / Revised: 4 April 2019 / Accepted: 4 April 2019 / Published: 9 April 2019
(This article belongs to the Section Energy Sustainability)

Abstract

:
Gas flow mechanisms and apparent permeability are important factors for predicating gas production in shale reservoirs. In this study, an apparent permeability model for describing gas multiple flow mechanisms in nanopores is developed and incorporated into the COMSOL solver. In addition, a dynamic permeability equation is proposed to analyze the effects of matrix shrinkage and stress sensitivity. The results indicate that pore size enlargement increases gas seepage capacity of a shale reservoir. Compared to conventional reservoirs, the ratio of apparent permeability to Darcy permeability is higher by about 1–2 orders of magnitude in small pores (1–10 nm) and at low pressures (0–5 MPa) due to multiple flow mechanisms. Flow mechanisms mainly include surface diffusion, Knudsen diffusion, and skip flow. Its weight is affected by pore size, reservoir pressure, and temperature, especially pore size ranging from 1 nm to 5 nm and reservoir pressures below 5 MPa. The combined effects of matrix shrinkage and stress sensitivity induce nanopores closure. Therefore, permeability declines about 1 order of magnitude compare to initial apparent permeability. The results also show that permeability should be adjusted during gas production to ensure a better accuracy.

1. Introduction

The stimulated shale reservoir is referred to as an inherently heterogeneous media benefited from the successful implementation of hydraulic fracturing [1,2,3,4,5]. Shale reservoirs contain organic matter (kerogen, bitumen) and inorganic matter (quartz, clay) [6,7]. Most of the shale gas exists in the adsorbed state on the nanopore surface of organic matrix due to a large specific surface area. However, there is little flow in pores and fractures in a free state (Figure 1) and only an insignificant amount of shale gas is dissolved in organic kerogen [5,6,7,8]. Atomic force microscopy (AFM) and scanning electron microscopy (SEM) reveal complex multi-scale pore structure of shale [8,9,10]. Shale nanopores are generally smaller than 10 nm, which is similar to the gas molecule free path [11,12]. Considering the collision between gas molecules and the collisions between gas molecules and the surface of nanopore walls, gas flow in shale nanopores exhibits the non-continuum phenomenon [13]. Therefore, shale reservoirs have complex structures and flow mechanisms.
The research method of the transport mechanisms was based on the Navier-Stokes equation with an idealized channel flow model or tube flow model [14,15]. Other modeling approaches, such as Lattice-Boltzmann (LBM) [16], direct simulation Monte Carlo (DSMC) [16], and dynamic molecular (MD) [17,18] can be utilized to model gas flow in nanopores. However, considering the large scale of the hydraulic fracturing area and the macroscopic pores and fractures, gas flow mechanisms in a shale reservoir are generally written in a format based on an extended N-S equation [19], and apparent permeability model has been widely applied [20,21]. In addition, the characterization of gas flow mechanisms frequently depend on the Knudsen number (Kn is the ratio of the gas molecule free path to the pore diameter) [22,23,24,25,26,27,28,29,30] to evaluate whether Knudsen diffusion, slip flow, transitional flow, or continuous flow exists in nanopores (Figure 2). Researches on gas flow in narrow and closed spaces dated back to the works of Maxwell [21] and Knudsen [22], which described the slippage effect near the solid surface as a consequence of slip flow, and the models were widely modified and applied. [23]. Klinkenberg [24] was the first to consider the gas slip phenomena and derived an apparent permeability expression. Ertekin [25] developed a dual-mechanism transport model under the influence of a pressure field and a concentration field. The transport process includes the Knudsen flow and the slip flow. Similarly, Javadpour et al. [12,26] proposed an apparent permeability model that describe Knudsen diffusion and slip flow on the nanopore surfaces. Beskok and Karniadakis [15] deduced a unified Hagen-Poiseuille-type equation covering the fundamental flow regimes including free molecule flow, transition flow, slip flow, and viscous flow conditions in channels at micro- and nano-scales for the first time. The model describes four flow regimes in one equation based on the Knudsen number. Afterwards, Civan [27] developed a permeability equation same to the Beskok and Karniadakis model. In addition, the approach rigorously accounts for the effect of several empirical parameters in porous media including intrinsic permeability, rarefaction coefficient, and a slippage factor [27,28]. Surface diffusion was added to a portion of the gas flow in the nanopore in more recent studies and the driving force was a chemical potential gradient [29,30]. In addition, Wu et al. [30,31] contributed reasonable weighting coefficients to value complex transport mechanisms including surface diffusion. Previous studies have gradually analyzed gas flow mechanisms in nanopores. However, few investigations have been done on the separate characterizations of gas multiple flow mechanisms and their models have failed to consider the influence of pore size changes on the flow mechanisms and permeability during gas production.
Shale nanopore size is influenced by combined effects of matrix shrinkage and stress sensitivity [32,33,34,35,36,37]. Thus, apparent permeability and gas multiple flow mechanisms are dynamically changing along with gas production. The adsorbed gas desorbs from nanopore surfaces leading matrix shrinkage and resulting in an increase in the pore size and apparent permeability [32,33,34]. In contrast, the effective stress of the matrix skeleton increases as gas in nanopores flow out, causing the pore to be compressed [35,36]. Dong [35] and Mckee’s [37] research results have shown that a decline in permeability has a negative exponential relationship with the effective stress. Therefore, the effects of matrix shrinkage and stress sensitivity are in need for the accurate characterization of shale apparent permeability.
In this article, gas multiple flow mechanisms are characterized by the separate equations in an apparent permeability model. Specifically, the combined effects of matrix shrinkage and stress sensitivity on pore size and permeability evaluation are also incorporated into COMSOL solver. For better understanding of gas multiple flow mechanisms, surface diffusion, slip flow, transitional diffusion, and Knudsen diffusion are described in the apparent permeability model. In addition, kerogen diffusion can be negligible in terms of the extremely low diffusion coefficient. Stress sensitivity and matrix shrinkage act in opposite directions in the changes of pore size. Thus a dynamic permeability equation associated with pore size is developed. As an extension of our preliminary study, comprehensive simulations including more complete physical process characterization and influenced factors can be performed to access more accurate reservoir information.
The rest of this article is organized as follows: in Section 2, the concept of gas multiple flow mechanisms is presented. In Section 3, the apparent permeability equation and dynamic permeability equation are proposed. In Section 4, the simulation model in COMSOL is constructed. In Section 5, the results are displayed and discussed. The conclusion is presented at last.

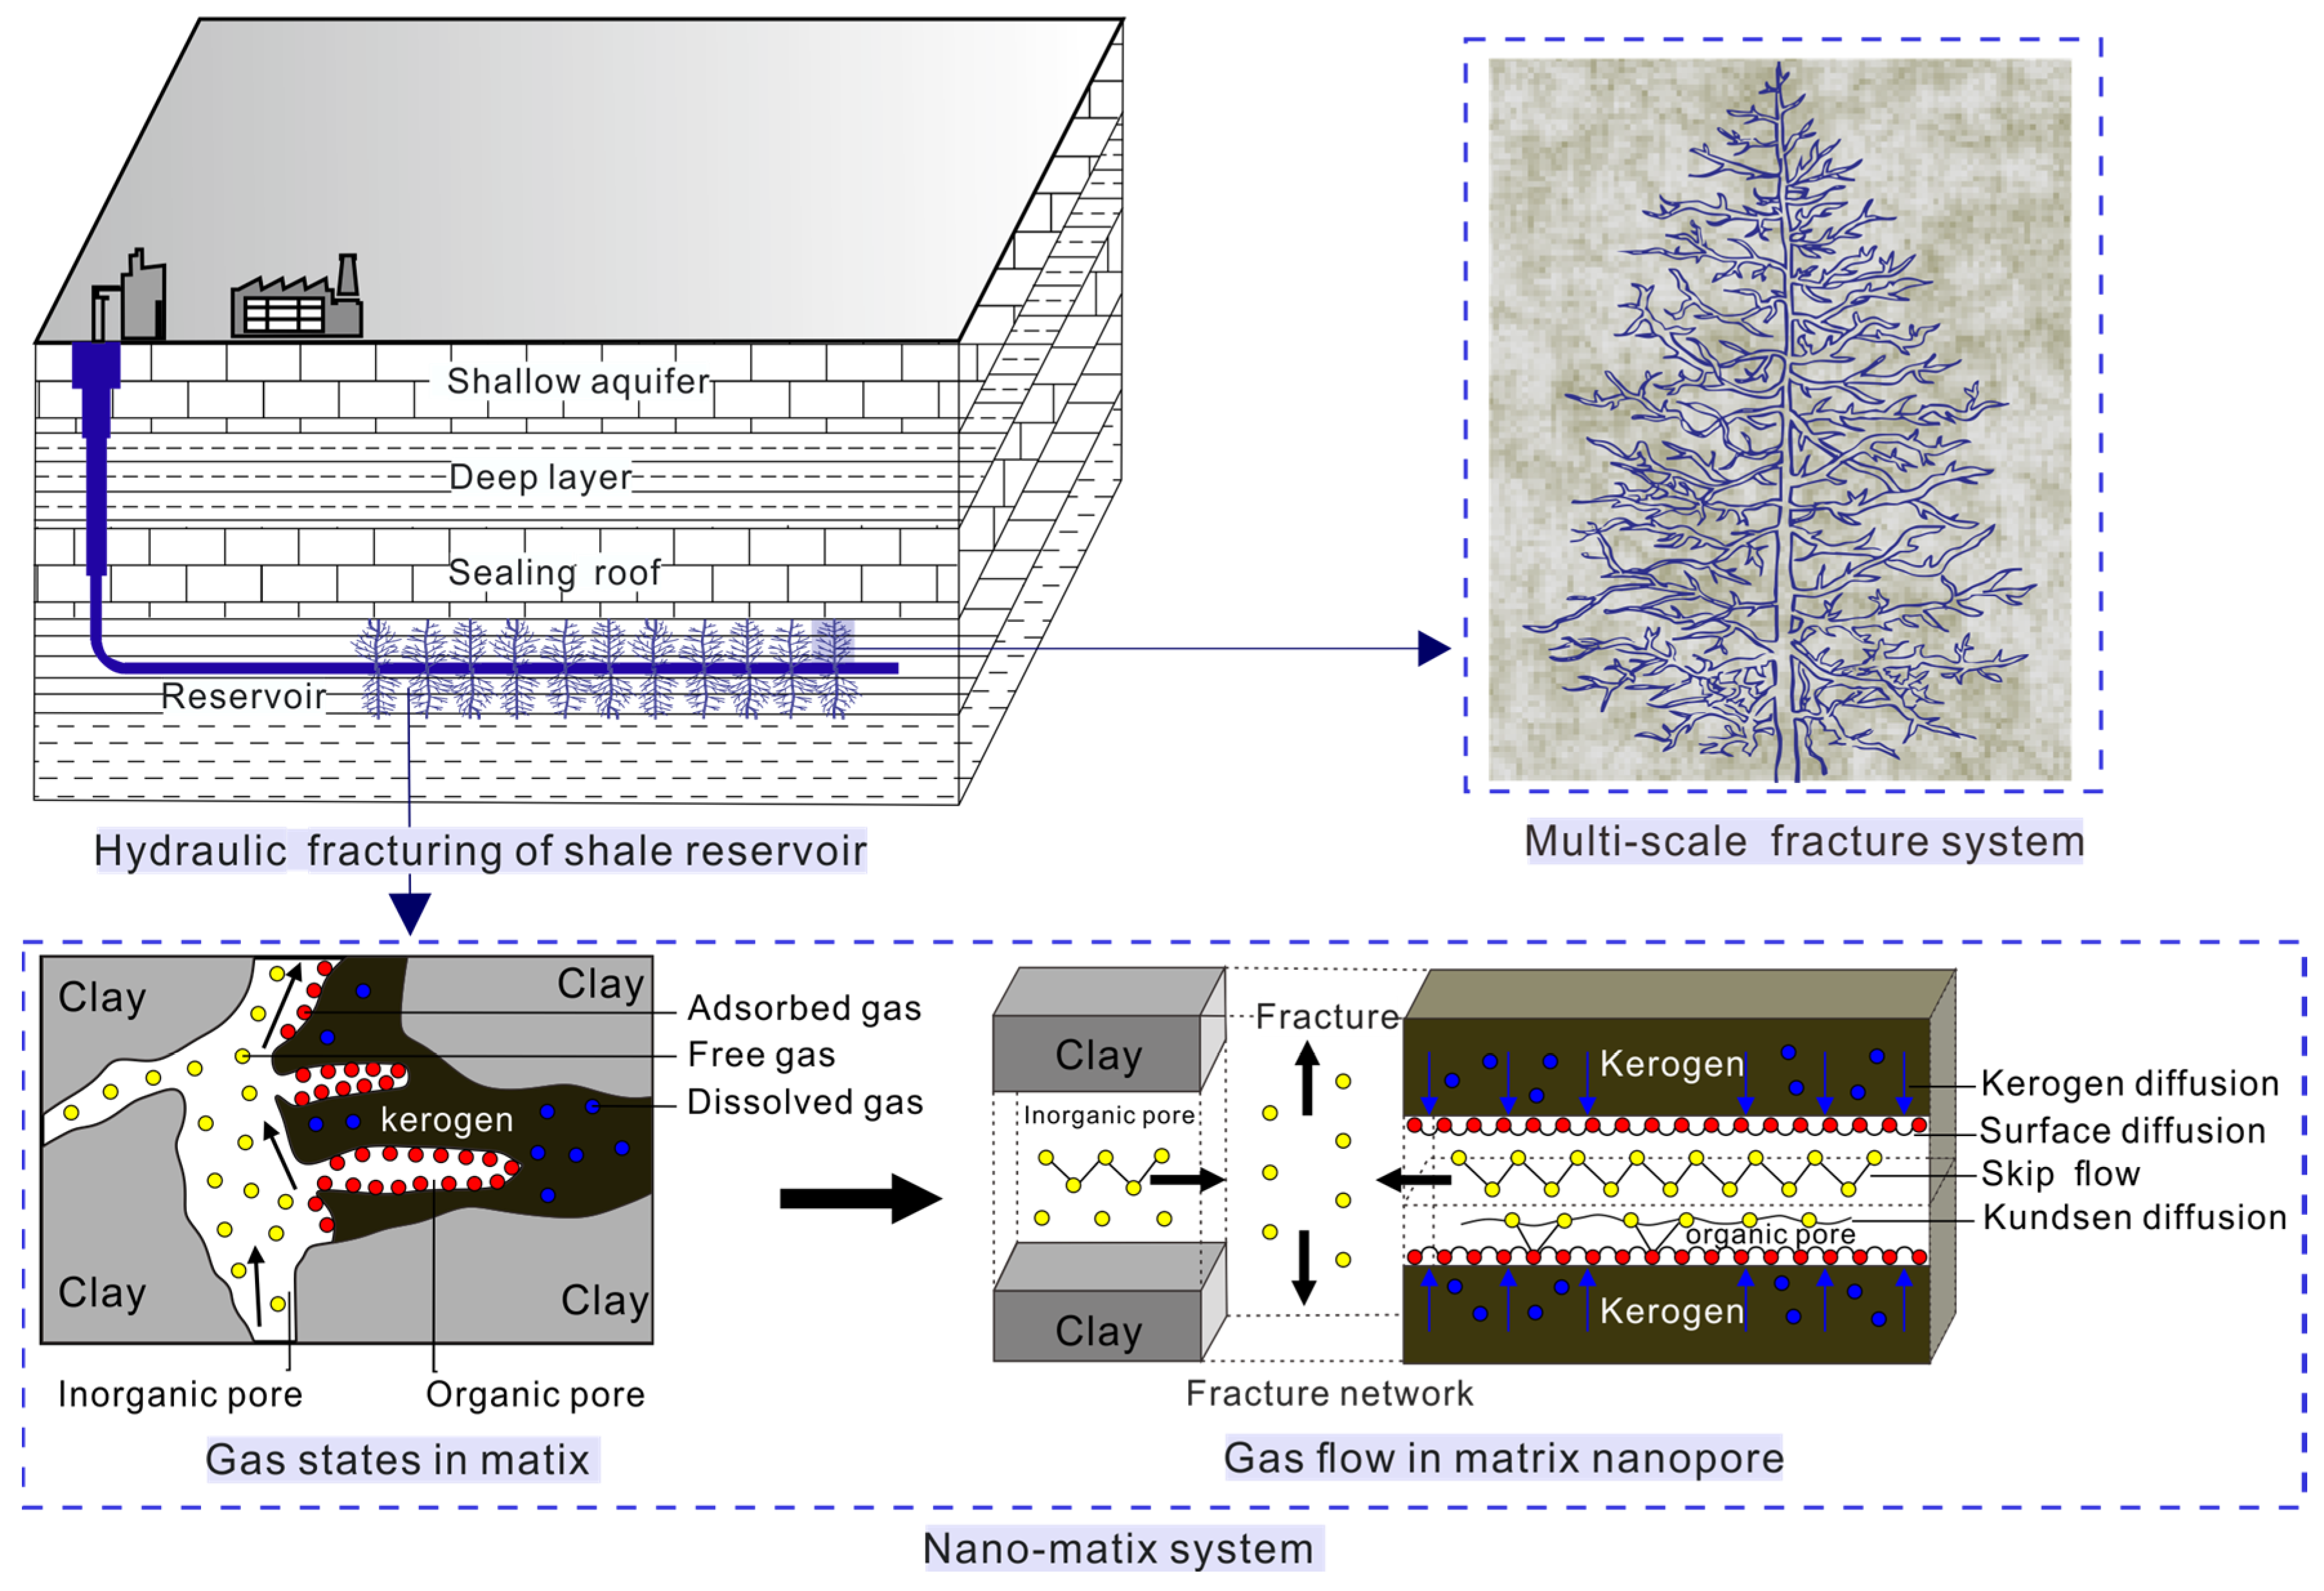
2. Shale Gas Multiple Flow Mechanisms

The pore size is in the order of nanometers and the rate of gas flow is slow in shale reservoirs [40], resulting in an increase in the frequency of collisions between gas molecules and pore walls. Thus, gas flow characteristics in a low permeability shale reservoir are different from those of liquids in a conventional reservoir. Thus, gas flow gas multiple flow mechanisms in nanopores need to be characterized.

2.1. Kerogen Diffusion

Kerogen diffusion involves the flow of shale gas dissolved in the organic kerogen nanopore under gas concentration [41] (Figure 1). Unfortunately, the gas diffusion rate is relatively low in kerogen in terms of diffusion coefficient and total dissolved gas content. Fick’s Second Diffusion Law [42] is usually applied to model gas diffusion in the kerogen matrix:
2 c = 1 λ c t
where λ is diffusion coefficient in kerogen in m 2 / s , and c is the gas concentration in mol / m 3 .

2.2. Surface Diffusion

Surface diffusion is the phenomenon of adsorbed gas flowing along the nanopore surface (Figure 1). The driving force is the concentration gradient of adsorbed gas [30,31]. Shale matrix has a large specific surface area and a high concentration gradient. Therefore, surface diffusion is a non-neglected transport mechanism in nanopores. Previous work indicates that in the presence of surface diffusion, gas apparent permeability can be several orders of magnitude higher than that of conventional reservoirs [30,31]. In addition, the driving force of surface diffusion can be described by the Maxwell−Stefan method [43]:
J s = D s ξ m s c s p p .
The surface diffusion coefficient D s can be obtained in combination with experimental data from gas adsorption on nanotubes [44]:
D s = 8.29 × 10 7 T 0.5 exp ( Δ H 0.8 R T )
where Δ H is the isostatic adsorption heat in J / mol , R is a molar gas constant ( 8.314   J / ( mol · K ) ), and T is the reservoir temperature in K .
The correction factor of surface diffusion ξ m s is related to the porosity ϕ and tortuosity τ [45]:
ξ m s = ϕ τ [ ( 1 d M r ) 2 1 ]
where d M is the diameter of methane molecular in nm , r is the pore radius in m , ϕ is the matrix porosity (dimensionless), and τ is the pore tortuosity (dimensionless).
The Langmuir monolayer adsorption concentration c s can be defined as [30]:
c s = 4 θ M π d M 3 N A
where θ is the extent of the gas coverage on the pore wall for real gas (dimensionless), M is the molar mass in kg/m3, d M is the diameter of methane molecular in m , N A is Avogadro’s constant ( 6.02 × 10 23 / mol ).

2.3. Gas Flow Regimes in Nanopores

The diameters of shale pores below 2 nm are known as micropores and greater than 50 nm are macropores. The diameters in mesopores ranges from 2 to 50 nm [8,28]. The pore size in the shale ranges from nanometer to micrometer. However, organic and inorganic micro-nano pores provide a large specific surface area for gas accumulation, and micro-nano channels increase the frequency of collisions between gas molecules and pore walls. Hence, the gas flow regimes are different from traditional subsurface fluid viscous flow or molecular flow. The Knudsen number Kn is widely used to describe the gas flow regimes in shale nanopores. Continuum fluid flow (Kn ≤ 0.01), slip flow (0.01 < Kn < 0.1), transition flow (0.1 < Kn < 10), and free molecular flow (Kn ≥ 10) are presented in Figure 2. As shown, the gas flow regime is mainly dominated by Knudsen diffusion and transition diffusion in shale reservoir (shown in Figure 1 and Figure 2). With an increase in pore size or reservoir pressure, the collision frequency of gas molecules is enhanced. The gas flow regime is mainly transformed into slip flow and continuum flow. The Knudsen number Kn is defined as the ratio of molecular free path λ to pore diameter d [12,15,31]:
K n = λ d .
The mean-free-path of gas molecules λ is given as
λ = μ p π R T 2 M
where μ is the gas viscosity in Pa · s , p is the reservoir pressure in MPa , R is a molar gas constant ( 8.314   J / ( mol · K ) ), T is the reservoir temperature in K , and M is the molar mass in kg / m 3 , d is the pore diameter in nm .
When gas flow in macropores (pore diameter > 50 nm) and the molecule free path is short under the high pressure, the frequency of intermolecular collisions is strongly high (Kn < 0.01) (Figure 2). The flow mechanism is governed by the continuum flow and this transport is driven by a pressure gradient. Therefore, the traditional fluid dynamics equations can be used to describe fluid flow in porous media [46]:
J D = k ρ μ p
where k is the Darcy permeability in m 2 , ρ is the gas density in kg / m 3 , μ is the gas viscosity in Pa · s .
When gas flow in macropores and mesopore (pore diameter > 2 nm) and the frequency of intermolecular collisions is high (Kn < 0.1) (Figure 2). This transport is still dominated by the collisions between gas molecules and is referred to as slip flow. Though the traditional hydrodynamic equations can be applied, the correction coefficient can more accurately describe the gas slip on the surface of the wall. Klinkenberg [24] published a slip factor to modify the permeability of mass flux:
J S = ( 1 + b p ) r 2 ρ 2 8 μ p ,   b p = 4 c λ r
where ρ is the gas density in kg / m 3 , μ is the gas viscosity in Pa · s , λ is the molecular free path in m , b is a constant (dimensionless), and p is the reservoir pressure in MPa .
The slip effect on the surface of nanopores accelerates gas flow [47]. Brown [48] also provided a theoretical dimensionless coefficient F to correct the slip velocity based on Poiseuille’s Equation:
J S = F r 2 ρ 8 μ p ,   F = 1 + ( 8 π R T M ) 0.5 μ ρ ( 2 α 1 )
where r is the pore radius in m , ρ is the gas density in kg / m 3 , μ is the gas viscosity in Pa · s , α is a constant (0.8), R is a molar gas constant ( 8.314   J / ( mol · K ) ), T is the reservoir temperature in K , and M is the molar mass in kg / m 3 .
When 0.1 < Kn < 10, slip flow and Knudsen diffusion occur simultaneously and traditional hydrodynamic equations cannot describe this flow regime. Fortunately, this transport is usually corrected by Knudsen diffusion and skip flow, which is called transitional flow. In addition, transitional flow generally exists in tight gas reservoirs and it can be proposed as the combination of Knudsen diffusion and skip flow.
J T = J K + J S .
Knudsen flow or free molecular flow occurs under a low-pressure gradient when gas flow in micropores (pore diameter below 2 nm). Thus, the gas molecule free path is high and this transport is dominated by collisions between gas molecules and pore walls. The diffusion equation is established by gas pressure gradient and diffusion constant [12,49].
J K = M D K 10 3 R T p .
where D K is the Knudsen diffusion constant, which is defined as
D K = 2 r 3 ( 8 R T π M ) 0.5
where r is the pore radius in m , R is a molar gas constant ( 8.314   J / ( mol · K ) ), T is the reservoir temperature in K , and M is the molar mass in kg / m 3 .

3. Model Establishment and Analysis

In this section, an apparent permeability model for describing gas multiple flow mechanisms is developed. In addition, a dynamic permeability equation that considers the matrix shrinkage and stress sensitivity effects is derived.

3.1. Establishment of Apparent Permeability Model

In the typical shale reservoirs, the Knudsen number is in the range of 0.01-6 [30]. Thus, the multiple flow mechanisms in shale nanopores include kerogen diffusion, surface diffusion, Knudsen diffusion, transmit flow, and slip flow, which are described in Section 2. These transport mechanisms should be presented in the model so that the evolution law and influencing factors of shale permeability can be more accurately analyzed. However, kerogen diffusion can be negligible at the stimulated reservoir scale in terms of the extremely low diffusion coefficient and total dissolved gas content. In addition, transmit flow is the mixing of Knudsen diffusion and slip flow. Therefore, all flow mechanisms in nanopores can be described by the combination of surface diffusion (Equation (2)), slip flow (Equation (9)), and Knudsen diffusion (Equation (12)). The total gas flux through the nanopore is developed as
J = ( D s ξ m s C s p + 2 r M 3 × 10 3 R T ( 8 R T π M ) 0.5 + ( 1 + b p ) r 2 ρ 2 8 μ ) p .
To model the gas permeability, the total gas flux needs to be converted to a form of permeability. Thus, the relationship between the gas flow rate and permeability in shale reservoir can be described as [12,46]
v = k ρ μ p .
The Darcy flow rate equation [46] is usually applied for characterizing gas flow rate in conventional reservoirs and partially tight reservoirs. Similarly, considering the meso- and macro- pores are the main flow channel of shale gas, the gas flow in shale reservoir can be determined in Equation (16):
v = ( D s ξ m s C s p ρ + 2 r M 3 × 10 3 R T ρ ( 8 R T π M ) 0.5 + ( 1 + b p ) r 2 ρ 8 μ ) p .
By substituting Equations (16) and (14) into Equation (15), the characterized term of gas seepage capacity in shale reservoirs called apparent permeability k a p p is obtained as
k a p p = D s ξ m s C s μ p ρ 2 + 2 r μ M 3 × 10 3 ρ 2 R T ( 8 R T π M ) 0.5 + ( 1 + b p ) r 2 8 .
Note that the characterization of the gas flow capacity is shown in Equation (17). The apparent permeability k a p p is a more accurate expression and interpretation of shale permeability, similar to the Darcy permeability in conventional reservoirs. In addition, the apparent permeability depends on the properties of shale gas at the different reservoir pressure, temperature, and pore size. This dependence is expected because the interaction of gas molecules with the pore surface and multiple flow mechanisms in nanopores are presented in this model.
The gas flow channel can be conceptualized as a circular tube for porous media [46]. The permeability relies on the size of the flow space. Mathematically, fluid flow in a circular tube or pore can be empirically given by Hagen-Poiseuille’s equation [50]. Thus, the Darcy permeability k d of porous media can be assumed as [49]
Q = ρ π r 4 8 μ p , k d = r 2 8 .
Previous research results shown that the production of tight gas or shale gas is higher than expected for gas production from these reservoirs [12,26]. Furthermore, laboratory tests indicated that shale permeability is higher than expected from these reservoirs [50]. The reason is the fact that the Darcy permeability equation of conventional reservoir can hardly evaluate the production rate of tight gas. Comparing to conventional reservoir, the apparent permeability in shale reservoirs is affected by geological conditions and multiple flow mechanisms. To address this problem, the apparent permeability is divided by Darcy permeability type [46]:
k a p p k d = D s ξ m s C s μ p ρ 2 8 r 2 + 2 μ M 3 × 10 3 ρ 2 R T ( 8 R T π M ) 0.5 8 r + ( 1 + b p )
where D s is the surface diffusion coefficient in m 2 / s , C s is the Langmuir monolayer adsorption concentration in kg / m 3 , ξ m s is the correction factor of surface diffusion (dimensionless), r is the pore radius in m , μ is the gas viscosity in Pa · s , R is a molar gas constant ( 8.314   J / ( mol · K ) ), T is the reservoir temperature in K , and M is the molar mass in kg / m 3 , b is the gas slip factor (dimensionless), and p is the reservoir pressure in MPa .
Note that the Equation (19) shows that the apparent permeability in shale reservoirs is larger than the Darcy permeability expected from these reservoirs. In addition, Equation (19) suggests that the smaller the size of the pores, the larger the difference between apparent permeability and Darcy permeability. This equation also shows that the deviation between the apparent permeability and Darcy permeability is larger at lower pressures. Therefore, apparent permeability is similar to Darcy permeability by increasing the pore size or increasing reservoir pressure.

3.2. Permeability Dynamic Changes under Matrix Shrinkage and Stress Sensitivity

The following introduces the effects of matrix shrinkage and stress sensitivity on the pore size to address the apparent permeability dynamic evaluation rather than remain constant. Shale apparent permeability shows a high sensitivity to pore size and the change in pore size is highly related to the deformation of the matrix skeleton [51,52,53]. In shale reservoirs, during pressure drawdown of the reservoir by primary production, the nanopore is compressed and the permeability is reduced due to effective stress increases. In contrast, pressure drawdown results in gas desorption, and this is accompanied by matrix shrinkage, which enlarges the nanopore and leads permeability to increase (Figure 3). Thus, the change in nanopore opening and shale permeability could be positive (increase) or negative (reduction).
The research results from shale reservoirs show that the content of adsorbed gas in shale accounts for 20–85% [54,55]. Furthermore, nanopores in shale reservoirs are mostly oil-wet, resulting in a significant adsorption capacity. The adsorption of shale gas satisfies the Langmuir isotherm adsorption curve [56]. The content of gas adsorption is associated with the reservoir pressure p , the Langmuir limiting adsorption pressure P L , and the Langmuir limiting adsorption volume V L [56], which can be expressed as
V = V L p ( p + P L )
where V is the gas adsorption amount in cm 3 / g , V L is the Langmuir volume in cm 3 / g , P L is the Langmuir pressure in MPa , and p is the adsorption-desorption dynamic equilibrium pressure in MPa .
Adsorption gas gradually desorbs from the matrix pore surface as a decrease in reservoir pressure, resulting in matrix shrinkage and pore size enlargement, this is simply called matrix positive strain effect. Fortunately, the strain of matrix shrinkage Δ ε caused by the changes in the adsorbed gas content V can be described by the Bangham solid deformation theory [57].
Δ ε = ρ R T E V 0 P L p V p d p
where ρ is the shale density in kg / m 3 , R is a molar gas constant ( 8.314   J / ( mol · K ) ), T is the reservoir temperature in K , p is the reservoir pressure in MPa , E is the Young’s modulus in GPa , V is the gas adsorption amount in cm 3 / g , and P L is the Langmuir pressure in MPa .
Seidle [58,59] presented a model describing the effect of matrix shrinkage deformation on the reservoir porosity. Therefore, the relationship between the change of porosity ϕ and matrix strain Δ ε can be proposed as
ϕ ϕ 0 = 1 + ( 1 + 2 ϕ 0 ) Δ ε .
A large number of nanopores in shale can be assumed to be a series of capillary tubes [59]. The mass flow of ideal gas in a circular tube is derived from the Hagen-Poiseuille law [50,59]. Therefore, the dynamic changes in permeability and porosity is proposed.
Q = ρ π r 4 8 μ p ,   ϕ = n π r 2 ,   k = r 2 8
k k 0 = ϕ ϕ 0 = ( r r 0 ) 2
where k 0 is the initial permeability in m 2 , ϕ 0 is the initial porosity (dimensionless), r 0 is the initial pore size in nm , and μ is the gas viscosity in Pa · s .
Substituting Equation (21) and Equation (22) into Equation (24), gas desorption from matrix shrinkage initiates the changes in pore size can be described as
r 1 r 0 = ( 1 + ( 1 + 2 ϕ 0 ) ρ R T E V 0 P L p V p d p ) 1 / 2
where ρ is the shale density in kg / m 3 , R is a molar gas constant (8.314 J/mol·K), T is the reservoir temperature in K, p is the reservoir pressure in MPa , E is the Young’s modulus in GPa , V is the gas adsorption amount in cm 3 / g , and P L is the Langmuir pressure in MPa , k 0 is the initial permeability in m 2 , ϕ 0 is the initial porosity (dimensionless), and r 0 is the initial pore size in nm .
Shale gas recovery is accompanied by a decrease in the reservoir pressure, resulting in pore closure and a rapid decline in shale permeability. Unfortunately, this is simply called matrix negative strain effect. In addition, the ratio of shale permeability to initial permeability has a negative exponential relationship with the effective stress [35,36,37]:
k k 0 = e a p s
where k 0 is the initial permeability in m 2 , p s is the change of pressure in MPa , and a is a modified coefficient (dimensionless).
Combining Equations (24) and (26), effective stress triggers changes in pore size is established as
r 2 r 0 = e a 2 p s
where p s is the pressure change in MPa , a is a modified coefficient (dimensionless), and r0 is the initial pore radius in nm.
Matrix shrinkage and effective stress act in opposite directions on pore radius and permeability. The initial pore radius is r 0 , the pore radius decrease ( r 2 r 0 ) relies on pressure drawdown, and the pore radius increment ( r 1 r 0 ) , associated with gas desorption, are considered in dynamic changes of permeability. Therefore, substituting Equations (25) and (27) into Equation (24), the relationship between dynamic permeability k and apparent permeability k a p p is obtained as
k k a p p = ( r r 0 ) 2 = ( r 1 r 0 + r 2 r 0 1 ) 2 .

4. Methodology

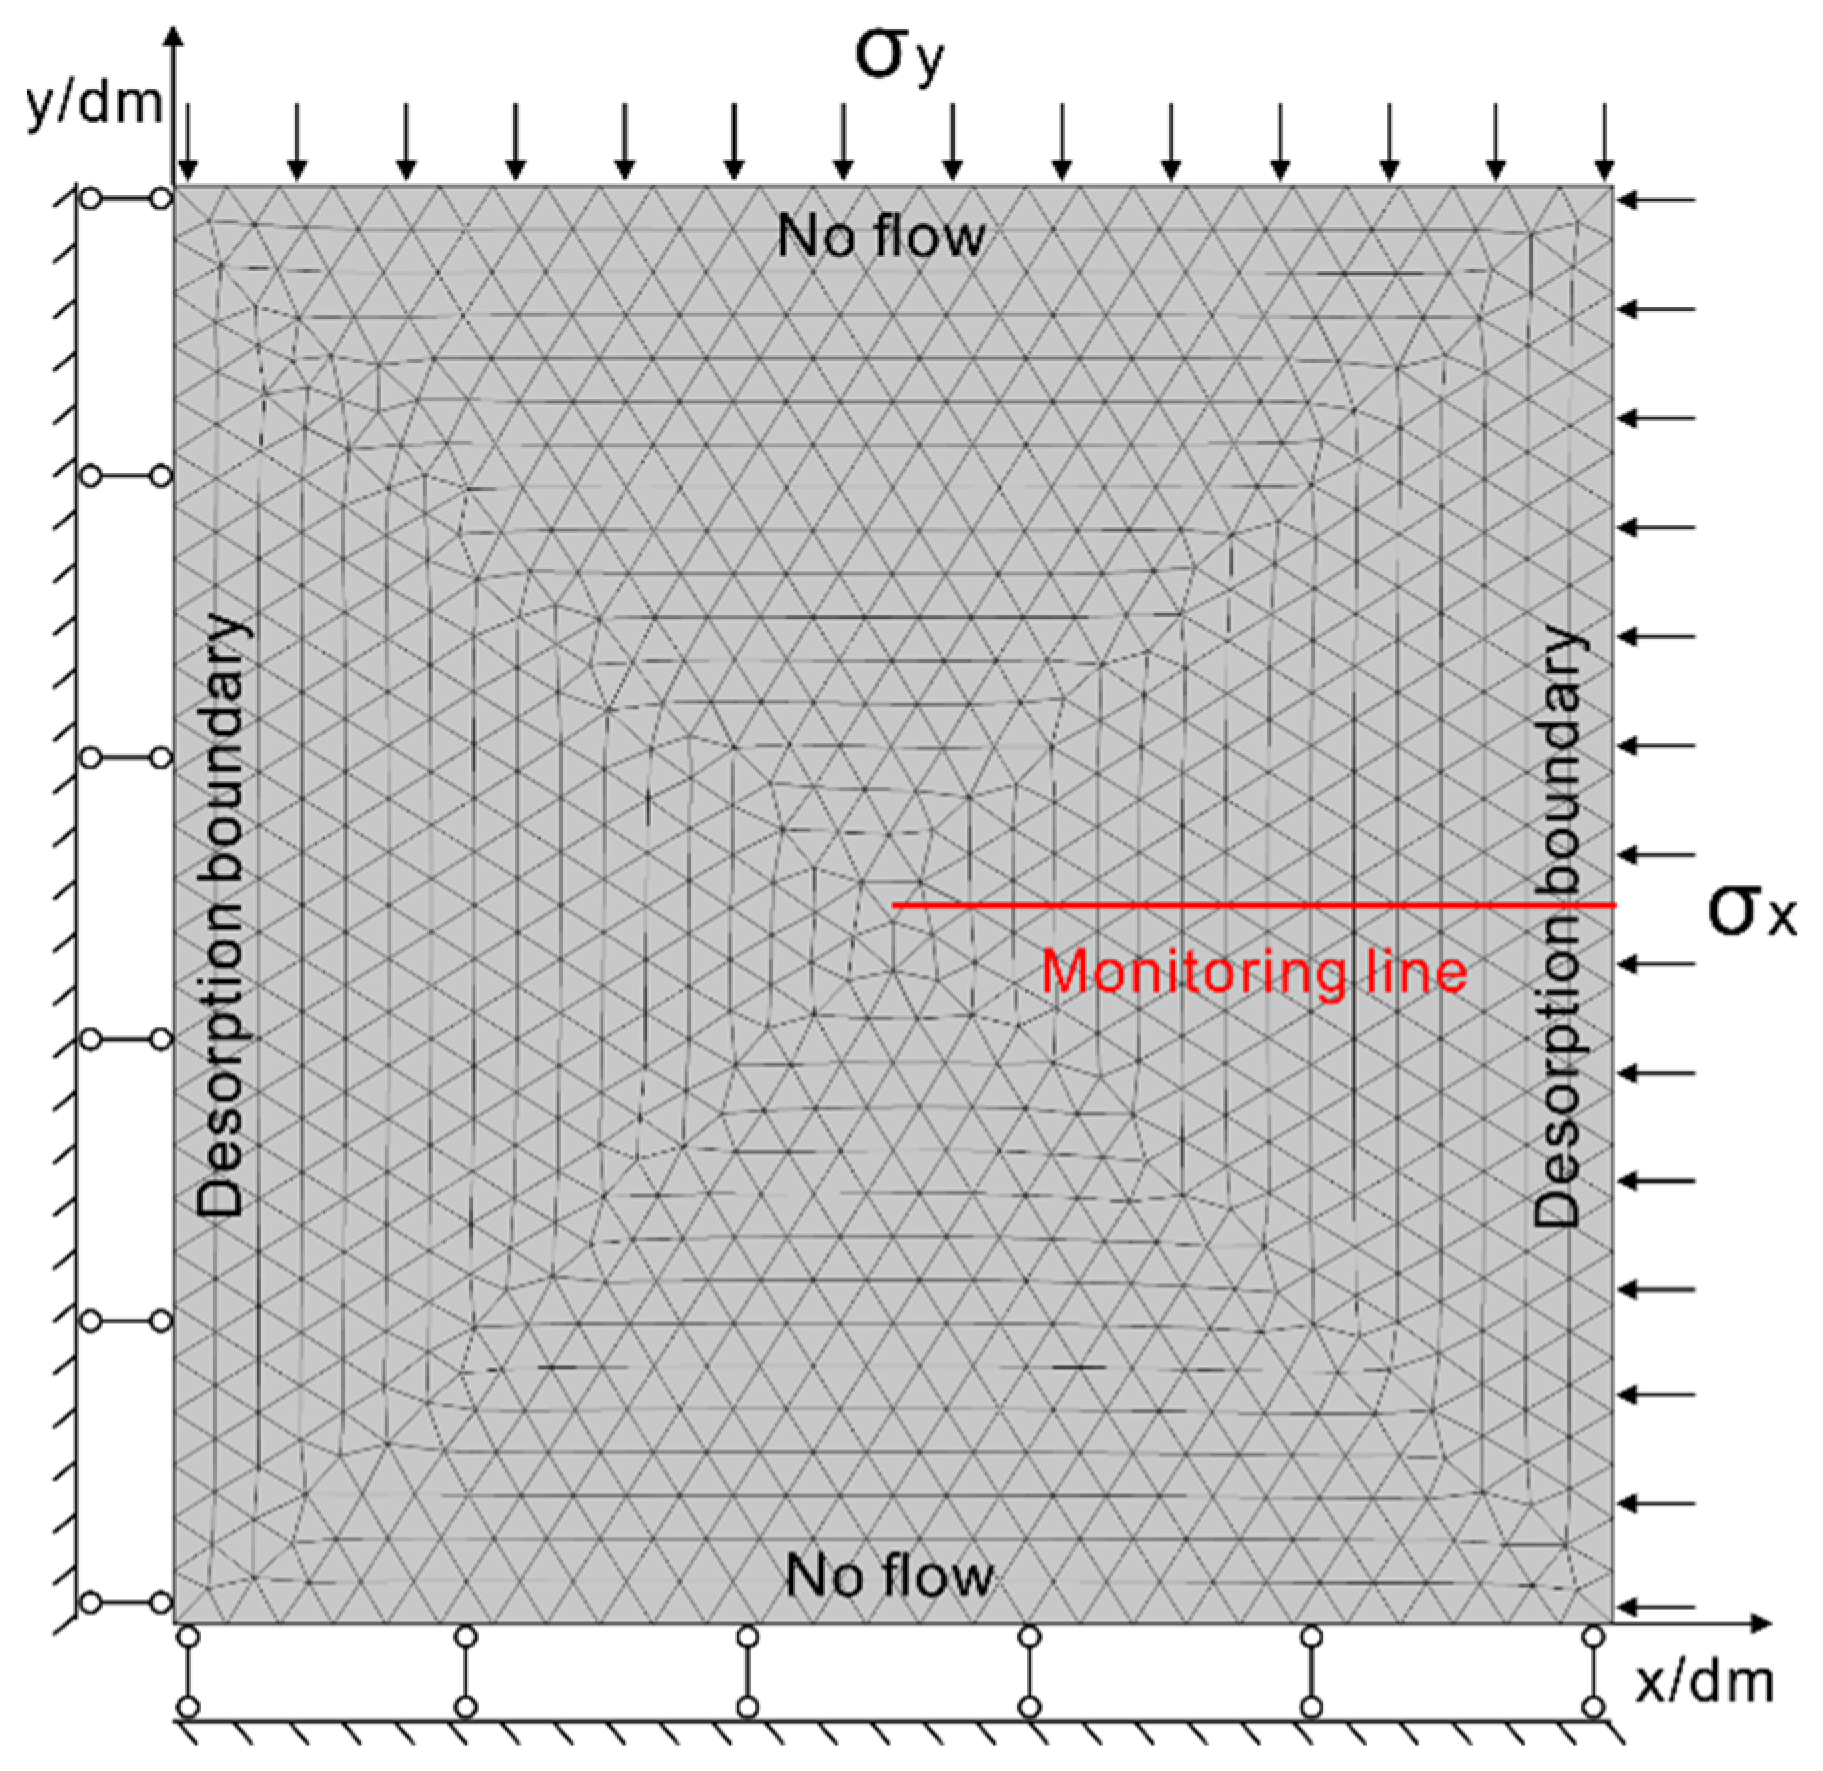
4.1. Numerical Model and Module

The gas flow process in a shale reservoir mode was simulated in COMSOL solver. COMSOL software is a multi-physics coupling solver based on commercial PDE (Partial Differential Equation). To simplify the simulation, the shale reservoir is assumed to be blocks, which are divided by network fractures (shown in Figure 1). The size of the simulated model is a square with a length of 1 dm as a characterization unit of shale based on the average spacing of fractures in stimulated shale reservoirs [40,52] (shown in Figure 4).

4.2. Physical Boundary Conditions and Input Parameters

The 2D time-dependent Rock Mechanic module and Subsurface Flow module in COMSOL are applied to simulate the gas flow process (Figure 4). Appropriate boundary conditions must be employed for this coupled matrix deformation and gas flow model. For shale deformation during gas production, the vertical pressure (50 MPa) and horizontal pressure (53 MPa) were applied to the top and the right side [40,51], and the left and bottom boundaries of model were both rollered. For gas flow due to the pressure gradient, the initial pore pressure of the reservoir was assumed to be 30 MPa [54,60]. A constant boundary pressure of 10 MPa was applied to the left and right boundaries of the model [61], which were considered the interface between the fracture and the matrix. No flow conditions were set for other boundaries.
The permeability equation was set as a function of variables and parameters, and it was calculated and updated at each time step in COMSOL. The input properties are listed in Table 1. The values of these properties were chosen from the shale reservoirs of Fuling and Barnet [40,52].

5. Results and Discussion

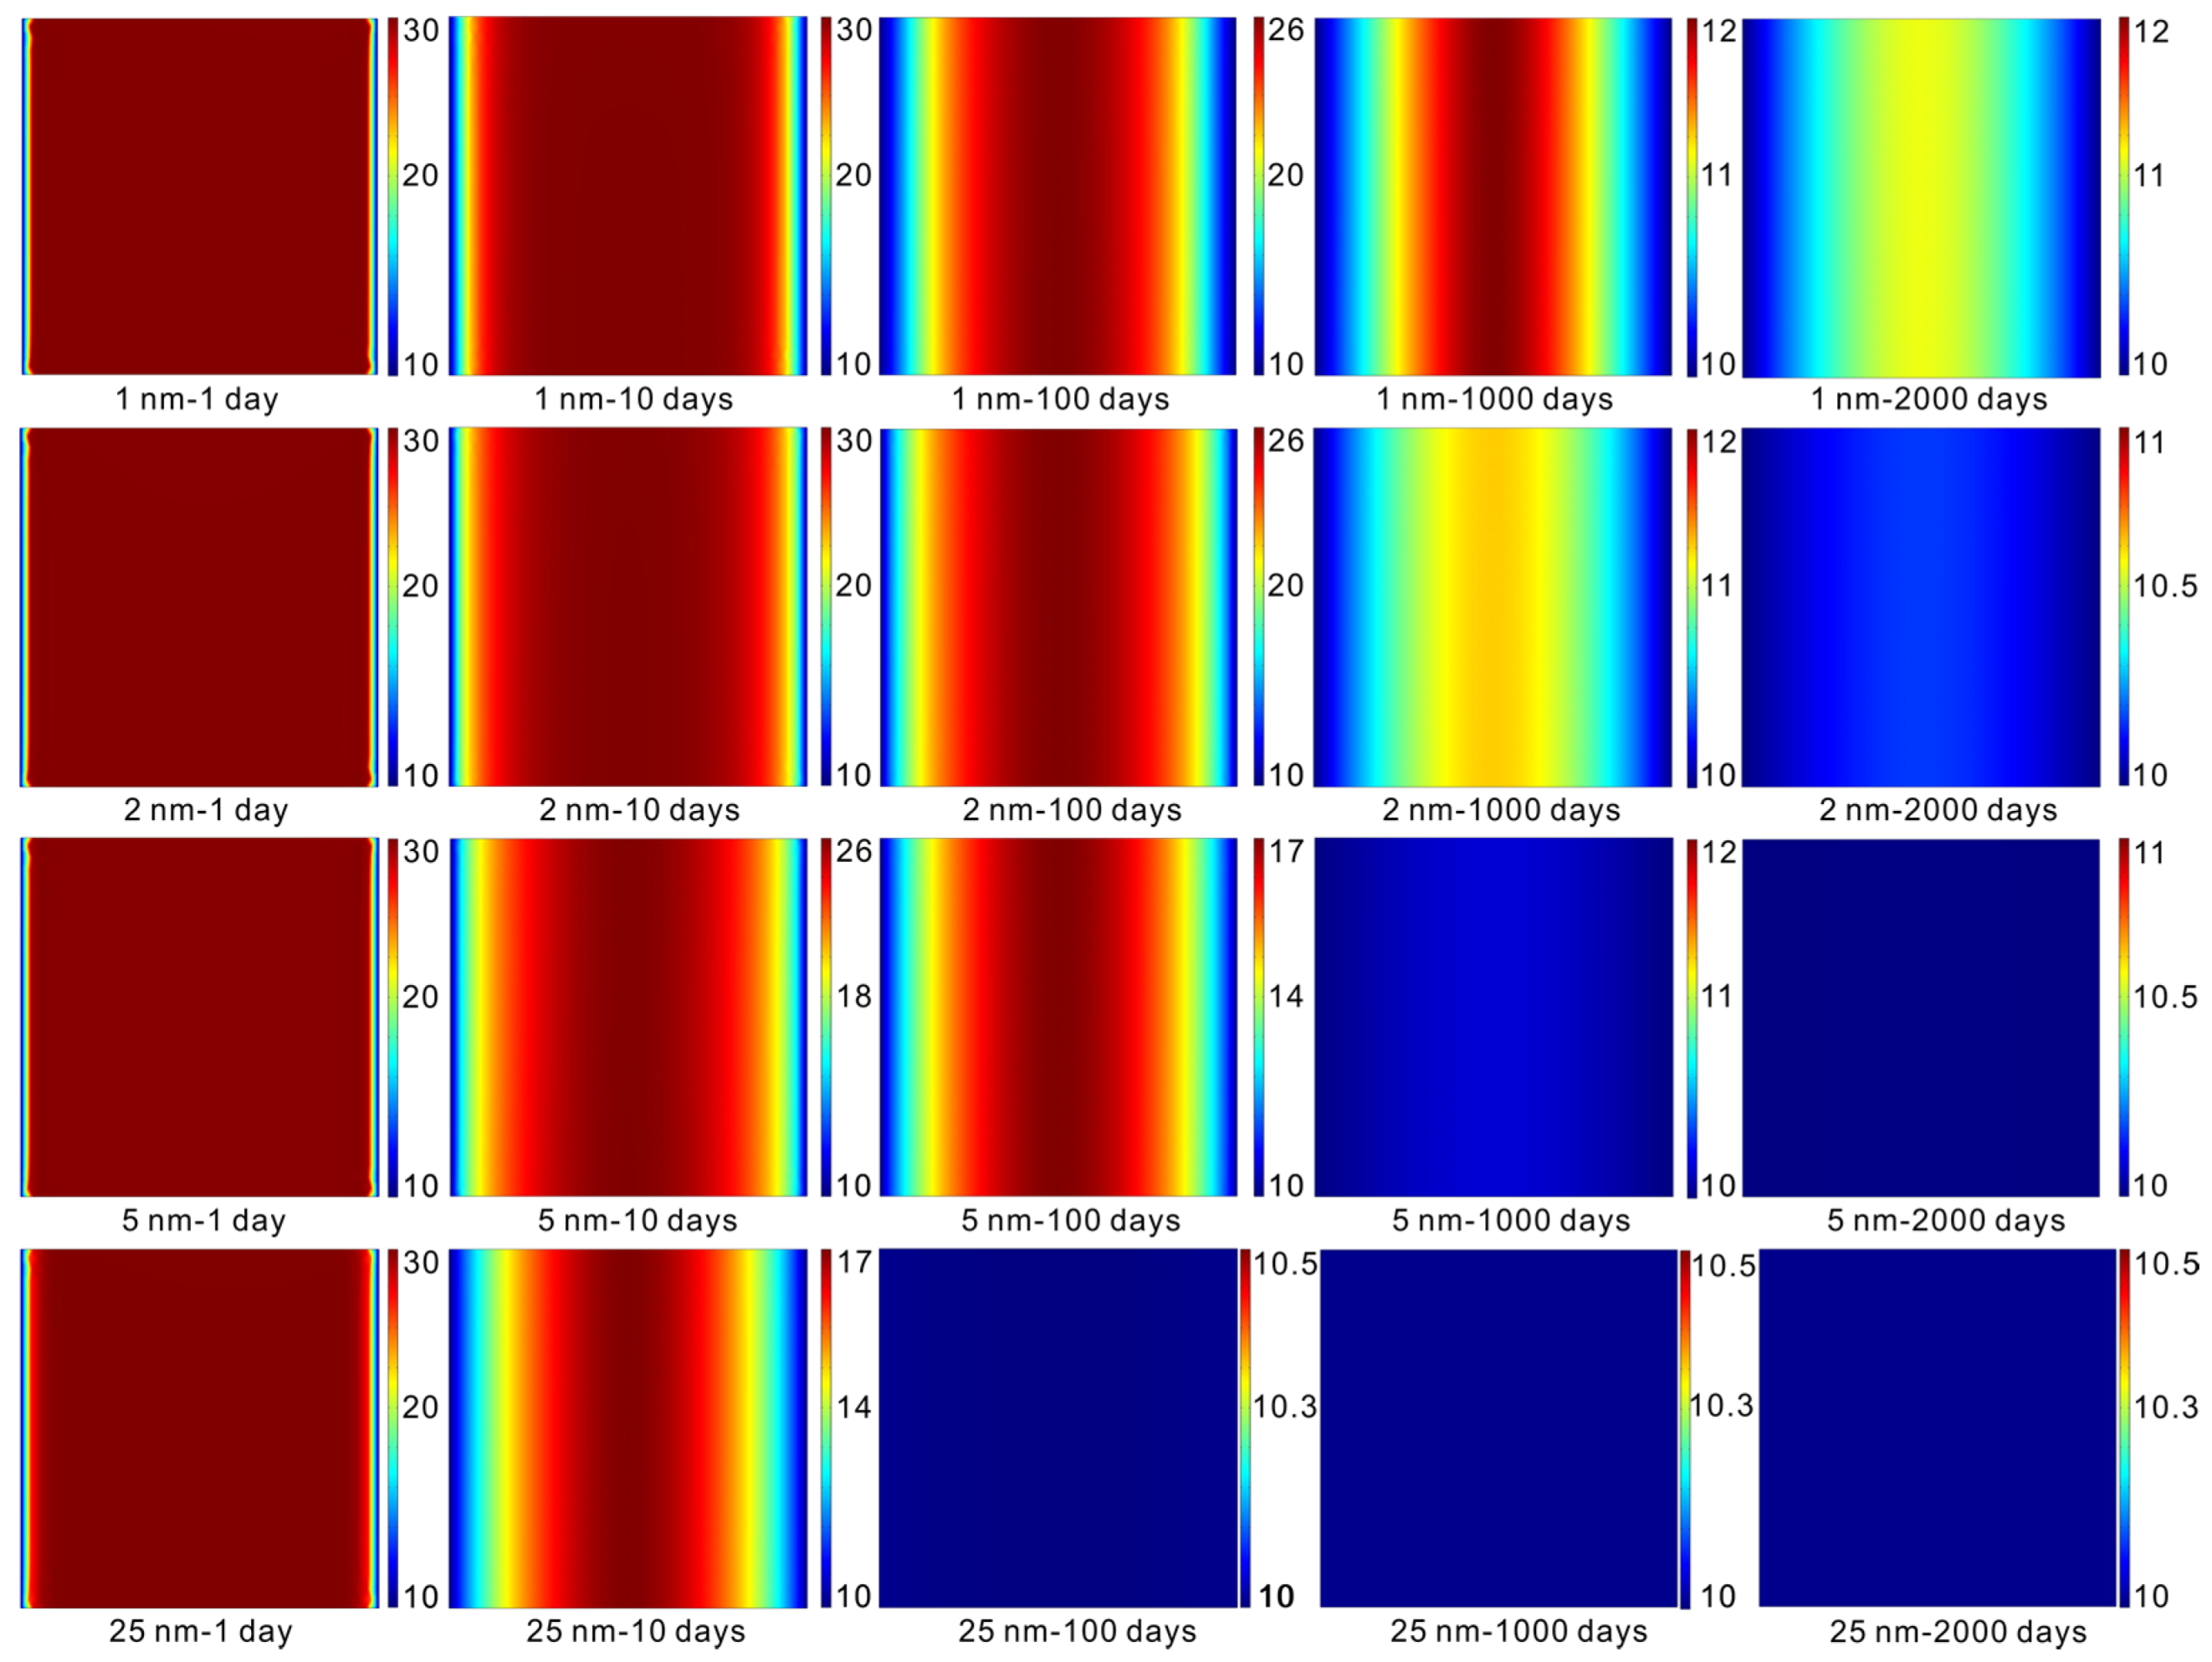
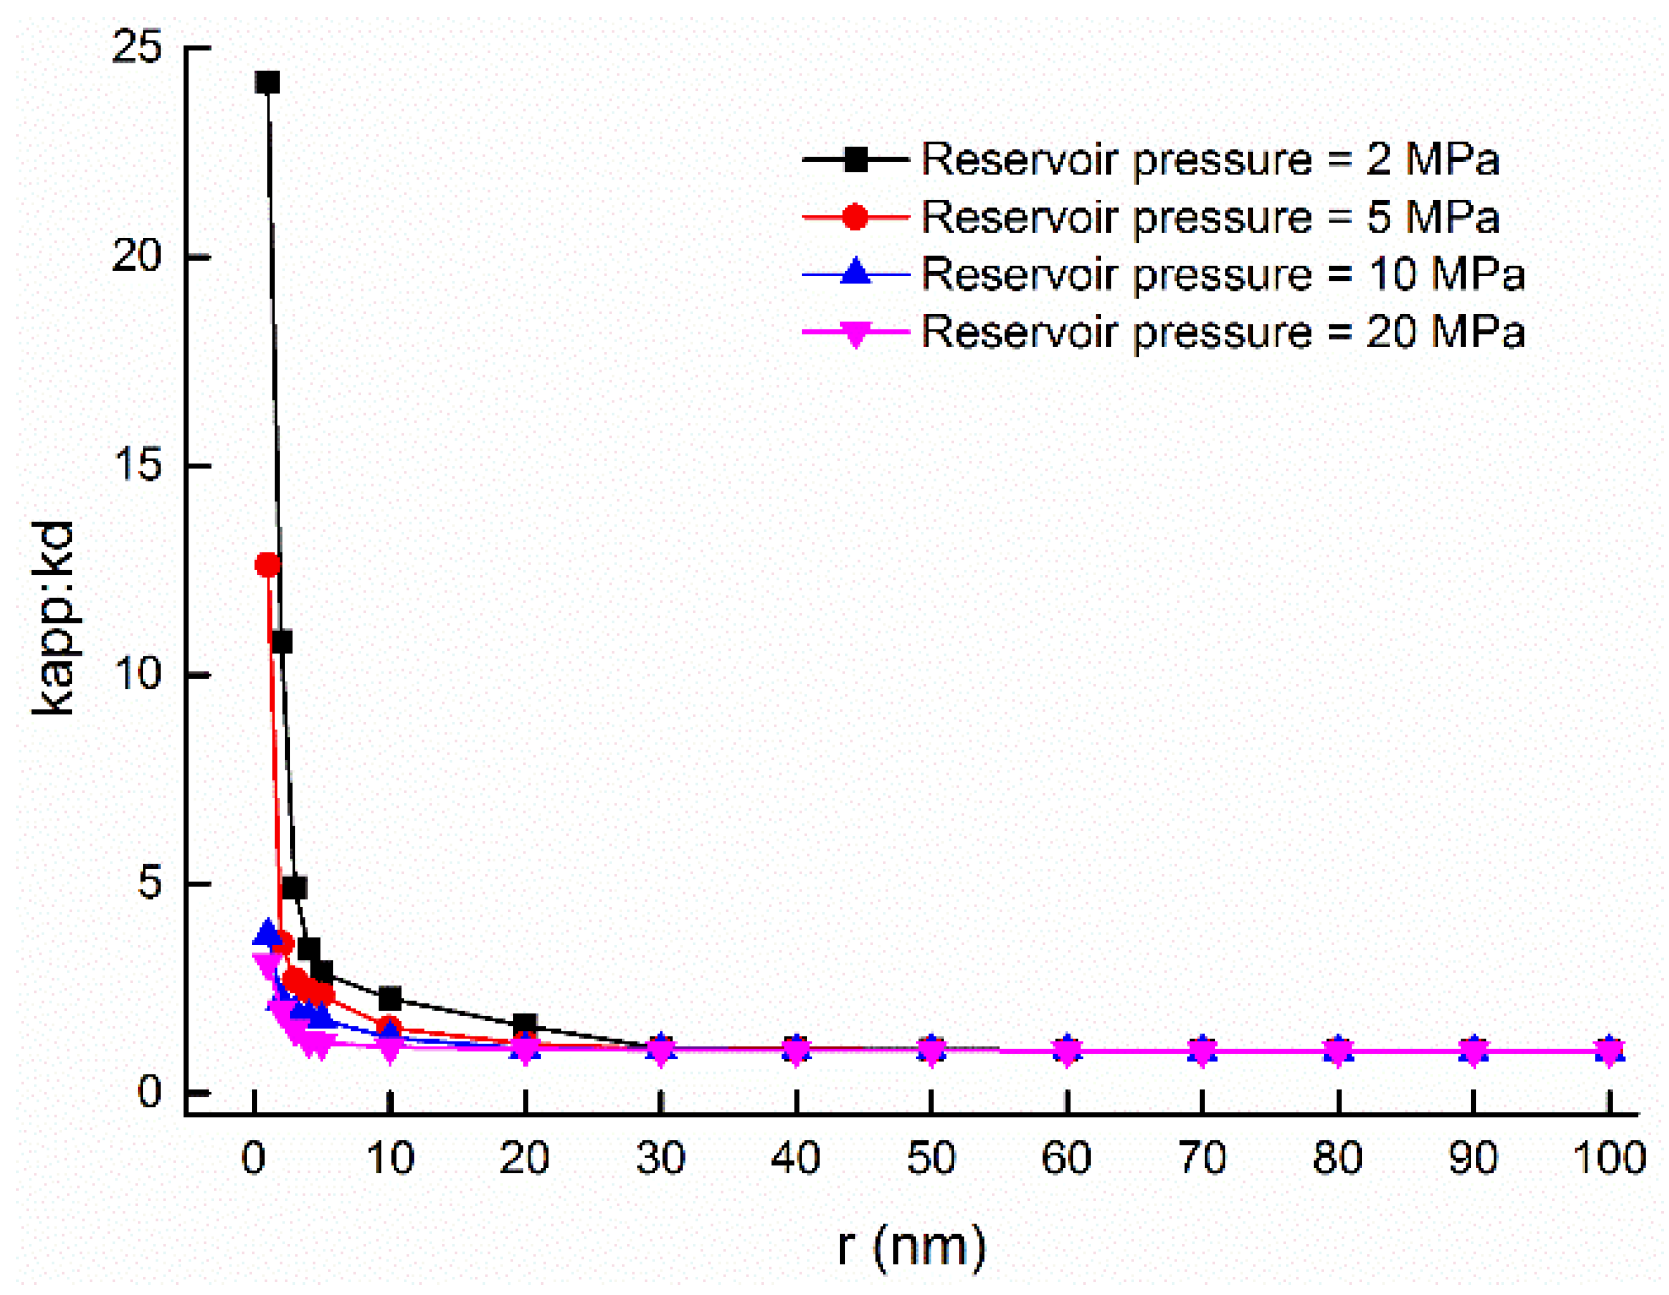
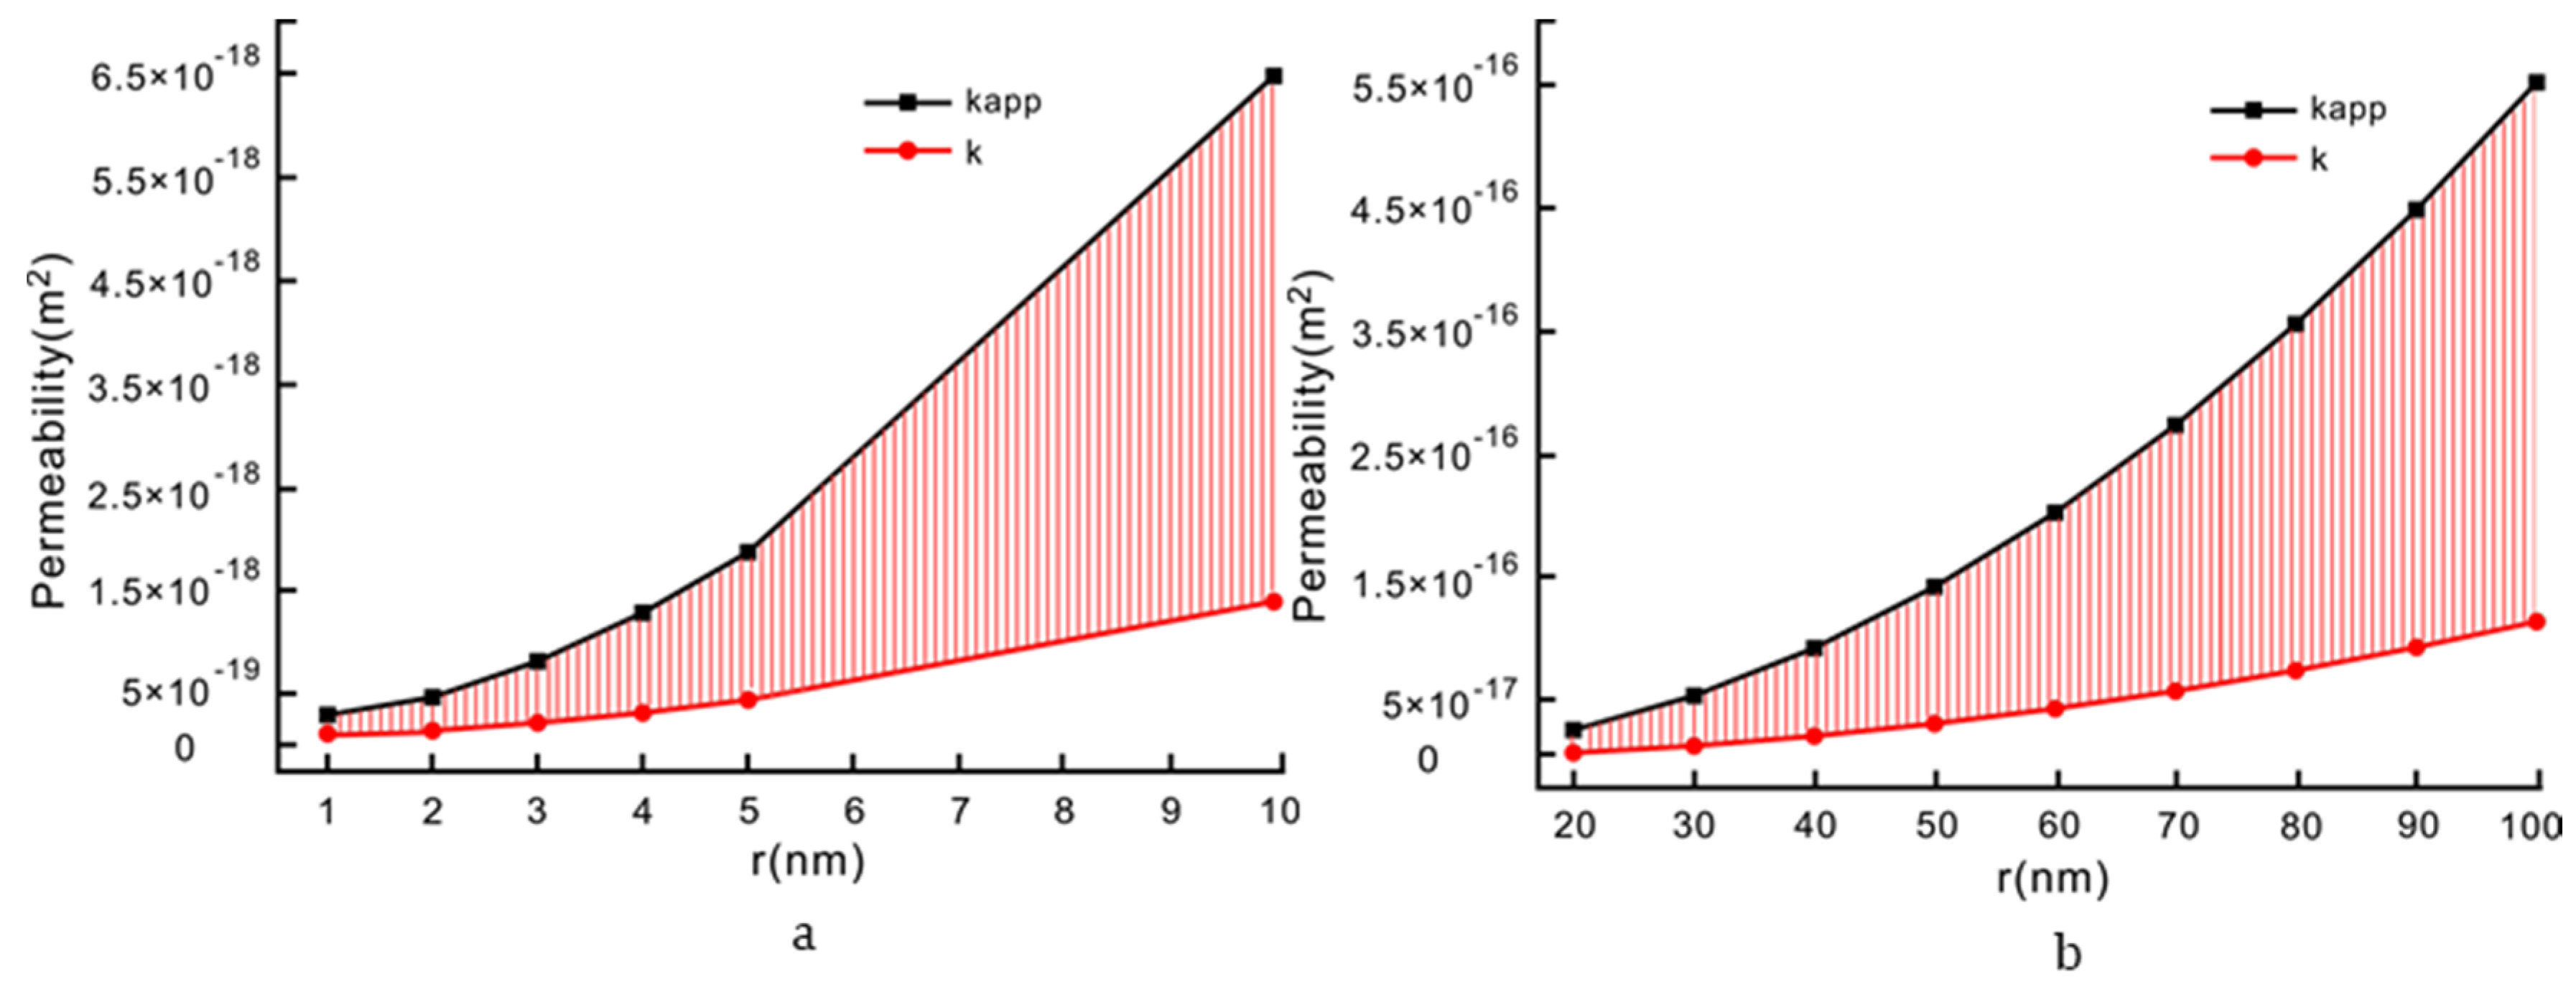
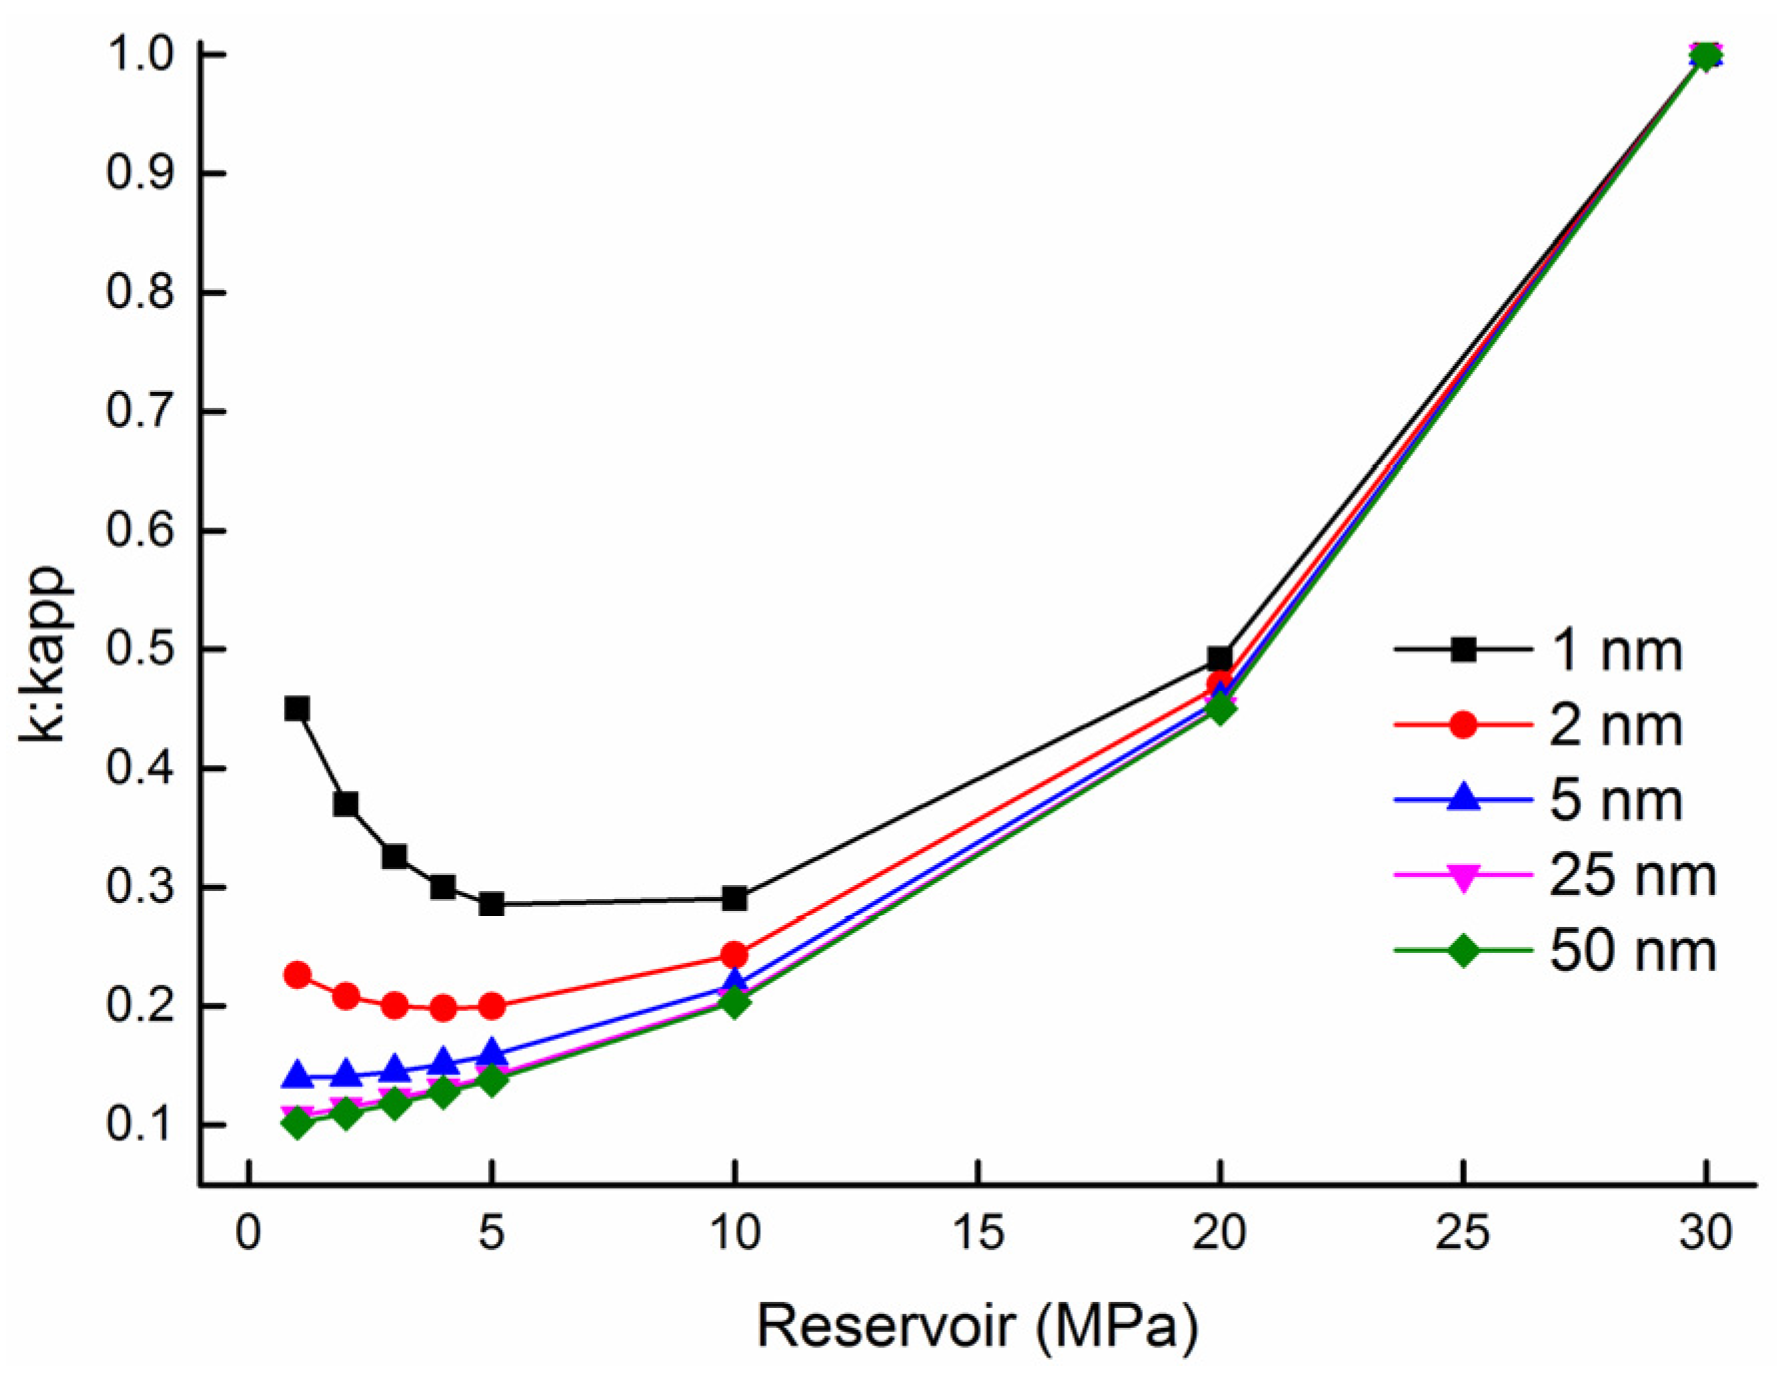
5.1. Apparent Permeability Evaluation during Production

In this section, the shale block pressure distribution is shown in Figure 5. With gas production, the pressure of the matrix block near the outflow boundary slowly becomes equal to the fracture pressure (10 MPa). The pore size significantly affects the reservoir pressure distribution. An increased pore size of the shale promotes rapid penetration of gas and the shale block pressure rapidly decreases to the fracture pressure. When the nanopores are micropores and mesopores (pore radius below 2 nm), after 2000 days of production, the pressure in the middle of the model is still higher than the well pressure. This suggests that more intensive fractures should be developed in shale reservoirs to obtain more gas.
The monitoring line is used to show the pressure distribution from the center of the reservoir block to the boundary at different pore sizes and production times (shown in Figure 6). Note that the gas pressure drops significantly at the boundary of the fracture. However, when the nanopores are micropores and mesopores (pore radius below 2 nm), the gas pressure in the block still remains unchanged even the gas seepage into the fracture boundary for a long time. The reason is the fact that gas migrates at a very slow rate due to the low permeability in micropores and mesopores. The pressure distribution at the pore radii ranges of 5 nm and 25 nm are shown in Figure 6c,d, respectively. As shown, the pore size enlargement increases rapidly the reservoir seepage capacity, and the gas flows into the low-pressure region of the fracture in a very short period of time. Thus, it should be noted that the pore size plays an important part in gas flow process and permeability evaluation. In the following section, the evolution of apparent permeability should be analyzed in more detail.
Apparent permeability evaluation positively correlated with changes in pore size is shown in Figure 7. A major difference of the permeability evolution for Figure 7a,b can be observed. As shown in Figure 7a, the pore radius increases from 20 nm to 100 nm, and the permeability is increased by about 20 times. However, the pore size increases from 1 nm to 5 nm, and the permeability is only increased by eight times in Figure 7b. It is found that the change in permeability is inconsistent with the pore size, which means that gas multiple flow mechanisms and geological conditions such as reservoir pressure, temperature, and pore size could affect the permeability evaluation in nanopores.
The ratio of apparent permeability to Darcy permeability at different pore sizes and reservoir pressures is shown in Figure 8. As displayed, the k a p p : k d ratio is higher in a small radius, especially a pore radius below 5 nm. These results show one to two orders of magnitude change in permeability and explain the unusual gas production from these tight reservoir systems. Thus, this implies that the changes in pore size should be fully considered and shale permeability should be adjusted in the shale reservoirs. Furthermore, with the pore size and reservoir pressure gradually increasing, the shale pore characteristics are similar to those of traditional high permeability reservoirs, and the apparent permeability is gradually reduced to the Darcy permeability. Pore radius as small as 100 nm show no differences between the apparent permeability and the Darcy permeability. This also fits well with the actual situation that the pore size in conventional reservoirs is macroscopic.
In addition to the pore size, the reservoir pressure and temperature also influence the ratio of apparent permeability to Darcy permeability (Figure 9). As shown in Figure 9, increasing temperature results in higher apparent permeability at any pressure step because the collisions between molecules increase. For low reservoir pressure, the mean free path of gas molecules increases, leading to a higher collision frequency between the nanopore surface and gas molecules. Hence the difference between the apparent permeability and the initial Darcy permeability is expanded. The ratio of apparent permeability to Darcy permeability gradually becomes equal to 1 along with the pressure increases. The reason for this is the fact that gas molecules move and collide rapidly and then the gas flow regime is in close proximity to the continuum flow. As a result, the apparent permeability should be carefully adjusted along with the production of shale reservoirs. Simultaneously, lab measurements must be performed under reservoir geological conditions as well as at different pressures and temperatures to generate a data bank of apparent permeability.

5.2. Weight Ratios of Gas Flow Mechanisms and Its Influenced Factors

Based on Equations (14) and (17), the weight ratios for different flow mechanisms as the functions of the pore size, reservoir pressure, and temperature are obtained in this part. These ratios represent the percentage of the contribution of different flow regime to the total flux.
As shown in Figure 10, surface diffusion and Knudsen diffusion account for a large proportion of total flux. In particular, surface diffusion dominates when the pore size is below 2 nm. The flow in the nanopores is almost entirely slip flow when the pores are macropores (r > 25 nm). Due to the pore radius being less than 2 nm and a higher concentration of gas molecules on the surface of nanopores, the weight coefficient of surface diffusion increases. A larger pore size leads to an increase in the proportion of slip flow due to the increased frequency of collisions between gas molecules. This also confirms that increased pore size causes the gas flow to transform into a viscous continuous flow. The results in the figure show that the proportion of different flow regimes varies greatly, as the pore size ranges from 1 to 5 nm, indicating the flow mechanism is more sensitive to micropores and mesopores. In addition, the results suggest that the apparent permeability is carefully influenced by gas multiple flow mechanisms in micro- and meso-pores.
The effect of the reservoir pressure on the weight of different flow mechanisms is presented in Figure 11. Under a low pressure condition, the velocity of gas flow slows down, gas molecules accumulate on the surface of the pore walls, thus surface diffusion accounts for a larger proportion. With an increase in reservoir pressure, more gas molecules participate in the collisions between the gas molecules and slip flow dominates. However, Knudsen diffusion is related to the collisions between the gas molecules and pore walls, and its weight increases first and then decreases as the reservoir pressure rises. This is probably a consequence of the pressure transition region between low to high pressure. The results show that when the reservoir pressure is lower than 5 MPa, the flow mechanism changes significantly, which indicates that the apparent permeability is more sensitive to low pressure.
The effect of temperature on the contribution of the flow mechanism to the total flux is presented in Figure 12. The result shows that temperature has the lowest effect on the flow regime. According to Equations (6) and (7), a higher reservoir temperature increases the free path of gas molecules and reduces the Knudsen number. The gas flow regime changes from Knudsen flow to slip flow (shown in Figure 2). Thus, the weight coefficient of slip flow increases under the higher temperature in Figure 12. However, surface diffusion shows the least sensitivity to temperature mainly because the diffusion coefficient is only associated with gas concentration on the nanopore surface.

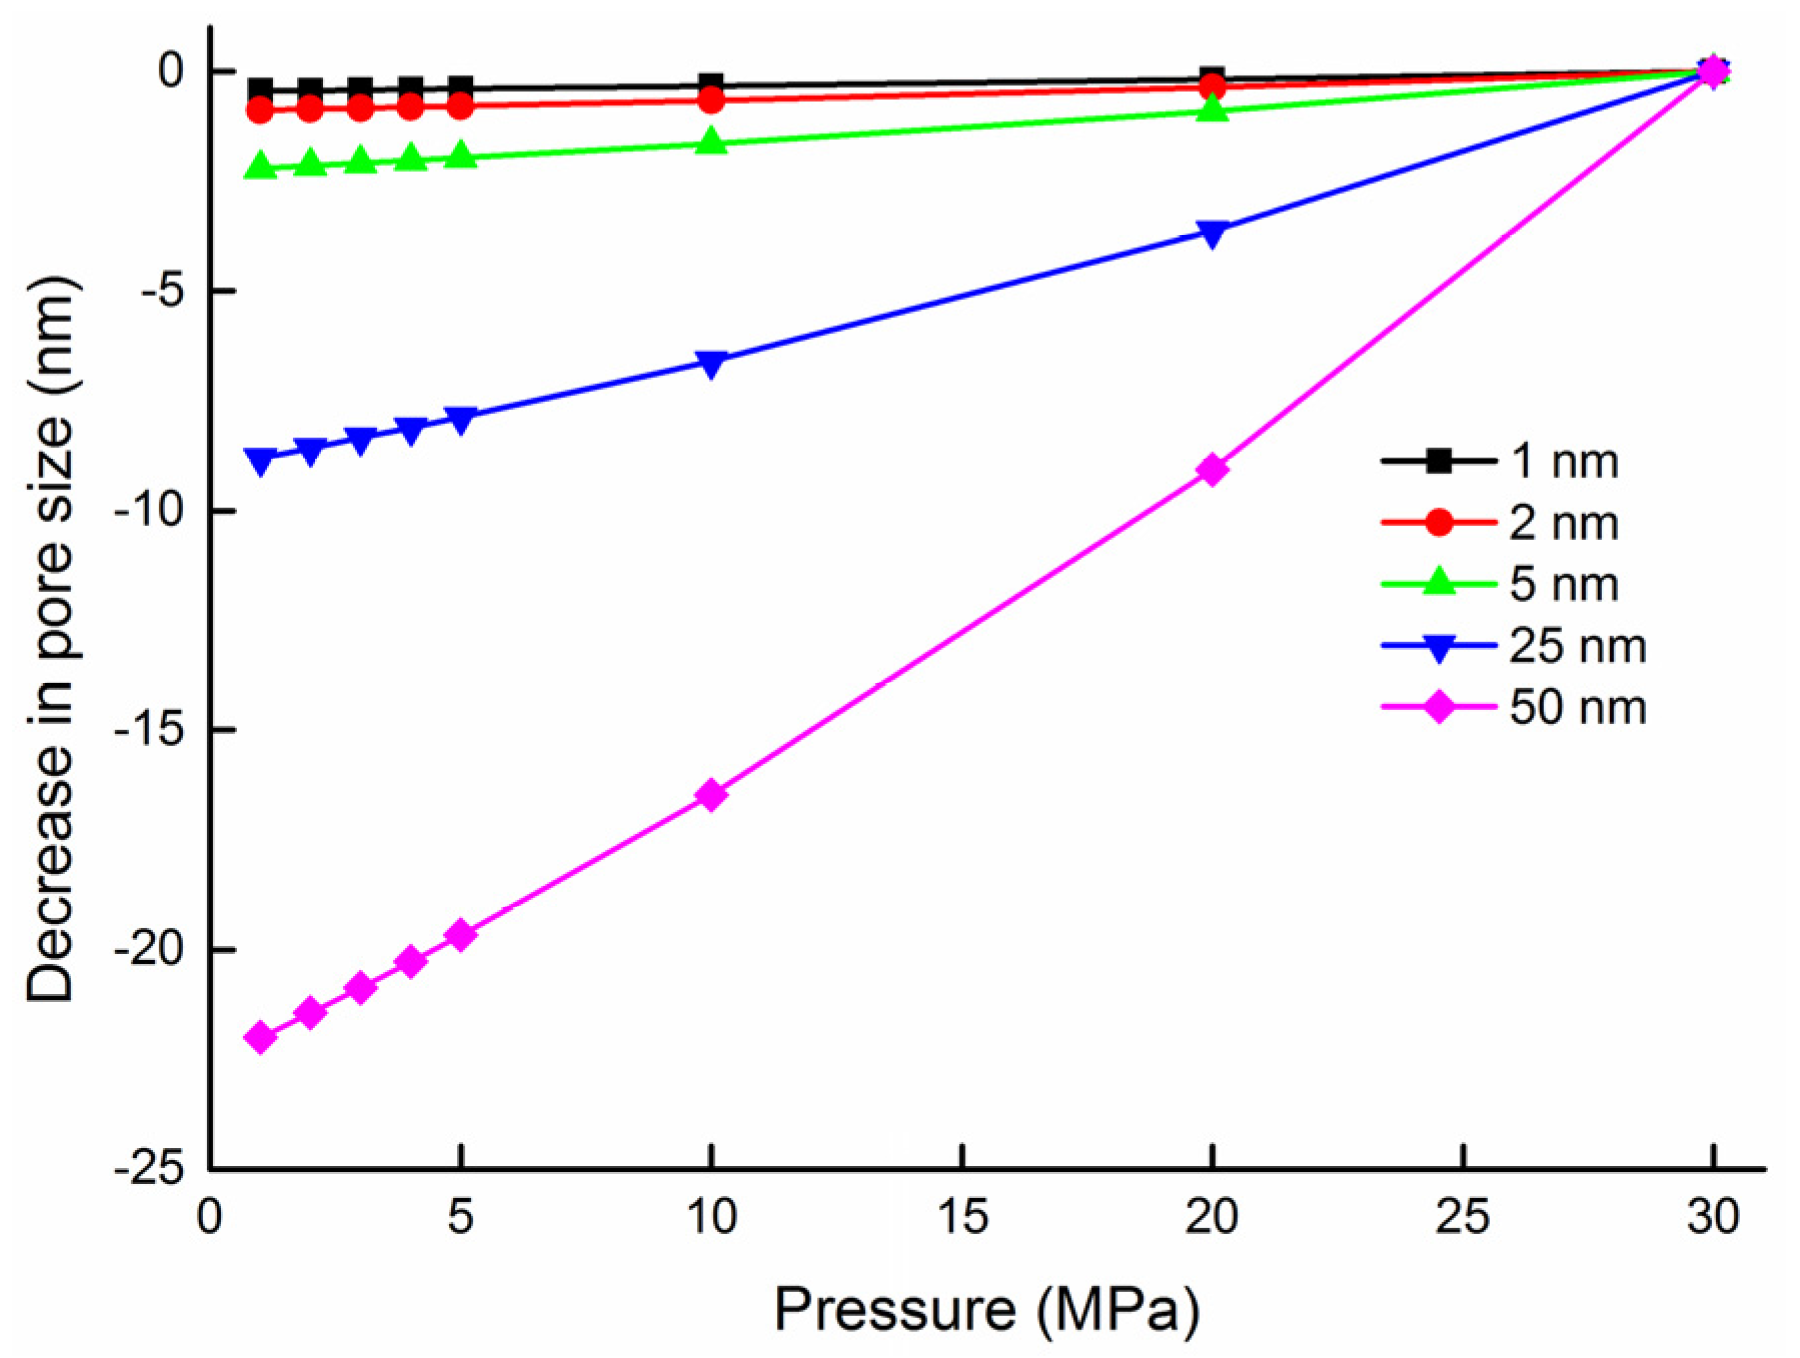
5.3. Permeability Dynamic Change

In this part, the changes of pore size and permeability caused by matrix shrinkage and stress sensitivity were calculated based on Equation (28). The influence of matrix shrinkage on pore size changes is shown in Figure 13, gas desorbed from the surface causes matrix skeleton shrinkage, resulting in pore size enlargement. The reservoir pressure decreases, leading more gas to desorb from the nanopore wall and a greater increment in the pore size. Thus, gas adsorption significantly causes matrix shrinkage and increases shale permeability.
The effect of stress sensitivity on the decrease in the pore radius is presented in Figure 14. As displayed, during depressurization development of shale reservoirs, the effective stress of matrix skeleton increases, resulting in matrix skeleton expansion and pore closure. It is found that the changes of the pore size are insignificant in the period of depressurization, as the pore is micropore (pore radius below 2 nm). The reason is the fact that a smaller nanopore size leads to more contacts among the matrix particles, which decreases the compression of the matrix framework.
The apparent permeability and dynamic permeability evaluation are shown in Figure 15. Permeability is positively correlated with the pore size and is more sensitive to large pore sizes, which is also shown in Figure 7. The complex flow mechanisms in micro- and meso-pores lead to inconspicuous changes in permeability. In addition, the changes of permeability are influenced by stress sensitivity and matrix shrinkage. With the decrease in reservoir pressure, gas desorption leads to matrix shrinkage and pore size expansion. In contrast, the pore size decreases due to an increase in the effective stress of matrix skeleton. However, the combined actions of gas desorption and effective stress lead a reduction in the pore diameter. As a result, dynamic permeability is lower than apparent permeability due to pore size reduction. The simulation results show that the dynamic permeability declines monotonically by about 1 order of magnitude compared to the apparent permeability. This also clearly confirms the fact that the permeability of the reservoir is declining during the production process. Thus, the changes in dynamic permeability could more accurately reflect the permeability evaluation during gas production.

5.4. Comparions of Apparment Permeability Model to Previous Models

In this section, the ratio of apparent permeability to Darcy permeability in this article was compared to the results obtained from previous models with the same settings [15,24]. The ratio was calculated by Equation (19) at the reservoir pressure of 5 MPa and the temperature of 350 K. The comparison results were shown in Figure 16. It is found that the ratios in these models are gradually expanding along the decrease of pore size, which is caused by gas multiple flow mechanisms in micro- and meso-pore (below 20 nm). However, some major differences can be found between these models. As shown, the ration in this paper higher than the results from Klinkenberg’s model [24] and Beskok and Karniadaki’s model [15] within the pore size range presented in Figure 16. The reason is the fact that gas multiple flow mechanisms are characterized by different equations in this paper, whereas only skip flow is considered in Klinkenberg’s model and a single equation describes flow regimes in Beskok and Karniadaki’s model. In addition, the ratio in this paper has a more significantly declining trend and the deviation of the ratio is higher when the pore is micropore (below 2 nm). This is caused by the fact that the surface diffusion is added in the part of gas flow mechanisms in this paper compared to other models. Thus, the ration of apparent permeability to Darcy permeability presented in Figure 16 suggests that surface diffusion plays a non-negligible part in the gas flow process, especially if the nanopore is a micropore. Moreover, gas multiple flow mechanisms should be more accurately characterized by different methods in the apparent permeability model.
Compared to previous studies, permeability evaluation caused by stress sensitivity and matrix shrinkage was added and calculated by Equation (28). The ratio of dynamic permeability to apparent permeability that shows the changes of permeability caused by stress sensitivity and matrix shrinkage at different reservoir pressures and pore sizes is presented in Figure 17. As displayed, along with production, the ratio of dynamic permeability to apparent permeability has been consistently below 1 as a consequence of matrix shrinkage and effective stress. However, the ratio drops along with the reservoir pressure and then increases gradually when the nanopore is a micropore (below 2 nm). This is caused by the fact that more shale gas is adsorbed on the pore surface due to the larger the specific surface area in micropores. In addition, the gas flow is slow at low pressure and the differences of stress are low. Thus, the matrix expansion caused by the effective stress should be weakened and matrix shrinkage accounts for the more changes of pore size under low reservoir pressure. As shown, the ratio increases gradually along with reservoir pressure as the pore is meso- and macro-pore (above 5 nm). The reason is the fact that there is less adsorbed gas and higher gas flow velocity in nanopores as the pore size enlarges. Moreover, the particle connection of matrix is weakened and more susceptible to effective stress, resulting in a significant decrease in pore size. The results in Figure 17 suggest that the effect of stress sensitivity and matrix shrinkage should be carefully included in the shale permeability evaluation models. More accurate knowledge of the factors affecting the pore size and permeability may help in the optimization of shale gas production.

6. Conclusions

Gas flow mechanisms and permeability evolution are particularly important to evaluate the capacity of shale gas production. In this paper, gas multiple mechanisms in shale nanopores were studied. Specifically, an apparent permeability model and dynamic permeability equations were developed and incorporated into a numerical model by the COMSOL solver. According to theoretical research and numerical analysis, the following conclusions were obtained.
Gas complex flow mechanisms and the collisions between gas molecules and pore walls increase the apparent permeability. As calculated, the ratio of the apparent permeability to the Darcy permeability presents 1-2 orders of magnitude change and explains the unusual gas production from shale reservoirs. The evaluation of apparent permeability shows more sensitivity to small pore sizes (1-10 nm) and low reservoir pressures (below 5 MPa). The surface diffusion, slip flow, and Knudsen flow exists in shale nanopores, and their weights vary widely when the pore size ranges from 1 to 5 nm and the pressure is below 5 MPa. This is why the shale apparent permeability is affected by geological factors and multiple flow mechanisms during gas production. In addition, the results infer that gas flow mechanisms should be characterized by separate equations in the apparent model.
Compared to the apparent permeability, the dynamic permeability declines monotonically by about 1 order of magnitude due to the pore size reduction caused by the combined effects of stress sensitivity and matrix shrinkage. This verifies that shale permeability gradually decreases over a long period of production. Moreover, matrix shrinkage and stress sensitivity act opposite directions in shale permeability, and the degree of action is associated with pore size and reservoir pressure. Thus, the comparison result suggests that permeability should be carefully adjusted along with the production of shale reservoirs.

Author Contributions

Conceptualization, X.F. and H.Z.; Data curation, G.L.; Funding acquisition, F.M.; Investigation, X.F., G.L. and J.G.; Methodology, H.Z.; Project administration, F.M.; Software, X.F.; Writing—original draft, X.F.; Writing—review & editing, H.Z.

Funding

This research was funded by the Strategic Priority Research Program of the Chinese Academy of Sciences (No. XDB10030602) and the Natural Science Foundation of China (No. 41372325). And The APC was funded by the Strategic Priority Research Program of the Chinese Academy of Sciences (No. XDB10030602). Grateful appreciation is expressed for these supports.

Conflicts of Interest

The authors declare no conflict of interest.

References

  1. Curtis, J.B. Fractured shale-gas systems. AAPG Bull. 2002, 86, 1921–1938. [Google Scholar] [CrossRef]
  2. Liu, H.X.; Li, J.L. The US Shale Gas Revolution and Its Externality on Crude Oil Prices: A Counterfactual Analysis. Sustainability 2018, 10, 697. [Google Scholar] [CrossRef]
  3. Howarth, R.W.; Santoro, R.; Ingraffea, A. Methane and the greenhouse–gas footprint of natural gas from shale formation. Clim. Chang. 2011, 106, 679–690. [Google Scholar] [CrossRef]
  4. Rahm, D. Regulating hydraulic fracturing in shale gas plays: The case of Texas. Energy Policy 2011, 39, 2974–2981. [Google Scholar] [CrossRef]
  5. Zhang, Q.; Su, Y.; Wang, W.; Lu, M.; Sheng, G. Apparent permeability for liquid transport in nanopores of shale reservoirs: Coupling flow enhancement and near wall flow. Int. J. Heat Mass Transf. 2017, 115, 224–234. [Google Scholar] [CrossRef]
  6. Wang, S.; Javadpour, F.; Feng, Q. Fast mass transport of oil and supercritical carbon dioxide through organic nanopores in shale. Fuel 2016, 181, 741–758. [Google Scholar] [CrossRef]
  7. Wang, S.; Javadpour, F.; Feng, Q. Molecular dynamics simulations of oil transport through inorganic nanopores in shale. Fuel 2016, 171, 74–86. [Google Scholar] [CrossRef]
  8. Wu, K.; Li, X.; Guo, C.; Wang, C.; Chen, Z. A unified model for gas transfer in nanopores of shale–gas reservoirs: Coupling pore diffusion and surface diffusion. SPE J. 2016, 21, 1583–1611. [Google Scholar] [CrossRef]
  9. Javadpour, F.; Farshi, M.M.; Amrein, M. Atomic–force microscopy: A new tool for gas–shale characterization. J. Can. Pet. Technol. 2012, 51, 236–243. [Google Scholar] [CrossRef]
  10. Nozawa, M.; Tanizawa, K.; Kanaoka, Y. BIB–SEM study of the pore space morphology in early mature Posidonia shale from the Hils area, Germany. Int. J. Coal Geol. 2012, 103, 12–25. [Google Scholar] [CrossRef]
  11. Mehmani, A.; Prodanović, M.; Javadpour, F. Multiscale, multiphysics network modeling of shale matrix gas flows. Transp. Porous Media 2013, 99, 377–390. [Google Scholar] [CrossRef]
  12. Javadpour, F. Nanopores and apparent permeability of gas flow in mudrocks (shales and siltstone). J. Can. Pet. Technol. 2009, 48, 16–21. [Google Scholar] [CrossRef]
  13. Lilley, C.R.; Sader, J.E. Velocity profile in the knudsen layer according to the boltzmann equation. Proc. Math. Phys. Eng. Sci. 2008, 464, 2015–2035. [Google Scholar] [CrossRef]
  14. Wu, T.; Zhang, D. Impact of adsorption on gas transport in nanopores. Sci. Rep. 2016, 6, 23629. [Google Scholar] [CrossRef]
  15. Beskok, A.; Karniadakis, G.E. Report: A model for flows in channels, pipes, and ducts at micro and nano scales. Microscale Thermophys. Eng. 1999, 3, 43–77. [Google Scholar] [CrossRef]
  16. Hornyak, G.L.; Tibbals, H.F.; Dutta, J.; Moore, J.J. Introduction to Nanoscience and Nanotechnology; CRC Press: Boca Raton, FL, USA, 2009. [Google Scholar]
  17. Karniadakis, G.; Beskok, A.; Aluru, N. Microflows and Nanoflows: Fundamentals and Simulation; Springer: New York, NY, USA, 2005. [Google Scholar]
  18. Bird, G.A. Molecular Gas Dynamics and the Direct Simulation of Gas Flows; Clarendon Press: Oxford, UK, 2003. [Google Scholar]
  19. Guo, Z.; Shi, B.; Zheng, C.G. An extended Navier–Stokes formulation for gas flows in the Knudsen layer near a wall. Europhys. Lett. 2007, 80, 24001. [Google Scholar] [CrossRef]
  20. Ziarani, A.S.; Aguilera, R. Knudsen’s permeability correction for tight porous media. Transp. Porous Media 2012, 91, 239–260. [Google Scholar] [CrossRef]
  21. Maxwell, J.C. On stresses in rarified gases arising from inequalities of temperature. Philos. Trans. R. Soc. Lond. 1879, 170, 231–256. [Google Scholar] [CrossRef]
  22. Knudsen, M. Die Gesetze der Molekularströmung und der inneren Reibungsströmung der Gase durch Röhren. Ann. Phys. 1909, 333, 75–130. [Google Scholar] [CrossRef]
  23. Pollard, W.G.; Present, R.D. On gaseous self–diffusion in long capillary tubes. Phys. Rev. 1948, 73, 762–774. [Google Scholar] [CrossRef]
  24. Klinkenberge, L.J. The permeability of porous media to liquids and gases. Drill. Prod. Pract. 1941, 22, 200–213. [Google Scholar] [CrossRef]
  25. Ertekin, T.; King, G.R.; Schwerer, F.C. Dynamic gas slippage: A unique dual–mechanism approach to the flow of gas in tight formations. SPE Form. Eval. 1986, 1, 43–52. [Google Scholar] [CrossRef]
  26. Javadpour, F.; Fisher, D.; Unsworth, M. Nanoscale gas flow in shale gas sediments. J. Can. Pet. Technol. 2007, 46, 55–61. [Google Scholar] [CrossRef]
  27. Civan, F. Effective correlation of apparent gas permeability in tight porous media. Transp. Porous Media 2010, 82, 375–384. [Google Scholar] [CrossRef]
  28. Civan, F.; Rai, C.S.; Sondergeld, C.H. Shale–gas permeability and diffusivity inferred by improved formulation of relevant retention and transport mechanisms. Transp. Porous Media 2011, 86, 925–944. [Google Scholar] [CrossRef]
  29. Ren, W.; Li, G.; Tian, S.; Sheng, M.; Geng, L. Adsorption and surface diffusion of supercritical methane in shale. Ind. Eng. Chem. Res. 2017, 56, 3446–3455. [Google Scholar] [CrossRef]
  30. Wu, K.; Li, X.; Wang, C.; Yu, W.; Chen, Z. Model for surface diffusion of adsorbed gas in nanopores of shale gas reservoirs. Ind. Eng. Chem. Res. 2015, 54, 3225–3236. [Google Scholar] [CrossRef]
  31. Wu, K.; Chen, Z.; Li, X.; Guo, C.; Wei, M. A model for multiple transport mechanisms through nanopores of shale gas reservoirs with real gas effect–adsorption–mechanic coupling. Int. J. Heat Mass Transf. 2016, 93, 408–426. [Google Scholar] [CrossRef]
  32. George, J.D.S.; Barakat, M.A. The change in effective stress associated with shrinkage from gas desorption in coal. Int. J. Coal Geol. 2001, 45, 105–113. [Google Scholar] [CrossRef]
  33. Harpalani, S.; Schraufnagel, R.A. Influence of matrix shrinkage and compressibility on gas production from coalbed methane reservoirs. In Proceedings of the SPE Annual Technical Conference and Exhibition, New Orleans, LA, USA, 23–26 September 1990; pp. 338–339. [Google Scholar]
  34. Levine, J.R. Model study of the influence of matrix shrinkage on absolute permeability of coal bed reservoirs. Geol. Soc. Lond. Spec. Publ. 1996, 109, 197–212. [Google Scholar] [CrossRef]
  35. An, C.; Fang, Y.; Liu, S.; Alfi, M.; Yan, B.; Wang, Y. Impacts of Matrix Shrinkage and Stress Changes on Permeability and Gas Production of Organic–Rich Shale Reservoirs. In Proceedings of the SPE Reservoir Characterisation and Simulation Conference and Exhibition, Abu Dhabi, UAE, 8–10 May 2017. [Google Scholar]
  36. Dong, J.J.; Hsu, J.Y.; Wu, W.J.; Shimamoto, T.; Hung, J.H.; Yeh, E.C. Stress–dependence of the permeability and porosity of sandstone and shale from TSDP Hole–A. Int. J. Rock Mech. Min. Sci. 2010, 47, 1141–1157. [Google Scholar] [CrossRef]
  37. Mckee, C.R.; Bumb, A.C. Stress–dependent permeability and porosity of coal. SPE Form. Eval. 1998, 3, 81–91. [Google Scholar] [CrossRef]
  38. Fan, D.; Ettehadtavakkol, A.; Chen, X.; Zhang, J.; Lu, J. Analytical model of gas transport in heterogeneous hydraulically-fractured organic-rich shale media. Fuel 2017, 207, 625–640. [Google Scholar] [CrossRef]
  39. Chong, Z.; Li, X.; Chen, X.; Zhang, J.; Lu, J. Numerical investigation into the effect of natural fracture density on hydraulic fracture network propagation. Energies 2017, 10, 914. [Google Scholar] [CrossRef]
  40. Bowker, K.A. Barnett shale gas production, Fort Worth basin: issues and discussion. AAPG Bull. 2007, 91, 523–533. [Google Scholar] [CrossRef]
  41. Wang, H.; Qu, Z.G.; Yin, Y.; Bai, J.Q.; Yu, B. Review of molecular simulation method for gas adsorption/desorption and diffusion in shale matrix. J. Therm. Sci. 2019, 28, 1–16. [Google Scholar] [CrossRef]
  42. Cunningham, R.E.; Williams, R.J.J. Diffusion in Gases and Porous Media; Springer: New York, NY, USA, 1980. [Google Scholar]
  43. Krishna, R.; Wesselingh, J. The Maxwell Stefan approach to mass transfer. Chem. Eng. Sci. 1997, 52, 861–911. [Google Scholar] [CrossRef]
  44. Guo, L.; Peng, X.; Wu, Z. Dynamical characteristics of methane adsorption on monolith nanometer activated carbon. J. Chem. Ind. Eng. 2008, 59, 2726–2732. [Google Scholar] [CrossRef]
  45. Keliu, W.U.; Xiangfang, L.I.; Chen, Z.X. The mechanism and mathematical model for the adsorbed gas surface diffusion in nanopores of shale gas reservoirs. Sci. China 2015, 45, 525–540. [Google Scholar]
  46. Whitaker, S. Flow in porous media i: A theoretical derivation of Darcy’s law. Transp. Porous Media 1986, 1, 3–25. [Google Scholar] [CrossRef]
  47. Lee, K.S.; Kim, T.H. Transport in Shale Reservoirs; Elsevier BV: Amsterdam, The Netherlands, 2019. [Google Scholar]
  48. Brown, G.P.; Dinardo, A.; Cheng, G.K.; Sherwood, T.K. The flow of gases in pipes at low pressures. J. Appl. Phys. 1946, 17, 802–813. [Google Scholar] [CrossRef]
  49. Wei, M.Y.; Liu, Y.L.; Liu, J.H.; Elsworth, D.; Zhou, F.H. Micro–scale investigation on coupling of gas diffusion and mechanical deformation of shale. J. Pet. Sci. Eng. 2019, 175, 961–970. [Google Scholar] [CrossRef]
  50. Carman, P.C. Flow of Gases through Porous Media; Butterworth: London, UK, 1956. [Google Scholar]
  51. Pan, Z.; Ma, Y.; Connell, L.D.; Down, D.I.; Camilleri, M. Measuring anisotropic permeability using a cubic shale sample in a triaxial cell. J. Nat. Gas Sc. Eng. 2015, 26, 336–344. [Google Scholar] [CrossRef]
  52. Kwon, O.; Kronenberg, A.K.; Gangi, A.F.; Johnson, B. Permeability of wilcox shale and its effective pressure law. J. Geophys. Res. Sol. Earth 2001, 106, 19339–19353. [Google Scholar] [CrossRef]
  53. Metwally, Y.M.; Sondergeld, C.H. Measuring low permeabilities of gas–sands and shales using a pressure transmission technique. Int. J. Rock Mech. Min. Sci. 2011, 48, 1135–1144. [Google Scholar] [CrossRef]
  54. Guo, X.S. Enrichment Mechanism and Exploration Technology of Jiaoshiba Block in Fuling Shale Gas Field; Science Press: Beijing, China, 2014. [Google Scholar]
  55. Zou, C. Unconventional Petroleum Geology; Elsevier: Amsterdam, The Netherlands, 2013; pp. 363–373. [Google Scholar]
  56. Langmuir, I. Constitution and fundamental properties of solids and liquids: Ii, liquids. J. Am. Chem. Soc. 1917, 3, 1848–1904. [Google Scholar] [CrossRef]
  57. Bangham, D.H.; Razouk, R.I. The saturation and immersion expansions and the heat of wetting. R. Soc. 1938, 166, 1471–2946. [Google Scholar] [CrossRef]
  58. Seidle, J.P.; Jeansonne, M.W.; Erickson, D.J. Application of matchstick geometry to stress dependent permeability in coals. In Proceedings of the SPE Rocky Mountain Regional Meeting, Casper, WY, USA, 18–21 May 1992. [Google Scholar]
  59. Seidle, J.R.; Huitt, L.G. Experimental measurement of coal matrix shrinkage due to gas desorption and implications for cleat permeability increases. In Proceedings of the International Meeting on Petroleum Engineering, Beijing, China, 14–17 November 1995. [Google Scholar]
  60. Bird, R.B.; Stewart, W.E.; Lightfoot, E.N. Transport Phenomena, 2nd ed.; John Wiley & Sons, Inc.: Hoboken, NJ, USA, 2007. [Google Scholar]
  61. Zheng, J.; Ju, Y.; Liu, H.H.; Zheng, L.; Wang, M. Numerical prediction of the decline of the shale gas production rate with considering the geomechanical effects based on the two–part hooke’s model. Fuel 2016, 185, 362–369. [Google Scholar] [CrossRef]
  62. COMSOL Multiphysics 5.4a. Available online: https://cn.comsol.com/ (accessed on 24 February 2019).
Figure 1. Gas multiple flow mechanisms in stimulated shale reservoir (modified from Wu et al. [31], Fan et al. [38] and Chong et al. [39]).
Sustainability 11 02114 g001
Figure 2. Gas flow regimes predominated by the Knudsen number (modified from Wu et al. [31]).
Sustainability 11 02114 g002
Figure 3. Matrix shrinkage and stress sensitivity (modified from An et al. [35] and Mckee et al. [37]).
Sustainability 11 02114 g003
Figure 4. Simulation model of gas flow in a shale block (modified from COMSOL solver [62]).
Sustainability 11 02114 g004
Figure 5. Shale block pressure distribution (MPa) at different pore radii (nm) and production times (days).
Sustainability 11 02114 g005
Figure 6. Pressure distribution on the monitoring line in the simulation model at different pore radii (nm): (a) pore radius = 1 nm; (b) pore radius = 2 nm; (c) pore radius = 5 nm; (d) pore radius = 25 nm.
Sustainability 11 02114 g006
Figure 7. Apparent permeability evaluation as a function of the pore radius (nm): (a) the pore radius range is 10-100 nm; (b) the pore radius range is 1–5 nm.
Sustainability 11 02114 g007
Figure 8. The k q p p : k d as a function of the pore radius. Temperature = 300 K.
Sustainability 11 02114 g008
Figure 9. Effect of reservoir pressure and temperature on the k q p p : k d ratio. Pore radius = 5 nm.
Sustainability 11 02114 g009
Figure 10. Contribution of the flow mechanism to total flux at different pore radii. Reservoir pressure = 5 MPa, temperature = 350 K.
Sustainability 11 02114 g010
Figure 11. Contribution of the flow mechanism to the total flux at different pressures. Pore radius = 5 nm, temperature = 350 K.
Sustainability 11 02114 g011
Figure 12. Contribution of the flow mechanism to the total flux at different temperatures. Pore radius = 5 nm, reservoir pressure = 10 MPa.
Sustainability 11 02114 g012
Figure 13. The amount of increase in the pore radius caused by matrix shrinkage. Initial pore radius = 5 nm.
Sustainability 11 02114 g013
Figure 14. The amount of decrease in the pore radius caused by stress sensitivity.
Sustainability 11 02114 g014
Figure 15. Apparent permeability k a p p and dynamic permeability k as a function of the pore radius: (a) micro- and meso-pore, (b) meso- and macro-pore.
Sustainability 11 02114 g015
Figure 16. The ratio of apparent permeability to Dracy permeability ( k q p p : k d ) as a function of the pore radius under different models (modified from Klinkenberg [24] and Beskok and Karniadakis [15]). Reservoir pressure = 5 MPa, temperature = 350 K.
Sustainability 11 02114 g016
Figure 17. The ratio of dynamic permeability to apparent permeability ( k : k q p p ) as a function of the reservoir pressures and the pore size considering stress sensitivity and matrix shrinkage. Temperature = 350 K.
Sustainability 11 02114 g017
Table 1. Parameters of simulation model.
ParameterValue
Young’s modulus of shale, E( GPa ) 30
Poisson’s ratio of shale, ν 0.2
Density of shale, ρ s ( E ) 2700
Average pore diameter of matrix, d ¯ ( nm ) 10
Density of gas, ρ g ( kg / m 3 ) 0.717
Viscosity of gas, µ( Pa · s )2 × 10⁴
Molar mass of gas, M(kg/mol) 0.016
Gas molecular diameter, d m ( nm ) 0.38
Reservoir initial pressure, P ( MPa ) 30
Overburden pressure, σ y ( MPa ) 50
Confining pressure, σ x ( MPa ) 53
Boundary pressure, P 0 ( MPa ) 10
Langmuir pressure constant, P L ( MPa ) 4
Langmuir volume constant, V L ( m 3 / kg ) 3 × 10 3
Initial porosity of matrix, ϕ 0 0.05
Initial permeability of matrix, k 0 ( m 2 ) 1 × 10 8
Pore curvature, τ 4.3
Standard molar volume, V 0 ( L / mol ) 22.4
Avogadro constant, N A ( mol 1 ) 6.02 × 10 23

