Abstract
Intellectual property rights protection (IPRP) has caused great concern in China, especially since the introduction of the Belt and Road (B&R) initiative. The Chinese government has increased investments to the countries along the B&R, most of which are developing countries with high investment risks. Using the panel data of China’s outward foreign direct investment (OFDI) in 121 countries from 2003 to 2017, the sustainable relationships between the IPRP of host countries and China’s OFDI has been analyzed. The results of this paper show that, from the worldwide perspective, the stronger the IPRP of the host country, the greater attraction to China’s OFDI. While the IPRP of the countries along the B&R has a nonlinear U-shaped effect on China’s OFDI, which is related to the complex environments of the countries. When the IPRP of the B&R countries is within a certain range, China’s OFDI is biased toward a country with lower IPRP, and when the IPRP exceeds a certain range, China’s OFDI is biased toward a country with higher IPRP. Moreover, the market size, natural resources endowment and political environment of the host country are influential upon China’s OFDI as well. What deserves our attention is that China’s OFDI is more biased towards countries with poor political conditions, which can be related to the enterprise type and that most of the large multinational enterprises in China are state-controlled, resulting in investment decisions largely reflected by the national political goals rather than simple market targets.
1. Introduction
In the context of the knowledge economy, intellectual property has received increasing attention from all around the world. Since the entry into force of Trade-Related Aspects of Intellectual Property Rights (TRIPS) in 1995, developing countries have greatly strengthened the intellectual property rights protection (IPRP) system in response to the increasing pressure from developed countries. As the largest developing country in the world, China is striving to build a complete legal system for IPRP. Related to China’s “Go Global” strategy, the extent of China’s expansion is deepening accompanied with a significant increase in the amount of international trade, foreign direct investment (FDI) and outward foreign direct investment (OFDI). The detailed amount and annual flow of OFDI from 2003 to 2017 are shown in Figure 1 and Figure 2. From the perspective of OFDI stock, China’s OFDI has been increasing year by year, reaching 1809.04 in 2017, ranking second. However, from the perspective of annual flow, compared with 2016, the OFDI flow in 2017 decreased by 19.3% [1].
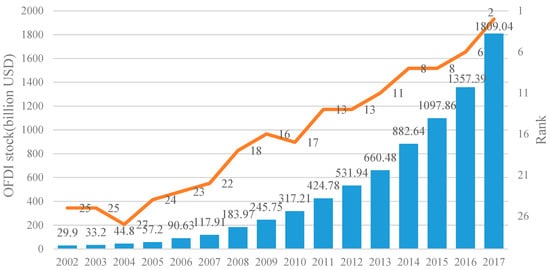
Figure 1.
The amount and rank of China’s OFDI stock.
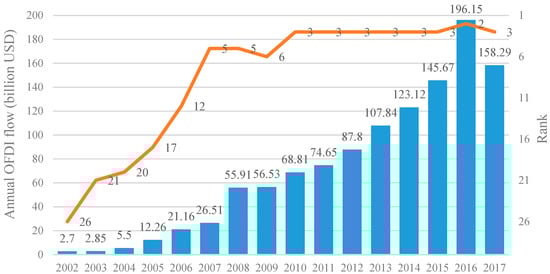
Figure 2.
The annual flow and rank of China’s outward foreign direct investment (OFDI).
“The Belt and Road” (B&R) initiative was proposed by President Jinping Xi in 2013 at Nazarbayev University, which is committed to establishing positive partnerships with countries along B&R and linking China to Asia, Europe and Africa [2]. Since the launch of the B&R initiative at the end of 2013, the Chinese government has made it the most important national strategy [3], which provides a blueprint for China’s strong alliance with the world economy and represents the Chinese government’s commitment to a more open economy. It is estimated that more than 60 countries have been covered by the B&R, and the total population exceeds 4 billion along the B&R countries [4,5]. However, most of the members are developing countries with large economic gaps and uneven governance capacity. In particular, some countries have been plagued by political turmoil and religious disputes for a long time, which brings great risks to the sustainable development of China’s OFDI. Under the background of slowing economic growth and profound adjustment of Chinese economic structure, keeping the sustainable development of China’s OFDI has a significant impact on the success of the B&R initiative. Therefore, this paper aims to analyze the effect of IPRP on the sustainable development of China’s OFDI from the following perspectives: (a) whether the IPRP will affect the determinants of China’s OFDI? (b) Does the IPRP effect of the countries along the B&R is consistent with the countries all around the world? (c) Are there any other factors that will affect China’s OFDI as well?
Based on the analysis above, using the panel data of China’s OFDI in 121 countries from 2003 to 2017, the contributions of this paper can be summarized as follows: first of all, the sustainable analysis of China’s OFDI and the IPRP of the host countries, which is a topic that deserves special analysis in the context of today’s knowledge economy. Secondly, a separate analysis of countries along the B&R is applied, aiming to provide constructive advice on the development of China’s B&R initiative. In addition, compared with the previous literature, this paper considers the non-linear effect of IPRP for the first time, which fits the B&R data better. Furthermore, the time span of the empirical data is long enough, which contains the period before and after the implementation of the B&R initiative, and it is critical to analyzing the impact of B&R initiative. Finally, various factors affecting OFDI are considered, including the market size of the host country, strategic assets, natural resource endowments, political system risk, and the geographical distance between the host country and China.
2. Literature Review
2.1. New Institutional Economics
New institutional economics is a new economic perspective that attempts to study economics by focusing on the institutions behind economic activities [6,7]. Institutional economics was first proposed by Hamilton at the 41st American Economics Annual Conference in 1990 [8], and since then has been widely researched [9]. In the 1970s, in face of the reality that the Western countries’ economy had entered the stage of “stagflation” and the weakness of Keynesian economics, the importance of the institution to economic operations was taken seriously again. The terminology “new institutional economics” was first proposed by Williamson to distinguish it from the early institutional economics [10]. On the basis of inheriting the institutional factors of the early institutional economics, new institutional economics pays more attention to analyzing the shaping of the system by micro-factors [11,12]. The new institutional economics formed a complete set of the reasons, dynamics, and forms of the evolution of the system, which can be regarded as an extension of the old institutional economics and neoclassical economics [13,14].
New institutional economics attempts to incorporate institutions into economic analysis by weakening some assumptions of neoclassical economics. Neoclassical economics is essentially an economics that focuses on transactions. Both producers and consumers complete their economic behavior through transactions [15,16]. For example, manufacturers maximize profits by purchasing factors of production and selling products, and consumers maximize utility by purchasing goods and selling labor. From this perspective, neoclassical economics mainly focuses on “buying” and “selling”, that is, “transaction”, and technology is given exogenously. However, the economics of this research transaction actually assumes that “the cost of transactions are zero.” This premise is clearly far from reality, which also leads to the inability to explain various economic phenomena. The new institutional economics begins with the perspective of “transaction costs are greater than zero”, and it focuses more on the effect of transaction costs to the economy [17,18]. The transaction cost mainly refers to the loss that is not taken into consideration during the establishment of the transaction. such as the money and time spent on bargaining and the insurance measures taken to prevent deception. Once the transaction costs are taken into account, the economic choices of the participating entities are no longer just demand or supply, but also the various trading methods or institutions that ensure the effective conduct of the transaction. Since the institution will affect the transaction cost, with the control of other factors, the transaction cost will become an important factor affecting economics [19,20].
Reducing transaction costs is equivalent to improving resource allocation efficiency. Many theoretical and empirical studies focus on resource allocation efficiency and can be developed in the context of transaction costs [21]. This paper examines the impact of the construction of intellectual property protection system on international trade and investment efficiency, which is an empirical verification of the new institutional economics.
2.2. The Determinants of Outward Foreign Direct Investment (OFDI)
The motivations and determinants of international investment have been fully discussed [22,23,24]. Among them, the eclectic theory of international production proposed by Dunning is a unified and comprehensive theory of international production. It is believed that enterprises must have both ownership advantage, international advantage and location advantage when making OFDI decisions [24]. Lall discussed the international investments of developing countries, and believed that enterprises in developing countries were characterized by high labor intensiveness and high flexibility, which formed their advantages [25]. Some Chinese scholars have conducted special studies on the development of international investment theory in China. Wu and Huang divide multinational enterprises into dominant enterprises and inferior enterprises according to the level of marketing ability [26]. The dominant enterprises focused on “stakes from interests” and always strived to obtain the largest economic benefits in short time; while inferior enterprises aimed at “experience acquisition”, the cost of which would be compensated by increasing competitiveness.
There has been a lot of research concentrating on the impact of IPRP on the international trade and the foreign investment, but no unified conclusions have been reached. Helpman developed a dynamic general equilibrium model of North–South trade, which concluded that strict IPRP would significantly hinder industrial development in the South [27]. The shortcoming of this model is that the IPRP in the model is exogenously given and cost-free, and the OFDI level lacks an endogenous response to the changes in IPRP intensity. Based on the Helpman model [27], Lai introduced the endogenous response of OFDI to IPRP intensity changes into the dynamic general equilibrium international product cycle model, and reached the opposite conclusion: strict IPRP is beneficial to both the North and the South. But the limitation in Lai’s model is that IPRP is still exogenous and not costly [28]. To sum up, there are two kinds of impact about IPRP on foreign investment. On the one hand, the positive impacts include: incentive technology innovation [29,30], reduce investment risk by providing stable investment environments [31,32], and improve the quality of investment by changing the composition of foreign investment [33,34]. On the other hand, negative impact is increasing the technological monopoly rights of multinational corporations, which will force them to reduce production and sales to increase profits [30,34,35]. Apart from this, the impact of IPRP on foreign investment is also related to the basic development of the host country, including market size [36,37,38], strategic assets [32], natural resource endowments [39,40], the degree of political system risk [41], the distance between China and the host country [42], and so on.
Although there have been some scholars conducting in-depth research about the effect of IPRP on the sustainable development of China’s OFDI, which undoubtedly have important reference value for this paper, there are still some deficiencies in the above literature: Firstly, in addition to natural resources-seeking motivation and strategic resources-seeking motivation, the motivation for foreign direct investment is largely manipulated by government political factors. This is especially the case for China’s OFDI, it will largely be affected by the B&R initiative. Few of the above literatures have separately analyzed the investment situation of B&R. Secondly, the complex political environment and the turbulent economic market of the countries along the B&R make it difficult to determine the impact on China’s OFDI, and there is likely to be a non-linear effect, which was less addressed by the previous literature. Thirdly, the empirical data time span of this paper is from 2003 to 2017, including before and after the B&R implementation, which means the time span is long enough to analyze the changes brought by the B&R to China’s OFDI.
3. Methodology and Data Sources
3.1. Econometric Model
Based on the analysis above, we try to build a model of the factors that influence the OFDI, and set the IPRP as a core variable, attempting to explain the impact of IPRP on OFDI from the theoretical perspective of new institutional economics. With reference to Ushijima [32], Adams [43], Kang and Jiang [44] and Ramasamy et al. [45], the basic econometric model in this paper is constructed as follows:
where, i represents the host country of OFDI, i = 1, 2, …, 121; t represents the time of OFDI, t = 2003, 2004, …, 2017 and represents the China’s OFDI to country i in year t. indicates the strength of IPRP of country i in year t. denotes the control variables, including: lnDIS indicates the distance between China and the host country, lnGDP shows the economic development level of the host country, RES denotes the natural resource endowment, lnTM expresses the strategic assets, PRS measures the political environment. In addition, due to the large fluctuation of OFDI and some value of the OFDI data being negative, with reference to the method used in Busse and Hefeker [46], the OFDI is processed as follows: . Therefore, the model can be rewritten as follows:
With the consideration of the possible hysteresis of annual OFDI flow and the problem of missing variables, the lag phase of the interpreted variable is added to the basic model as the control variable, and the dynamic panel data model can be denoted as Equation (3). In addition, due to the estimation of dynamic model, there is bound to be biased using traditional ordinary least squares (OLS) estimation method. For the estimation of dynamic model, Arellano and Bond [47] proposed a differential generalized moment (GMM) estimation method, while the drawbacks of this method are the inability to estimate non-time-varying data and the existence of serious small sample errors. So as to improve the accuracy of the estimation, Arellano and Bover [48] and Blunder and Bond [49] proposed a systematic GMM estimation method, combining the difference equation and the horizontal equation to make full use of the data information and reduce the error, which will obviously improve the estimation efficiency.
In addition, in order to test the robust of the core indicator, we use another index to measure the level of intellectual property rights protection: the rates of unlicensed PC software installations from Business Software Alliance (BSA). The robust test model for static panel data and dynamic panel data, respectively, can be expressed as follows:
3.2. Data Sources
Outward foreign direct investment (OFDI). The OFDI data is obtained from 2017 Statistical Bulletin of China’s Outward Foreign Direct Investment [1]. In 2017, China’s OFDI showed negative growth for the first time, but still ranked third in the world with USD158.29 billion.
Intellectual property rights protection (IPRP). In previous studies, Ushijima [32] used the index developed by Ginarte and Park [50], and Park [51], which is measured by five aspects of national patent law, while the time span of this index is five years, does not match the research sample in this paper. Referring to the pervious researches [52,53], we select the survey data obtained by the World Economic Forum (WEF) as an indicator to measure the intellectual property rights protection (IPRP), which can be collected from the Global Competitiveness Index Database. The value of IPRP ranges from one to seven, and the larger the value, the higher the strength of IPRP.
Distance (DIS). Since Anderson proposed the basic theory of gravity model in 1979, the gravity model has been continuously expanded by many scholars [54,55]. Based on the model setting of Anderson and Wincoop [56], this paper uses the geographical distance between the capital of China, Beijing, and the capital of the host country to measure the distance between the two countries. And the data of distance is obtained from the website: http://www.indo.com. It is generally believed that the farther the distance, the greater the difference between the two countries, and the higher the investment risk. The predictive coefficient is negative.
Market size (lnGDP). The market size can be measured by the gross domestic product (GDP) of host country, the more GDP indicates the larger market size of host country, and the predicted coefficient is positive. The data comes from the World Bank World Development Index (WDI) database.
Natural resource endowment (RES). Referring to the methods of Buckley et al. [57] and Kang and Jiang [44], the RES is measured by the resource density of the host country, which can be determined by the proportion of fuel and ore exports to total exports. The predictive coefficient is positive and the data comes from the World Trade Organization Statistics Database.
Strategic assets (lnTM). With reference to Kang and Jiang [44] and Ramasamy et al. [45], total trademark registrations (TM) can be used to measure the strategic asset of host country. The greater the number of TM, the richer the country’s strategic assets. The predictive coefficient is positive, and the data can be obtained from the database of the World Intellectual Property Organization (WIPO).
Political environment (PRS). With reference to the method used in Buckley et al. [57], we choose the indicator in the Political Risk Services International Country Risk Guide (PRS), which in turn consists of 12 components measuring various dimensions of the political and business environment in a country. The PRS indicator is comprised by six sub-indicators, including voice and accountability (VA), political stability and absence of violence (PV), government effectiveness (GE), regulatory quality (RQ), rule of law (RL) and control of corruption (CC). We use the average value of the six sub-indicators to evaluate the overall political environment of the host country. The value ranges from zero to one. The closer to zero, the more turbulent, and the closer to 1, the more stable. The predicted coefficient is positive.
The rates of unlicensed PC software installations (BSA). With reference to the indicator used in Weng et al. [58], the rates of unlicensed PC software installations can be obtained from the global software survey of the business software alliance (BSA). Contrary to IPRP, the higher the BSA, the weaker the intellectual property protection in the country, and the predicted coefficient is negative.
3.3. Descriptive Analysis and Unit Root Test
In order to test multicollinearity, we examine the descriptive characteristics and correlation coefficient matrix of all variable as shown in Table 1. Most correlation coefficients of the indicators are less than 0.3, and only a few correlation coefficients are greater than 0.5, which is within an acceptable range.

Table 1.
The descriptive characteristics and correlation coefficient matrix.
In addition, to prevent heteroscedasticity, we make improvements from two aspects: firstly, from the data source, the logarithm of data with large interval is applied; secondly, from the estimation method, the standard deviation estimation method is taken in this paper, eliminating the influence of heteroscedasticity compared with ordinary variance estimation method. After White Test, there is no obvious heteroscedasticity problem in this model.
Moreover, so as to prevent false regression, the unit root test is performed as shown in Table 2. It can be found that p value of all variables is close to zero, rejecting the null hypothesis that there is a unit root, indicating that all the variables are stationary.
Table 2.
The results of unit root test.
4. Empirical Analysis and Discussion
4.1. Static Panel Data Analysis and Robust Test
The static panel data is estimated for the model (2) and the results are shown in Table 3. Column (1), (2), (3) and (4) are results of ordinary least squares (OLS) estimation, fixed effect (FE) estimation, random effect (RE) estimation, and instrumental variables (IV) estimation, respectively. According to the results of Hausman test, strongly rejecting the null hypothesis of “using a random effect model”, we accept the fixed-effect model. Therefore, we will explain the results based on column (2) in Table 3.
Table 3.
The results of static panel data analysis and robust test.
It can be seen from Table 3 that the regression coefficients of control variables are significant and consistent with theoretical expectations. Since the distance is a non-time-varying variable and is excluded from the fixed-effect regression, we use the results of OLS estimation, column (1), to analyze this indicator. It can be seen from the results that the regression coefficient of lnDIS is significantly negative, indicating that long distance will increase investment costs, which is unfavorable for China’s OFDI. The coefficient of lnGDP is significantly positive, demonstrating the market-seeking motives of China’s OFDI. The larger the host country market size, the more foreign direct investment China will have in this country. The regression coefficient of RES is significantly positive at a 1% confidence level, revealing that China’s foreign direct investment has the motivation to seek natural resources in host countries. The richer natural resources of the host country, the more China tends to invest in the country.
What deserves our attention is that the coefficient of PRS is significantly negative, which means that China’s OFDI is more biased towards countries with poor institutional environments, and this is in line with the findings of Kolstad and Wing [59]. There can be two reasons for China’s preference for a country with lower PRS: on the one hand, most of the large multinational enterprises in China are state-controlled, which denotes the investment decisions are largely reflected in national political goals, rather than simple market targets. Related to the B&R initiative, China’s OFDI is more inclined to invest in developing countries with low PRS. On the other hand, corruption is a major drawback of the Chinese government compared to developed countries, and a large number of studies have shown that a country’s political institutional environment will influence the choice of cross-border investment. Enterprises in countries with poor national political systems prefer to choose countries with relatively poor institutional conditions as investment targets.
In addition, we should notice that the coefficient of IPRP estimated by the fixed effect model is not significant. The possible reason is that the endogenous problem of IPRP has not been considered. In view of this, one-phase lag of IPRP is used as the instrumental variable of IPRP to estimate model (2) and the estimation results are shown in column (4). From the results we can see that the coefficient of IPRP is significantly positive, which proves the positive impact of intellectual property rights protection on China’s OFDI.
Moreover, the robustness test results of model (4) are shown in column (5), (6), (7), and (8) of Table 3. The results of fixed effect estimation are expressed in column (6), which is basically consistent with column (2), indicating that all the results are robust. Using the one-phase lag of BSA as the instrumental variable of BSA, the estimation results are displayed in column (8), which are in line with column (4), demonstrating the robustness of the results. In order to solve the endogenous problem of both explanatory variables and interpreted variables better, we will estimate the dynamic panel data in next section.
4.2. The Dynamic Panel Data Analysis and Robust Test
As mentioned above, this paper uses the system GMM method to estimate the dynamic panel model, and the specific variable settings of the dynamic panel are shown in Table 4 below. Therefore, this paper uses the system GMM method to estimate the dynamic panel model and the specific variable settings are shown in Table 4 below.
Table 4.
The system GMM estimation variable settings.
The results of system GMM estimation are shown in Table 5. Columns (1) and (2) use one-phase lag and two-phase lag of the interpreted variable as explanatory variables, respectively. The comparison between column (1) and (2) shows that the degree of fitting and the test effect of column (1) are better, indicating that the one-phase lag OFDI has a great influence on current OFDI, while the impact of the two-phase lag OFDI on current period is very small. Column (3) sets the IPRP as an endogenous variable, and the rest settings are the same as column (2). While the Sargan test of column (3) increase from 0.236 (in column (2)) to 0.681, showing that the variable setting of column (3) is more reliable than column (2) and the consideration of it is necessary to consider the IPRP endogeneity problem. Column (4) sets both the host country development level (lnGDP) and IPRP as endogenous variables, and the rest of the settings are the same as (3). The results of column (4) are more effective than column (3), indicating that the endogenous effects of lnGDP also exist. Column (5) sets only the lnGDP as endogenous variable, whose results are slightly inferior to that of column (4) with the Sargan test value decreasing from 0.984 to 0.689. So the settings of column (4) are accepted as the final setting, and the results of column (4) will be explained for the subsequent analysis. The BSA is used as an indicator to test the robustness of the IPRP in column (6), and the results will be interpreted later.
Table 5.
The results of dynamic panel data analysis and robust test.
From the estimation results of column (4) in Table 5 we can see that the coefficient of the IPRP is positive with a 1% significance level, which is consistent with the static model. And the estimation results of lnDIS, lnGDP, RES, PRS are all in line with the static model. The results of column (6) are roughly the same as column (4) indicating that the IPRP can accurately measure the intellectual property rights protection of host country, and the estimation results of IPRP are credible.
4.3. Discussion of the Countries along the Belt and Road (B&R) Route
In order to comply with the needs of China’s opening up and regional economic restructuring, China proposed the “Belt and Road” (B&R) initiative in 2013, and strived to promote cooperation among countries along the B&R route. The B&R initiative is to actively promoting China’s high-quality production capacity and comparative advantage industries to the west, and trying to change the imbalance of development between the east and west in terms of trade, culture and economics. The proposal of this initiative shows that China’s foreign direct investment is bound to be influenced by policy orientation, and it is more inclined to choose countries along the B&R countries as investment destinations. Based on the comparisons with the list of B&R countries that have signed the cooperation documents with China, 48 countries are selected to conduct a separate analysis. This paper analyzes the countries along the B&R separately and compares them with the full sample countries, in order to obtain more targeted conclusions. In addition, in the face of the complex investment environment of the countries along the B&R, we began to consider whether there is a non-linear effect of IPRP on ODI, so the effect of IPRP2 is added to the model, and the fitting results are listed as column (5) in Table 6.
Table 6.
The results of dynamic panel data analysis for Belt and Road (B&R) countries.
The fitting results of column (4) show that the coefficient of IPRP in the country along B&R is −0.0312, while the coefficient is not significant, which can be related to the complex environment of the B&R countries and it is necessary to join the influence of IPRP2. From the results of column (5) we can see that the coefficient of IPRP2 is 0.65, and the significance level is of 1%, indicating that the IPRP in the country along the line has a non-linear U-shaped effect on China’s OFDI. The natural resource endowment (RES) coefficient of the countries along B&R is significantly positive, indicating that China’s investment in countries along the B&R has obvious natural resource seeking motives. The U-type effect indicates that when the IPRP of the host country is within a certain range, China’s OFDI is biased toward a country with lower IPRP. When the IPRP exceeds a certain range, China’s OFDI is biased toward a country with higher IPRP. The possible reason is that when the IPRP of the host country is low, the investment competition is small, and the Chinese enterprise OFDI has the motive for speculative profit in the country; as the IPRP rises, the number of enterprises investing in the country increases, and the chance of speculative profit decreases. When the host country’s IPRP increased to a higher level, the country’s economy, system, and management are all at a higher level, which can better protect the investment of multinational enterprises from China.
5. Conclusions
With the deepening of economic globalization and the rapid development of science and technology, the relationships between foreign direct investment and IPRP have received extensive attention. This paper uses the panel data of China’s OFDI to 121 countries and the project data from the period 2006 to 2016. The goal of this study was to reveal the sustainable relationships between the IPRP of host countries and China’s OFDI. Through analysis of the static panel data model and dynamic panel data model, and the addition of separate analysis for the countries along the B&R, the paper draws the following main conclusions:
Firstly, from the worldwide perspective, the strengthening of the host country’s IPRP has increased the attraction of China’s foreign direct investment. The stronger the host country’s IPRP, the more attractive it is to China’s foreign direct investment.
Secondly, the IPRP of the countries along the B&R has a non-linear U-shaped effect on China’s OFDI, which is related to the complex environments of the countries. When the IPRP of the B&R countries is within a certain range, China’s OFDI is biased toward a country with lower IPRP, and when the IPRP exceeds a certain range, China’s OFDI is biased toward a country with higher IPRP.
Moreover, the market size, natural resources endowment and political environment of the host country are influential to China’s OFDI as well. What deserves our attention is that China’s OFDI is more biased towards countries with poor political conditions, which can be related to the enterprise type that most of the large multinational enterprises in China are state-controlled, resulting in investment decisions that are largely reflected by the national political goals, rather than simple market targets.
Based on the analysis above, we propose some policy implications for governors as follows: first of all, the choice of foreign direct investment in the host country should consider the country’s IPRP level to ensure that Chinese companies’ intellectual property will be well protected; secondly, considering the B&R initiative, China’s OFDI can be biased to invest in developing countries with good development conditions in order to achieve efficient allocation of resources and deep integration of countries along the B&R. Furthermore, it is necessary to strengthen the IPRP awareness of Chinese enterprises, conducting precise investigations before investing, understanding the host country’s IPRP policy, and minimizing the property rights risk in order to protect the success of OFDI. The Chinese government should provide professional services for multinational enterprises, accelerate the construction of overseas intellectual property rights assistance mechanisms for Chinese enterprises, and effectively encourage enterprises to establish overseas intellectual property rights protection alliances.
Although this work makes many contributions as mentioned above, there are still some limitations to note: firstly, the data used in this paper focuses on macro-national level and does not involve the heterogeneity at the industry and enterprise levels, which can have significant impact on investment decisions. Therefore, in subsequent research, the impact of heterogeneity at the industry and enterprise level on China’s OFDI will be an important development direction. In addition, this paper finds that IPRP of the host country has a non-linear U-shaped effect on China’s OFDI, and the U-shaped effect can be refined in the future using the threshold panel data model.
Author Contributions
Conceptualization, H.F. and X.W.; methodology, X.W.; software, X.W.; validation, B.P. and X.W.; formal analysis, B.P.; investigation, B.P.; resources, S.F.; data curation, S.F.; writing—original draft preparation, X.W. and S.F.; writing—review and editing, X.W. and B.P.; visualization, S.F.; supervision, H.F.; project administration, H.F.; funding acquisition, H.F.
Funding
This research was funded by the Research Project on Major Issues in the Philosophy and Social Science Research of the Ministry of Education (grant number 17JZD023); Beijing Social Science Fund Major Project (grant number 15ZDA49); National Natural Science Foundation of China (grant number 71773006); Beijing Philosophy and Social Science Project (grant number JD-KFKT-2018-ZD-01).
Conflicts of Interest
The authors declare no conflict of interest.
References
- Statistical Bulletin of China’s Outward Foreign Direct Investment. 2017. Available online: http://img.project.fdi.gov.cn//21/1800000121/File/201810/201810301102234656885.pdf (accessed on 3 January 2019).
- Du, J.; Zhang, Y. Does One Belt One Road initiative promote Chinese overseas direct investment? China Econ. Rev. 2018, 47, 189–205. [Google Scholar] [CrossRef]
- Swaine, M.D. Chinese views and commentary on the “One Belt, One Road” initiative. China Leadersh. Monit. 2015, 47, 3–27. [Google Scholar]
- Ernst and Young. Riding the Silk Road: China sees outbound investment boom. March 2015. Available online: http://www.ey.com/Publication/vwLUAssets/eychina-outbound-investment-report-en/%24FILE/ey-china-outbound-investment-report-en.pdf (accessed on 2 April 2019).
- Ernst and Young. Going out—The global dream of a manufacturing power. March 2016. Available online: http://www.ey.com/Publication/vwLUAssets/ey-2016-china-outbound-investment-outlook-en/$FILE/ey-2016-china-outbound-investment-outlook-en.pdf (accessed on 2 April 2019).
- Rutherford, M. Institutional Economics: Then and Now. J. Econ. Perspect. 2001, 153, 173–194. [Google Scholar] [CrossRef]
- Rutherford, M.; Tyler, D. The Institutionalist Reaction to Keynesian Economics. J. Hist. Econ. Thought 2008, 30, 29–48. [Google Scholar] [CrossRef]
- Hamilton, W.H. The Institutional Approach to Economic Theory. Am. Econ. Rev. 1919, 9, 309–318. [Google Scholar]
- Rutherford, M. The Institutionalist Movement in American Economics, 1918–1947: Science and Social Control; Cambridge University Press: Cambridge, UK; New York, NY, USA, 2011. [Google Scholar]
- Williamson, O.E. Markets and Hierarchies: Analysis and Antitrust Implications, a Study in the Economics of Internal Organization; Free Press: New York, NY, USA, 1975. [Google Scholar]
- Schotter, A. The Economic Theory of Social Institutions; Cambridge University Press: Cambridge, UK, 1981. [Google Scholar]
- Taylor, M. Community, Anarchy and Liberty; Cambridge University Press: New York, NY, USA, 1982. [Google Scholar]
- Greif, A. Institutions and the Path to the Modern Economy: Lessons from Medieval Trade; Cambridge University Press: Cambridge, UK, 2006. [Google Scholar]
- Hurwicz, L. Institutions as Families of Game Forms. Jpn. Econ. Rev. 1996, 47, 13–132. [Google Scholar] [CrossRef]
- Sugden, R. The Economics of Rights, Cooperation of Welfare; Basil Blackwell: Oxford, UK, 1986. [Google Scholar]
- Sugden, R. Spontaneous Order. J. Econ. Perspect. 1989, 3, 85–97. [Google Scholar] [CrossRef]
- Coase, R. The problem of social cost. J. Law Econ. 1960, 10, 1–44. [Google Scholar] [CrossRef]
- Young, H.P. Individual Strategy and Social Structure; Princeton University Press: Princeton, NJ, USA, 1998. [Google Scholar]
- Aoki, M. Towards a Comparative Institutional Analysis; MIT Press: Cambridge, MA, USA, 2001. [Google Scholar]
- Bowles, S. Microeconomics: Behavior, Institutions and Evolution; Princeton University Press: Princeton, NJ, USA, 2004. [Google Scholar]
- Williamson, O.E. The New Institutional Economics: Taking Stock, Looking Ahead. J. Econ. Lit. 2000, 38, 595–613. [Google Scholar] [CrossRef]
- Hymer, S.H. The International Operations of National Firms: A Study of Direct Foreign Investment. J. Dev. Econ. 1977, 4, 387–400. [Google Scholar]
- Buckley, P.J.; Casson, M. Alternative Theories of the Multinational Enterprise; The Future of the Multinational Enterprise; Palgrave Macmillan: London, UK, 1976. [Google Scholar]
- Dunning, J.H. International Production and the Multinational Enterprise; Allen & Unwin: London, UK, 1981. [Google Scholar]
- Lall, S. The New Multinationals: The Spread of Third World Enterprises. J. Dev. Areas 1985, 19, 436–438. [Google Scholar]
- Wu, B.; Huang, T. Two-stage theory: A new analytical model for foreign direct investment. Econ. Res. J. 1997, 7, 25–31. (In Chinese) [Google Scholar]
- Helpman, E. Innovation, Imitation, and Intellectual Property Rights. Econometrica 1992, 61, 1247–1280. [Google Scholar] [CrossRef]
- Lai, L.C. International Intellectual Property Rights Protection and the Rate of Product Innovation. J. Dev. Econ. 1998, 55, 133–153. [Google Scholar] [CrossRef]
- Lall, S. Indicators of the Relative Importance of IPRs in Developing Countries. Res. Policy 2003, 32, 1657–1680. [Google Scholar] [CrossRef]
- Awokuse, T.O.; Yin, H. Intellectual Property Rights Protection and the Surge in FDI in China. J. Comp. Econ. 2010, 38, 217–224. [Google Scholar] [CrossRef]
- Markusen, J.R. Contracts, Intellectual Property Rights, and Multinational Investment in Developing Countries. J. Int. Econ. 2001, 53, 189–204. [Google Scholar] [CrossRef]
- Ushijima, T. Patent Rights Protection and Japanese Foreign Direct Investment. Res. Policy 2013, 42, 738–748. [Google Scholar] [CrossRef]
- Javorcik, B.S. The Composition of Foreign Direct Investment and Protection of Intellectual Property Rights: Evidence from Transition Economies. Eur. Econ. Rev. 2004, 48, 39–62. [Google Scholar] [CrossRef]
- Smith, P.J. Are Weak Patent Rights a Barrier to U.S. Exports? J. Int. Econ. 1999, 48, 151–177. [Google Scholar] [CrossRef]
- Yang, G.; Maskus, K.E. Intellectual Property Rights and Licensing: An Econometric Investigation. Weltwirtschaftliches Archiv 2001, 137, 58–79. [Google Scholar] [CrossRef]
- Deng, P. Outward Investment by Chinese MNCs: Motivations and Implications. Bus. Horizons 2004, 47, 8–16. [Google Scholar] [CrossRef]
- Bevan, A.; Estrin, S.; Meyer, K. Foreign Investment Location and Institutional Development in Transition Economies. Int. Bus. Rev. 2004, 13, 43–64. [Google Scholar] [CrossRef]
- Buckley, P.J.; Cross, A.R.; Tan, R.H.; Xin, L.; Voss, H. Historic and Emergent Trends in Chinese Outward Direct Investment. Manag. Int. Rev. 2008, 48, 715–748. [Google Scholar] [CrossRef]
- Bhaumik, S.K.; Co, C.Y. Chinese State’s Economic Cooperation Related Investment: An Investigation of its Direction and Some Implications for Outward Investment. SSRN Electron. J. 2009, 22, 75–87. [Google Scholar] [CrossRef]
- Cheung, Y.W.; Qian, X. Empirics of China’s Outward Direct Investment. Pac. Econ. Rev. 2009, 14, 312–341. [Google Scholar] [CrossRef]
- Liu, J.; Wu, N. Location Selection of China’s Foreign Direct Investment—Based on the Research of Intellectual Property Protection Difference. Inq. Econ. Issues 2015, 5, 86–92. (In Chinese) [Google Scholar]
- Jiang, G.H.; Jiang, D.C. Location Selection of China’s Foreign Investment: Panel Data Inspection Based on Gravity Model. J. World Econ. 2012, 9, 21–40. (In Chinese) [Google Scholar]
- Adams, S. Intellectual Property Rights, Investment Climate and FDI in Developing Countries. Int. Bus. Res. 2010, 3, 13. [Google Scholar] [CrossRef]
- Kang, Y.; Jiang, F. FDI location choice of Chinese Multinationals in East and Southeast Asia: Traditional Economic Factors and Institutional Perspective. J. World Bus. 2012, 47, 45–53. [Google Scholar] [CrossRef]
- Ramasamy, B.; Yeung, M.; Laforet, S. China’s Outward Foreign Direct Investment: Location Choice and Firm Ownership. J. World Bus. 2012, 47, 17–25. [Google Scholar] [CrossRef]
- Busse, M.; Hefeker, C. Political risk, institutions and foreign direct investment. Eur. J. Political Econ. 2007, 23, 397–415. [Google Scholar] [CrossRef]
- Arellano, M.; Bond, S. Some Tests of Specification for Panel Data: Monte Carlo Evidence and an Application to Employment Equations: Monte Carlo Evidence and an Application to Employment Equations. Rev. Econ. Stud. 1991, 58, 277–297. [Google Scholar] [CrossRef]
- Arellano, M.; Bover, O. Another Look at the Instrumental Variable Estimation of Error-Components Models. J. Econ. 1995, 68, 29–51. [Google Scholar] [CrossRef]
- Blundell, R.; Bond, S. Initial Conditions and Moment Restricitions in Dynamic Panel Data Models. J. Econ. 1998, 87, 115–143. [Google Scholar] [CrossRef]
- Ginarte, J.C.; Park, W.G. Determinants of patent rights: A cross-national study. Res. Policy 1997, 26, 283–301. [Google Scholar] [CrossRef]
- Park, K.G. International Patent Protection: 1960–2005. Res. Policy 2008, 37, 761–766. [Google Scholar] [CrossRef]
- Guo, X.; Wu, Z. Creative Goods Exports, Imitation Threat and Intellectual Property Rights Protection. China Econ. Q. 2014, 13, 1239–1260. (In Chinese) [Google Scholar]
- Wu, N.; Liu, J. Do Intellectual Property Rights Affect the Outward FDI of China? World Econ. Stud. 2013, 10, 69–74. (In Chinese) [Google Scholar]
- Anderson, J.E. A Theoretical Foundation for the Gravity Equation. Am. Econ. Rev. 1979, 69, 106–116. [Google Scholar]
- Bergstrand, J.H. The Generalized Gravity Equation, Monopolistic Competition, and the Factor-Proportions Theory in International Trade. Rev. Econ. Stat. 1989, 71, 143–153. [Google Scholar] [CrossRef]
- Anderson, J.E.; Wincoop, E.V. Gravity with Gravitas: A solution to the Border Pullze. Am. Econ. Rev. 2003, 93, 170–192. [Google Scholar] [CrossRef]
- Buckley, P.J.; Clegg, L.J.; Cross, A.R.; Liu, X.; Voss, H.; Zheng, P. The Determinants of Chinese Outward Foreign Direct Investment. J. Int. Bus. Stud. 2009, 40, 353–354. [Google Scholar] [CrossRef]
- Weng, Y.; Yang, C.H.; Huang, Y.J. Intellectual Property Rights and U.S. Information Goods Exports: The Role of Imitation Threat. J. Cult. Econ. 2009, 33, 109–134. [Google Scholar] [CrossRef]
- Kolstad, I.; Wiig, A. What Determines Chinese Outward FDI? J. World Bus. 2012, 47, 26–34. [Google Scholar] [CrossRef]
© 2019 by the authors. Licensee MDPI, Basel, Switzerland. This article is an open access article distributed under the terms and conditions of the Creative Commons Attribution (CC BY) license (http://creativecommons.org/licenses/by/4.0/).