Corporate Social Responsibility Practices in the U.S.: Using Reverse Supply Chain Network Design and Optimization Considering Carbon Cost

Abstract
1. Introduction
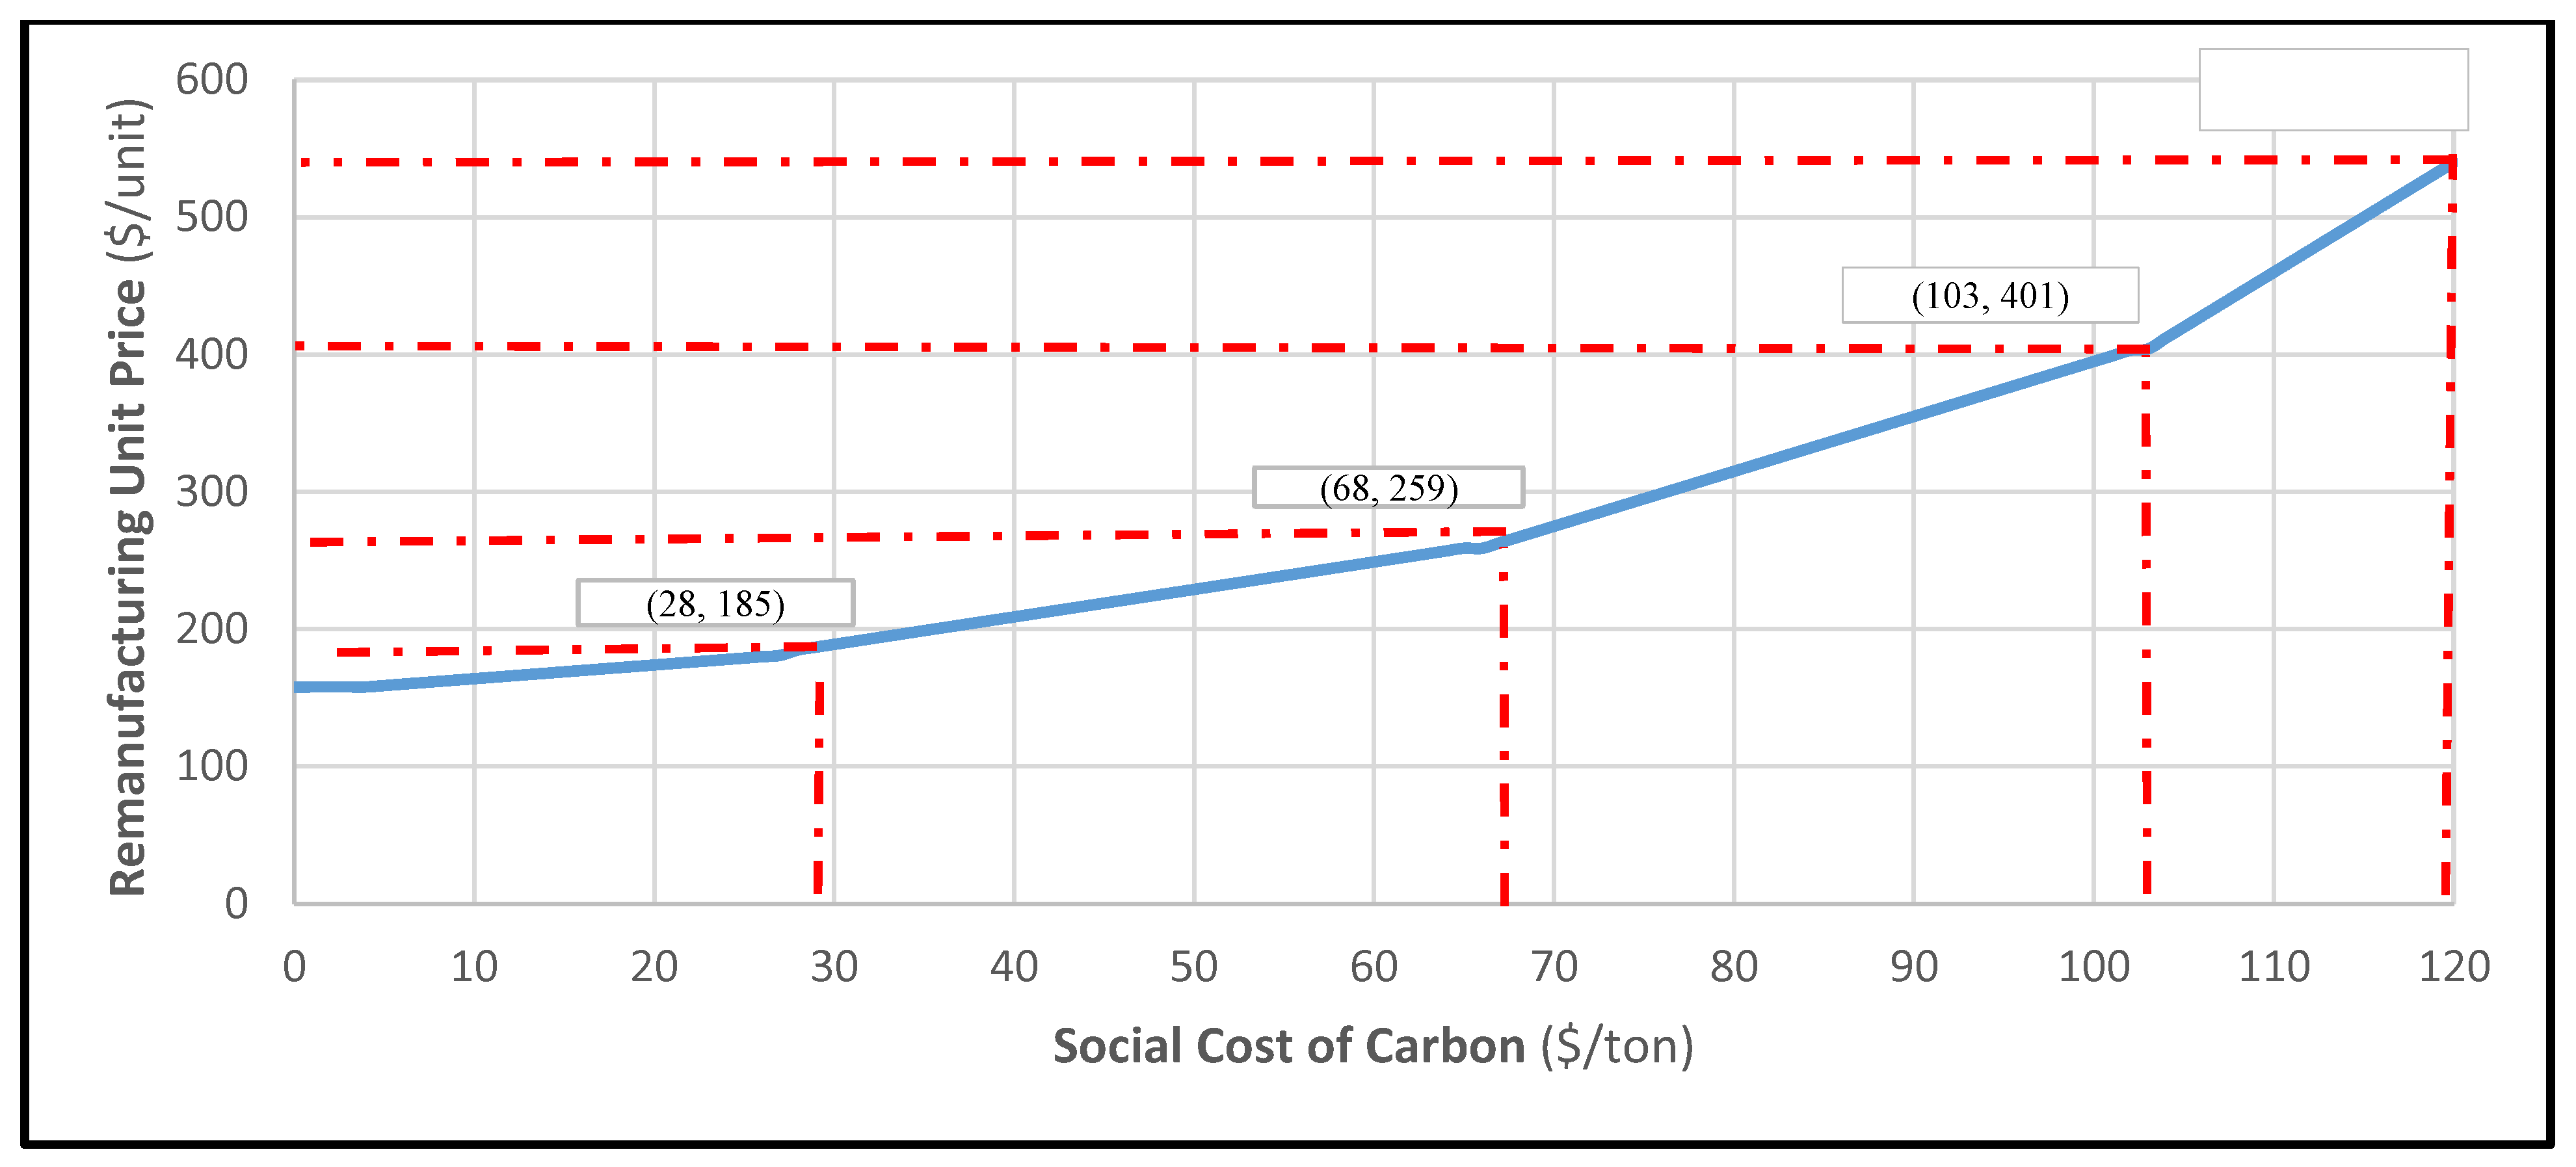
- What is the social cost of carbon (SCC) effect on unit price?
- How is carbon priced to achieve maximum emissions reduction while ensuring that the remanufacturing profits are not overly affected?
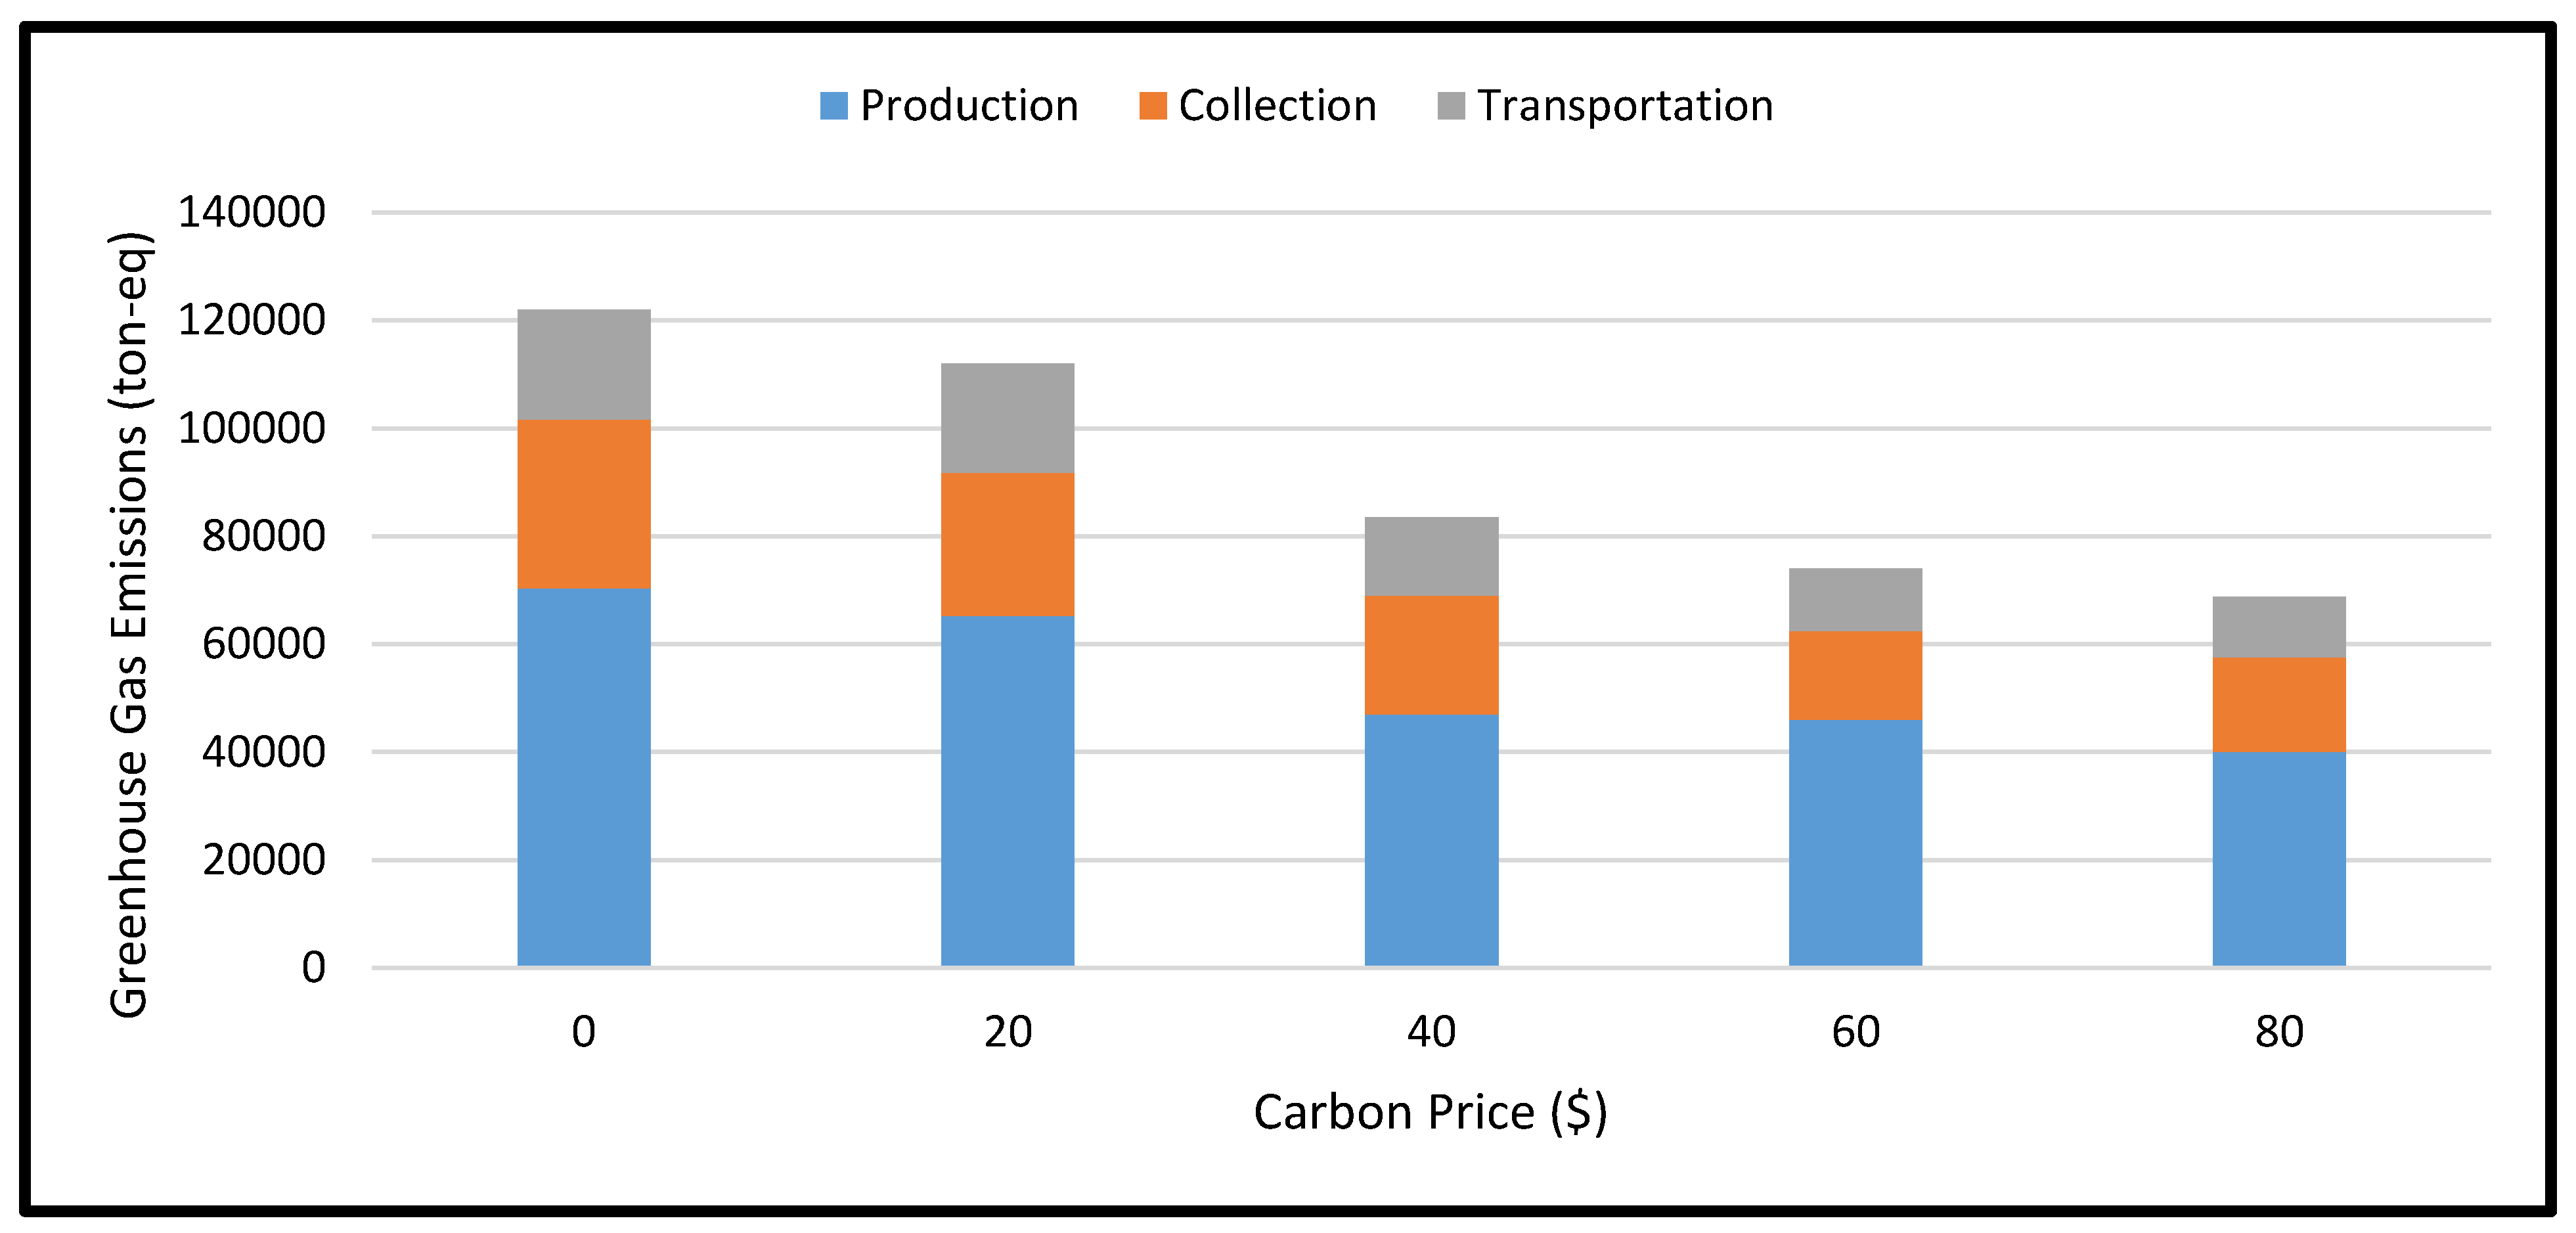
- What is the cost-effectiveness over a range of carbon prices?
- Is it possible reduce emissions without increasing cost, by using only operational adjustments?
- What is the best carbon price to maximum emissions reduction and maximize profit?
- What is the most efficient method for recovery of used products?
- What network best reflects the organization's environmental and carbon market strategy?
- What are the flow networks for the returned products through the reverse logistics (RL) network?
2. Literature Review
2.1. Present State of Research on the Circular Economy and Reverse Supply Chains for Remanufacturing
2.2. Present State of Research on Greenhouse Gas Emissions in Reverse Supply Chains
Input-Output Life Cycle Assessment (EIO-LCA) Studies of Remanufacturing
3. Methodology
3.1. Mixed-Integer Linear Programming Approach
- Maximize Z X (objective function)
- Subject to A X “≤” B and X ≥ 0 (constraints)
3.2. Design of Experimental Studies
Orthogonal Arrays
4. Nomenclature
Assumptions
- Collection centers: emission volumes are proportional to the usage at of power each center;
- Remanufacturing facilities: emission volumes are in proportion to the volume of each facility;
- Reselling centers: emission volumes are proportional to the usage at of power each center;
- Transportation: transporting the products, emissions volumes are rooted in the distance traveled between facilities and centers, and the weight of each unit is (40 Kg).
5. Problem Formulation
6. Case Study
7. Results
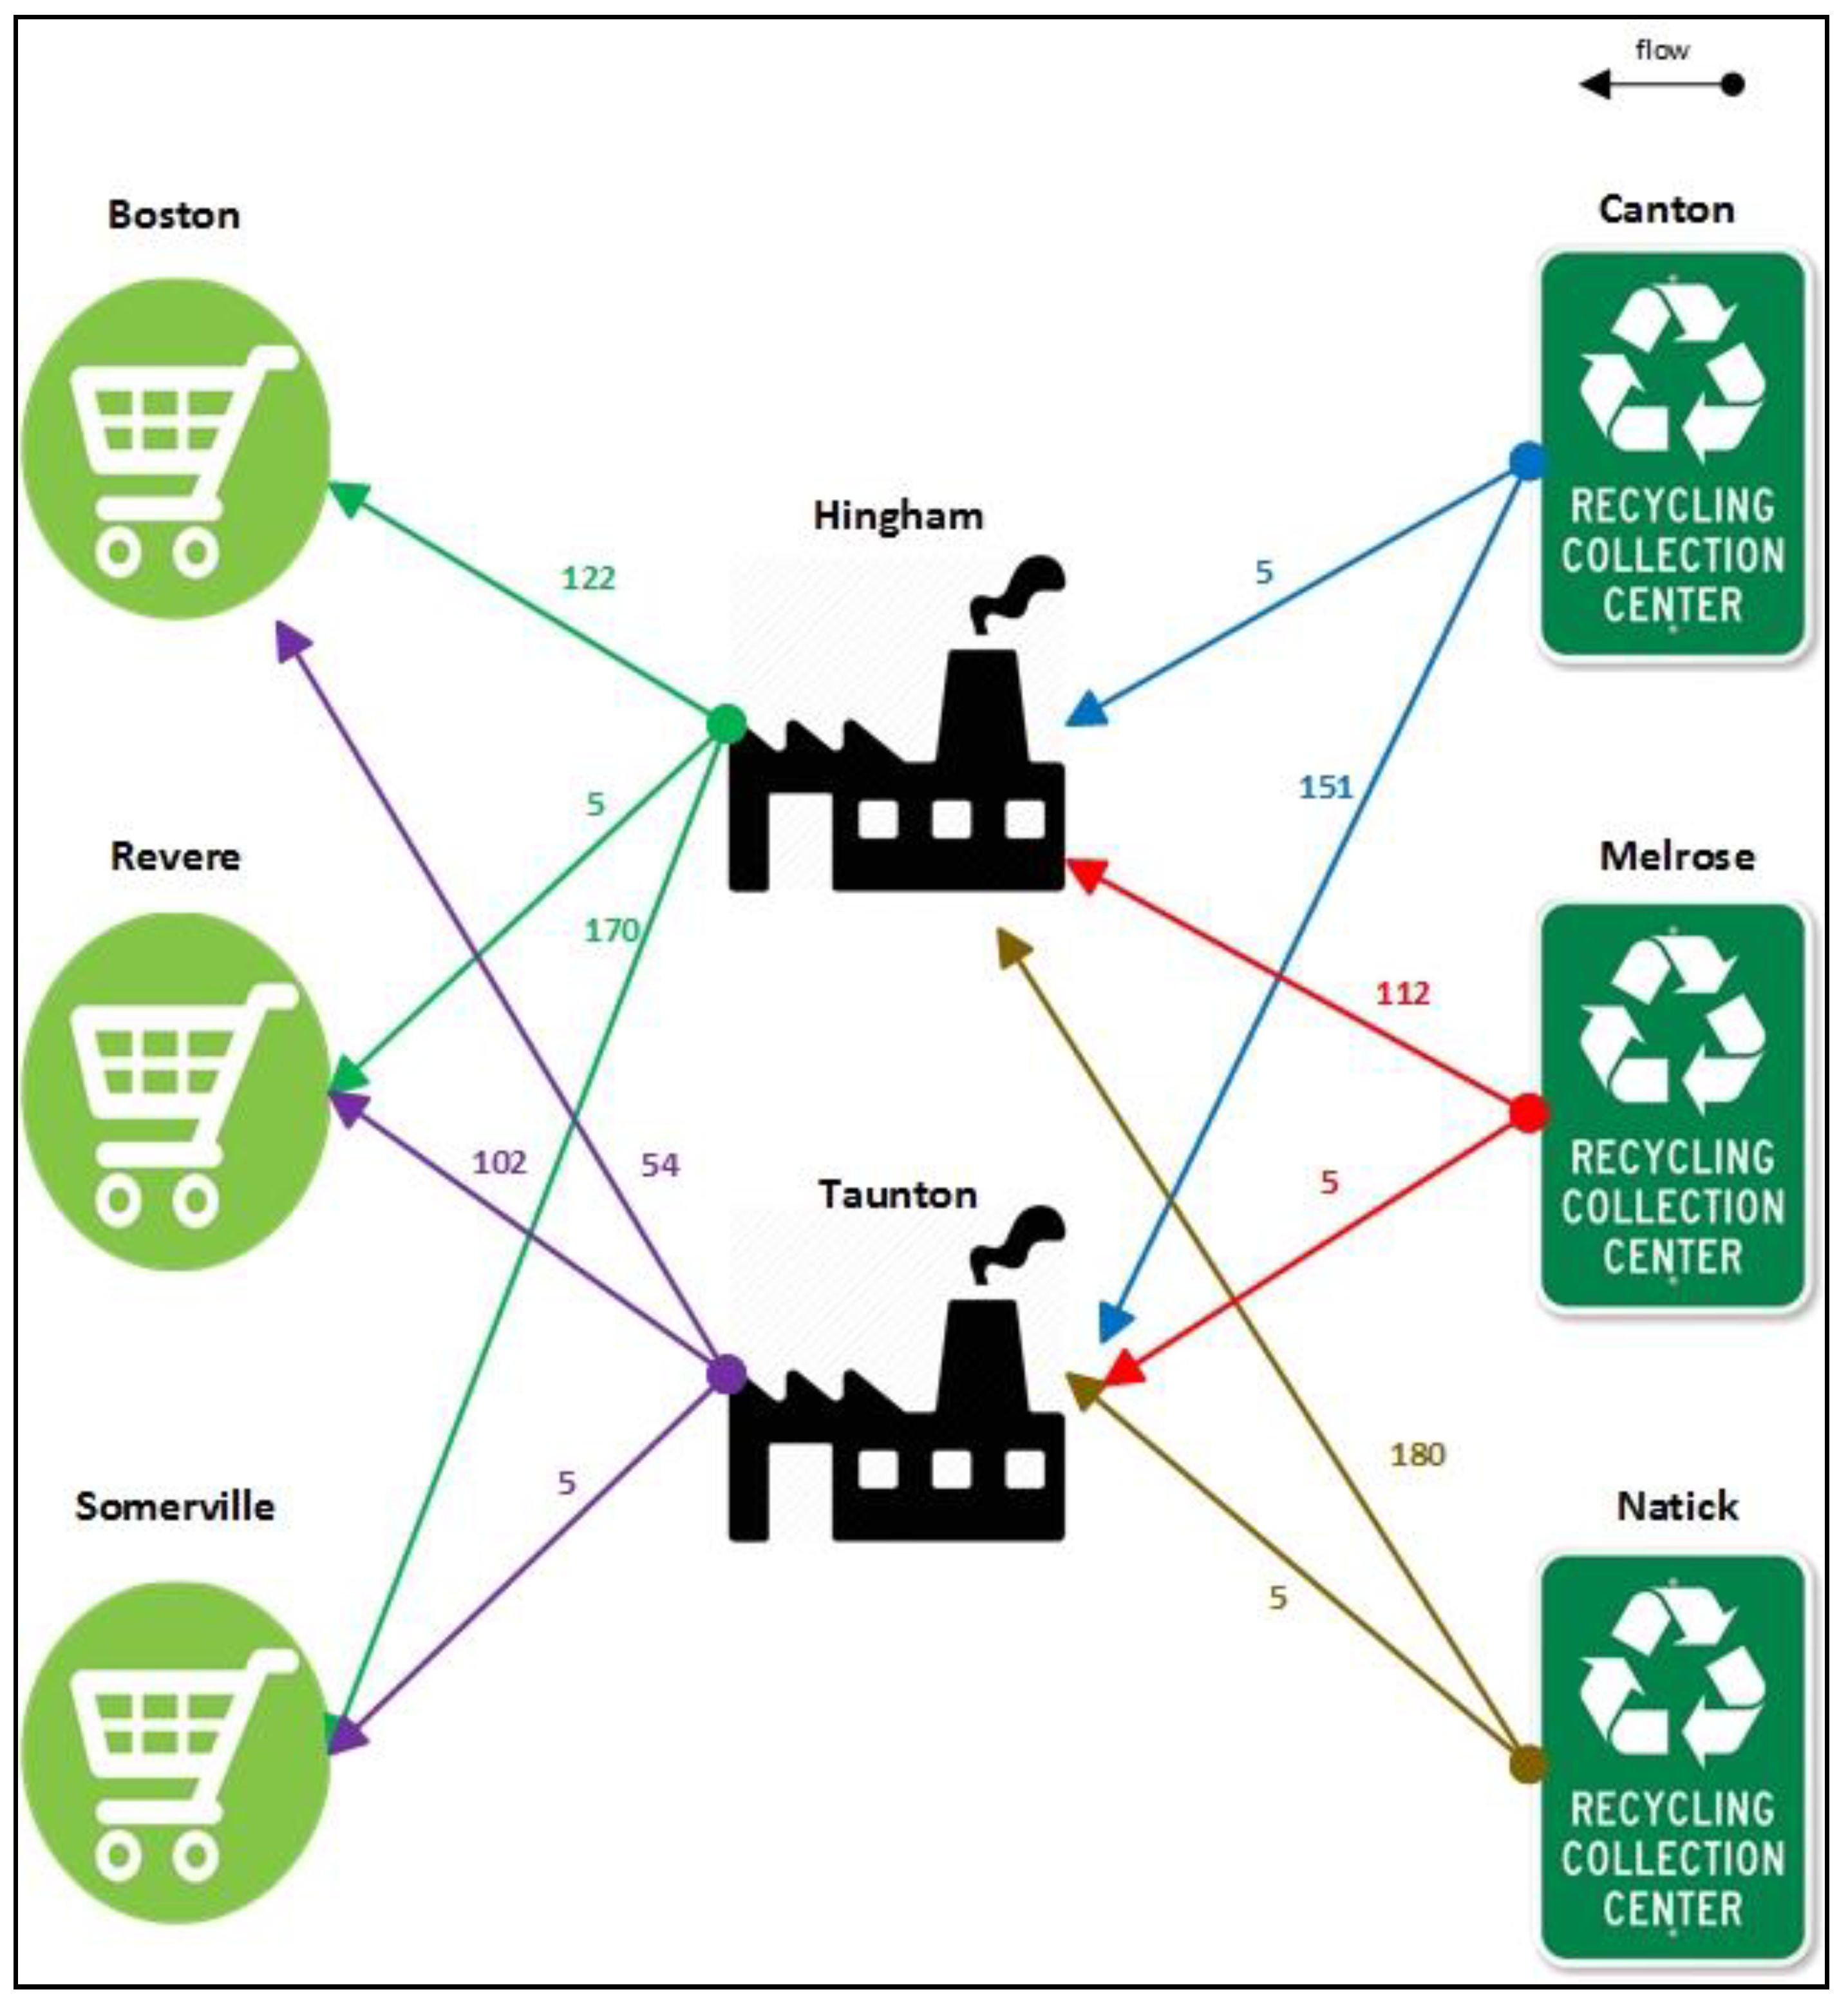
7.1. Deterministic Model with Minimum Shipments
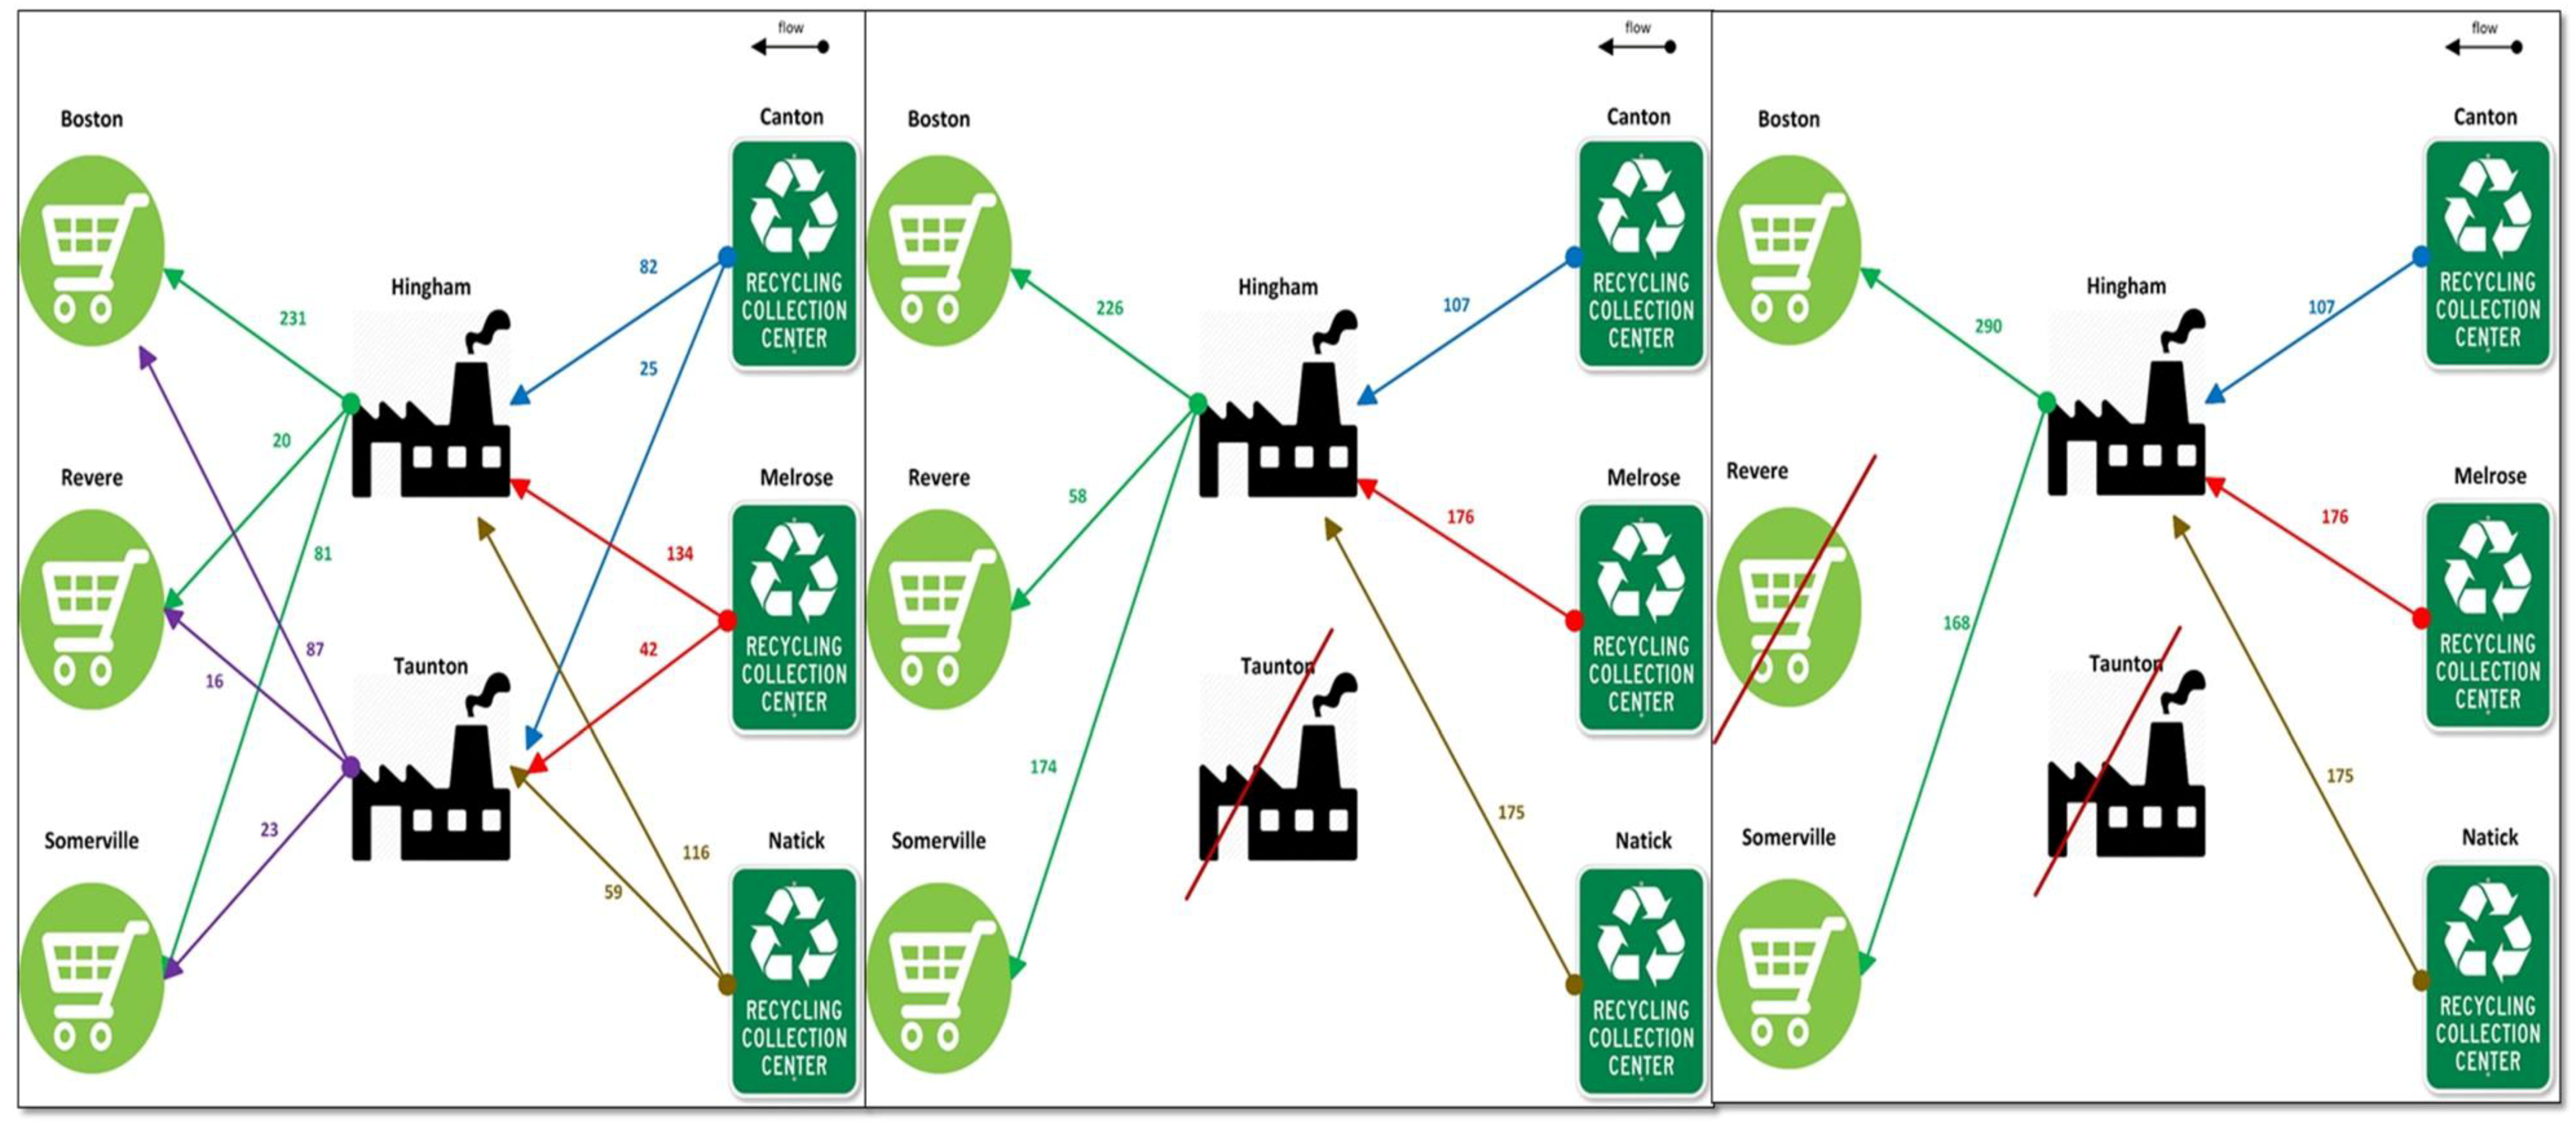
7.2. Deterministic Model with Relaxation Constraints
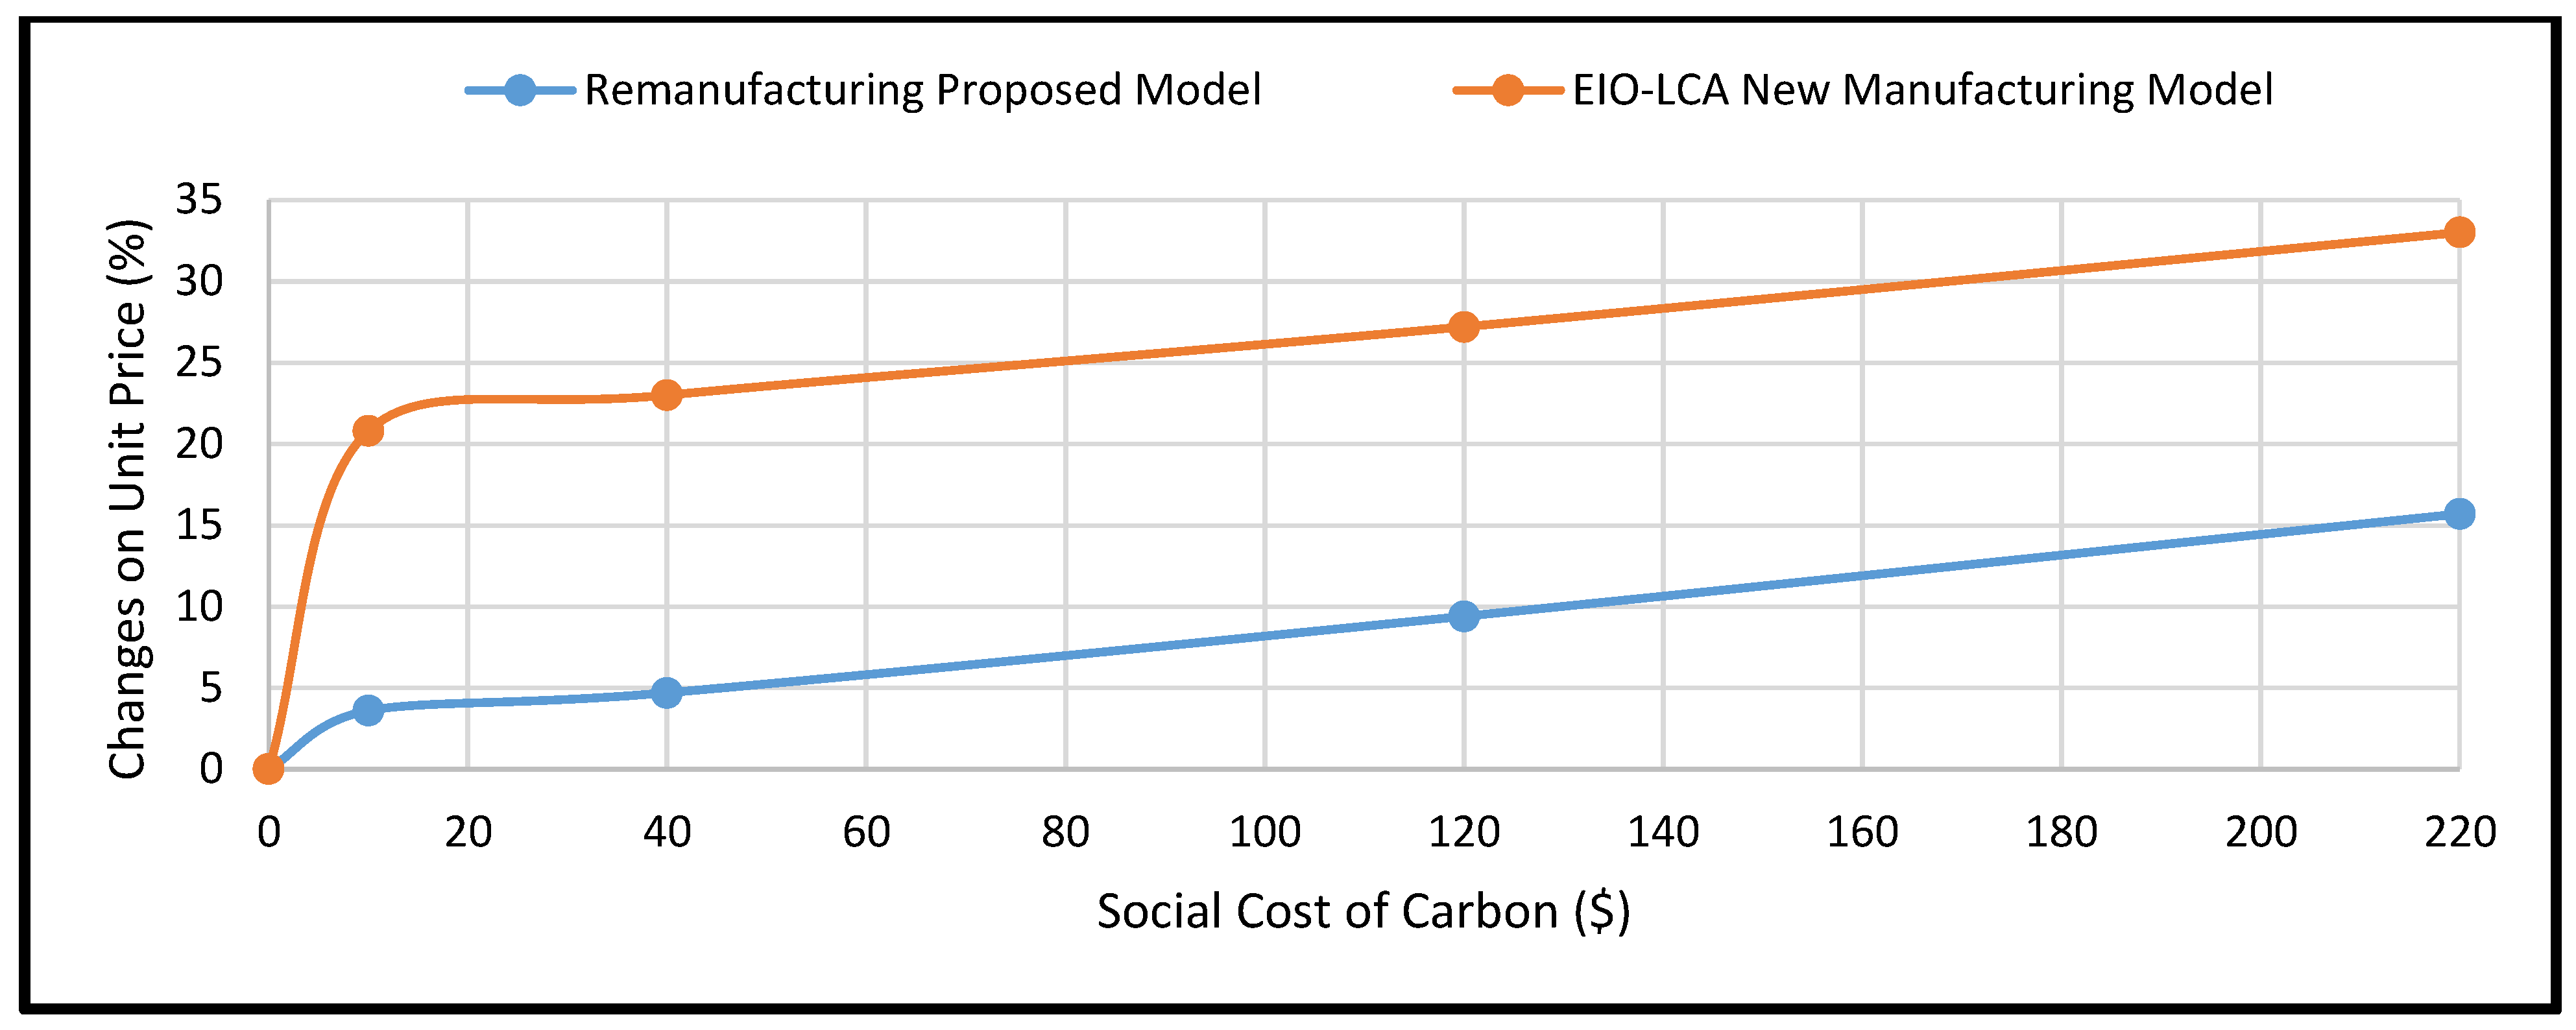
7.3. Effect of Different Social Cost of Carbon
Statistical Analysis
8. Conclusions and Recommendations
- Parking difficulties and congestion caused by traffic;
- Commuting distance;
- Current cost criteria;
- Population, economy, and geography of the city/setting.
Supplementary Materials
Acknowledgments
Conflicts of Interest
References
- Stahel, W.R.; Reday-Mulvey, G. Jobs for Tomorrow: The Potential for Substituting Manpower for Energy; Vantage Press: New York, NY, USA, 1981. [Google Scholar]
- Frosch, R.A.; Gallopoulos, N.E. Strategies for manufacturing. Sci. Am. 1989, 261, 144–153. [Google Scholar] [CrossRef]
- Stahel, W.R. The circular economy. Nat. News 2016, 531, 435. [Google Scholar] [CrossRef]
- Conference of the Parties (COP21). The Paris Agreement. The United Nations Framework Convention on Climate Change (UNFCCC). Available online: http://www.cop21paris.org/ (accessed on 12 November 2016).
- Alkhayyal, B.; Gupta, S.M.; Eckelman, M.J. Managing environmental issues in reverse supply chain. In Proceedings of the Institute of Industrial Engineers (IIE) Annual Research Conference, Anaheim, CA, USA, 21–24 May 2016. [Google Scholar]
- Alkhayyal, B.A.; Gupta, S.M. The Impact of Carbon Emissions Policies on Reverse Supply Chain Network Design. Doğuş Üniversitesi Dergisi 2018, 1, 99–111. [Google Scholar] [CrossRef]
- Alkhayyal, B.A.; Gupta, S.M. A Linear Physical Programming Approach for Evaluating Collection Centers for End-of-Life Products. In Applications of Management Science; Emerald Publishing Limited: Bingley, UK, 2018; pp. 65–79. [Google Scholar]
- Vadde, S.; Kamarthi, S.V.; Gupta, S.M. Pricing decisions for product recovery facilities in a multi-criteria setting using genetic algorithms. In Environmentally Conscious Manufacturing VI; International Society for Optics and Photonics: San Diego, CA, USA, 2006; Volume 6385. [Google Scholar]
- Nash, J.; Bosso, C. Extended Producer Responsibility in the United States: Full Speed Ahead? J. Ind. Ecol. 2013, 17, 175–185. [Google Scholar] [CrossRef]
- Ilgin, M.A.; Gupta, S.M. Environmentally conscious manufacturing and product recovery (ECMPRO): A review of the state of the art. J. Environ. Manag. 2010, 91, 563–591. [Google Scholar] [CrossRef]
- Amezquita, T.; Hammond, R.; Salazar, M.; Bras, B. Characterizing the remanufacturability of engineering systems. In ASME Advances in Design Automation Conference; Proceedings 1995 ASME Advances in Design Automation Conference: Boston, MA, USA, 1995; Volume 82. [Google Scholar]
- Carter, C.R.; Rogers, D.S. A framework of sustainable supply chain management: Moving toward new theory. Int. J. Phys. Distrib. Logist. Manag. 2008, 38, 360–387. [Google Scholar] [CrossRef]
- Nagurney, A.; Liu, Z.; Woolley, T. Sustainable Supply Chain and Transportation Networks. Int. J. Sustain. Transp. 2007, 1, 29–51. [Google Scholar] [CrossRef]
- Kleindorfer, P.R.; Singhal, K.; van Wassenhove, L.N. Sustainable operations management. Prod. Oper. Manag. 2005, 14, 482–492. [Google Scholar] [CrossRef]
- Seuring, S.; Sarkis, J.; Müller, M.; Rao, P. Sustainability and supply chain management—An introduction to the special issue. J. Clean. Prod. 2008, 16, 1545–1551. [Google Scholar] [CrossRef]
- United States International Trade Commission. Remanufactured Goods: An Overview of the US and Global Industries, Markets, and Trade; USITC Publication 4356; United States International Trade Commission: Washington, DC, USA, 2012; pp. 332–525. [Google Scholar]
- Gutowski, T.G.; Sahni, S.; Boustani, A.; Graves, S.C. Remanufacturing and energy savings. Environ. Sci. Technol. 2011, 45, 4540–4547. [Google Scholar] [CrossRef] [PubMed]
- The Business of Reselling Returned Shop Items, The Economist. Available online: http://www.economist.com/news/business/21710855-what-happens-all-goods-shoppers-dont-want-business-reselling-returned-shop-items (accessed on 4 January 2017).
- Carmona, R.; Fehr, M.; Hinz, J. Optimal Stochastic Control and Carbon Price Formation. SIAM J. Control. Optim. 2009, 48, 2168–2190. [Google Scholar] [CrossRef]
- Peters, K. Methodological issues in life cycle assessment for remanufactured products: A critical review of existing studies and an illustrative case study. J. Clean. Prod. 2016, 126, 21–37. [Google Scholar] [CrossRef]
- Derigent, W.; Thomas, A. End-of-Life Information Sharing for a Circular Economy: Existing Literature and Research Opportunities. In Computer and Information Science 2010; Springer: Cham, Switzerland, 2016; Volume 640, pp. 41–50. [Google Scholar]
- Govindan, K.; Soleimani, H. A review of reverse logistics and closed-loop supply chains: A Journal of Cleaner Production focus. J. Clean. Prod. 2017, 142, 371–384. [Google Scholar] [CrossRef]
- Guide, V., Jr.; Daniel, R. Vaidyanathan Jayaraman, and Rajesh Srivastava. Production planning and control for remanufacturing: A state-of-the-art survey. Robot. Comput.-Integr. Manuf. 1999, 15, 221–230. [Google Scholar] [CrossRef]
- About ecoATM, Environmental Benefits of ecoATM. Available online: https://www.ecoatm.com/about-us/ (accessed on 16 November 2016).
- Ayres, R.U.; Ayres, L. (Eds.) A Handbook of Industrial Ecology; Edward Elgar Publishing: Cheltenham, UK, 2002. [Google Scholar]
- Fleischmann, M.; Van Nunen, J.A.E.E.; Grave, B. Integrating Closed-Loop Supply Chains and Spare-Parts Management at IBM. Interfaces 2003, 33, 44–56. [Google Scholar] [CrossRef]
- Savaskan, R.C.; Bhattacharya, S.; Van Wassenhove, L.N. Closed-Loop Supply Chain Models with Product Remanufacturing. Manag. Sci. 2004, 50, 239–252. [Google Scholar] [CrossRef]
- Agrawal, S.; Singh, R.K.; Murtaza, Q. Disposition decisions in reverse logistics: Graph theory and matrix approach. J. Clean. Prod. 2016, 137, 93–104. [Google Scholar] [CrossRef]
- Charter, M.; Gray, C. Remanufacturing and product design. Int. J. Prod. Dev. 2008, 6, 375–392. [Google Scholar] [CrossRef]
- Subramoniam, R.; Huisingh, D.; Chinnam, R.B. Remanufacturing for the automotive aftermarket-strategic factors: Literature review and future research needs. J. Clean. Prod. 2009, 17, 1163–1174. [Google Scholar] [CrossRef]
- Subramoniam, R.; Huisingh, D.; Chinnam, R.B.; Subramoniam, S. Remanufacturing Decision-Making Framework (RDMF): Research validation using the analytical hierarchical process. J. Clean. Prod. 2013, 40, 212–220. [Google Scholar] [CrossRef]
- Meng, X. Study of evaluation and selection on third party reverse logistics providers. In Proceedings of the 2008 International Seminar on Business and Information Management, Wuhan, China, 19 December 2008. [Google Scholar]
- Efendigil, T.; Önüt, S.; Kongar, E. A holistic approach for selecting a third-party reverse logistics provider in the presence of vagueness. Comput. Ind. Eng. 2008, 54, 269–287. [Google Scholar] [CrossRef]
- Prakash, C.; Barua, M. Integration of AHP-TOPSIS method for prioritizing the solutions of reverse logistics adoption to overcome its barriers under fuzzy environment. J. Manuf. Syst. 2015, 37, 599–615. [Google Scholar] [CrossRef]
- Alqahtani, A.Y.; Gupta, S.M. Multicriteria Optimization for the Delivery of Products across Multiple Periods in a Reverse Supply Chains Environment. In Applications of Management Science; Emerald Group Publishing Limited: Bingley, UK, 2015; Volume 17, pp. 3–18. [Google Scholar]
- Boustani, A.; Sahni, S.; Graves, S.C.; Gutowski, T. Appliance remanufacturing and life cycle energy and economic savings. In Proceedings of the 2010 IEEE International Symposium on Sustainable Systems and Technology, Arlington, VA, USA, 17–19 May 2010. [Google Scholar]
- Sutherland, J.; Jenkins, T.; Haapala, K. Development of a cost model and its application in determining optimal size of a diesel engine remanufacturing facility. CIRP Ann. 2010, 59, 49–52. [Google Scholar] [CrossRef]
- Meixell, M.J.; Gargeya, V.B. Global supply chain design: A literature review and critique. Transp. Res. E Logist. Transp. Rev. 2005, 41, 531–550. [Google Scholar] [CrossRef]
- Seuring, S.; Müller, M. From a literature review to a conceptual framework for sustainable supply chain management. J. Clean. Prod. 2008, 16, 1699–1710. [Google Scholar] [CrossRef]
- Srivastava, S.K. Green supply-chain management: A state-of-the-art literature review. Int. J. Manag. Rev. 2007, 9, 53–80. [Google Scholar] [CrossRef]
- Gupta, S.M.; Gungor, A. Issues in environmentally conscious manufacturing and product recovery: A survey. Comput. Ind. Eng. 1999, 36, 811–853. [Google Scholar]
- Bellmann, K.; Khare, A. Economic issues in recycling end-of-life vehicles. Technovation 2000, 20, 677–690. [Google Scholar] [CrossRef]
- Das, J.K. Responding to Green Concerns: The Roles for Government and Business. Vikalpa 2002, 27, 3–12. [Google Scholar] [CrossRef]
- Dekker, R.; Fleischmann, M.; Inderfurth, K.; van Wassenhove, L.N. (Eds.) Reverse Logistics: Quantitative Models for Closed-Loop Supply Chains; Springer Science & Business Media: New York, NY, USA, 2013. [Google Scholar]
- Guide, V., Jr.; Daniel, R. Production planning and control for remanufacturing: Industry practice and research needs. J. Oper. Manag. 2000, 18, 467–483. [Google Scholar] [CrossRef]
- Henshaw, J.M. Design for recycling: New paradigm or just the latest’design–for–X’fad? Int. J. Mater. Prod. Technol. 1994, 9, 125–138. [Google Scholar]
- Pachauri, R.K.; Allen, M.R.; Barros, V.R.; Broome, J.; Cramer, W.; Christ, R.; Church, J.A.; Clarke, L.; Dahe, Q.; Dasgupta, P.; et al. Climate Change 2014: Synthesis Report. Contribution of Working Groups I, II and III to the Fifth Assessment Report of the Intergovernmental Panel on Climate Change; IPCC: Geneva, Switzerland, 2014. [Google Scholar]
- Schipper, M. Energy-related carbon dioxide emissions in US manufacturing. Energy Inf. Adm. 2006, DOE/EIA-0573, 8–10. [Google Scholar]
- Fatimah, Y.A.; Biswas, W.K. Remanufacturing as a means for achieving low-carbon SMEs in Indonesia. Clean Technol. Environ. 2016, 18, 2363–2379. [Google Scholar] [CrossRef]
- Hammond, R.; Amezquita, T.; Bras, B. Issues in the automotive parts remanufacturing industry: A discussion of results from surveys performed among remanufacturers. Eng. Des. Autom. 1998, 4, 27–46. [Google Scholar]
- Corporate Social Responsibility Report. Environment. Available online: https://www.daikin.com/csr/report/2015web/environment_e.pdf (accessed on 25 April 2016).
- Dotoli, M.; Meloni, C.; Zhou, M.C. A multi-level approach for network design of integrated supply chains. Int. J. Prod. Res. 2005, 43, 4267–4287. [Google Scholar] [CrossRef]
- Guillén-Gosálbez, G.; Grossmann, I.E.; Guillen-Gosálbez, G.; Guillén-Gosálbez, G. Optimal design and planning of sustainable chemical supply chains under uncertainty. AIChE J. 2009, 55, 99–121. [Google Scholar] [CrossRef]
- Hugo, A.; Pistikopoulos, E. Environmentally conscious long-range planning and design of supply chain networks. J. Clean. Prod. 2005, 13, 1471–1491. [Google Scholar] [CrossRef]
- Hugo, A.; Rutter, P.; Pistikopoulos, S.; Amorelli, A.; Zoia, G. Hydrogen infrastructure strategic planning using multi-objective optimization. Int. J. Hydrogen Energy 2005, 30, 1523–1534. [Google Scholar] [CrossRef]
- Jayaraman, V. Production planning for closed-loop supply chains with product recovery and reuse: An analytical approach. Int. J. Prod. Res. 2006, 44, 981–998. [Google Scholar] [CrossRef]
- Sheu, J.-B. Green supply chain management, reverse logistics and nuclear power generation. Transp. Res. E Logist. Transp. Rev. 2008, 44, 19–46. [Google Scholar] [CrossRef]
- Chaabane, A.; Ramudhin, A.; Paquet, M. Design of sustainable supply chains under the emission trading scheme. Int. J. Prod. Econ. 2012, 135, 37–49. [Google Scholar] [CrossRef]
- Paksoy, T.; Bektaş, T.; Özceylan, E. Operational and environmental performance measures in a multi-product closed-loop supply chain. Transp. Res. E Logist. Transp. Rev. 2011, 47, 532–546. [Google Scholar] [CrossRef]
- Abdallah, T.; Farhat, A.; Diabat, A.; Kennedy, S. Green supply chains with carbon trading and environmental sourcing: Formulation and life cycle assessment. Appl. Math. Model. 2012, 36, 4271–4285. [Google Scholar] [CrossRef]
- Bhinge, R.; Moser, R.; Moser, E.; Lanza, G.; Dornfeld, D. Sustainability Optimization for Global Supply Chain Decision-making. Procedia CIRP 2015, 26, 323–328. [Google Scholar] [CrossRef]
- Diabat, A.; Simchi-Levi, D. A carbon-capped supply chain network problem. In Proceedings of the 2009 IEEE International Conference on Industrial Engineering and Engineering Management, Hong Kong, China, 8–11 December 2009. [Google Scholar]
- Alkhayyal, B.; Eckelman, M.J.; Gupta, S.M. Managing transportation of products and greenhouse gas emissions in reverse supply chains. In Proceedings of the 27th Production and Operations Management Society (POMS) Annual Conference, Orlando, FL, USA, 6–9 May 2016. [Google Scholar]
- Abdallah, T.; Al-Refaie, A.; Diabat, A.; Svetinovic, D.; Govindan, K. Strategic Closed-Loop Facility Location Problem with Carbon Market Trading. IEEE Trans. Eng. Manag. 2013, 60, 398–408. [Google Scholar]
- Fahimnia, B.; Sarkis, J.; Dehghanian, F.; Banihashemi, N.; Rahman, S. The impact of carbon pricing on a closed-loop supply chain: An Australian case study. J. Clean. Prod. 2013, 59, 210–225. [Google Scholar] [CrossRef]
- Benjaafar, S.; Li, Y.; Daskin, M. Carbon Footprint and the Management of Supply Chains: Insights From Simple Models. IEEE Trans. Autom. Sci. Eng. 2013, 10, 99–116. [Google Scholar] [CrossRef]
- Jin, M.; Granda-Marulanda, N.A.; Down, I. The impact of carbon policies on supply chain design and logistics of a major retailer. J. Clean. Prod. 2014, 85, 453–461. [Google Scholar] [CrossRef]
- Wang, Y.; Chen, W.; Liu, B. Manufacturing/remanufacturing decisions for a capital-constrained manufacturer considering carbon emission cap and trade. J. Clean. Prod. 2017, 140, 1118–1128. [Google Scholar] [CrossRef]
- Dornfeld, D.A. Moving towards green and sustainable manufacturing. Int. J. Precis. Eng. Manuf. Technol. 2014, 1, 63–66. [Google Scholar] [CrossRef]
- Nagurney, A.; Liu, Z.; Woolley, T. Optimal endogenous carbon taxes for electric power supply chains with power plants. Math. Comput. Model. 2006, 44, 899–916. [Google Scholar] [CrossRef]
- Subramanian, R.; Talbot, B.; Gupta, S. An Approach to Integrating Environmental Considerations Within Managerial Decision-Making. J. Ind. Ecol. 2010, 14, 378–398. [Google Scholar] [CrossRef]
- Biswas, W.K.; Duong, V.; Islam, M.N.; Frey, P. A comparison of repaired, remanufactured and new compressors used in Western Australian small- and medium-sized enterprises in terms of global warming. J. Remanuf. 2013, 3, 4. [Google Scholar] [CrossRef]
- Zanghelini, G.M.; Cherubini, E.; Orsi, P.; Soares, S.R. Waste management Life Cycle Assessment: The case of a reciprocating air compressor in Brazil. J. Clean. Prod. 2014, 70, 164–174. [Google Scholar] [CrossRef]
- Latham, G. Vehicle Remanufacturing: Economic and Environmental Expansion of the Life Cycle; No. 2016-01-1291. SAE Technical Paper; SAE 2016 World Congress and Exhibition: Detroit, MI, USA, 2016. [Google Scholar]
- Zhou, X.; Schoenung, J. Application of environmental accounting information to the decision-making for the environmentally conscious design and end-of-life management of cellular phones. In Proceedings of the 2006 IEEE International Symposium on Electronics and the Environment, Scottsdale, AZ, USA, 8–11 May 2006. [Google Scholar]
- Mihelcic, J.R.; Crittenden, J.C.; Small, M.J.; Shonnard, D.R.; Hokanson, D.R.; Zhang, Q.; Chen, H.; Sorby, S.A.; James, V.U.; Sutherland, J.W.; et al. Sustainability Science and Engineering: The Emergence of a New Metadiscipline. Environ. Sci. Technol. 2003, 37, 5314–5324. [Google Scholar] [CrossRef]
- Interagency Working Group. Technical Update on the Social Cost of Carbon for Regulatory Impact Analysis-Under Executive Order 12866; Interagency Working Group on Social Cost of Carbon, United States Government: Washington, DC, USA, 2013.
- US Environmental Protection Agency, The Social Cost of Carbon. Climate Change—Social Cost of CO2, 2015–2050. Available online: http://www3.epa.gov/climatechange/EPAactivities/economics/scc.html (accessed on 14 November 2015).
- United States Energy Information Agency (EIA). U.S. Manufacturing Energy Consumption Survey (MECS); United States Energy Information Agency (EIA): Dubuque, IA, USA, 2010.
- United States Energy Information Agency (EIA). U.S. Commercial Buildings Energy Consumption Survey (CBECS); United States Energy Information Agency (EIA): Dubuque, IA, USA, 2012.
- Consumer Price Index, US Department of Labor. Available online: www.bls.gov/news.release/cpi.toc.htm (accessed on 15 April 2016).
- Carnegie Mellon University Green Design Institute, Economic Input-Output Life Cycle Assessment (EIO-LCA) US 2002 (428 Sectors) Producer Model. Available online: http://www.eiolca.net/ (accessed on 19 April 2016).
- Pochampally, K.; Nukala, S.; Gupta, S. Strategic Planning Models for Reverse and Closed-Loop Supply Chains; CRC Press: Boca Raton, FL, USA, 2008. [Google Scholar]
- Gupta, S.M. Reverse Supply Chains: Issues and Analysis; CRC Press: Boca Raton, FL, USA, 2016. [Google Scholar]
- U.S. Energy Information Administration. Table 5.6.A. Average Price of Electricity to Ultimate Customers by End-Use Sector, Electric Power Monthly. Available online: http://www.eia.gov/electricity/monthly/epm_table_grapher.cfm?t=epmt_5_6_a (accessed on 20 January 2016).
- LG Electronics. Air Conditioners, LG Model: LW1213ER. Available online: http://www.lg.com/us/air-conditioners/lg-LW1213ER-window-air-conditioner (accessed on 17 November 2016).
- World Wide Voltage, LG Electronics. Air Conditioners, LG Model: LW1213ER Refurbished. Available online: http://www.worldwidevoltage.com/lg-lw1213er-12-000-btu-window-air-conditioner-with-remote-fectory-refurbished--only-for-usa--.html?utm_source=googlepeplaandutm_medium=adwordsandid=61865531738 (accessed on 17 November 2015).
- Penske Truck Leasing Corporation. 12 Foot Truck. Available online: http://www.pensketruckrental.com/moving-trucks/12-foot-truck/ (accessed on 23 November 2015).
- Moore, F.C.; Diaz, D.B. Temperature impacts on economic growth warrant stringent mitigation policy. Nat. Clim. Chang. 2015, 5, 127–131. [Google Scholar] [CrossRef]


| No | Factor | Unit | Levels | ||
|---|---|---|---|---|---|
| 1 | 2 | 3 | |||
| 1 | Transportation Cost | $ | 0.5 | 1 | 1.5 |
| 2 | Energy Cost - fixed | $/kWh | 0.07 | 0.12 | 0.27 |
| 3 | Energy Cost - variable | $/kWh | 0.07 | 0.13 | 0.27 |
| 4 | Rent Cost | $ | 2.69 | 5.39 | 8.08 |
| 5 | Labor Cost | $ | 8.26 | 16.52 | 24.78 |
| 6 | Social Cost of Carbon | $/kg | 0.00 | 40.00 | 120.00 |
| 7 | Stock-out Cost | $ | 50.00 | 90.00 | 130.00 |
| 8 | Remanufacturing Cost | $ | 8.26 | 16.52 | 24.78 |
| 9 | Mean demand rate | Parts | 229 | 458 | 687 |
| 10 | Retrieval Cost | $ | 10.8 | 21.6 | 32.4 |
| 11 | Inventory Cost | $ | 2 | 4 | 6 |
| 12 | Inventory level | Parts | 1250 | 2500 | 3750 |
| 13 | Supply rate | Parts | 1049 | 2098 | 3147 |
| Variables | Definition |
|---|---|
| C1y | The capacity of storage at remanufacturing facility y per remanufactured unit |
| C2y | Remanufacturing facility storage capacity y per used unit |
| Cx | Collection center storage capacity x per unit |
| Cz | Reselling center storage capacity z per unit |
| Dx | Collection center demand for products x |
| Dz | Reselling center demand for products z |
| dxy | Distance from collection center x to remanufacturing facility y, per mile |
| dyz | Distance from remanufacturing facility y to reselling center z, per mile |
| EXx | Collection center energy cost x per unit |
| EXy | Remanufacturing facility energy cost y per unit |
| EXz | Reselling center energy cost z per unit |
| GH | GHG emissions per ton-mile |
| GHx | Collection center GHG emissions x, per unit; |
| GHy | Remanufacturing facility GHG emissions y, per unit |
| GHz | Reselling center GHG emissions z, per unit |
| Hx | Per unit holding cost at collection center x |
| Lx | Collection center labor cost x per unit |
| Ly | Remanufacturing facility labor cost y per unit |
| Lz | Reselling center labor cost z per unit |
| O1 | Remanufacturing unit occupied space |
| O2 | Used-product unit occupied space |
| Kg | Unit weight (per unit) |
| P | Per unit reprocessing cost |
| RT | Per unit retrieval cost |
| RCAPy | Remanufacturing facility y capacity |
| RCx | Collection center rent cost x per unit |
| RCy | Remanufacturing facility rent cost y per unit |
| RCz | Reselling center rent cost z per unit; |
| SOx | Per unit stock-out cost at collection center x |
| SUPx | Collection center supply x; |
| Txy | Transportation expense from collection center x to remanufacturing facility y, per unit |
| Tyz | Transportation expense from remanufacturing facility y to reselling facility z, per unit |
| x | Collection center |
| y | Remanufacturing facility |
| z | Reselling center |
| Xxy | Decision variable for the quantity of units shifting from collection center x to remanufacturing facility y |
| Yxz | Decision variable for the quantity of units shifting from remanufacturing facility y to reselling center z; |
| Zy | Binary variable (0/1) for the selection of remanufacturing facility y |
| Zz | Binary variable (0/1) for the selection of reselling center z |
| Collection Center | AC Unit Received (Year) | Pick up/Drop off Fee $ per Item | Total Items per Year | Total Income ($/Year) |
|---|---|---|---|---|
| Canton | 107 | $20 | 509 | $10,180 |
| Natick | 176 | $25 | 837 | $20,925 |
| Melrose | 175 | $20 | 752 | $15,040 |
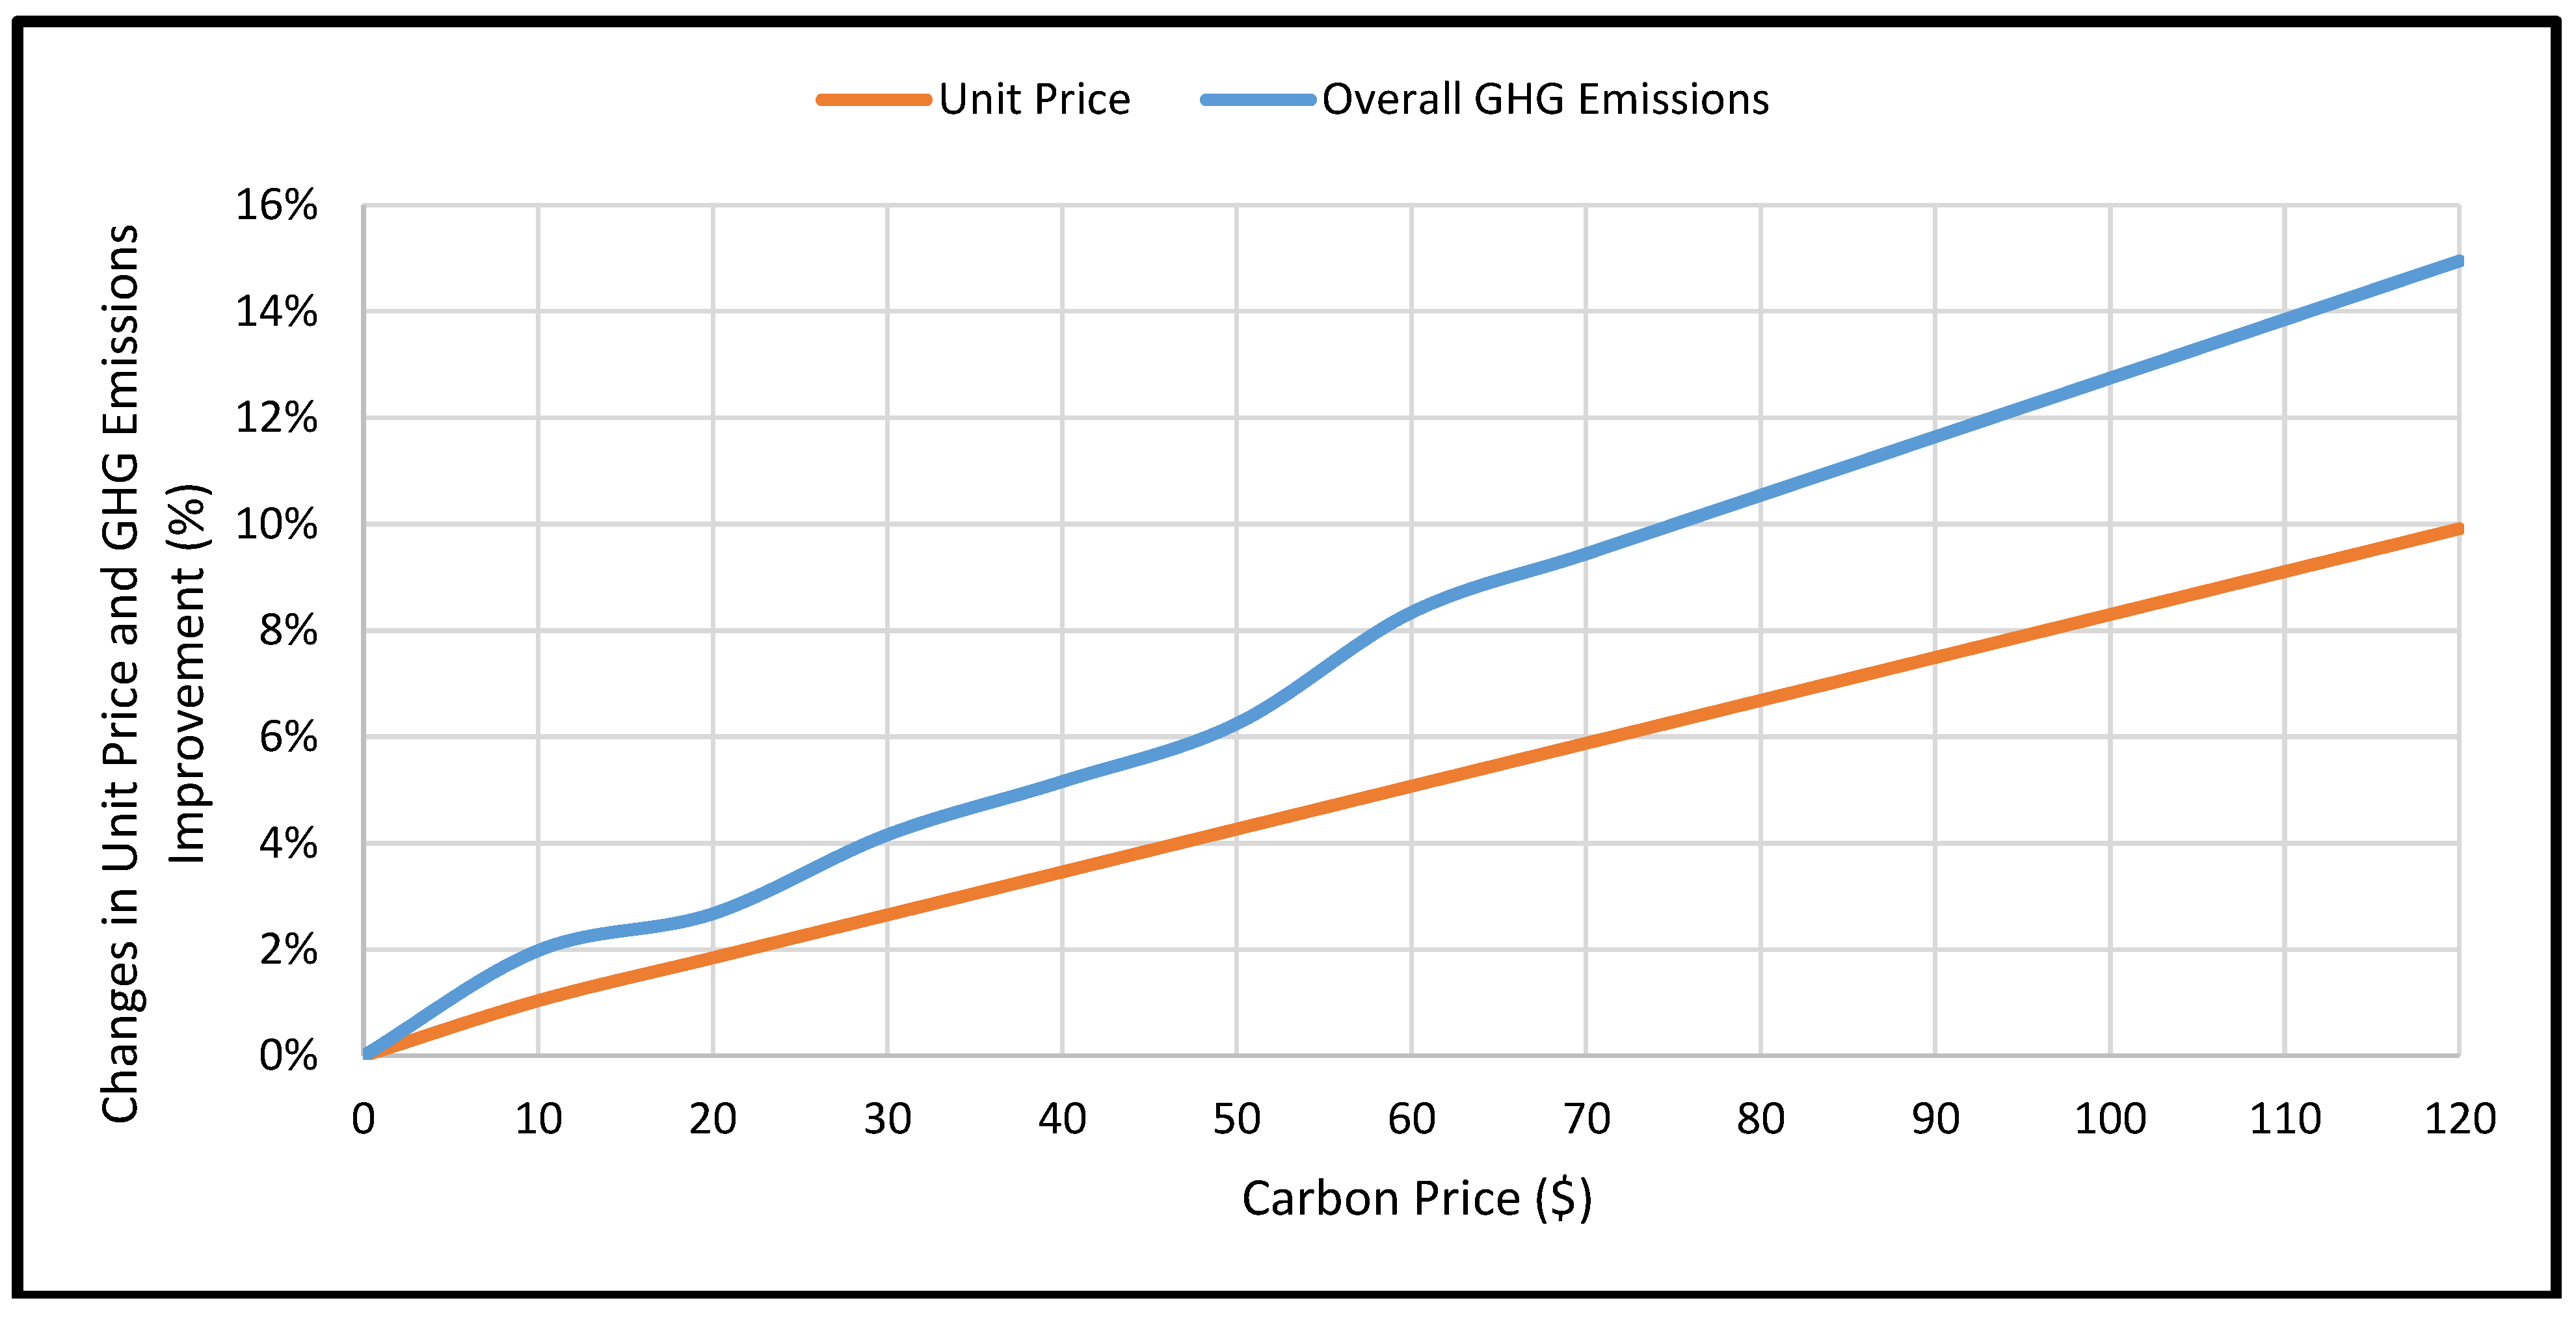
| Carbon Price ($/ton) | Cases | Total Carbon (ton) | Carbon Cost ($) | Total Cost ($) | Changes in Unit Price (%) | Emissions Improvement Compared to the Base Scenario (%) |
|---|---|---|---|---|---|---|
| 0 | 1 | 101 | 0 | 106962.00 | 0.00% | 0.00% |
| 10 | 1 | 99.00 | 990.00 | 108072.02 | 1.04% | 1.98% |
| 20 | 1 | 98.30 | 1966.00 | 108935.23 | 1.84% | 2.67% |
| 30 | 2 | 96.80 | 2904.00 | 109798.44 | 2.65% | 4.16% |
| 40 | 2 | 95.79 | 3831.60 | 110661.65 | 3.46% | 5.16% |
| 50 | 3 | 94.69 | 4734.50 | 111524.86 | 4.27% | 6.25% |
| 60 | 3 | 92.58 | 5554.62 | 112388.07 | 5.07% | 8.34% |
| 70 | 3 | 91.46 | 6402.48 | 113251.28 | 5.88% | 9.44% |
| 80 | 3 | 90.35 | 7228.08 | 114114.49 | 6.69% | 10.54% |
| 90 | 3 | 89.24 | 8031.42 | 114977.70 | 7.49% | 11.65% |
| 100 | 3 | 88.13 | 8812.50 | 115840.91 | 8.30% | 12.75% |
| 110 | 3 | 87.01 | 9571.32 | 116704.12 | 9.11% | 13.85% |
| 120 | 3 | 85.90 | 10307.88 | 117567.33 | 9.92% | 14.95% |
| Source | DF | Adj SS | Adj MS | F-Value | P-Value |
|---|---|---|---|---|---|
| Regression | 13 | 5.32 × 10¹⁰ | 4.10 × 10⁹ | 9.33 | 0.000 |
| Transportation Cost | 1 | 2.86 × 10¹⁰ | 2.86 × 10¹⁰ | 65.27 | 0.000 |
| Energy Cost - fixed | 1 | 6.93 × 10⁶ | 6.93 × 10⁶ | 0.02 | 0.902 |
| Energy Cost - variable | 1 | 1.43 × 10⁸ | 1.43 × 10⁸ | 0.33 | 0.578 |
| Rent Cost | 1 | 4.02 × 10⁸ | 4.02 × 10⁸ | 0.92 | 0.356 |
| Labor Cost | 1 | 6.41 × 10⁶ | 6.41 × 10⁶ | 0.01 | 0.906 |
| Social Cost of Carbon | 1 | 4.54 × 10⁸ | 4.54 × 10⁸ | 1.03 | 0.328 |
| Inventory Cost | 1 | 3.43 × 10⁸ | 3.43 × 10⁸ | 0.78 | 0.392 |
| Remanufacturing Cost | 1 | 5.05 × 10⁹ | 5.05 × 10⁹ | 11.52 | 0.005 |
| Mean demand rate | 1 | 1.15 × 10⁷ | 1.15 × 10⁷ | 0.03 | 0.873 |
| Retrieval Cost | 1 | 2.85 × 10⁹ | 2.85 × 10⁹ | 6.49 | 0.024 |
| Inventory Cost | 1 | 1.28 × 10⁸ | 1.28 × 10⁸ | 0.29 | 0.598 |
| Inventory level | 1 | 7.69 × 10⁸ | 7.69 × 10⁸ | 1.75 | 0.208 |
| Supply rate | 1 | 3.96 × 10⁹ | 3.96 × 10⁹ | 9.03 | 0.010 |
| Error | 13 | 5.7 × 10⁹ | 4.39 × 10⁸ | ||
| Total | 26 | 5.89 × 10¹⁰ |
© 2019 by the author. Licensee MDPI, Basel, Switzerland. This article is an open access article distributed under the terms and conditions of the Creative Commons Attribution (CC BY) license (http://creativecommons.org/licenses/by/4.0/).
Share and Cite
Alkhayyal, B. Corporate Social Responsibility Practices in the U.S.: Using Reverse Supply Chain Network Design and Optimization Considering Carbon Cost. Sustainability 2019, 11, 2097. https://doi.org/10.3390/su11072097
Alkhayyal B. Corporate Social Responsibility Practices in the U.S.: Using Reverse Supply Chain Network Design and Optimization Considering Carbon Cost. Sustainability. 2019; 11(7):2097. https://doi.org/10.3390/su11072097
Chicago/Turabian StyleAlkhayyal, Bandar. 2019. "Corporate Social Responsibility Practices in the U.S.: Using Reverse Supply Chain Network Design and Optimization Considering Carbon Cost" Sustainability 11, no. 7: 2097. https://doi.org/10.3390/su11072097
APA StyleAlkhayyal, B. (2019). Corporate Social Responsibility Practices in the U.S.: Using Reverse Supply Chain Network Design and Optimization Considering Carbon Cost. Sustainability, 11(7), 2097. https://doi.org/10.3390/su11072097