Abstract
By 2050, 70% of the human population is likely to be living in cities, making urbanization an increasing global trend. Detecting changes in ecosystem services (ES) and their bundles in response to urbanization is critical for evaluating land-use policies. We examined changes in the provision of grains, vegetables, fruits, carbon sequestration, soil retention, sandstorm prevention, and water retention from 2000 to 2010 in the Beijing–Tianjin–Hebei metropolitan area, China; then, using a k-means cluster analysis, we classified 202 counties of this area into groups (bundles) based on their similar sets of ES. We found that (1) urban area, forestland, and grassland increased by 22%, 3.6%, and 1.7%, respectively, while cropland decreased by 4.6%; (2) the provision of grains, vegetables, and fruits increased by 24–90%, despite an overall loss in cropland; carbon storage and sand retention increased by 40% and 7%, respectively, while soil and water retention increased slightly by approx. 1% each; (3) 72 counties changed their ES bundles; and the “agriculture bundle” dominated the landscape in 2000 while it decreased by 50% in 2010 and was mainly transformed to “sub-developed urban bundle”, indicating loss of cropland during that decade. The transformation of ES bundles can be used to understand the effects of urbanization. The study indicated that improved technologies and ecological restoration in rural areas can help sustain multiple ES in our rapidly urbanizing world.
1. Introduction
“Earth has become an urban planet” [1]. More than 50% of people now live in cities, and the population of cities is expected to double while urban land is expected to triple in size from 2000 to 2030 [2]. Urban growth has significant impacts on biodiversity, natural habitats, and ecosystem services (ES) upon which society depends [3]. A critical question facing society is how to meet growing human demands for living space, food, and other resources while sustaining biodiversity and ES [1].
With increasing urbanization, many researchers have studied its effects on ES and the relationship between urbanization and ES, but contrasting results have been reported [4,5,6,7]. In West Africa, ES have decreased because of the increasing demand for food from the cities, which has incentivized farmers to convert forests to agricultural fields [8]. However, a study based in Misiones, Argentina found that, with migration from rural to urban areas, landscape planning can be properly used to mitigate forest decline [9]. The impacts of urbanization on ES are complex. A number of studies have used a regression analysis between urbanization indicators and ES indicators to investigate the relationships between urbanization and ES [10,11]. Relationships characterized by “inverted U” shaped curves were found between urbanization and ES indicators [11,12], indicating that ES may increase with urbanization initially, decreasing after reaching a threshold value. Peng et al. [10] found that the relationship between urbanization and ES depended on the indicators used. Regulating services may decrease as a result of natural land loss, while cultural services usually increased because of an increased demand for leisure purposes [13]. The indicators of urbanization, e.g., construction land, showed strong negative relationships with ES, but demographic (population) and economic (Gross Domestic Product) urbanization showed weaker relationships with ES [11]. Furthermore, the impact of urbanization on ES also depends on the research site. In cities in arid climates, such as Phoenix, AZ, USA, urbanization has increased ES because of the increased artificial irrigation in cities [14]. Urbanization may also lead to better management, making resource use more efficient and enabling people to live off less land, thus releasing land that could be used for ecological restoration. Also, the rising interest in environmental protection and ecological restoration provides opportunities to increase ES in urbanized areas. The extent that urbanization effect ES depends on the level of synergy among land-use, conservation, and urbanization policies and their effective implementation [15]. However, few studies have examined changes in ES in urbanized areas with ecological restoration.
Several ES always aggregate together to form analogous ES combinations called ES bundles according to similar social-ecological factors [16,17]. The ES bundles can help to detect the spatially agglometrated patterns of ES, which can in turn help identify the common trade-offs and synergies [16] and the regional specialty of a certain ES [18]. Many researchers have described ES bundles and their related biophysical and social factors and made suggestions for land use management [18,19,20,21,22,23]. For example, Kong et al. [19] identified the high-density regulating ES bundles that inform ES conservation at the watershed scale; they found that ES patterns were mainly determined by land use, slope, and altitute. Dittrich et al. [18] found a high overlap between the ES cluster and the socioeconomic cluster: the provisioning ES bundles mainly overlapped with environmental conditions, while cultural ES bundles were connected to both environmental and socioeconomic conditions. However, most of them were static patterns of ES bundles. Renard [24] showed that ES bundles at the same place changed over time, driven by policies and social factors. Detecting the trajectory of ES bundles can reflect socioeconomic and ecological changes [19,25,26,27,28].
China includes some of the most rapidly urbanizing areas in the world. From 2000 to 2010, the urban population in China increased from 36% to 47.5% [29], and it is projected to increase to 70% by 2030, with an increase in urban land of almost 400% between 2000 and 2030 [30,31]. The Chinese government has implemented major efforts to reduce ecological risks and to improve human well-being, involving the zoning of land use and substantial investments in ecological conservation and restoration. The “Natural Forest Conservation Program” (NFCP) and the “Grain to Green Program” (GTGP) are among the largest ecological restoration programs in the world [32]. Consequently, there is an urgent need to evaluate quantitatively both the effects of urbanization and ecological restoration on improving both the land use and ecological restoration decisions [33,34].
The Beijing–Tianjin–Hebei metropolitan area (BTH) provides a good model to examine these issues. The landscapes in this area have undergone dramatic changes from 2000 to 2010 to support the increasing population and economy [35]. As a result, many ecological and environmental problems have emerged, including sandstorms and soil erosion [36]. Several ecological protection measures have been implemented, including the GTGP and “Beijing-Tianjin Sandstorm Source Control Project” (BSSCP) [37]. However, changes that have taken place to provide ES remain unclear. Therefore, we studied the temporal changes in land use in the 202 counties of BTH from 2000 to 2010. For this, we focused on seven important ESs and their bundles to identify both the challenges and opportunities that result from urbanization and sustainable ecosystem management regarding (1) changes in land cover; (2) changes in the seven ESs; and (3) the ES bundles and their changing trajectories.
2. Materials and Methods
2.1. Study Site
BTH is in northeastern China between 36°01′–42°37′N and 113° 04′–119°53′E (Figure 1). It is about 216,400 km2, accounting for 2.2% of the total land area in China. The total population in 2010 was about 101 million people, accounting for 8% of the national population, with a GDP of about 4373.2 billion yuan (USD 625 billion), accounting for 11% of China’s GDP [38]. The BTH has 202 counties with an average area of 1071 km2. The overall terrain decreases in altitude from the northwest to southeast. Bashang in the northwest is adjacent to Inner Mongolia and is mainly grassland, which is vulnerable to wind erosion that causes sandstorms in the cities of Beijing and Tianjin. The BSSCP project was mainly implemented in Bashang. The Yanshan Mountains in the north and Taihang Mountains in the west are covered with forest and shrub and are where the GTGP was mainly implemented. The east is made up of alluvial and coastal plains, where agriculture and urban areas predominate.
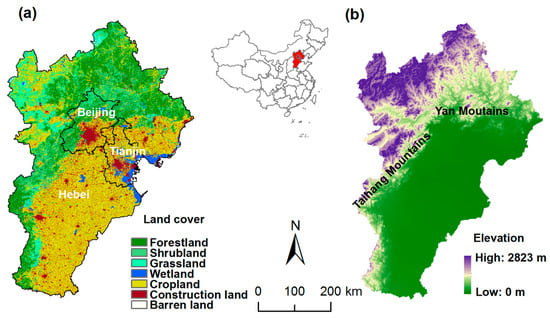
Figure 1.
The land cover in 2010 (a) and the digital elevation model (b) in the Beijing–Tianjin–Hebei metropolitan area.
2.2. Data Sources
Multiple sources of data were used in this study: (1) a 30-m classification map of ecosystems in 2000 and 2010 is from the China Ecosystem Assessment and Security Database, Research Center for Eco-Environment Sciences, Chinese Academy of Sciences (CAS); (2) the carbon density in the biomass of each ecosystem is from the Institute of Remote Sensing and Digital Earth, CAS; (3) the Digital Elevation Model (DEM) with a resolution of 90 m from the Shuttle Radar Topography Mission 3 is from the International Scientific & Technical Data Mirror Site, Computer Network Information Center, Chinese Academy of Sciences. (http://www.gscloud.cn); (4) the temperature, precipitation, and solar radiation obtained from the China Meteorological Data Service Center (http://data.cma.cn/); (5) the wind speed and evapotranspiration from the Institute of Geographic Sciences and Natural Research, CAS; and (6) the agriculture statistical data from the Chinese Academy of Agricultural Sciences.
2.3. Detecting Land Cover Transformation
We used the classification maps for ecosystems in 2000 and 2010 from China’s National Ecosystem Assessment [39] and calculated the land use transition matrix in ArcGIS10.2.
2.4. Focal Ecosystem Services
Twenty-four percent of the total land in BTH suffered from soil erosion [40], including hydraulic erosion and wind erosion, which also caused sand storms. Plants absorb CO2 from the atmosphere and, via photosynthesis, convert it into biomass. As this process decelerates climate warming, carbon storage is a major indicator for climate regulation [41]. Grain (mainly wheat and maize), vegetables, and fruits are major provisioning products in BTH. Focusing on these issues, seven important ESs were quantified in BTH: soil retention; water retention; sand retention; carbon storage; and the provision of grains, vegetables, and fruits (Table 1).

Table 1.
The ecosystem services indicators.
● Carbon storage (CS) refers to the carbon stored in terrestrial ecosystems, mainly including forestland, grassland, and wetland, and it was estimated following Ouyang et al. [39] as
where CDij is the carbon density in the biomass of ecosystem i in pixel j, ARi is the pixel area, Bij represents the biomass density of ecosystem i in pixel j, and CCi reflects the carbon content in the biomass of each ecosystem, which is 0.45 for grassland and 0.5 for forestland and wetland [39].
● Soil retention (SOR) refers to the soil retained in an ecosystem in a year. It was calculated according to the Universal Soil Loss Equation [42] in the Integrated Valuation of Ecosystem Services and Tradeoffs (InVEST 3.3.3) [43] as follows:
where R reflects the rainfall erosivity factor, K represents the soil erodibility factor, LS represents the topographic factor, and C represents the vegetation factor.
● Water retention (WR) refers to the water retained by the ecosystem in a year. It was calculated as
using the precipitation (P) minus the runoff (R) and evapotranspiration (ET) values of each ecosystem (i). A represents the area of the defined ecosystem; j represents the number of ecosystem types.
● Sand retention (SAR) refers to the sand retained in an ecosystem in a year. Wind erosion is most likely to happen in arid and semiarid areas. We used the 40-mm precipitation line to define the wind erosion area. In BTH, sandstorms mostly come from the grassland of Zhangjiakou and Chengde. Beijing is not included in the wind erosion area. We used the revised wind erosion equation [44] to estimate SAR, which was calculated as the difference between the potential wind erosion without vegetation cover and actual wind erosion, as follows:
where SLp represents the potential wind erosion, SL represents the actual wind erosion, Qmax reflects the estimated maximum sand transport capacity by wind, Z reflects the distance from the upwind edge of the field, Sp and S are the critical field length, WF is the weather factor, EF reflects the soil erodible factor, SCF reflects the soil crusting factor, K’ is the surface roughness factor, and C represents the vegetation factor.
2.5. Ecosystem Service Bundles
The ESs were calculated using the ArcGIS 10.2 software. The “zonal statistics as table” tool was used to summarize the ESs within the administrative boundaries of each county. The density of each ES in each county was also calculated. The data on the density of each ES in each county in 2000 and 2010 (separately for each year) were exported to the SPSS 21.0 software, and their values were transformed into a range (from 0–1) using max-normalization; then, a k-means cluster analysis was performed to identify the counties with similar ES bundles [23]. The number of groups (k) with values from 4 to 8 (i.e., k = 4–8) was tested, and we found that k = 5 best represented the situation in BTH. The dominant ES in each of the five groups are shown in the radar chart. The trajectory of the ES bundles of each county was detected by comparing the ES bundles in 2000 and 2010 [24]. This data was then exported to the ArcGIS software, in which their distribution patterns were plotted. Moran’s I, a spatial autocorrelation index, was calculated using the ArcGIS 10.2 software and was used to examine the spatial patterns of the ES bundles. The Z-scores from Moran’s I indicated a tendency towards clumped, dispersed, or random spatial patterns.
3. Results
3.1. Change of Land Cover
From 2000 to 2010, the land cover changed dramatically in cities and rural areas. Urban areas increased the most (3983 km2, 22%), followed by forestland (1529 km2, 3.6%), and then grassland (337 km2, 1.7%) (Figure 2). Conversely, cropland decreased the most (4780 km2, 4.6%), followed by shrub land (659 km2, 2.6%), and then wetland (407 km2, 6.4%). From the land transformation matrix (Table 2), we found that a loss of cropland contributed 86% to the increase in urban areas, although wetland (363 km2) and grassland (176 km2) were also lost during urbanization. The loss of shrubs contributed to 45% of the forest increase. The conversion of cropland contributed another 42% to the increase in the forest area.
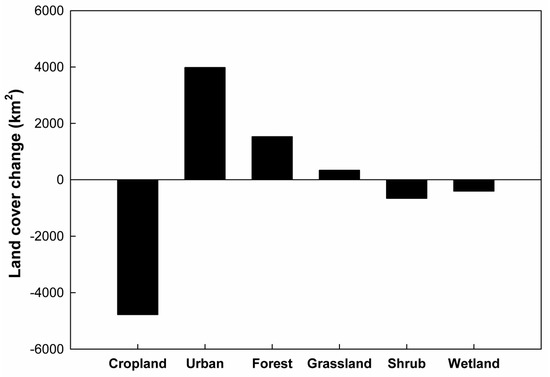
Figure 2.
The land cover changes in Beijing–Tianjin–Hebei from 2000 to 2010.
Table 2.
The land transformation and its driving forces in the Beijing–Tianjin–Hebei area from 2000 to 2010.
3.2. Major Ecosystem Services Increased Significantly Region-Wide But Were Spatially Uneven
Individual ES showed different spatial patterns of increases and decreases at the county level between 2000 and 2010 (Figure 3). Carbon storage and soil retention decreased in the urban area but increased in the mountainous area. Sand retention increased in the south of Bashang. Water retention decreased in central areas of Beijing and Tianjin but increased in other regions. Grain increased in the plains but decreased in mountain and urban areas. The provision of vegetables and fruits were increased widely. However, all seven ESs increased from 2000 to 2010 region-wide (Figure 4). The provision of grains, vegetables, and fruits increased by 24%, 49%, and 90%, respectively. All regulating services also increased region-wide: carbon storage and sand retention increased by 40% and 7%, respectively, while soil retention and water retention increased slightly by about 1% each.
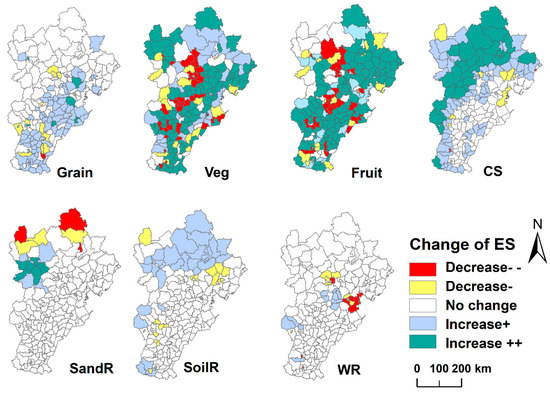
Figure 3.
The patterns of change in ecosystem services (ES) at the county level in the Beijing–Tianjin–Hebei metropolitan area from 2000 to 2010. CS, carbon storage; WR, water retention.
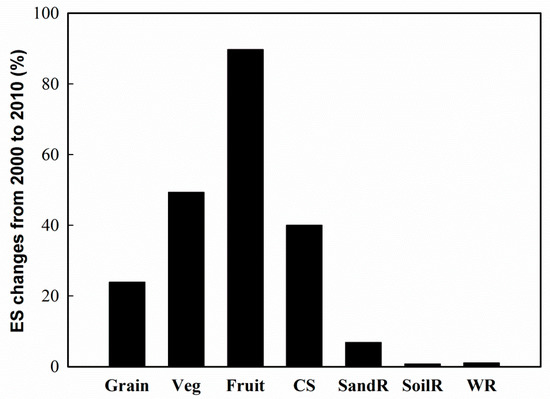
Figure 4.
The total change in ecosystem service (ES) in the Beijing–Tianjin–Hebei metropolitan area from 2000 to 2010. CS, carbon storage; WR, water retention.
3.3. The Trajectory of the ES Bundles in Each County
The 202 counties in BTH were each categorized into groups according to the similar types and quantities of ES provided in each year (2000 and 2010) (Figure 5a). In 2000, the five ES bundles were as follows: (1) few ES, usually with a high-density population in urban areas with few green spaces, named the “Urban bundle”; (2) a high amount of fruits, named the “Fruits bundle”; (3) a high proportion of grains, vegetables, and fruits and with intensive croplands, named the “Agriculture bundle” (AGR); (4) a considerable sand retention only distributed in the grassland areas of the Bashang plateau, named “SandR”; and (5) a considerable high-density regulating ES (HRES), distributed in the forestlands of the Yan and Taihang mountains, with few croplands. In 2010, the five ES bundles were as follows: (1) very few ES, mostly located in the developed urban area, and here, designated DU; (2) few ES with a few agricultural products, mainly distributed in sub-developed urban, and here, renamed SU; (3) AGR; (4) SandR; and (5) HRES. The categories Urban, DU, and SU all provide few ES, but in different amounts; SU provides more ES than Urban, which in turn provides more ES than DU. The characteristics of the ES bundles were geographically specific, which is consistent with the variety of terrains and land uses in BTH. The Moran’s I values showed that counties providing the same ES bundle became increasingly spatially clustered over time (in 2000, I = 0.45 and P = 0; in 2010, I = 0.47 and P = 0, Figure 5b).
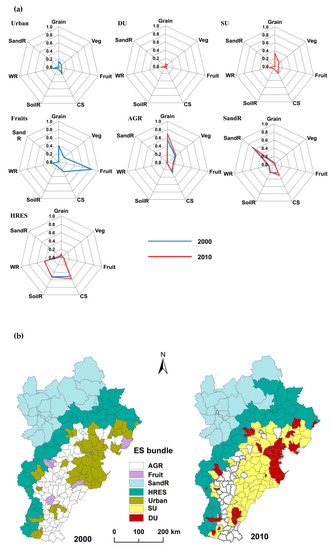
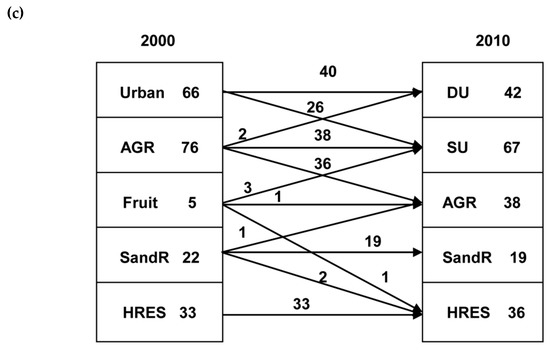
Figure 5.
The ecosystem service (ES) bundle dynamics from 2000 to 2010: (a) the ES bundles. (b) The spatial distribution of ES bundles: The ES bundles became increasingly clustered. (c) The transformation of ES bundles: The numbers in the boxes show the total number of counties that provided a specific bundle. The numbers on the arrows show the number of transformed counties. AGR, agriculture; HRES, high-density regulating ES; DU, developed urban; SU, sub-developed urban.
From 2000 to 2010, 72 counties changed their ES bundles (Figure 5c). AGR dominated the landscape in 2000 while the number of counties in AGR bundles decreased 50% in 2010, mainly transformed to SU which has lower provisioning services, indicating a loss of cropland during the decade. A newly formed ES bundle SU was dominated in 2010 which was mainly transformed from Urban and AGR. Counties in an urban bundle broke into DU and SU, illustrating that urban areas were differentiated. SandR shifted one to AGR and two to HRES. HRES increased by three from Fruit and SandR. Fruit bundles all shifted to other types.
4. Discussion
Urbanization changed the land cover greatly from 2000 to 2010. Urban and forested areas expanded by 22% and 3.6%, respectively, resulting in a 4.6% decline in cropland. Overall, land use changed significantly, which affected ES and ES bundles in different areas.
4.1. Urbanization and Ecological Restoration Expanded Simultaneously
The 22% increase of urban areas indicates the rapid urbanization of the BTH area from 2000 to 2010. This urban expansion is mostly a result of the decline in cropland. Concurrently, forested areas and grassland also increased as a result of ecological restoration policies such as GTGP and BSSCP. Previously, farmers in China cultivated hilly lands to increase food production per capita as the amounts of cropland were limited. This practice damaged the local ecosystems because steep slopes are fragile and at high risk of soil erosion. The first pilot projects of GTGP were performed in Zhangjiakou and Chengde, in the Hebei Province, from 2000 to 2002; by 2002, these projects were already implemented in the entire BTH area. BSSCP was implemented from 2002 to 2010. Both GTGP and BSSCP had three main measures: to turn cropland in steep slopes (slope steepness > 25) into forest or grassland, to perform afforestation on barren land, and to ensure mountain closure for forest cultivation [32,45]. BSSCP also included watershed management, forbidden grazing policies, and people migration [45]. Unfavorable croplands in mountainous areas were converted into grassland and forests following ecological restoration policies. Because of these policies, 642 km2 of cropland were restored to forests and 746 km2 of cropland were restored to grasslands (Table 2). Moreover, 701 km2 of shrub areas successfully became forestland, which indicates that the quality and quantity of forestland were improved in the rural areas.
4.2. Understanding the Increase of Ecosystem Services
Region-wide carbon storage and sand retention increased by 40% and 7%, respectively, because of the increase in the quantity and quality of forestland and grassland. Zhou et al. [12] also found similar results. However, soil and water retention did not appear to change much in our study. This was most likely because of the amount of time required for soil and water retention to take place. Another possible reason may be that our models were based on land-use classes which fail to capture the full effects of this type of ES.
Another reason for the increases in ES may be that urbanization causes people to move from the larger rural areas to denser urban areas. The population urbanization rate of BTH increased from 32% to 55% between 2000 and 2010 [29,46]. More than 10 million rural people migrated to urban areas; fewer people are, therefore, directly dependent on the land, which facilitates natural ecosystem restoration. Studies in the Yangtze River Basin have also shown that ecological restoration projects such as GTGP have not only improved ES but also farmers’ income. In addition, these projects have encouraged the migration of farmers to urban areas, which in turn aids the ecological restoration of rural areas [47]. However, the effect of urbanization on ES depends on the level of cooperation between urbanization and ecological restoration policies [15,48].
Provisioning services increased from 24–90%, despite the loss of cropland; this is consistent with the China National Assessment, which reported that food production increased by almost 40% from 2000 to 2010 [39]. Despite the loss of farmland, grain production per unit area increased, and the factors that influenced this increase of grain yields in China include the improvement of seed technology and cultivation techniques (such as plastic film mulching cultivation) and the increased use of irrigation and fertilization [49,50]. These factors, however, will probably cause future environmental problems such as water pollution; these problems will require further evaluation.
4.3. The Trajectory of ES Bundles Indicates the Increasing Specialization of Land Use
We identified clear patterns of ES bundles at the regional scale, mainly providing one or a few types of ES, which reflects the ongoing specialization in land use and the intensive cropland management also reported in other studies [18,24]. Over one third of the counties exhibited changes in their associated ES bundles, suggesting large-scale land-use changes during the decade. AGR bundles decreased by 50% and transformed into SU, indicating that cropland regions were converted into land used for construction. Urban bundles present in 2000 were separated into two groups, with one group becoming more densely urbanized and providing fewer ES which, due to economic development, were concentrated in the downtown area of Beijing, Tianjin, and Tangshan, with other cities having fewer economic opportunities. The increases in DU and SU led to a 22% increase in urban land. The area of land used for construction increased and ES decreased considerably in these areas.
We found that counties became more specialized. The counties in AGR bundles decreased by 50%, while provisioning services increased from 24% to 90%. The counties in SandR declined by 14%, while total sand retention increased by 1%. The counties in HRES only increased by 9%, while carbon storage increased by 40% and forest area increased by 3.6%. Specialization would improve land productivity and increase the designated ES, consistent with the concept of the land zoning initiative “Major Function Oriented Zoning (MFOZ),” which aims to ensure food security, the conservation of ES, and the sustainability of urbanization [51]. This kind of ES bundle separation and specialization has also been reported in Quebec [24].
4.4. The Importance of Regional Cooperation
Another insight from our study regarded the importance of regional cooperation. The polarization of economic development in the BTH is a long-standing social problem. Most of Beijing and Tianjin comprises SU and DU, which provide a few ES and is dependent on Hebei, which acts as an ecological barrier preventing sandstorms whilst providing sources of clean water and food for Beijing and Tianjin. However, the GDP per capita in Beijing and Tianjin are three times higher than that in Hebei. Thus, an investment in ESs across all three regions would be beneficial to all three cities. An investment in ES programs, like the paddy land-to-dry land conversion program between Beijing and the Miyun Reservoir watershed, has proven to be an economic and ecological success [52]. Our results showed that the differentiation in ES became more distinct and that counties became specialized over time, meaning that more compensation is needed in regions relying on ES.
4.5. Limitations and Future Research
More ES indicators, especially for water quantity and quality, biodiversity, and cultural aspects, are required to provide a more complete assessment of the effects of urbanization on ES. The technical innovation and inputs to increase agricultural production that may cause other problems, such as water shortage and water pollution, were not included in our study. Our study of only 10 years of data demonstrated the complexity of ES dynamics. However, this timeframe was not long enough to capture all the effects of current polices on urbanization and ecological restoration. A longer time span of observations, including more ES indicators, is needed in future studies.
5. Conclusions
On one hand, urbanized land in the BTH area expanded by 22% from 2000 to 2010, causing great losses of natural and semi-natural land and resulting in decreases in ES in urban areas. On the other hand, forested areas and grassland also increased by 3.6% and 1.7%, respectively, because of ecological restorations in the rural areas resulting from cropland decrease. Moreover, the increase in quality (forest succession from shrub land) and quantity (area increase) of natural habitats in mountainous areas enhanced carbon storage and sand retention at a regional scale; carbon storage and sand retention increased by 40% and 7%, respectively. This indicates that off-site ecological restoration can offset significant losses in ES in urban areas.
At a regional scale, the provision of grains, vegetables, and fruits increased by 24–90% despite an overall loss in cropland because of technological innovation and better management. The ES bundles of 72 counties changed from 2000 to 2010; the “agriculture bundle” dominated the landscape in 2000, but it decreased by 50% in 2010 and was mainly transformed into a “sub-developed urban bundle”, indicating the great loss of cropland during that decade. Our results clearly demonstrate the utility of modeling dynamic changes in ES bundles as a method to understand the processes of urbanization in cities and ecological restoration in rural areas. Our empirically derived ES trajectories showed that improved technologies and ecological restoration can help sustain multiple ES in the rapidly urbanizing world. Moreover, these results can be implemented into land management policies and practices to sustainably manage responses to urbanization in the future.
Author Contributions
Y.Y., H.Z., and Z.O. designed the analysis and wrote the paper; Y.Y., W.X., and L.Z. analyzed data; and all authors substantially revised the paper.
Funding
This work was funded by the National Natural Science Foundation of China (grant number 71533005) and National Key Research and Development Plan (2017YFF 0207303).
Acknowledgments
We thank Gretchen Daily, Lisa Mandle, and Dehua Mao for their comments on the previous manuscript.
Conflicts of Interest
The authors declare that they have no conflict of interest.
References
- Wigginton, N.S.; Fahrenkamp-Uppenbrink, J.; Wible, B.; Malakoff, D. Cities are the future. Science 2016, 352, 904–905. [Google Scholar] [CrossRef] [PubMed]
- Seto, K.C.; Güneralp, B.; Hutyra, L.R. Global forecasts of urban expansion to 2030 and direct impacts on biodiversity and carbon pools. Proc. Natl. Acad. Sci. USA 2012, 109, 16083–16088. [Google Scholar] [CrossRef] [PubMed]
- Elmqvist, T.; Fragkias, M.; Goodness, J.; Güneralp, B.; Marcotullio, P.J.; McDonald, R.I.; Parnell, S.; Schewenius, M.; Sendstad, M.; Seto, K.C.; et al. (Eds.) Urbanization, Biodiversity and Ecosystem Services: Challenges and Opportunities; Springer: Dordrecht, The Netherlands, 2013. [Google Scholar]
- Li, B.; Chen, D.; Wu, S.; Zhou, S.; Teng, W.; Hao, C. Spatio-temporal assessment of urbanization impacts on ecosystem services: Case study of Nanjing city, China. Ecol. Indic. 2016, 71, 416–427. [Google Scholar] [CrossRef]
- Lyu, R.; Zhang, J.; Xu, M.; Li, J. Impacts of urbanization on ecosystem services and their temporal relations: A case study in Northern Ningxia, China. Land Use Policy 2018, 77, 163–173. [Google Scholar]
- Zhang, Y.; Liu, Y.; Zhang, Y.; Liu, Y.; Zhang, G.; Chen, Y. On the spatial relationship between ecosystem services and urbanization: A case study in Wuhan, china. Sci. Total Environ. 2018, 780, 637–638. [Google Scholar] [CrossRef] [PubMed]
- Liu, W.; Zhan, J.; Zhao, F.; Yan, H.; Zhang, F.; Wei, X. Impacts of urbanization-induced land-use changes on ecosystem services: A case study of the pearl river delta metropolitan region, china. Ecol. Indic. 2019, 98, 228–238. [Google Scholar] [CrossRef]
- Güneralp, B.; Lwasa, S.; Masundire, H.; Parnell, S.; Seto, K.C. Urbanization in Africa: Challenges and opportunities for conservation. Environ. Res. Lett. 2017, 13, 015002. [Google Scholar] [CrossRef]
- Izquierdo, A.E.; Grau, H.R.; Aide, T.M. Implications of Rural–Urban Migration for Conservation of the Atlantic Forest and Urban Growth in Misiones, Argentina (1970–2030). Ambio 2011, 40, 298–309. [Google Scholar] [CrossRef]
- Peng, J.; Tian, L.; Liu, Y.; Zhao, M.; Hu, Y.; Wu, J. Ecosystem services response to urbanization in metropolitan areas: Thresholds identification. Sci. Total Environ. 2017, 607, 706–714. [Google Scholar] [CrossRef] [PubMed]
- Wang, J.; Zhou, W.; Picket, S.P.A.; Yu, W.; Li, W. A multiscale analysis of urbanization effects on ecosystem services supply in an urban megaregion. Sci. Total Environ. 2019, 662, 824–833. [Google Scholar] [CrossRef] [PubMed]
- Zhou, D.; Tian, Y.; Jiang, G. Spatio-temporal investigation of the interactive relationship between urbanization and ecosystem services: Case study of the Jingjinji urban agglomeration, China. Ecol. Indic. 2018, 95, 152–164. [Google Scholar] [CrossRef]
- Ye, Y.; Bryan, B.A.; Zhang, J.; Connor, J.D.; Chen, L.; Qin, Z.; He, M. Changes in land-use and ecosystem services in the Guangzhou-Foshan Metropolitan Area, China from 1990 to 2010: Implications for sustainability under rapid urbanization. Ecol. Indic. 2018, 93, 930–941. [Google Scholar] [CrossRef]
- Buyantuyev, A.; Wu, J. Urbanization alters spatiotemporal patterns of ecosystem primary production: A case study of the Phoenix metropolitan region, USA. J. Arid Environ. 2009, 73, 512–520. [Google Scholar] [CrossRef]
- Reed, S.E.; Hilty, J.A.; Theobald, D.M. Guidelines and incentives for conservation development in local land-use regulations. Conserv. Biol. 2014, 28, 258–268. [Google Scholar] [CrossRef] [PubMed]
- Raudsepp-Hearne, C.; Peterson, G.D.; Tengö, M.; Bennett, E.M.; Holland, T.; Benessaiah, K.; MacDonald, G.K.; Pfeifer, L. Untangling the Environmentalist’s Paradox: Why Is Human Well-being Increasing as Ecosystem Services Degrade? BioScience 2010, 60, 576–589. [Google Scholar] [CrossRef]
- Spake, R.; Lasseur, R.; Crouzat, E.; Bullock, J.M.; Lavorel, S.; Parks, K.E.; Schaafsma, M.; Bennett, E.M.; Maes, J.; Mulligan, M.; et al. Unpacking ecosystem service bundles: Towards predictive mapping of synergies and trade-offs between ecosystem services. Glob. Environ. Chang. 2017, 47, 37–50. [Google Scholar] [CrossRef]
- Dittrich, A.; Seppelt, R.; Václavík, T.; Cord, A.F. Integrating ecosystem service bundles and socio-environmental conditions – a national scale analysis from Germany. Ecosyst. Servs. 2017, 28, 273–282. [Google Scholar] [CrossRef]
- Kong, L.; Zheng, H.; Xiao, Y.; Ouyang, Z.; Li, C.; Zhang, J.; Huang, B. Mapping ecosystem service bundles to detect distinct types of multi-functionality within the diverse landscape of the Yangtze River Basin, China. Sustainability 2018, 10, 857. [Google Scholar] [CrossRef]
- Crouzat, E.; Mouchet, M.; Turkelboom, F.; Byczek, C.; Meersmans, J.; Berger, F.; Verkerk, P.J.; Lavorel, S. Assessing bundles of ecosystem services from regional to landscape scale: Insights from the French Alps. J. Appl. Ecol. 2015, 52, 1145–1155. [Google Scholar] [CrossRef]
- Hamann, M.; Biggs, R.; Reyers, B. Mapping social–ecological systems: Identifying ‘green-loop’ and ‘red-loop’ dynamics based on characteristic bundles of ecosystem service use. Glob. Environ. Chang. 2015, 34, 218–226. [Google Scholar] [CrossRef]
- Queiroz, C.; Meacham, M.; Richter, K.; Norström, A.V.; Andersson, E.; Norberg, J.; Peterson, G. Mapping bundles of ecosystem services reveals distinct types of multifunctionality within a Swedish landscape. Ambio 2015, 44, 89–101. [Google Scholar] [CrossRef]
- Zhao, M.; Peng, J.; Liu, Y.; Li, T.; Wang, Y. Mapping Watershed-Level Ecosystem Service Bundles in the Pearl River Delta, China. Ecol. Econ. 2018, 152, 106–117. [Google Scholar] [CrossRef]
- Renard, D.; Rhemtulla, J.M.; Bennett, E.M. Historical dynamics in ecosystem service bundles. Proc. Natl. Acad. Sci. USA 2015, 112, 13411–13416. [Google Scholar] [CrossRef] [PubMed]
- Bennett, E.M.; Peterson, G.D.; Gordon, L.J. Understanding relationships among multiple ecosystem services. Ecol. Letts. 2009, 12, 1394–1404. [Google Scholar] [CrossRef]
- Cumming, G.S.; Buerkert, A.; Hoffmann, E.M.; Schlecht, E.; von Cramon-Taubadel, S.; Tscharntke, T. Implications of agricultural transitions and urbanization for ecosystem services. Nature 2014, 515, 50–57. [Google Scholar] [CrossRef]
- Turner, K.G.; Odgaard, M.V.; Bøcher, P.K.; Dalgaard, T.; Svenning, J.C. Bundling ecosystem services in Denmark: Trade-offs and synergies in a cultural landscape. Landsc. Urban Plan. 2014, 125, 89–104. [Google Scholar] [CrossRef]
- Ferrari, M.; Geneletti, D.; Cayuela, L.; Orsi, F.; Rey-Benayas, J.M. Analysis of Bundles and Drivers of Change of Multiple Ecosystem Services in an Alpine Region. J. Environ. Assess. Pol. Manag. 2016, 18, 1650026. [Google Scholar] [CrossRef]
- National Bureau of Statistics of China. Tabulation on the 2010 Population Census of the People’s Republic of China; Chinese Statistical Press: Beijing, China, 2012. (In Chinese)
- United Nations. World Urbanization Prospects: The 2018 Revision; United Nations Department of Economic and Social Affairs/Population Division: New York, NY, USA, 2018; Available online: https://www.un.org/development/desa/publications/2018-revision-of-world-urbanization-prospects.html (accessed on 26 December 2018).
- Güneralp, B.; Seto, K.C. Futures of global urban expansion: Uncertainties and implications for biodiversity conservation. Environ. Res. Lett. 2013, 8, 014025. [Google Scholar] [CrossRef]
- Liu, J.; Li, S.; Ouyang, Z.; Tam, C.; Chen, X. Ecological and socioeconomic effects of China’s policies for ecosystem services. Proc. Natl. Acad. Sci. USA 2008, 105, 9477–9482. [Google Scholar] [CrossRef] [PubMed]
- Gobster, P.H. Introduction: Urban Ecological Restoration. Nat. Cult. 2010, 5, 227–230. [Google Scholar] [CrossRef]
- Jaunatre, R.; Buisson, E.; Muller, I.; Morlon, H.; Mesléard, F.; Dutoit, T. New synthetic indicators to assess community resilience and restoration success. Ecol. Indic. 2013, 29, 468–477. [Google Scholar] [CrossRef]
- Tan, M.; Li, X.; Xie, H.; Lu, C. Urban land expansion and arable land loss in China—A case study of Beijing–Tianjin–Hebei region. Land Use Policy 2005, 22, 187–196. [Google Scholar] [CrossRef]
- Zhang, W.; Xu, K.P.; Jiang, H.Q. Environmental Protection Strategy of Beijing–Tianjin–Hebei Region; China Environmental Press: Beijing, China, 2017. (In Chinese) [Google Scholar]
- Yang, X.; Xu, B.; Jin, Y.; Qin, Z.; Ma, H.; Li, J.; Zhao, F.; Chen, S.; Zhu, X. Remote sensing monitoring of grassland vegetation growth in the Beijing–Tianjin sandstorm source project area from 2000 to 2010. Ecol. Indic. 2015, 51, 244–251. [Google Scholar] [CrossRef]
- National Bureau of Statistics of China. China Statistical Yearbook 2010; Chinese Statistical Press: Beijing, China, 2011. (In Chinese)
- Ouyang, Z.; Zheng, H.; Xiao, Y.; Polasky, S.; Liu, J.; Xu, W.; Wang, Q.; Zhang, L.; Xiao, Y.; Rao, E.; et al. Improvements in ecosystem services from investments in natural capital. Science 2016, 352, 1455–1459. [Google Scholar] [CrossRef]
- Ministry of Water Resources. Bulletin of First National Water Census for Soil and Water Conservation; China Water & Power Press: Beijing, China, 2013. (In Chinese)
- Ma, L.; Bicking, S.; Müller, F. Mapping and comparing ecosystem service indicators of global climate regulation in Schleswig-Holstein, Northern Germany. Sci. Total Environ. 2019, 648, 1582–1597. [Google Scholar] [CrossRef] [PubMed]
- Wischmeier, W.H.; Smith, D.D. Predicting rainfall erosion losses—A guide to conservation planning. In USDA Agriculture Handbooks; No. 537; USDA: Washington, DC, USA, 1978. [Google Scholar]
- Sharp, R.; Tallis, H.T.; Ricketts, T.; Guerry, A.D.; Wood, S.A.; Chaplin-Kramer, R.; Nelson, E.; Ennaanay, D.; Wolny, S.; Olwero, N.; et al. InVEST+ VERSION+ User’s Guide; The Natural Capital Project: Stanford, CA, USA, 2015; Available online: http://data.naturalcapitalproject.org/nightly-build/invest-users-guide/html/ (accessed on 26 January 2018).
- Fryrear, D.W.; Saleh, A.; Bilbro, J.D.; Schomberg, H.M.; Stout, J.E.; Zobeck, T.M. Revised Wind Erosion Equation (RWEQ); USDA Tech. Bull. 1; Wind Erosion and Water Conservation Research Unit, USDA-ARS, Southern Plains Area Cropping Systems Research Laboratory: Lubbock, TX, USA, 1998. [Google Scholar]
- Gao, S.; Zhang, C.; Zou, X.; Wu, Y.; Shi, S.; Li, H. Benefits of Beijing-Tianjin Sand Source Control Engineering; Science Press: Beijing, China, 2008. (In Chinese) [Google Scholar]
- Zhang, W.M. Tabulation on the 2000 Population Census of the People’s Republic of China; Chinese Statistical Press: Beijing, China, 2002. (In Chinese) [Google Scholar]
- Kong, L.; Zheng, H.; Rao, E.; Xiao, Y.; Ouyang, Z.; Li, C. Evaluating indirect and direct effects of eco-restoration policy on soil conservation service in Yangtze river basin. Sci. Total Environ. 2018, 631, 887–894. [Google Scholar] [CrossRef]
- Güneralp, B.; Perlstein, A.S.; Seto, K.C. Balancing urban growth and ecological conservation: A challenge for planning and governance in China. Ambio 2015, 44, 532–543. [Google Scholar] [CrossRef] [PubMed]
- Qu, B.; Li, W.; Qian, J. Analysis of major factors influencing grain yield increasing potential of China. Chin. J. Agric. Resour. Reg. Plan. 2009, 30, 34–39. (In Chinese) [Google Scholar]
- Hebei Development and Reform Commission. Hebei’s “12th Five-Year” Agricultural Development Plan; The People’s Government of Hebei Province: Shijiazhuang, China, 2013. (In Chinese)
- Fan, J.; Tao, A.; Ren, Q. On the historical background, scientific intentions, goal orientation, and policy framework of major function-oriented zone planning in China. J. Res. Ecol. 2010, 1, 289–299. [Google Scholar]
- Zheng, H.; Robinson, B.E.; Liang, Y.C.; Polasky, S.; Ma, D.C.; Wang, F.C.; Ruckelshaus, M.; Ouyang, Z.Y.; Daily, G.C. Benefits, costs, and livelihood implications of a regional payment for ecosystem service program. Proc. Natl. Acad. Sci. USA 2013, 110, 16681–16686. [Google Scholar] [CrossRef] [PubMed]
© 2019 by the authors. Licensee MDPI, Basel, Switzerland. This article is an open access article distributed under the terms and conditions of the Creative Commons Attribution (CC BY) license (http://creativecommons.org/licenses/by/4.0/).