Article

Evaluating the Environmental-Technology Gaps of Rice Farms in Distinct Agro-Ecological Zones of Ghana

1
Deutsche Gesellschaft für Internationale Zusammenarbeit (GIZ) GmbH, P.O. Box KA 9698, Accra, Ghana
2
Institute of Agricultural Economics and Social Sciences in the Tropics and Subtropics, University of Hohenheim, Wollgrasweg 43, 70599 Stuttgart, Germany
3
International Institute of Tropical Agriculture (IITA), P.O. Box 709, Nampula, Mozambique
4
International Agricultural Trade and Development, Humboldt-Universität zu Berlin, 10099 Berlin, Germany
5
Department of Agricultural Economics, University of Khartoum, Shambat 13314, Sudan
6
Department of Agricultural Economics and Agribusiness, University of Ghana, P.O. Box LG 68, Accra, Ghana
*
Author to whom correspondence should be addressed.
Sustainability 2019, 11(7), 2072; https://doi.org/10.3390/su11072072
Submission received: 30 January 2019 / Revised: 15 March 2019 / Accepted: 19 March 2019 / Published: 8 April 2019

Abstract

:
Rice (Oryza sativa) is an important food staple and a cash crop, which is cultivated in all the ten regions of Ghana under varying agro-ecological conditions. These conditions also reflect the production technologies used and the total farm output. In an attempt to determine the potential sources of production shortfalls on rice farms in Ghana, this paper estimates the production efficiency and the environmental-technology gaps of rice-producing households in the forest-savannah transition and guinea savannah agro-ecological zones of Ghana. The paper adopts the stochastic metafrontier framework, which permits technology-related inefficiency effects to be extricated from managerial inefficiency effects for appropriate policy formulation. In contrast to past studies, the empirical findings reveal that farms in the two agro-ecological zones adopt heterogeneous production technologies due to differences in their production environments. This is indicated by the estimated mean environmental-technology gap ratios of 0.95 and 0.50, and mean metafrontier technical efficiencies of 0.56 and 0.42 for farms in the forest-savannah transition and guinea savannah zones, respectively. These findings call for agricultural policy formulation in Ghana to be targeted at the prevailing environmental conditions of the various agro-ecological zones rather than being all-inclusive in addressing the extant inefficiencies in the rice production systems of Ghana.

1. Introduction

Cereals are the most commonly consumed food staple in Ghana, among which the most widely cultivated are rice (Oryza sativa), maize, sorghum and millet. Of these crops, rice offers the best opportunity to swiftly boost food production and enhance food security. However, actual yields of rice have interminably lagged behind potentials over the years [1] due to low productivity on most rice farms. Rice ranks after maize as the second most germane food staple in Ghana, and its consumption is on the rise mainly due to growth in human population, changes in consumer preferences and urbanization [2]. Besides its relevance as a food staple in Ghana, rice production is an essential source of income in areas where it is cultivated [3], contributing about 55.09% to the overall income of households in these areas [4]. Rice consumption per capita in Ghana has consistently increased from 12.7 kg per annum in 1985 to 32 kg per annum in 2010 [1], and demand is projected to grow at a yearly compound rate of 11.80%, whilst that of maize at 2.60% between 2010 and 2015 [5]. This makes it imperative for farm-level performance of rice to be improved to meet the ever-increasing needs of the country. The crop has therefore featured prominently in most national policy documents due to its potentially crucial role for food security [6].
Although Ghana is well endowed with the requisite agronomic conditions for the continuous production of rice [7], the country’s potential has been underutilized mainly due to some structural and technical constraints, viz. poor agronomic practices, insufficient mechanization and low adoption of yield augmenting technologies, inter alia. These have resulted in farm-level inefficiencies within the rice production system. For instance, Ghana’s irrigable potential for rice cultivation is about 1.90 million hectares, yet only 0.46% of this potential is fully developed [8]. Thus, efforts geared towards identifying and addressing these sources of production inefficiencies may be very useful in enhancing the productivity of rice farms. The efficient use of available agricultural resources may significantly contribute to the sustainability and resilience of agricultural production systems and thus, enhance rice self-sufficiency in the country. Rice is cultivated in all the ten regions of Ghana under varying agro-ecological conditions. According to Abatania et al. [9], the location of a farm may influence the efficiency of farmers, because farm production, particularly in the developing world, largely depends on environmental factors. This assertion is also true for Ghana, where rice is cultivated under spatially disparate agro-ecological conditions. These agro-ecological variations in climatic conditions, soil type and natural vegetation cover of the different agro-climatic zones of Ghana may result in considerable output variations of farms in these zones. For instance, the forest savannah transition (FST) and guinea savannah (GS) zones are characterized by bimodal and unimodal rainfall regimes, respectively [1,10]. Additionally, the soils of the FST zone are loamy, well drained and rich in organic matter whilst those of the GS zone are low in organic matter and highly susceptible to erosion [11]. These differences have constrained the farmers in both zones to adopt diverse production technologies, which may befit their agro-climatic conditions. Results from an empirical study by Codjoe and Bilsborrow [10] reveal that, agricultural intensification, to wit, the use of tractors, labor, etc., are more prevalent in the FST zone than in the GS zone. This has been attributed to better soils, high levels of education, higher household incomes, and better on-and-off farm activities in the FST zone. Ekboir et al. [12] also note that despite the availability of tractor services in the GS zone, the use of traditional tools such as cutlasses, hoes, and animal-drawn implements is still common, while tractor use is relatively rife in the FST zone. These technological differences have undoubtedly led to output disparities in rice production in the two zones. Hence, formulating an all-inclusive policy for farms in both zones may not be useful for enhancing farm-level efficiency, and thus, rice productivity gains in these zones. This has motivated the need to determine the relative efficiency level of farms confronted by distinct agro-ecological constraints. This will abet the formulation of zone-specific policies aimed at productivity and efficiency improvement in these zones.
Several empirical studies on the efficiency of agricultural production in Ghana [13,14,15,16,17,18], indicate the importance researchers and policy makers have attached to efficiency improvement as a means for productivity enhancement. However, none of these studies empirically gauged the potential technology gaps that different production environments could impose on rice cultivation in the country. Comparable technical efficiencies and environmental-technology gaps permit locale-specific policies to be formulated for efficiency and productivity gains and these policies have become paramount for Ghanaian farms due to the varying impact of the production environment on agriculture production.

2. Materials and Methods

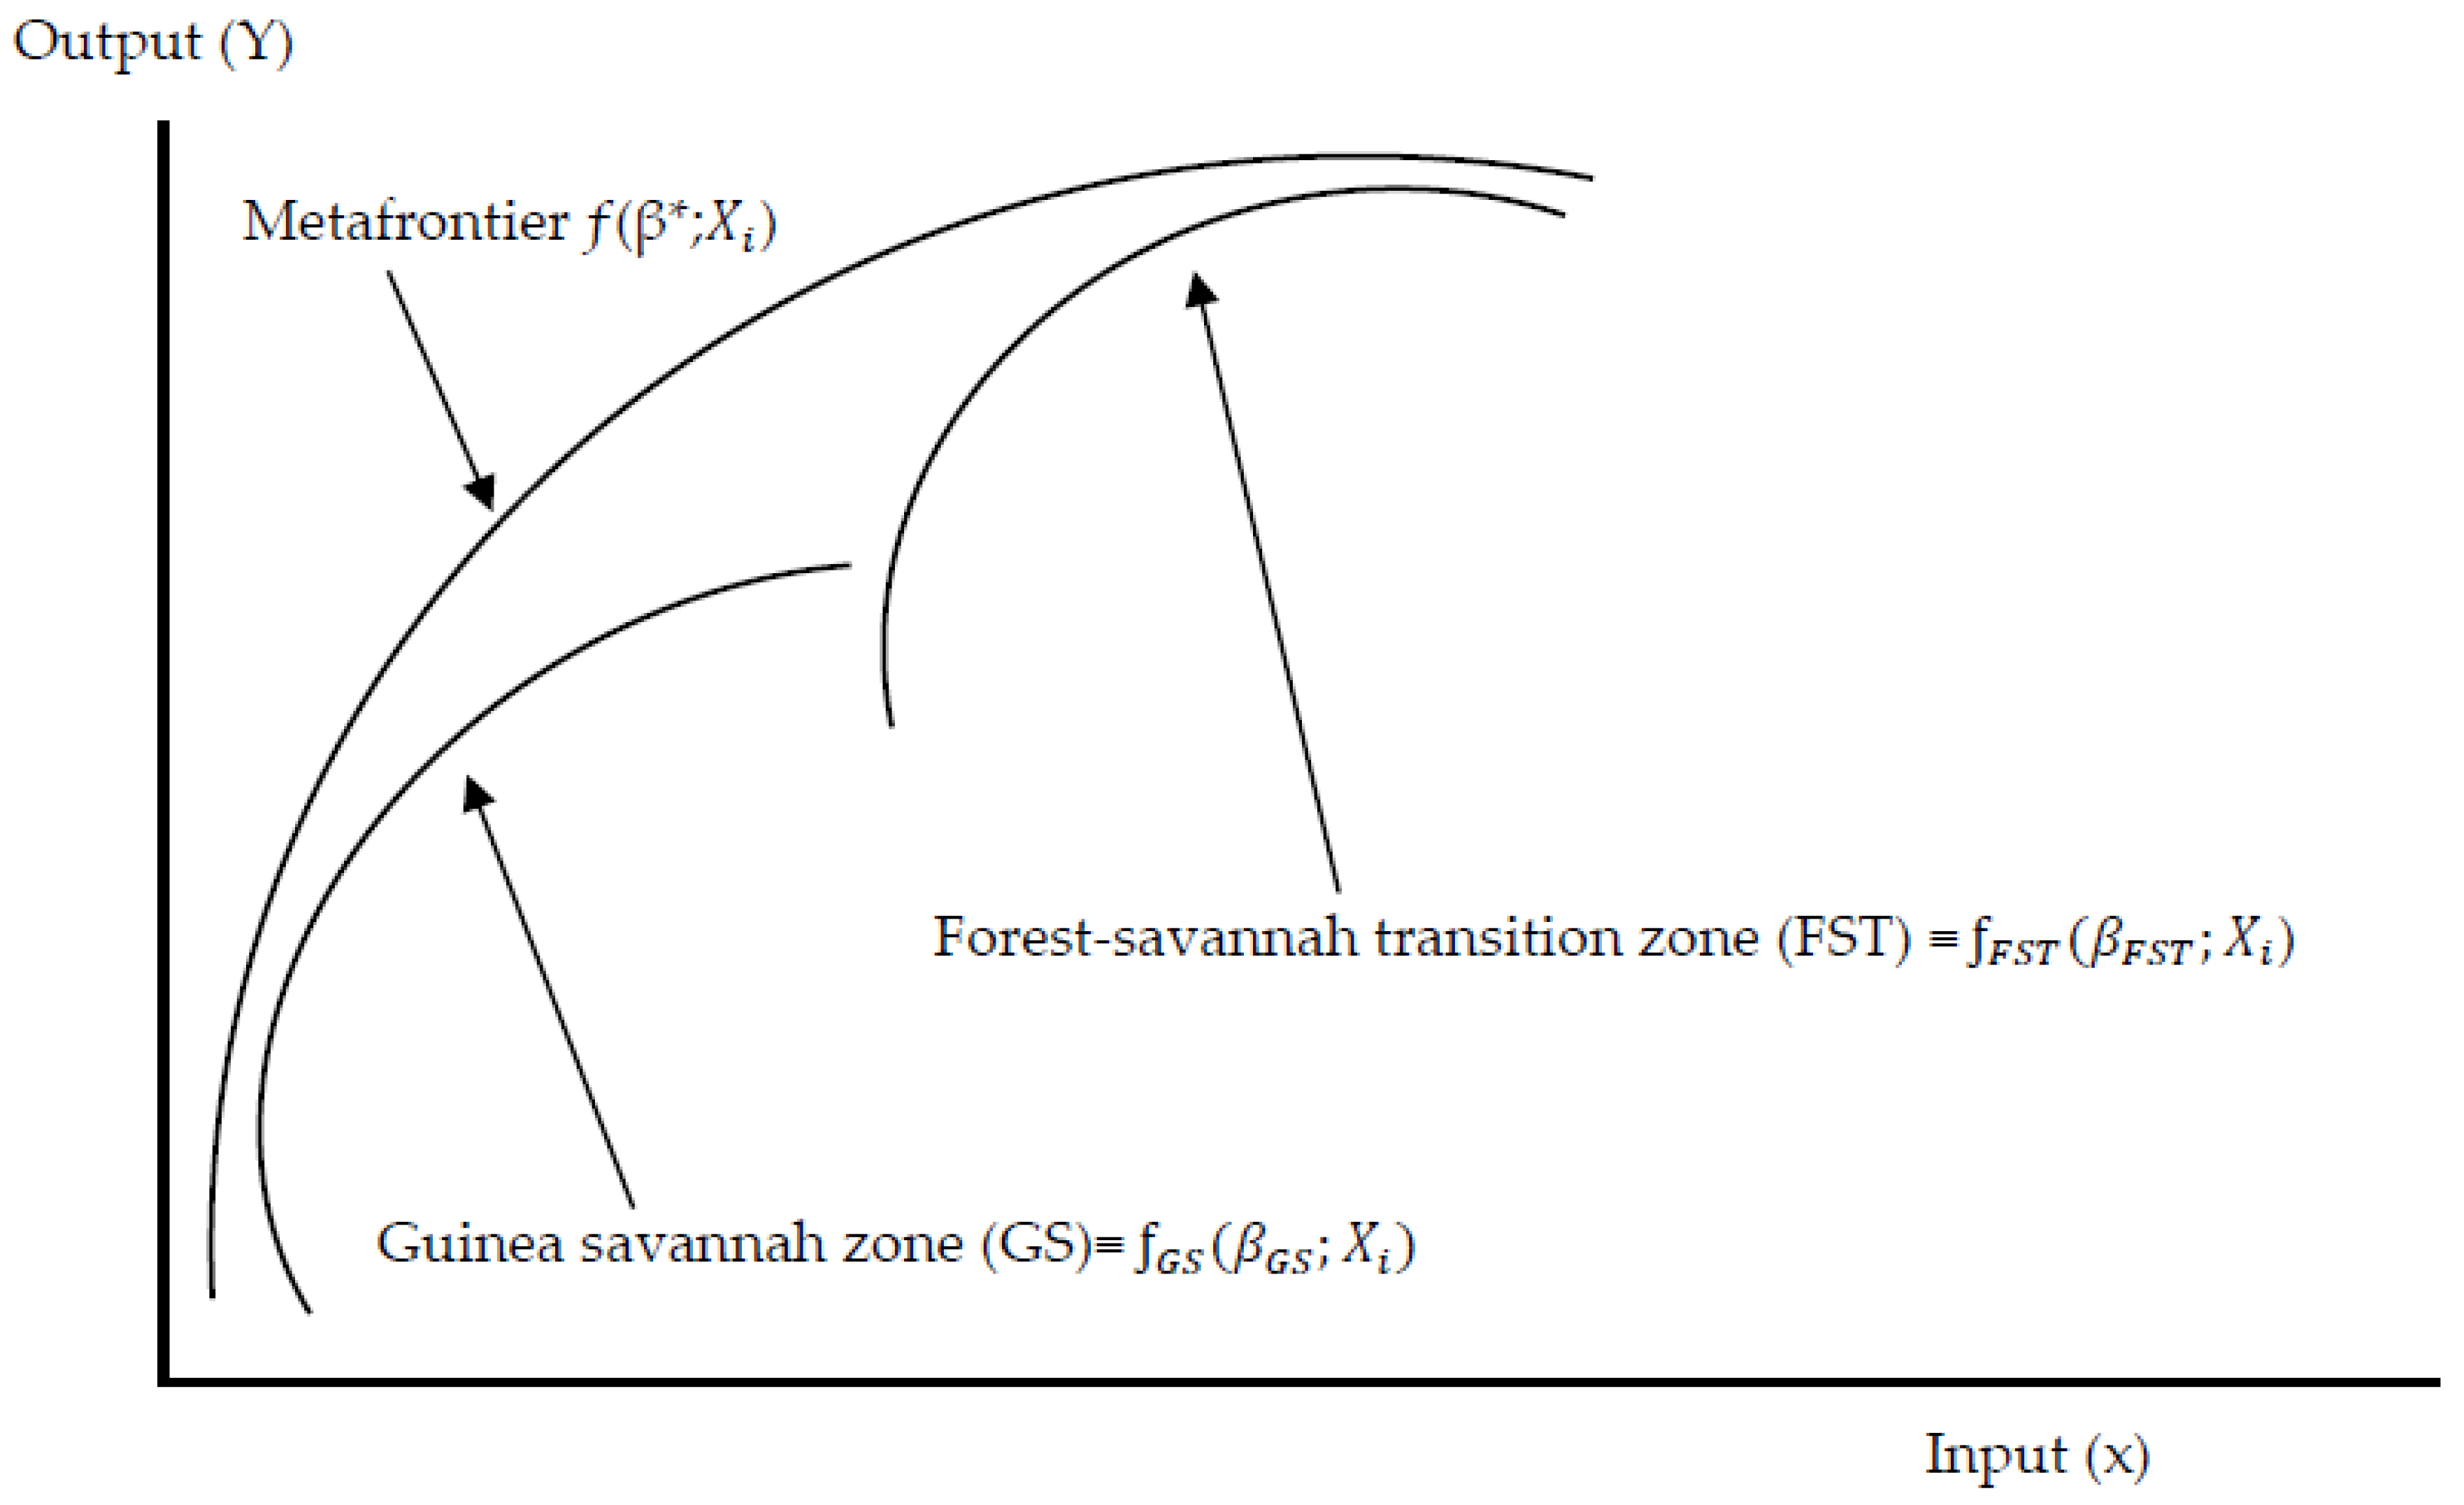
2.1. Theoretical Framework

Production frontier estimates for farms that operate under different production environments/technologies cannot be compared using the stochastic frontier framework. This is due to the inherent assumption that underpins the stochastic frontier estimation procedure that, the sampled farms operate under a similar production environment or use a homogeneous production technology [19]. Hence, assuming identical technology, when in reality they differ, may lead to technological differences being regarded as managerial inefficiencies. Against this backdrop, the stochastic metafrontier framework was introduced to allow technology gap effects to be distinguished from managerial inefficiency effects. Originally pioneered by Hayami [20] and Hayami and Ruttan [21], Battese et al. [19] and Battese and Rao [22] introduced the metafrontier framework as an extension of the stochastic frontier model to estimate the production efficiencies and technology gaps for farms that use different production technologies or operate under different agro-climatic conditions. The metafrontier is a boundary of unrestrained technology sets which envelops all the zonal frontiers, and the zonal frontiers are borders of restrained technology sets [22]. Conceptually, the metafrontier for the various agro-ecological zones is illustrated as in Figure 1.
Assuming there are g agro-ecological zones in the rice industry of Ghana; a standard stochastic frontier model for the gth zone is defined as in Equation (1):
Y i ( g ) = f ( X i ( g ) ; β ( g ) ) e v i ( g ) u i ( g ) e x i β ( g ) + v i ( g ) u i ( g )
where Y i ( g ) denotes the total rice produced by the ith farm in the gth zone, X i ( g ) represents farm inputs employed by the ith producer, β ( g ) denotes parameters yet to be estimated for each zone, f ( . ) represents a given production functional form, v i ( g ) is the random error term, which is independent of u i ( g ) and it is normally, identically, and independently distributed as N ( 0 , σ v i ( g ) 2 ) . u i ( g ) is the non-negative asymmetric error term which accounts for production inefficiency and it is considered to be truncated at zero of the N + ( µ i ( g ) , σ u i ( g ) 2 ) distributions such that µ i ( g ) is expressed by the farm-level inefficiency model as in [23].
µ i ( g ) =   Z i ( g ) δ
where Z i ( g ) denotes exogenous factors in the inefficiency model and δ is a vector of yet to be estimated parameters.
The stochastic metafrontier model for rice farms in the two agro-ecological zones is given by:
Y i * = f ( X i ; β * ) = e x i β *
where Y i * is the farm output defined by the metafrontier and β * denotes yet to be estimated parameters for the metafrontier function, which satisfies the condition that:
f ( X i ; β * ) f ( X g i ; β ( g ) )     for   all   g = 1 , 2
Equation (4) implies that the metafrontier is superior to all the zonal frontiers. The actual output produced by the ith rice farm defined by the stochastic frontier model for the gth zone in Equation (1) is stated in terms of the metafrontier model of Equation (3) as:
Y i = e u i ( g ) × e X i β ( g ) e X i β * × e X i β * + v i ( g )
where the term, e u i ( g ) measures the technical efficiency (TE) of the ith rice farm relative to the zonal frontier for the gth zone, and it is expressed as:
T E i ( g ) = Y i e X i β ( g ) + V i ( g ) = e u i ( g )
The second term of Equation (5), e X i β ( g ) e X i β * is what is referred to as technology gap ratio (TGR) (Battese and Rao [22]; Battese et al. [19]) or the meta-technology ratio (MTR) [24]. The TGR captures the gap in production technology and it is given by the ratio of the rice production technology available to a given zone relative to the technology available to the entire local rice industry. In this study, the term environmental-technology gap ratio (ETGR) as used by Boshrabadi et al. [25] and Mariano et al. [26] is adopted to accurately describe the restrictions imposed on the maximum attainable output by the production environment. The ETGR is expressed as:
E T G R i ( g ) = e X i β ( g ) e X i β *
According to Onumah et al. [27], the TGR measures the productivity potentials for a given zone relative to the maximum potential available in the entire industry. The ETGR has values ranging from zero to one. Farms with ETGR values close to one are operating closer to the best practice environmental meta-technology and values close to zero are the most distant.
The TE of the ith rice farm in the gth zone relative to the metafrontier (metafrontier TE) is denoted by T E i * and it is defined akin to Equation (6). It is given by the ratio of the actual output produced by the ith rice farm relative to the potential industrial output (i.e., the third term of Equation (5)), corrected for by adjusting the corresponding random error [19] and it is given by:
T E i * = Y i e X i β * + V i
Alternatively, the metafrontier TE can be expressed as:
T E i * =   T E i ( g )   ×   E T G R i ( g )
The metafrontier TE is the product of the TE with respect to each zonal frontier and the ETGR for that zone and its values also range from zero to one, ( 0 T E i * 1 ) .

2.2. Empirical Model Specification

Generally, the Cobb-Douglas and the translog production frontiers are the commonly used functional forms in the production frontier literature. Several empirical studies have employed the translog frontier [25,28,29,30,31,32], and have demonstrated that its estimates are better than those of the Cobb-Douglas. This study adopts the translog frontier after performing statistical tests on the significance of the squared and cross product terms of the explanatory variables. The adopted translog frontier is modified to account for zero usage of fertilizer by some rice farmers. This is done to avert biased coefficient estimates for the quantity of fertilizer used by some farmers [33]. The modified translog production function is stated in the following Equation (10):
l n Y i = β 0 + α D F i + n = 1 4 β n l n X n i + 1 2 n = 1 4 m = 1 4 β n m l n X n i l n X m i + ( v i u i )
where Y i is the amount of rice harvested by the ith rice farmer (in kilograms), β and α are coefficients yet to be estimated, D F i is a binary variable for the quantity of fertilizer used and it takes a value of 1 if the farmer uses fertilizer and 0 if otherwise, X 1 is the total quantity of labor used (in man-days), X 2 is the quantity of fertilizer used (in kilograms), X 3 is the acreage of land cultivated to rice (in hectares) and X 4 is the quantity of rice seed planted (in kilograms). v i and u i have their usual meanings.
Following Battese and Coelli [23], the model to explain the technical inefficiency effects of the sampled rice farms in the two zones could be specified as:
µ i = δ 0 +   j = 1 10 δ j Z j i
where Z 1 is a binary variable with a value of 1 if the rice farmer participated in any rice training program over the last two years and 0 if otherwise, Z 2 captures farmers’ primary source of information (knowledge) on advanced rice cultivation technologies, and it takes a value of 1 if the knowledge is acquired through own experimentation without assistance and 0 if through assistance from extension agents or neighboring farmers or the media, Z 3 denotes the construction of bunds around the rice fields and has a value of 1 if bunds are constructed around the rice farm and 0 if otherwise, Z 4 represents selling at the farm-gate which is used as a proxy for access to market and has a value of 1 if the farmer sells at the farm-gate and 0 if otherwise, Z 5 has a value of 1 if the farmer grows rice in a pure stand (rice monoculture) and 0 if otherwise, Z 6 is a dummy with a value of 1 if the land on which the farmer cultivates rice is owned by the farmer and 0 if otherwise, Z 7 measures the distance of the farm from the farmers’ homestead (in kilometres), Z 8 has a value of 1 if the farmer engages in off-farm wage earning activities and 0 if otherwise, Z 9 takes a value of 1 if the farmer uses certified rice varieties and 0 if otherwise, Z 10 measures the proportion of the household members who are literates and δ is a vector of yet to be estimated coefficients.
The variable for participation in rice training programs is assumed to have a positive effect on technical efficiency since such training programs are likely to equip beneficiary farmers with information on modern rice cultivation technologies [34]. Rice-producing households who acquire knowledge on improved rice production technologies through own experimentation are expected to produce with less efficiency than their counterparts who seek for assistance from extension agents or neighboring farmers. This is because, farm households who rely on their own experimentation may find it very difficult to adopt new technologies, and thus, may be less efficient [17]. The construction of bunds around rice farms is assumed to improve the efficiency of rice production across the two agro-ecological zones as bunds have the potential to retain water on the fields for use by the crops. Farm households with access to market are expected to be technically more efficient than those who do not have access to market. This is because, access to both input and output markets may enable farmers to acquire inputs for the cropping season and to further sell their farm produce in a timely manner [35]. Farm households in the study area who practice rice monoculture are likely to be more efficient than those who intercrop their rice fields as monoculture reduces undue competition among the crops [36]. All things being equal, it is assumed that farm families who cultivate their own farmlands are likely to be more efficient than those who cultivate on rented or shared farmlands. This is because, secured land owners are more likely to invest in long term productivity augmenting measures than their counterparts [14,37]. It is further expected that, farm households who reside farther away from their rice farms may be less efficient than their counterparts who stay closer to their fields. The farther away a farm is from the owner, the less likely that farmer will frequent the farm as one may have to trek over long distances before getting to the farm. Participation in off-farm wage earning activities could have either a positive or a negative effect on farm-level efficiency. Farm households who invest proceeds from their off-farm activities into their farm operations are expected to be more efficient than those who do not [14,38]. However, engagement in off-farm activities may also affect the quality of time devoted for essential farm operations such as technology adoption, which may affect crop yield [18,26]. It is further expected that farm households with access to improved rice varieties will be more efficient than those who do not use certified seed varieties [39]. This is because, improved rice varieties are expected to adapt to the agro-ecological zones under which they are cultivated. Finally, the higher the proportion of literate household members, the more efficient a rice-producing household is expected to be and vice versa. This is because, education has the potential to sharpen the decision-making abilities of farmers and further empower them to effectively utilize information on farm inputs [40].

2.3. Test of Hypotheses

A number of hypotheses are examined to determine the adequacy of the adopted models, the existence of inefficiency effects and the influence of socio-economic and farm-related characteristics on the inefficiency level of the sampled farms. The null hypotheses are: (1) H 0 : β nm = 0 , the second-order parameters of the translog models are zero; (2) H 0 :   γ = 0 , production inefficiency effects are non-stochastic; (3) H 0 : γ = δ 0 = δ 1 = δ 2 = , ,   = δ 10 = 0 , farm-level inefficiency effects are absent from the models at all levels; (4) H 0 :   f F S T ( X ; β F S T ) = f G S ( X ; β G S ) , the two agro-ecological conditions (production environments) are similar and hence do not require the metafrontier model specification.
The generalized likelihood-ratio statistic; L R = 2 [ In { L ( H 0 ) In { L ( H 1 ) ] , is used to validate these hypotheses, where L ( H 0 ) and L ( H 1 ) denote the likelihood function values for the null ( H 0 ) and alternate ( H 1 ) hypotheses, respectively. Approximately, L R has a Chi-square (or mixed Chi-square) distribution if the tested null hypothesis is true, with a degree of freedom equal to the number of restrictions imposed under the null hypothesis. All critical values can be derived from the appropriate Chi-square distribution [41]. Nonetheless, if the test of hypothesis involves γ = 0 , then the asymptotic distribution necessitates the mixed Chi-square distribution [42].

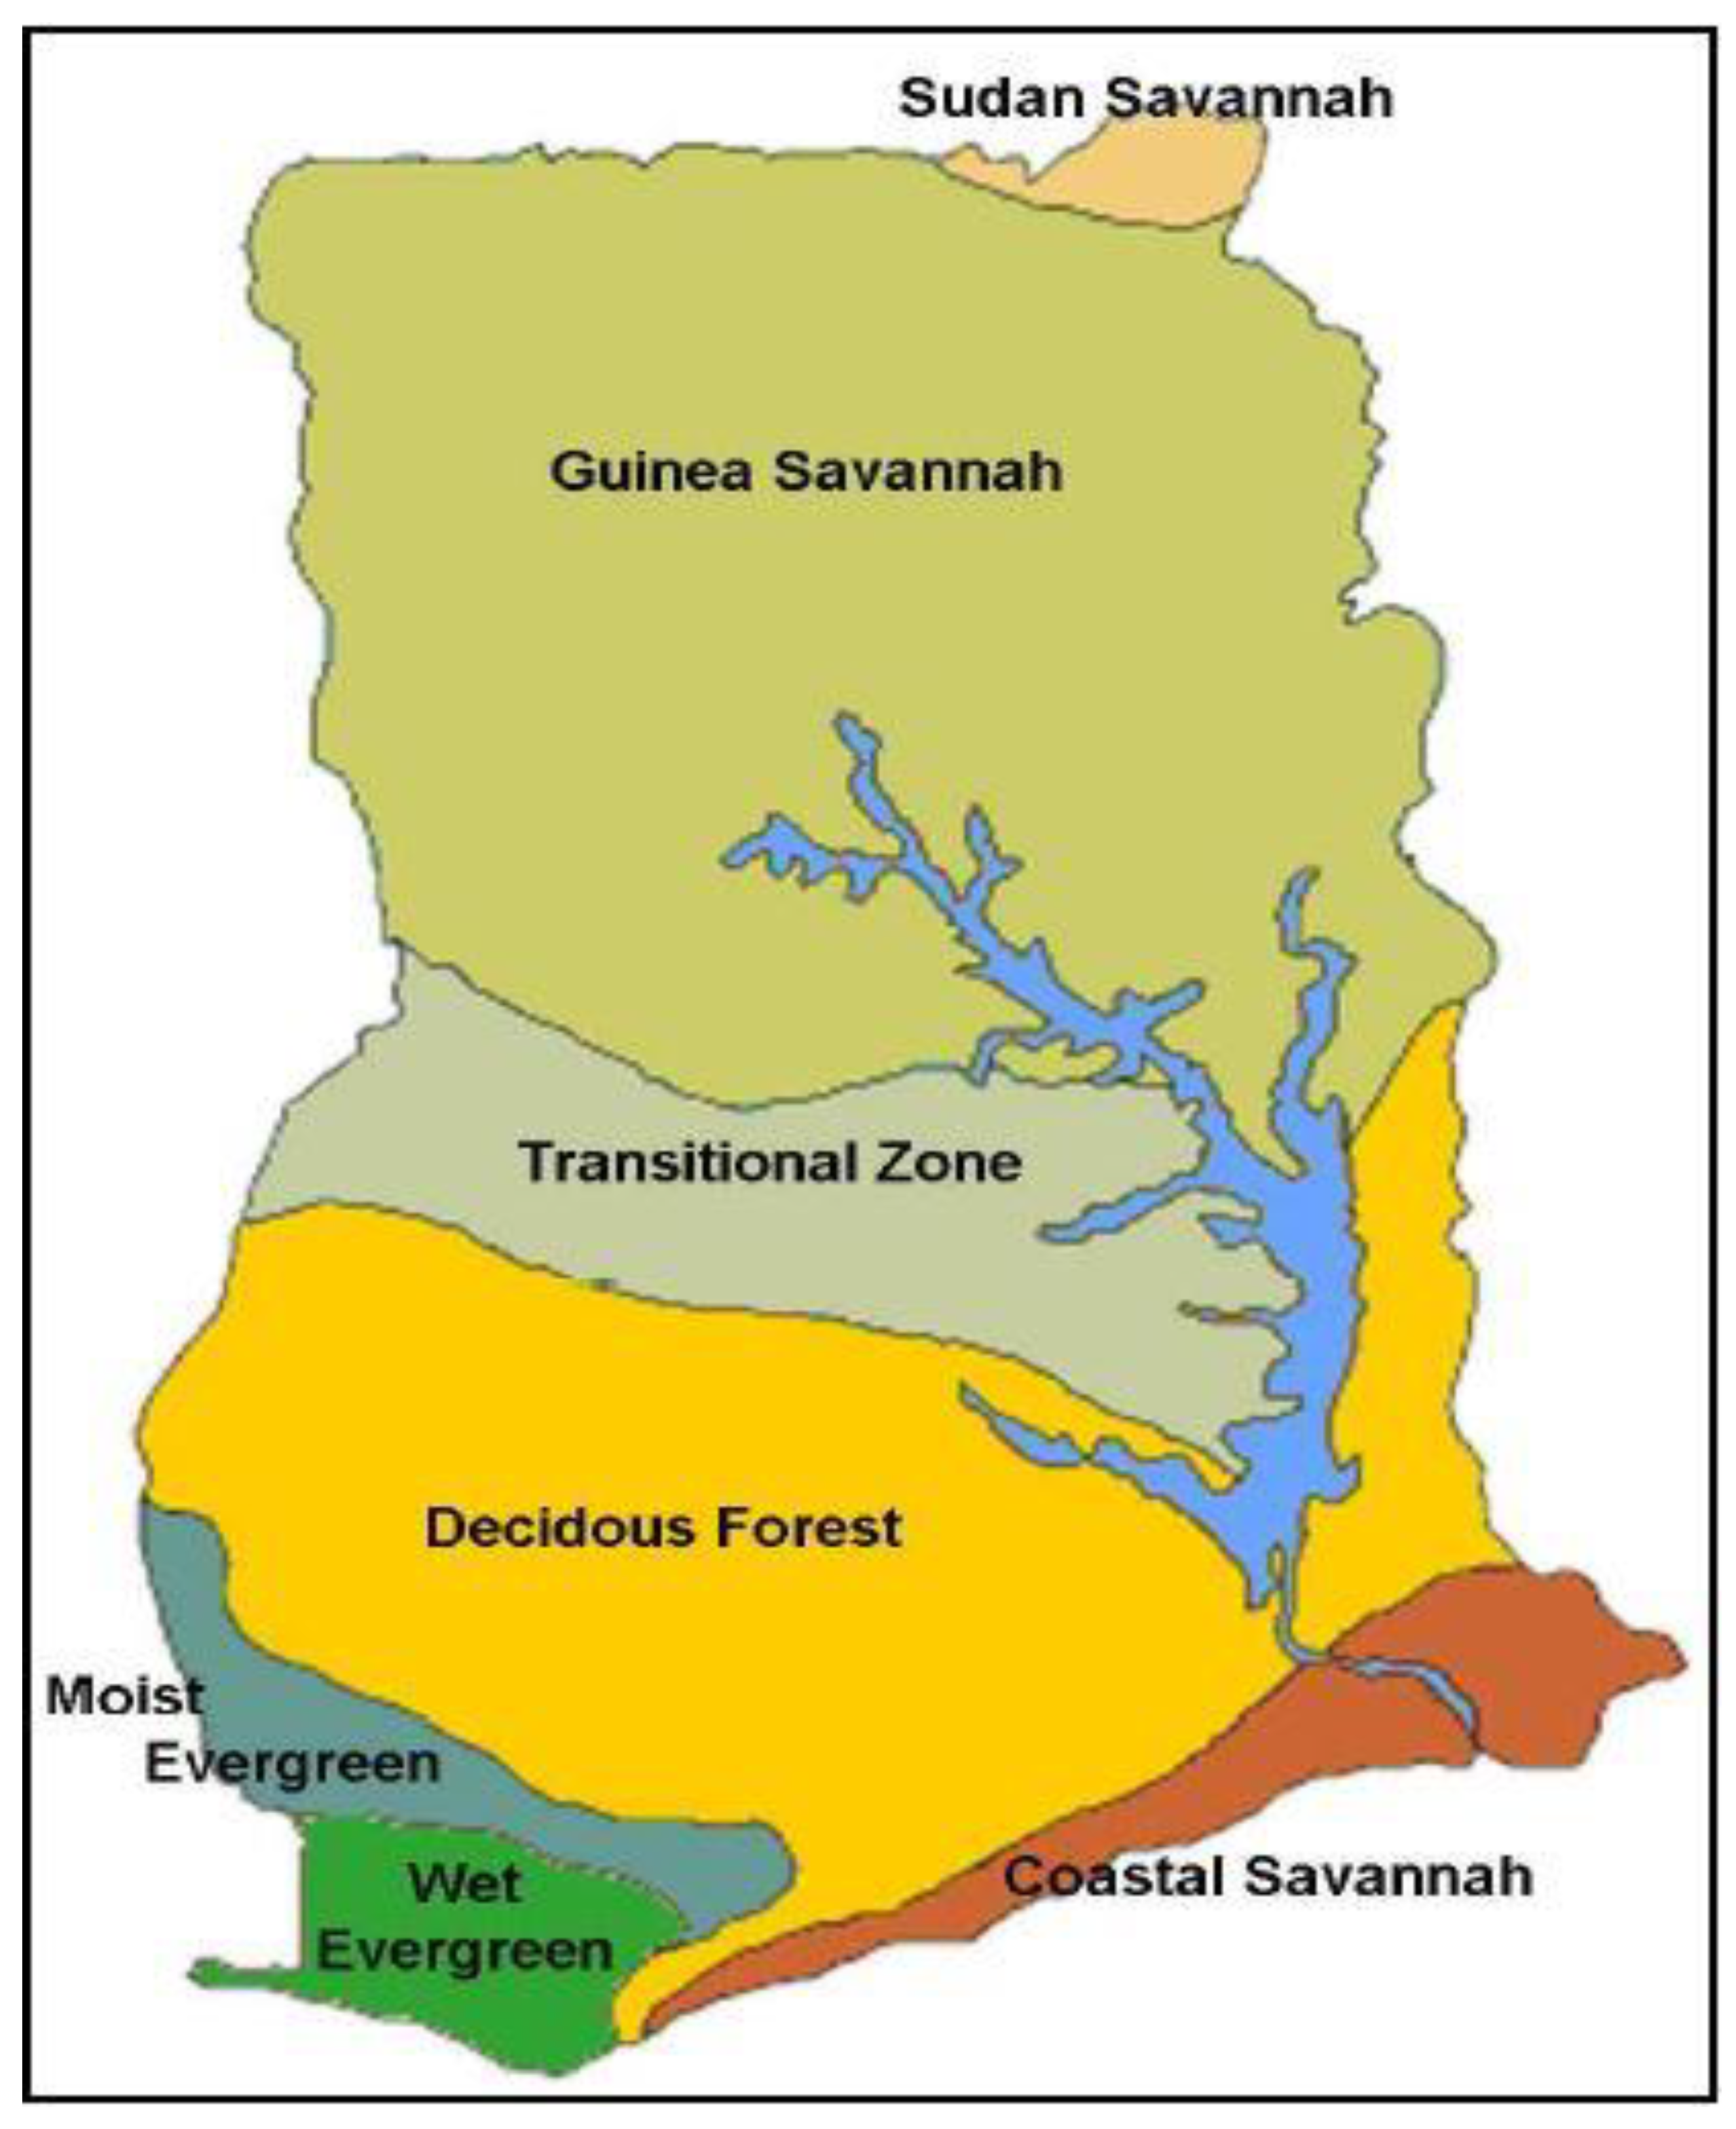
2.4. Study Area and Data Sources

Ghana is categorized into six distinct agro-ecological zones based on the climatic conditions and the soil types. These are the Guinea savannah zone, Forest-savannah transition zone, Semi-deciduous forest zone, Sudan savannah zone, Coastal savannah zone and the Rain forest zone (moist and wet evergreen) [43]. The forest, transitional and coastal zones are characterized by two rainfall regimes, which ensures crop production in two seasons while the savannah zones have one rainfall regime, allowing for crop production in a single season [1]. Just like maize, rice is cultivated in all the six agro-ecological zones of the country [43]. The differences in the climatic conditions, soil types and natural vegetation cover of the various zones have varying effects on the productivity of crops grown in these zones. This study was conducted in the FST and GS zones of Ghana. The FST zone has a total land area of 8400 km2 and a mean rainfall of 1300 mm. The major and minor raining seasons occur between March-July and September-October of each year, respectively [43]. The GS zone however has a total land area of 147,900 km2 and a mean rainfall of 1000 mm. The unimodal rainfall regime of the GS zone occurs between May-September each year [43]. Predominantly, the people in these two zones depend on agriculture and its related activities for livelihood. This study is based on primary data collected from a cross-section of rice-producing households in the two zones. Sampling begun with the listing of the communities known for rice production in both zones. A random sample of 82 communities were selected from the list of available communities, out of which 10 rice-producing households were randomly selected based on the lists provided by the assembly members of each selected community. This led to a sample size of 820 households, however data cleaning resulted in 768 households, which were used for the study. This consists of 314 and 454 rice-producing households from the FST and GS zones respectively. Relevant data was gathered on the socio-economic characteristics of the selected households, farm-level as well as environmental conditions. (see Figure 2).

3. Results and Discussion

3.1. Hypotheses Tested

Table 1 displays the results of the tested hypotheses. All the tested hypotheses are rejected at the 1% significance level in all models. The rejection of the first null hypothesis indicates that, the translog function passably represent the dataset, and its estimates are more efficient than those of the Cobb-Douglas function. A rejection of the second null hypothesis implies that, instead of the conventional average response function, the stochastic production frontier estimates sufficiently represent the data. By rejecting the third null hypothesis, the study confirms the presence of production inefficiency effects in all the models. The last null hypothesis that, the two agro-ecological conditions (production environments) are similar, and hence do not require the metafrontier model specification, is also rejected. This implies that rice farms in both agro-ecological zones operate under heterogeneous environmental conditions using different production technologies. Thus, any efficiency study across the two agro-ecologies should adopt the metafrontier framework as the most appropriate estimation technique.

3.2. Estimates of the Stochastic Frontier Production Function

The estimated returns to scale is 0.67 and 0.82 for farms in the FST and GS zones respectively, indicating decreasing returns to scale (DRS). This suggests that, by increasing all factor inputs by 1% in each zone, total farm output will increase by 0.67% and 0.82% in the FST and GS zones, respectively. The respective gamma estimates of 0.86 and 0.32 for the FST and GS zones imply that, for farms in the FST zone, poor agronomic practices largely contribute to farmers’ failure to operate on their zonal frontier whilst in the GS zone, external shocks prevailing in the production environment mainly inhibit the farmers from operating on their zonal frontier. These shocks may include floods, droughts, infestation of pests and diseases and bushfires, etc., which are more prevalent in the GS zone due to the severe impact of climate change on farm production in that zone [45].
The production frontier estimates for the sampled rice farms in both zones and for the pooled dataset are presented in Table 2 and are discussed in terms of output elasticities with respect to the captured factor inputs. The results reveal that total rice produced responded positively to farm labor in both zones but this is only significant in the GS zone. The results show that farm labor is more productive in the GS zone than in the FST zone. This could be ascribed to the efficient use of available labor in the GS zone due to the paucity of farm labor in that zone, which arises from the out-migration of the youth in search of jobs in other parts of the country [10,28]. However, the influx of migrants in the FST zone in search of work [10] may result in the abundance of cheap labor which farmers may overuse, resulting in declining marginal returns on labor use in that zone.
Surprisingly, the quantity of seed planted by the farmers in both zones is insignificant. This implies that rice cultivation across both zones is unaffected by the quantum of rice seed planted by the farmers. This could be ascribed to the excessive recycling of the harvested rice grains as seeds for planting [46], which may result from the relatively low adoption rates of improved rice varieties among the farmers [46,47]. Farmers continue to retain harvested grains as seeds due to their inability to access or afford the improved seed varieties [46]. Programs aimed at exposing farmers to improved seed varieties and subsequently make such seeds readily available, affordable and accessible to farmers in both zones will significantly enhance rice output in the country.
Land size has the largest impact on overall farm output and it is significantly positive in both zones. This illustrates the relative contribution of land to total rice produced in both zones compared to all the other farm inputs. This finding is consistent with Nkegbe [48], who found land to be the most productive factor input for crop cultivation in northern Ghana. It is evident that land use for rice cultivation is more intense in the FST zone than in the GS zone. This stems from the low fertility status of farmlands in the drought-prone GS zone relative to that of the FST zone [11,45]. Additionally, the decline in land frontiers in the FST zone at the expense of real estate developments may coerce farmers to intensify production activities on their limited farmlands. Measures geared towards enhancing easy access to farmlands for rice cultivation could significantly augment total rice output in both zones.
The results further show that the quantity of fertilizer used by the farmers increases total farm output in both zones significantly. This implies that farmers in both zones who use more fertilizer produce more output. However, fertilizer use is more intensified in the GS zone than in the FST zone. The porous nature of the soils in the GS zone is likely to drive the famers in that zone to invest more in fertilizers compared to their FST zone counterparts who may be complacent since their lands are more fertile and thus, may not be willing to invest in more fertilizers [12]. Furthermore, the fertilizer subsidy program of the country may have also contributed to this finding because the window of the policy coincides with the farming season in the GS zone. This finding accentuates the need for government to improve and expand the fertilizer subsidy program across the various agro-ecological zones of the country, which is aimed at enhancing farmers’ access to fertilizer at subsidized prices.

3.3. TE and ETGR

The distribution of the various TE, ETGR, and the metafrontier TE scores are shown in Table 3. The TE estimates vary enormously among the analyzed farms. Mean TE scores of 0.59 and 0.83 are obtained for farms in the FST and GS zones, respectively. These mean scores indicate that relative to their zone-specific frontiers, farms in the FST and GS zones produce about 59% and 83% of their zonal frontier outputs respectively. This further implies that, in order to be fully efficient with respect to their zone-specific frontiers, farms in the FST and GS zones need to scale up their production by 41% and 17%, respectively, without using additional resources. These gains are feasible in both zones if extant resource endowments and available technology are used more efficiently. These mean estimates do not suggest that farms in the GS zone have higher farm-level performance on average than their FST zone counterparts. This is because these average TE scores are only comparable if it is established that rice farms in both zones adopt identical production technology [19]. However, the rejection of the null hypothesis of a homogenous production technology implies that the metafrontier scores are required in order to determine the level of technological heterogeneity among the farms in the two zones.
The ETGR scores vary from 0.31 to a maximum of 1.00, having a mean of 0.95 for farms in the FST zone, and from 0.01 to 1.00, with a mean of 0.50 for farms in the GS zone. An estimated ETGR value close to 1 denotes a smaller technology gap between the zonal frontier and the metafrontier. These mean scores suggest that, on average, farm families in the FST zone produce 95% of the maximum attainable industrial output relative to their GS zone counterparts who produce only 50% of that output. This further implies that farms in the FST zone are 45% more productive than their counterparts in the GS zone. This may stem from the conducive production environment [49] and access to advanced production technologies by farms in the FST zone compared to their GS zone counterparts [10]. It is evident from these findings that, although farms in the GS zone appear closer to their zone-specific frontier than their FST zone counterparts, the frontier defined for farms in the GS zone is comparatively lower than that defined for farms in FST zone. Thus, the farms in the GS zone are operating on a lower production possibility frontier relative to their FST zone counterparts. The huge ETGR (0.50), which characterizes rice cultivation in the GS zone could be attributed to constraints imposed by the production environment (restrictions outside the control of the farmers), which impede farmers’ access to and use of modern rice cultivation technologies that are available in the local rice sector [24]. This finding corroborates our earlier result that most (68%) of the shortfalls of actual output from the attainable frontier output in the GS zone is ascribable to causes outside the immediate control of the farmers. Nonetheless, it is evident from the results that, there are certain farms in the GS zone with an estimated ETGR of 1.00. This suggests that these farms are equipped with the right technology sets and managerial prowess and thus, are able to achieve the industrial output defined by the metafrontier. These farms should swiftly be identified and used to disseminate these advanced rice cultivation technologies to other farmers in that zone to enable them bridge the existing technology gaps associated with their production operations. This can be done through the creation of a common platform where technical knowledge on rice cultivation can be exchanged among farmers in the GS zone. This common platform could take the form of producer association meetings or regular TV and radio programs where some of these identified elite farmers are made hosts. Evidence of the existence of substantial ETGR of at most 0.69 (1.00–0.31) is recorded among farm households in the FST zone, despite the favorable environmental conditions and the technological advantage of that zone. These results reveal that substantial opportunities exist for farm households in both zones to significantly increase total farm output by addressing the various sources of production inefficiency.
The mean metafrontier TE score is estimated to be 0.56 and 0.42 for farms in the FST and GS zones, respectively. These estimates allow for the TE scores for farms in both zones to be compared [22]. These mean scores show how wrong our conclusion would have been if it was based on the zone-specific TE scores. By obtaining the mean zone-specific frontier estimates of 0.83 and 0.59 for farms in the GS and FST zones respectively, we would have concluded that farms in the GS zone are performing better than their FST zone counterparts. However, by comparing the average farm performance of both zones relative to the best practice industrial frontier, we realized that the frontier defined for farms in the FST zone is superior to that defined for farms in the GS zone. Consequently, the farms in the FST zone are technically more efficient in their production operations than their counterparts in the GS zone.

3.4. Farm-Level Inefficiency Determinants

The coefficient estimates for the exogenous factors in the inefficiency models are displayed in Table 4. Consistent with expectation, participation in rice training programs potentially attenuate farm-level inefficiency significantly. This may be due to the important role such training programs play in improving the technical knowledge and managerial skills of the farmers. By participating in rice training programs, farmers are exposed to modern rice cultivation technologies, which enhance their odds of adoption. This may shift the production frontier of the beneficiary farmers outward. An akin result was reported by Mariano et al. [26], that participation in rice training programs enhances rice production efficiency. The provision of frequent and effective training programs may equip farmers with the right technical knowledge and agronomic practices needed to boost rice production in Ghana.
Farmers who rely solely on their experience and expertise for farm operations could produce with less efficiency than those who seek for assistance. This is because, farm families who seek for assistance may be furnished with up-to-date information on contemporary technologies and improved agronomic practices. This may increase their likelihood of adopting such technologies and practices, thereby enhancing their production efficiency. However, farmers who rely mostly on their own expertise may have lower tendencies of adopting new technologies and advanced agronomic practices, and thus, are more likely to cling onto their outdated agricultural practices, which may lower their efficiency. This finding assents to Onumah et al. [27] and Binam et al. [30]. Farm families are advised by the study to desist from being complacent and rather augment their knowledge with support services provided by extension agents.
Contrary to expectations, farm households who construct bunds around their rice plots potentially operate with less efficiency than those who do not. Although bunds may help to retain water on rice fields, farms with bunds require additional labor inputs for every operation and failure to meet these labor needs may translate into poor management of the bunds, which may eventually reduce farm output significantly. A divergent view was espoused by Becker and Johnson [50], who established that bund construction can boost rice output in West Africa. The implication of this finding is that labor market regulations, which seek to make farm labor readily available, accessible and affordable to rice farmers should be enforced, through negotiations among the relevant stakeholders.
As expected, the results further reveal that market access could enhance farm-level efficiency in both zones. This is because, access to a reliable input market may ensure seasonable procurement of farm inputs for the production season. This is germane particularly in the GS zone where climate change has significantly influenced the onset of the production season and rainfall patterns are irregular. Additionally, farmers in their bid to earn more income may be motivated to produce more output when assured of a reliable produce market where they can easily sell their produce. This finding accedes to that of Otieno et al. [51]. This calls for the provision of a well-functioning market system in rice farming communities to ensure timely acquisition of farm inputs by smallholders, and guaranteed prices for farm produce.
Consistent with expectation, farm households in both zones who practice rice monoculture potentially operate with higher production efficiency than those who intercrop. This may be due to the fact that besides the ease of crop management, monoculture reduces undue competition for sunlight and essential soil nutrients among the crops leading to increased output. The same result was reported by Khai and Yabe [52] in their study. The study therefore advises farmers to continue with the practice since it has the potential to enhance their TE levels.
The findings further reveal that farm ownership could reduce farm-level inefficiency in the FST zone but enhance inefficiency in the GS zone. This may be ascribed to the scarcity of land resources in the FST zone, which compels secured landowners to invest in productivity augmenting practices [15] relative to their unsecured counterparts who are more likely to relocate if the productivity of their farmlands decline. However, secured landowners in the GS zone may not have the incentive to invest in yield augmenting measures due to the abundance of arable lands in that zone, which enables the farmers to move to new or fallowed lands where the fertility of the soil is relatively good. A redefinition of tenure securities in the FST zone to ensure easy access to farmlands for rice cultivation could stimulate investment in productivity enhancing measures to boost farm-level efficiency.
In line with expectation, farmers who reside farther away from their rice farms potentially operate with less efficiency than those who live closer to their farms in both zones, but this is only significant in the GS zone. This could be due to the long hours farmers may have to trek before getting to their farms and the fact that they are likely to be tired upon reaching the farm, and hence, may not be able to work efficiently and effectively. The long distance may also serve as a disincentive for farmers, farm laborers and extension agents to regularly visit the farm and supervision of such farms become arduous, leading to low yield. This is expected in the GS zone, where the search for fertile farmlands is likely to make farmers operate on spatially dispersed farmlands which may be farther away from their residence. According to Tan et al. [32], substantial gains in TE can be achieved if travel time to spatially scattered farmlands are reduced.
Farm households in both zones who partake in off-farm wage earning activities may operate with less efficiency than those who do not engage in such activities. A plausible explanation could be that expressed by Abdulai and Eberlin [53] that, in order to participate in off-farm work, farmers may have to cede part of their working hours required for essential farm operations. This may prevent the farmers from carrying-out the right agronomic practices which may translate into higher output. Farm families in both zones are advised by the study to invest their time and financial resources into their farm operations to boost their farm-level efficiency.
Access to improved rice varieties could lessen production inefficiency in the FST zone but surprisingly increase inefficiency in the GS zone. This could be attributed to the favorable vegetative and climatic conditions of the FST zone [49] and the ability of the improved seeds to easily adapt to the environmental conditions of that zone. This could increase rice production efficiency in the FST zone. However, for farms in the GS zone, this could be ascribed to the low fertility status of the soils [45], coupled with the harsh climatic conditions and the immoderate recycling of the harvested rice grains as seeds [46], due to lack of access to and the high cost of improved seeds. Farmers are also likely to regard the recycled rice grains as improved seeds since they have been retained from the improved harvested grains. The inability of the recycled seeds to withstand the harsh climatic conditions of the various agro-ecological zones may result in low rice output. According to Villano et al. [29] and Mariano et al. [26], access to improved rice seeds enhance production efficiency. Policy interventions geared towards enhancing farmers’ access to improved seeds and measures targeted at improving the production environment for farmers in the GS zone may be very useful in improving rice production efficiency.

4. Conclusions

This paper adopts the metafrontier framework to compute comparable technical efficiency estimates and the environmental-technology gaps for farm households in the FST and GS agro-ecological zones of Ghana. The aims are to identify the potential sources of production shortfalls in both zones and to formulate zone-specific policies for farm-level efficiency and productivity gains. Contrary to what has been purported by some past efficiency studies in Ghana, the empirical results reveal that rice farms in the two zones adopt heterogeneous production technologies in their farm operations. This emanates from the differences in the production environment of the two zones, indicating that the metafrontier framework is the most appropriate methodology for evaluating the efficiency and productivity of farm households across the two zones. Although farms in both zones exhibit DRS, farm-level productivity is mainly driven by land and fertilizer in the FST zone and by land, fertilizer and labor in the GS zone.
The TE scores reveal that farms in both zones are operating beneath their feasible zonal frontiers, and thus, there is the need for them to scale up their farm-level performance. These gains are attainable if current resource endowment and technology sets are used more efficiently. The ETGR estimates demonstrate that rice farms in the FST zone are operating on a superior frontier relative to that of their counterparts in the GS zone. This stems from the favorable environmental conditions and the technological advantage of this group over their counterparts. Although farms in the FST zone are equipped with the existing technologies of the local rice sector, these technologies are not being used optimally by all the farmers. This has led to substantial ETGR for certain farms, which consequently is the primary source of output shortfall in the FST zone. In the GS zone however, rice production is seriously challenged by the enormous ETGR, which results from the severe impact of climate change on farm operations and the low usage of advanced rice cultivation technologies in that zone. This is the main source of output shortfall in the GS zone. It is however worth noting that, certain farms in the GS zone are able to attain the industrial output defined by the metafrontier and thus, it is possible for all farms in that zone to operate on the industrial frontier. These findings reveal the enormous prospects that exist for farm households in both agro-ecological zones to boost their farm-level performance significantly through technological advancement for farms in the GS zone and improvement in the managerial skills for farmers in the FST zone.
Finally, our farm-level inefficiency estimates suggest that interventions aimed at efficiency improvement in the FST zone should be targeted at enhancing farmers’ access to relevant rice training programs and advisory services rendered by extension agents, which could constantly update the know-how of the farmers. Additionally, farmers’ access to input and output markets, certified seed varieties, and the ease of land ownership should be enhanced. In the GS zone, interventions such as improving farmers’ access to markets and improved rice varieties that can withstand the harsh climatic conditions of that zone will be very helpful. Additionally, measures targeted at improving the production environment of the GS zone should be pursued. Such measures should include resourcing national research institutions such as the Crops Research Institute, Soil Research Institute, the Savannah Accelerated Research Institute and the Agricultural Research Centres of the various universities in Ghana to develop rice varieties that can withstand the agro-climatic conditions of the GS zone. Enhancing farmers’ access to good road networks to facilitate timely transportation of farm inputs to the far-flung areas of the GS zone, and other interventions geared towards reviving the fertility status of the soils could significantly augment rice production efficiency in the GS zone.

Author Contributions

Conceptualization, J.A.; Data curation, J.A. and A.N.W.; Formal analysis, J.A.; Funding acquisition, J.A. and A.N.W. Methodology, J.A.; Software, E.E.O.; Supervision, A.N.W., K.S. and E.E.O.; Writing—original draft, J.A.; Writing—review & editing, J.A., A.N.W., K.S. and E.E.O.

Funding

Financial support for this study was provided by the German Academic Exchange Service (DAAD), Germany, the Council for Scientific and Industrial Research (CSIR-SARI), Ghana, the Africa Rice Center, Benin, and USAID provided technical support. The APC was partly funded by the Humboldt-Universität zu Berlin, Germany.

Conflicts of Interest

The authors declare no conflict of interest.

References

  1. Ministry of Food and Agriculture (MoFA). Agriculture in Ghana: Facts and Figures, 2015; Annual Report by the Statistics, Research and Information Directorate (SRID), MoFA, as Part of MoFA’s Policy Planning, Monitoring and Evaluation Activities; Ministry of Food and Agriculture: Accra, Ghana, 2016.
  2. Ministry of Food and Agriculture (MoFA). National Rice Development Strategy-Draft; A Draft Report of the Ministry of Food and Agriculture; Ministry of Food and Agriculture: Accra, Ghana, 2009.
  3. Asuming-Brempong, S.; Osei-Asare, Y.B. Has imported rice crowded-out domestic rice production in Ghana? What has been the role of policy? In Proceedings of the Second International Conference of African Association of Agricultural Economists, Accra, Ghana, 20–22 August 2007. [Google Scholar]
  4. Wiredu, A.N.; Asante, B.O.; Martey, E.; Diagne, A.; Dogbe, W. Impact of NERICA adoption on incomes of rice-producing households in northern Ghana. J. Sustain. Dev. 2014, 7, 167–178. [Google Scholar] [CrossRef]
  5. Millennium Development Authority (MiDA). Investment Opportunity in Ghana: Maize, Soya and Rice. Millennium Development Authority in Conjunction with the United States Millennium Challenge Corporation. 2010. Available online: https://assets.mcc.gov/investmentopps/bom-ghana-english-grain.pdf (accessed on 15 November 2016).
  6. Ragasa, C.; Dankyi, A.; Acheampong, P.; Wiredu, A.N.; Chapoto, A.; Asamoah, M.; Tripp, R. Patterns of Adoption of Improved Rice Technologies in Ghana; Working Paper 35; International Food Policy Research Institute (IFPRI): Washington DC, USA, 2013. [Google Scholar]
  7. Asuming-Brempong, S. Profitability, Competitiveness and Welfare Effects of Trade Liberalization on the Rice Sub-Sector in Ghana. In Structural Adjustment and Agriculture in West Africa; Tchikala, T., Ed.; COPESRIA Book Series: Dakar, Senegal, 1998; pp. 276–298. [Google Scholar]
  8. Kula, O.; Dormon, E. Global Food Security Response: Ghana Rice Study; A Micro-Report for Review; United States Agency for International Development (USAID): New York, NY, USA, 2009. Available online: http://www.fao.org/sustainable-food-value-chains/library/details/en/c/274717/ (accessed on 15 June 2017).
  9. Abatania, L.N.; Hailu, A.; Mugera, W.A. Analysis of farm household technical efficiency in Northern Ghana using bootstrap DEA. In Proceedings of the 56th Annual Conference of the Australian Agricultural and Resource Economics Society, The Esplanade Hotel, Fremantle, WA, USA, 7–10 February 2012. [Google Scholar]
  10. Codjoe, A.S.N.; Bilsborrow, E.R. Population and agriculture in the dry and derived savannah zones of Ghana. Popul. Environ. 2011, 33, 80–107. [Google Scholar] [CrossRef]
  11. Oppong-Anane, K. Country Pasture/Forage Resource Profiles: Ghana; Food and Agriculture Organization of the United Nations (FAO): Rome, Italy, 2006; Available online: http://www.fao.org/ag/agp/agpc/doc/counprof/PDF%20files/Ghana-English.pdf (accessed on 20 December 2017).
  12. Ekboir, J.; Boa, K.; Dankyi, A.A. Impact of No-Till Technologies in Ghana; CIMMYT Economic Program Paper; International Maize and Wheat Improvement Center: Texcoco, Mexico, 2002. [Google Scholar]
  13. Anang, B.T.; Bäckman, S.; Sipiläinen, T. Technical efficiency and its determinants in smallholder rice production in northern Ghana. J. Dev. Areas 2016, 50, 311–328. [Google Scholar] [CrossRef]
  14. Villano, R.; Asante, B.O.; Bravo-Ureta, B. Farming systems and productivity gaps: Opportunities for improving smallholder performance in the forest-savannah transition zone of Ghana. Land Use Policy 2019, 82, 220–227. [Google Scholar]
  15. Donkor, E.; Owusu, V. Effects of land tenure systems on resource-use productivity and efficiency in Ghana’s rice industry. Afr. J. Agric. Res. Econ. 2014, 9, 286–299. [Google Scholar]
  16. Owusu, V.; Donkor, E.; Owusu-Sekyere, E. Accounting for the gender technology gap amongst smallholder rice farmers in Northern Ghana. J. Agric. Econ. 2018, 69, 439–457. [Google Scholar] [CrossRef]
  17. Al-hassan, S. Technical Efficiency of Rice Farmers in Northern Ghana; Research Paper; African Economic Research Consortium: Nairobi, Kenya, 2008. [Google Scholar]
  18. Abdulai, A.; Huffman, W. Structural adjustment and economic efficiency of rice farmers in northern Ghana. Econ. Dev. Cult. Chang. 2000, 48, 503–520. [Google Scholar] [CrossRef]
  19. Battese, G.E.; Rao, D.S.P.; O’Donnell, C.J. A metafrontier production function for estimation of technical efficiencies and technology gaps for firms operating under different technologies. J. Prod. Anal. 2004, 21, 91–103. [Google Scholar] [CrossRef]
  20. Hayami, Y. Sources of agricultural productivity gap among selected countries. Am. J. Agric. Econ. 1969, 51, 564–575. [Google Scholar] [CrossRef]
  21. Hayami, Y.; Ruttan, V.W. Agricultural productivity differences among countries. Am. Econ. Rev. 1970, 60, 895–911. [Google Scholar]
  22. Battese, G.E.; Rao, D.S.P. Technology gap, efficiency, and a stochastic metafrontier function. Int. J. Bus. Econ. 2002, 1, 87–93. [Google Scholar]
  23. Battese, G.E.; Coelli, T.J. A model for technical inefficiency effects in a stochastic frontier production function for panel data. Empir. Econ. 1995, 20, 325–332. [Google Scholar] [CrossRef] [Green Version]
  24. O’Donnell, J.C.; Rao, S.D.P.; Battese, E.G. Metafrontier frameworks for the study of firm-level efficiencies and technology ratios. Empir. Econ. 2008, 34, 231–255. [Google Scholar] [CrossRef]
  25. Boshrabadi, H.M.; Villano, R.; Fleming, E. Technical efficiency and environmental-technological gaps in wheat production in Kerman Province of Iran. Agric. Econ. 2008, 38, 67–76. [Google Scholar] [CrossRef]
  26. Mariano, J.M.; Villano, R.; Fleming, E. Technical efficiency of rice farms in different agroclimatic zones in the Philippines: An application of a stochastic metafrontier model. Econ. J. 2011, 25, 245–269. [Google Scholar] [CrossRef]
  27. Onumah, J.A.; Onumah, E.E.; Al-Hassan, R.M.; Brümmer, B. Metafrontier analysis of organic and conventional cocoa production in Ghana. Agric. Econ. 2013, 59, 271–280. [Google Scholar]
  28. Mensah, A.; Brümmer, B. Drivers of technical efficiency and technology gaps in Ghana’s mango production sector: A stochastic metafrontier approach. Afr. J. Agric. Res. Econ. 2016, 11, 101–117. [Google Scholar]
  29. Villano, R.; Bravo-Ureta, B.; Solís, D.; Fleming, E. Modern rice technologies and productivity in the Philippines: Disentangling technology from managerial gaps. J. Agric. Econ. 2015, 66, 129–154. [Google Scholar] [CrossRef]
  30. Binam, N.J.; Gockowski, J.; Nkamleu, B.G. Technical efficiency and productivity potential of cocoa farmers in West African countries. Dev. Econ. 2008, 46, 242–263. [Google Scholar] [CrossRef]
  31. Abdulai, A.; Abdulai, A. Examining the impact of conservation agriculture on environmental efficiency among maize farmers in Zambia. Environ. Dev. Econ. 2017, 22, 177–201. [Google Scholar] [CrossRef]
  32. Tan, S.; Heerink, N.; Kuyvenhoven, A.; Qu, F. Impact of land fragmentation on rice producers’ technical efficiency in south-east China. NJAS Wagening. J. Life Sci. 2010, 57, 117–123. [Google Scholar] [CrossRef]
  33. Battese, G.E. A note on the estimation of Cobb-Douglas production functions when some explanatory variables have zero values. J. Agric. Econ. 1997, 48, 250–252. [Google Scholar] [CrossRef]
  34. Galawat, F.; Yabe, M. Profit efficiency in rice production in Brunei Darussalam: A stochastic frontier approach. J. Int. Soc. Southeast Asian Agric. Sci. 2012, 18, 100–112. [Google Scholar]
  35. Yami, M.; Solomon, T.; Begna, B.; Fufa, F.; Alemu, T.; Alemu, D. Source of technical inefficiency of smallholder wheat farmers in selected waterlogged areas of Ethiopia: A translog production function approach. Afr. J. Agric. Res. 2013, 8, 3930–3940. [Google Scholar]
  36. Addai, K.N.; Owusu, V. Technical efficiency of maize farmers across various agro-ecological zones of Ghana. J. Agric. Environ. Sci. 2014, 3, 149–172. [Google Scholar]
  37. Onumah, E.E.; Brümmer, B.; Hörstgen-Schwark, G. Elements which delimitate technical efficiency of fish farms in Ghana. J. World Aquac. Soc. 2010, 41, 506–518. [Google Scholar] [CrossRef]
  38. Asravor, J.; Onumah, E.E.; Osei-Asare, Y.B. Efficiency of chili pepper production in the Volta region of Ghana. J Agr. Ext. Rural Dev. 2016, 8, 99–110. [Google Scholar]
  39. Yiadom-Boakye, E.; Owusu-Sekyere, E.; Nkegbe, P.K.; Ohene-Yankyera, K. Gender, resource use and technical efficiency among rice farmers in the Ashanti region, Ghana. J. Agric. Econ. Dev. 2013, 2, 102–110. [Google Scholar]
  40. Khan, H.; Saeed, I. Measurement of Technical, Allocative and Economic Efficiency of Tomato Farms in Northern Pakistan. In Proceedings of the ICMESS’ 2011 International Conference on Management, Economics and Social Sciences, Bangkok, Thailand, 23–24 September 2011. [Google Scholar]
  41. Coelli, J.T. Recent developments in frontier modelling and efficiency measurement. Aust. J. Agric. Res. Econ. 1995, 39, 219–245. [Google Scholar] [CrossRef]
  42. Kodde, A.D.; Palm, C.F. Wald criteria for jointly testing equality and inequality restrictions. Econometrica 1986, 54, 1243–1248. [Google Scholar] [CrossRef]
  43. Food and Agriculture Organization (FAO). Fertilizer Use by Crop in Ghana. Land and Plant Nutrition Management Service, Land and Water Development Division; Food and Agriculture Organization of the United Nations: Rome, Italy, 2005. [Google Scholar]
  44. Germer, J.; Sauerborn, J. Ecological Zones of Ghana; University of Hohenheim: Stuttgart, Germany, 2008; Available online: https://www.uni-hohenheim.de/respta/climate.php (accessed on 30 September 2015).
  45. Armah, F.A.; Odoi, J.O.; Yengoh, G.T.; Obiri, S.; Yawson, D.O.; Afrifa, E.K.A. Food security and climate change in drought-sensitive savanna zones of Ghana. Mitig. Adap. Strateg. Glob. Chang. 2011, 16, 291–306. [Google Scholar] [CrossRef]
  46. Buah, S.S.J.; Nutsugah, S.K.; Kanton, R.A.L.; Atokple, I.D.K.; Dogbe, W.; Karikari, A.S.; Wiredu, A.N.; Amankwah, A.; Osei, C.; Ajayi, O.; et al. Enhancing farmers’ access to technology for increased rice productivity in Ghana. Afr. J. Agric. Res. 2011, 6, 4455–4466. [Google Scholar]
  47. Asuming-Brempong, S.; Gyasi, K.O.; Marfo, K.A.; Diagne, A.; Wiredu, A.N.; Asuming, B.A.; Haleegoah, J.; Frimpong, B.N. The exposure and adoption of New Rice for Africa (NERICAs) among Ghanaian rice farmers: What is the evidence? Afr. J. Agric. Res. 2011, 6, 5911–5917. [Google Scholar] [CrossRef]
  48. Nkegbe, K.P. Technical efficiency in crop production and environmental resource management practices in northern Ghana. Environ. Econ. 2012, 3, 43–51. [Google Scholar]
  49. Codjoe, A.S.N. Migrant versus indigenous farmers. An analysis of factors affecting agricultural land use in the transitional agro-ecological zone of Ghana, 1984–2000. Dan. J. Geog. 2006, 106, 103–113. [Google Scholar] [CrossRef]
  50. Becker, M.; Johnson, D.E. Improved water control and crop management effects on lowland rice productivity in West Africa. Nutr. Cycl. Agroecosyst. 2001, 59, 119–127. [Google Scholar] [CrossRef]
  51. Otieno, J.D.; Hubbard, L.; Ruto, E. Technical Efficiency and Technology Gaps in Beef Cattle Production Systems in Kenya. In Proceedings of the 85th annual Conference of the Agricultural Economics Society (AES), Warwick, UK, 18–20 April 2011. [Google Scholar]
  52. Khai, H.V.; Yabe, M. Technical Efficiency Analysis of Rice Production in Vietnam. J. Int. Soc. Southeast Agric. Sci. 2011, 17, 135–146. [Google Scholar]
  53. Abdulai, A.; Eberlin, R. Technical efficiency during economic reform in Nicaragua: Evidence from farm household survey data. Econ. Syst. 2001, 25, 113–125. [Google Scholar] [CrossRef]
Figure 1. Metafrontier model for agro-ecological zones in Ghana. Source: Adapted from Battese et al. [19].
Sustainability 11 02072 g001
Figure 2. The Map of Ghana Showing the Agro-ecological Zones. Source: Germer and Sauerborn [44].
Sustainability 11 02072 g002
Table 1. Hypothesis Tests for the Zonal Frontier and the Metafrontier Models.
Null HypothesisTest Statistic (λ)Critical ValueDecision
1. H 0 :   β nm   =   0
Forest-savannah transition zone
Guinea savannah zone
Pooled
27.93
25.15
30.36
23.21 b
23.21 b
23.21 b
Reject H 0
Reject H 0
Reject H 0
2. H 0 :   γ = 0
Forest-savannah transition zone
Guinea savannah zone
Pooled
116.32
52.39
129.83
9.50 a
9.50 a
9.50 a
Reject H 0
Reject H 0
Reject H 0
3. H 0 :   γ = δ 0 = δ 1 = , , = δ 10 = 0
Forest-savannah transition zone
Guinea savannah zone
Pooled
30.91
26.32
27.33
22.53 a
22.53 a
22.53 a
Reject H 0
Reject H 0
Reject H 0
4. H 0 :   f F S T ( X ; β F S T ) = f G S ( X ; β G S ) ,
Pooled only61.3052.19 bReject H 0
a = Read from Table 1 of Kodde and Palm ([42], p. 1246), b = corresponds to 1% significance level. Source: Authors’ computations based on survey data.
Table 2. Parameter Estimates of the Stochastic Frontier and Metafrontier Functions.
VariablesForest–Savannah Transition ZoneGuinea Savannah ZonePooled DatasetMetafrontier
Constant1.710(1.813)4.127(1.880) **3.983(1.319) ***1.709(1.799)
Ln (Labor)0.041(0.050)0.128(0.050) **0.093(0.035) **0.038(0.050)
Ln (Seed)−0.013(0.087)0.027(0.076)0.010(0.058)0.027(0.090)
Ln (Land)0.483(0.099) ***0.384(0.087) ***0.442(0.068) ***0.470(0.101) ***
Ln (Fertilizer)0.163(0.065) **0.280(0.068) ***0.262(0.049) ***0.168(0.066) ***
Dummy of fertilizer−0.769(1.248)−3.143(1.428) **−2.638(0.966) ***−0.768(1.238)
0.5 Ln (Labor)2−0.005(0.054)0.158(0.074) **0.070(0.045) *0.001(0.053)
0.5 Ln (Seed)2−0.023(0.163)−0.184(0.098) *−0.164(0.083) *0.332(0.147) **
0.5 Ln (Land)20.455(0.299) *−0.208(0.180)−0.161(0.141)0.483(0.290) **
0.5 Ln (Fertilizer)2−0.032(0.133)−0.207(0.133)−0.179(0.095) *−0.026(0.130)
Ln (Labor*Seed)0.089(0.122)−0.049(0.077)−0.033(0.062)0.051(0.110)
Ln (Labor*Land)−0.075(0.107)−0.048(0.091)−0.013(0.064)−0.065(0.104)
Ln (Labor*Fertilizer)0.005(0.015)0.013(0.019)0.005(0.013)0.001(0.016)
Ln (Seed*Land)−0.455(0.183) ***0.207(0.085) **0.092(0.077)−0.545(0.180) ***
Ln (Seed*Fertilizer)−0.108(0.041) **0.012(0.027)−0.001(0.022)−0.069(0.040) **
Ln (Land*Fertilizer)0.076(0.045)−0.037(0.030)−0.024(0.024)0.062(0.042) *
RTS
Sigma squared
Gamma
Log-likelihood
0.674
0.655 ***
0.859
−246.499
0.819
0.606 ***
0.324
−458.630
0.807
0.830 ***
0.707
−735.779
Values in parenthesis are standard errors. *, ** and *** represent significance at 10%, 5% and 1% levels respectively. Source: Authors’ computations based on survey data.
Table 3. Technical Efficiency and Environmental-Technology Gap Ratio Scores.
MinMaxMeanSD
Technical Efficiency (Stochastic Frontier)
Forest-savannah transition0.070.920.590.22
Guinea savannah 0.090.940.830.13
Pooled 0.090.900.650.17
Environmental-Technology Gap Ratios
Forest-savannah transition 0.311.000.950.07
Guinea savannah 0.011.000.500.14
Pooled 0.011.000.680.25
Metafrontier Technical Efficiency
Forest-savannah transition 0.060.900.560.21
Guinea savannah 0.010.920.420.14
Pooled 0.010.860.450.21
Source: Authors’ computations based on survey data.
Table 4. Estimates of the Technical Inefficiency Model.
VariableForest-Savannah Transition ZoneGuinea Savannah ZonePooled Dataset
Constant4.017 (1.081) ***0.500 (0.366) *3.685 (1.315) ***
Rice training−0.858 (0.578) **−0.034 (0.334)−0.207 (0.249)
Source of knowledge0.447 (0.249) *0.193 (0.456)0.274 (0.251)
Construction of bunds0.663 (0.241) ***0.927 (0.380) ***0.700 (0.277) ***
Selling at the farm gate−1.618 (0.340) ***−2.168 (0.750) ***−1.813 (0.526) ***
Rice monoculture−0.724 (0.442) ***−0.477 (0.570)−0.334 (0.389)
Ownership of farmland−0.338 (0.196) *0.286 (0.504)−0.290 (0.203)
Distance to the farm0.002 (0.009)0.086 (0.036) ***0.006 (0.009)
Off farm activities0.764 (0.233) ***0.461 (0.321) *0.486 (0.221) **
Access to improved seeds−2.078 (0.952) ***0.500 (0.366) *−2.103 (1.248) ***
Proportion of household educated0.325 (0.399)−0.886 (0.702)−0.259 (0.401)
Figures in parenthesis are standard errors. *, **, and *** represent significance at 10%, 5% and 1% levels respectively. Source: Authors’ computations based on survey data.

