Article

Measuring the Efficiency of Public and Private Delivery Forms: An Application to the Waste Collection Service Using Order-M Data Panel Frontier Analysis

by
Cristina M. Campos-Alba
1,
Emilio J. De la Higuera-Molina
1,
Gemma Pérez-López
2 and
José L. Zafra-Gómez
1,*
1
Accounting and Finance Department, Facultad de Ciencias Económicas y Empresariales, Campus de Cartuja s/n, University of Granada, BOX 18071 Granada, Spain
2
Accounting and Finance Department, Facultad de Ciencias Sociales y Jurídicas, University of Granada, C/Santander, 1 BOX 52005 Melilla, Spain
*
Author to whom correspondence should be addressed.
Sustainability 2019, 11(7), 2056; https://doi.org/10.3390/su11072056
Submission received: 28 January 2019 / Revised: 23 March 2019 / Accepted: 28 March 2019 / Published: 6 April 2019
(This article belongs to the Special Issue Environmental, Social and Economic Sustainability of Waste Management)

Abstract

:
Many studies have been undertaken to determine whether waste collection services are provided more efficiently by private or by public management. To date, however, the findings reported are inconclusive, partly due to the need to evaluate this question over a broad time horizon. In this paper, the question is examined taking into account an extended study period (2002–2014) and applying an order-m data panel method that provides more robust findings than those reported in previous research. The results show that, in general, public-sector provision of the waste collection service is more efficient than private alternatives.

1. Introduction

The waste collection service has been the object of increasing research interest [1,2,3], due to the worldwide increase in the amount of waste generated and to rising environmental concerns, among other aspects [4,5,6]. These factors, moreover, have led to stricter regulation of the sector [7]. In consequence, those responsible for service provision (most of which are local public entities) are faced with greater demands for the necessary resources [8], making cost efficiency in this area an essential element in planning and management.
Many analyses have been made of the waste collection service [9,10,11,12], and various studies have examined the question of cost efficiency in providing this service [13,14,15]. Among the latter, researchers have focused on the factors that may affect cost efficiency, such as the geographical and environmental characteristics of the area, the amount and type of waste generated, the method of waste collection used and the waste collection network established [16,17,18,19]. However, an aspect that has been relatively neglected is that of the ownership of the service, i.e., whether it is provided by public or private agencies [7].
In this field, the literature is inconclusive and often presents significant limitations. Some authors have analysed the situation observed during a single year [14,20] or within a specific region [18,21], but this is insufficient to ensure that robust results are obtained, in view of the real-world conditions encountered. Furthermore, the need for research into the influence of the forms of provision of the waste collection service on cost efficiency has been heightened by the recent and growing tendency for such services, after earlier privatisation, to be remunicipalised [22,23,24].
The aim of the present study is to contribute to the literature on the efficiency of the waste collection service, by determining which management form is more efficient in terms of service provision cost, whether direct (by the public entity) or indirect (by a private company). This efficiency is analysed taking into consideration a broad time horizon (2002–2014), as recommended by Máñez et al. [25] and Pérez-López et al. [26], who observed that the characteristics of efficiency may vary depending on when a given management form is implemented. Accordingly, in this study the efficiency of a sample of 164 Spanish municipalities with populations ranging from 1000 to 50,000 inhabitants is estimated applying an order-m frontier analysis based on panel data [27]. This approach makes it possible to compare different forms of management and to obtain a year-on-year efficiency score for each municipality considered. Moreover, it obtains more robust results than traditional non-parametric techniques, such as data envelopment analysis (DEA) or free disposal hull (FDH).
The main results obtained show that provision of the waste collection service was more efficient by direct public management than by private management throughout the study period. By population size, for municipalities with 5000–20,000 inhabitants, public management was always more efficient. However, in the other population sizes considered (1000–5000 and 20,000–50,000 inhabitants), during an initial period (up to 2005) the two management forms obtained similar results; this was followed by a second period (until 2008), during which public management was clearly more efficient. Only in 2009 was private management more efficient than public management. Subsequently, until 2014, public management was again more efficient.

2. Literature Review

The question of efficiency in public services has aroused considerable research interest [28,29,30,31], and studies have distinguished between different forms of service efficiency, including distributive, allocative, dynamic and productive [32]. Productive efficiency is defined as the use of an optimal level of inputs to generate a certain level of outputs within the production process, or during the provision of the service—waste collection services— [33], and the wish to maximise this parameter often weighs upon the decisions made by public managers regarding the choice of service delivery form [30,34]. In this regard, the analysis of public services from the standpoint of public entities is usually focused on the question of cost efficiency, taking service cost as the input, instead of physical inputs, the approach normally taken when the analysis is based on technical efficiency [14]. In the case of the waste collection service, this question has been examined by Ronchi et al. [35], Bel and Fageda [36], Simões et al. [37] and Plata-Díaz et al. [2].
The theory of New Public Management [38,39,40] has played an important role in recent years, during which major reforms have been carried out to restructure government agencies and to reform the provision of public services in order to increase efficiency through cost savings [41,42,43]. The most commonly used measures to achieve the latter objective are the decentralisation of public services and the introduction of market-related mechanisms for service provision [44], i.e., involving the private sector in these activities.
The latter measure is supported by various theoretical approaches, such as public choice [45,46], property rights [47] or agency theory [48,49], and many studies have been made of the privatisation of public services, especially at the local level. Privatisation has been defined as the provision of public services by a private company, which expects to profit from performing this activity [2,50,51,52].
According to various theoretical discussions of local government efficiency, privatisation introduces the element of competition into the provision of public services. However, in many cases this provision is characterised by its monopolistic nature, regardless of whether the providing agent is a public or a private entity [2,53]. Nevertheless, the competitive process faced by potential service providers generates the possibility of increasing productivity and thus achieving cost savings [54,55]. In addition, the privatisation of services can lead to the application of greater technical experience and managerial skills [56,57], as well as innovations arising in the private sector [58]. Given these changes, an improvement in service provision is to be expected [48]. But this form of management is not adopted with the sole purpose of improving efficiency; in many cases, it is also viewed as a solution to problems of rigidity of the public sector, and as a means of relieving the budget pressure to which local governments are subjected [52].
This management model could also be beneficial both to the private provider and to society, because service provision to large populations by a private entity can generate economies of scale and hence cost savings [59,60,61], an issue that is very significant to the financial managers of small municipalities [62,63]. These savings, moreover, may be passed on in the form of price reductions to the users of the public service concerned [32]. However, in relation to the waste collection service, the empirical evidence in this regard is inconclusive [37,64].
On the other hand, the privatisation of public services has many detractors, for example that service quality may be diminished in the drive to cut costs by private companies [65,66,67]. In this belief, public managers often exercise close supervision of the service provision in order to maintain quality, despite the costs of control that may arise [68], producing a negative impact on cost efficiency. Likewise, the privatisation of public services may provoke significant transaction costs that were not taken into consideration when the privatisation decision was taken [69,70], due to a lack of transparency and the asymmetry in the information available to the public manager and to the private company (in accordance with principal agent theory, see Lane, 2006 [71]). These questions are addressed in the theory of transaction costs [58,72], according to which privatisation can give rise to circumstances in which the desired cost savings are not obtained and, therefore, efficiency is not improved.
The direct management of service provision would eliminate problems of information asymmetry [73] as well as those related to the difficulty of controlling the performance of the private provider [74]. Furthermore, this management form ensures citizens’ access to the service [75]. However, it is often seen as inefficient [57], according to the theory of public choice, developed by Savas [46], because direct provision is strongly associated with political or economic purposes that may be incompatible with that of maximising efficiency [76].
In view of these conflicting theoretical arguments, researchers have sought to determine which management form would be most appropriate for public services in relation to cost efficiency. In fact, the empirical evidence in this respect remains ambiguous [36,51]. While some authors have reported that privatisation increases efficiency in the provision of public services [20,77,78,79], others have observed no significant differences in this respect between public and private management [48,80,81]. Indeed, several authors have claimed that public management is more efficient than private-sector provision [36,82,83]. In the specific case of the waste collection service, the empirical evidence currently available does not support either view conclusively [26].
The complexity of these questions and the importance to local finances of the costs incurred in providing waste collection services [8,14,18] make it necessary to conduct a detailed study of the service efficiency achieved by direct (public) or private management, in order to provide public managers with the information needed to reach appropriate decisions and thus maintain (or expand) the service whilst controlling its costs [84]. Although the efficiency of this service has been analysed in several previous studies, this article seeks to achieve more robust results by applying an estimation method based on panel data and order-m frontier analysis, thus enabling us to compare the results obtained by management forms over an extended period.

3. Methodology and Data

3.1. Method

In this study, the cost efficiency of the waste collection service is estimated using panel data and order-m frontiers [27], in an approach which, unlike traditional non-parametric frontier estimation methods, obtains comparable values for efficiency over an extended time period [85,86]. Frontier estimation by DEA or FDH models obtains the efficiency of the different units analysed as a linear combination of the sample observations, and therefore the application of contemporaneous frontiers for a period of time obtains for each unit analysed an independent time-specific efficiency coefficient, by estimating a time-specific frontier for each time interval considered [86]. However, it should be taken into account that the consideration of intertemporal frontiers and window analysis [87,88] for the evaluation of time series does not take into account the structure of panel data in the estimation of coefficients of efficiency, since this approach considers each unit of the panel to be an independent observation [89]. On the other hand, with the panel data extension proposed by Surroca et al. [85] inter-related temporal coefficients, also known as time-variant efficiency coefficients, can be calculated.
Among the advantages of panel data estimation, the result obtained is less dependent on the specific values of the variables of a particular year, and there are no changes in the evaluation system (weights of the inputs and outputs) over time [27]. In addition, this method facilitates the detection of outliers and obtains more robust results than traditional non-parametric techniques, an outcome that is also favoured by the application of partial non-parametric order-m frontiers.
Specifically, with the order-m approach, observations beyond the estimated efficiency frontier may be considered [90], by means of bootstrapping techniques, based on the resolution of non-convex algorithms of FDH programming. Thus, unlike traditional techniques that compare each unit with the best unit of the entire sample, the efficiency values of each unit of the sample are calculated by comparison with a sub-sample of m pairs. The mathematical programming of the extension of the data panel approach to order-m estimation can be consulted in [27].
The algorithm used to estimate the order-m data panel coefficients of efficiency considers a fixed positive integer m such that, for a certain average level of input ( x ˜ 0 ) and output ( y ˜ 0 ), the estimate considers m random production units with output variables ( Y 1 , ,   Y s ,   ,   Y m ), derived from the distribution of the matrix of Y outputs that meet the condition Y s y ˜ 0 . Therefore, considering the stages to be applied to estimate the order-m frontier proposed by Daraio and Simar [91], the following steps are taken to estimate the order-m data panel efficiency:
  • For a given level of y ˜ 0 , a random sub-sample of size m is created with replacement between the y s m that meet the condition y s m y ˜ 0 .
  • The efficiency coefficient θ ˜ m is estimated from this random sub-sample and the resolution of non-convex algorithms of FDH data panel programming.
  • These two steps are repeated B times, estimating a FDH data panel coefficient of efficiency in each round, so that by the end of the process B efficiency coefficients have been obtained, θ ˜ m , b ( b = 1, 2, …, B ).
  • Finally, a central value (the arithmetic mean) of the B efficiency coefficients is estimated as:
    θ m = 1 B b = 1 B θ ˜ m , b
Thus, θ ˜ m , b depends on the value of m, and therefore the larger this value, the more observations are considered in the estimate and the more units will meet the condition y s m y ˜ 0 . Hence, when m → ∞ the efficiency coefficients obtained by application of the order-m data panel method will converge with the coefficients estimated by FDH data panel.
In addition, due to the random replacement performed, order-m frontiers can obtain efficiency coefficients beyond the estimated frontier. In addition, they can be calculated with respect to input, output, cost or income. Therefore, taking into account the nature of the units addressed in this study, it is more appropriate to evaluate the efficiency of municipal service provision in terms of minimising the cost, because the outputs are largely determined by external forces and it can be difficult to determine the prices of local government inputs and outputs [92]. Thus, an average value will be super-efficient when it reaches θ m > 1 . Finally, unlike order-m frontiers, order-m data panel frontiers obtain fewer super-efficient values, and so estimates with panel data will be less volatile than contemporaneous partial frontiers.
Furthermore, the quality of the estimate can be adjusted by increasing B. Although in most applications it is reasonable to use B = 200 [93], here we assume B = 2000 as suggested by De Witte and Geys [94].

3.2. Data

In Spain, the municipal government is responsible for providing certain public services, including that of waste collection. The latter is a mandatory service in all municipalities regardless of their size, which is the criterion by which the different categories of mandatory services are established.
Among the variables that have been used in previous empirical studies to measure the efficiency of the waste collection service, the most common (as inputs) are current and capital expenses, number of employees, number of vehicles and distance to the landfill. The most common outputs considered are tonnes of waste collected, frequency of collection, number of collection points and population served [95]. In the present study, the cost of the waste collection service has been considered as the input, measured as the municipal budget expenditure for the service (deflated) including both current and capital costs, and as outputs the total tonnes of waste collected per year, weighted by the quality of service measured from a technical standpoint, and the number of waste containers made available in public streets [8,25,64,83,96]. In this sense, for the quality of service a quality index has been used, which measures the adequacy of the service provided, considering the availability and cleanliness of the containers, and the periodicity of the waste collection performed.
The study is based on analysis of an extensive database covering the period 2002–2014 and including municipalities with a population of 1000 to 50,000 inhabitants. Relevant data were not available for municipalities with smaller or larger populations. The specific databases consulted were the Virtual Office of Local Government Financial Coordination of the Treasury, which provides information on the budgeted municipal cost of the waste collection service, and the Survey of Local Infrastructure and Equipment (EIEL) published by the Ministry of Territorial Policy and Public Services, which publishes data on the outputs and the management form of the waste collection service.
A multivariate data outlier detection process was applied through the TRIMMEAN function to 5% of the sample. The final sample was composed of 164 municipalities, which provided the waste collection service through direct public management or outsourced it to a private company, and which maintained this form of service provision throughout the study period. Table 1 shows the descriptive statistics for the study variables used in this analysis, by size and delivery form.

4. Results

In this section, the main study results obtained are analysed. The efficiency values were calculated using the R statistical software package [96], in the form of the FEAR package [97].
Before examining the efficiency values obtained, the Mann–Whitney U test and Li’s test [98] were performed. These tests were conducted to determine whether there were significant differences between public and private forms of service provision in order to identify which one is more appropriate in terms of waste collection efficiency. The Mann–Whitney U test is non-parametric and evaluates the independence of two samples, with the null hypothesis that the difference between them is zero. Li’s test [98], which was applied in accordance with the extension proposed by [99], measures the distance between two density functions, using the integrated square error of these functions [100,101]. Figure 1 shows the density graph obtained, based on the Kernel density estimation, which allows us to estimate the probability density function of a random variable. Here, the X axis represents the units of the sample, and the Y axis shows the probability density function of this sample, highlighting the existence of differences between the two samples—on the one hand, municipalities with public management of the service and, on the other, those with private management of the service.
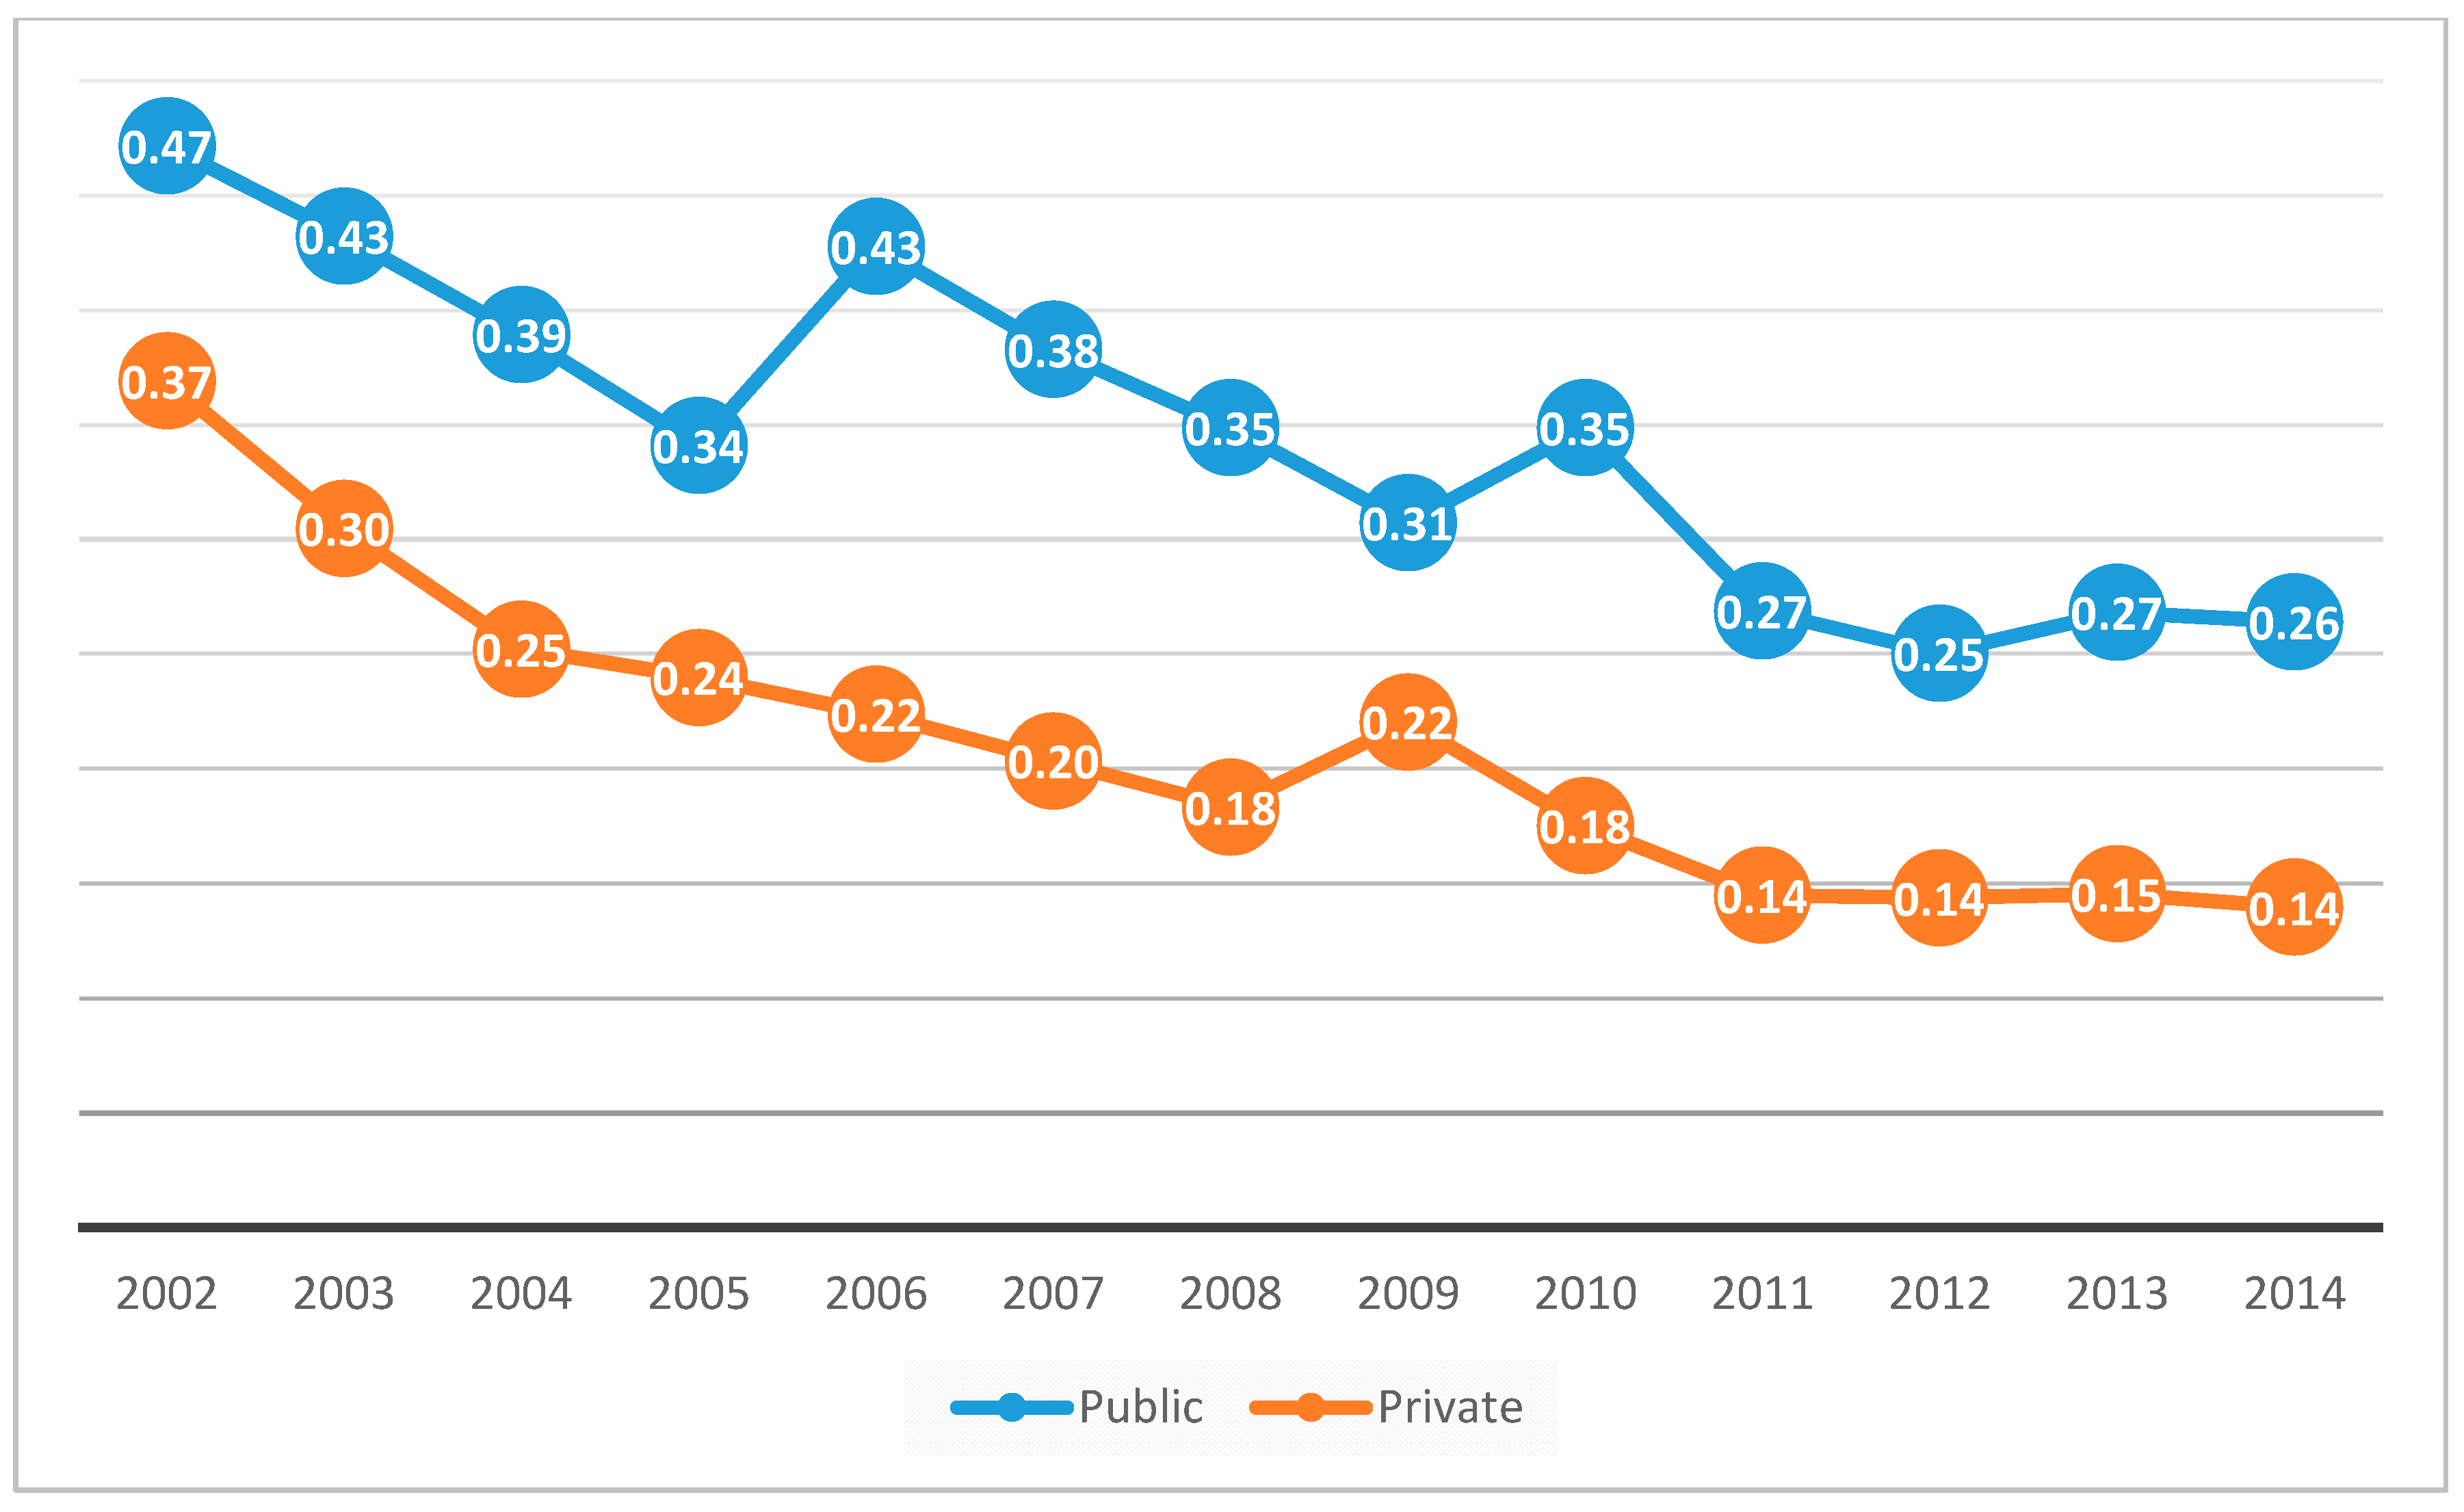
The results of these tests reveal significant differences between the efficiencies of these two management forms for the waste collection service, during the period analysed. The next step in our analysis was to determine the average efficiency of each management form for each year. As can be seen in Figure 2, the average efficiency scores for direct public management were higher than those for private services, throughout the study period, from which it is concluded that public management is more appropriate than outsourcing for the provision of the waste collection service.
These results also show that the average efficiency score fell markedly between the initial year (2002) and 2014, although at different rates according to the management form considered; with direct provision, efficiency rose in 2006, 2010 and slightly in 2013; with private provision, on the other hand, mean efficiency fell until 2009, when it increased slightly to an average level of 22%, from where it decreased to 14% in 2011, at which level it then remained fairly constant. The descriptive statistics of the efficiency values are shown in Table 2 and Table 3, which correspond to direct provision and privatisation management forms, respectively.
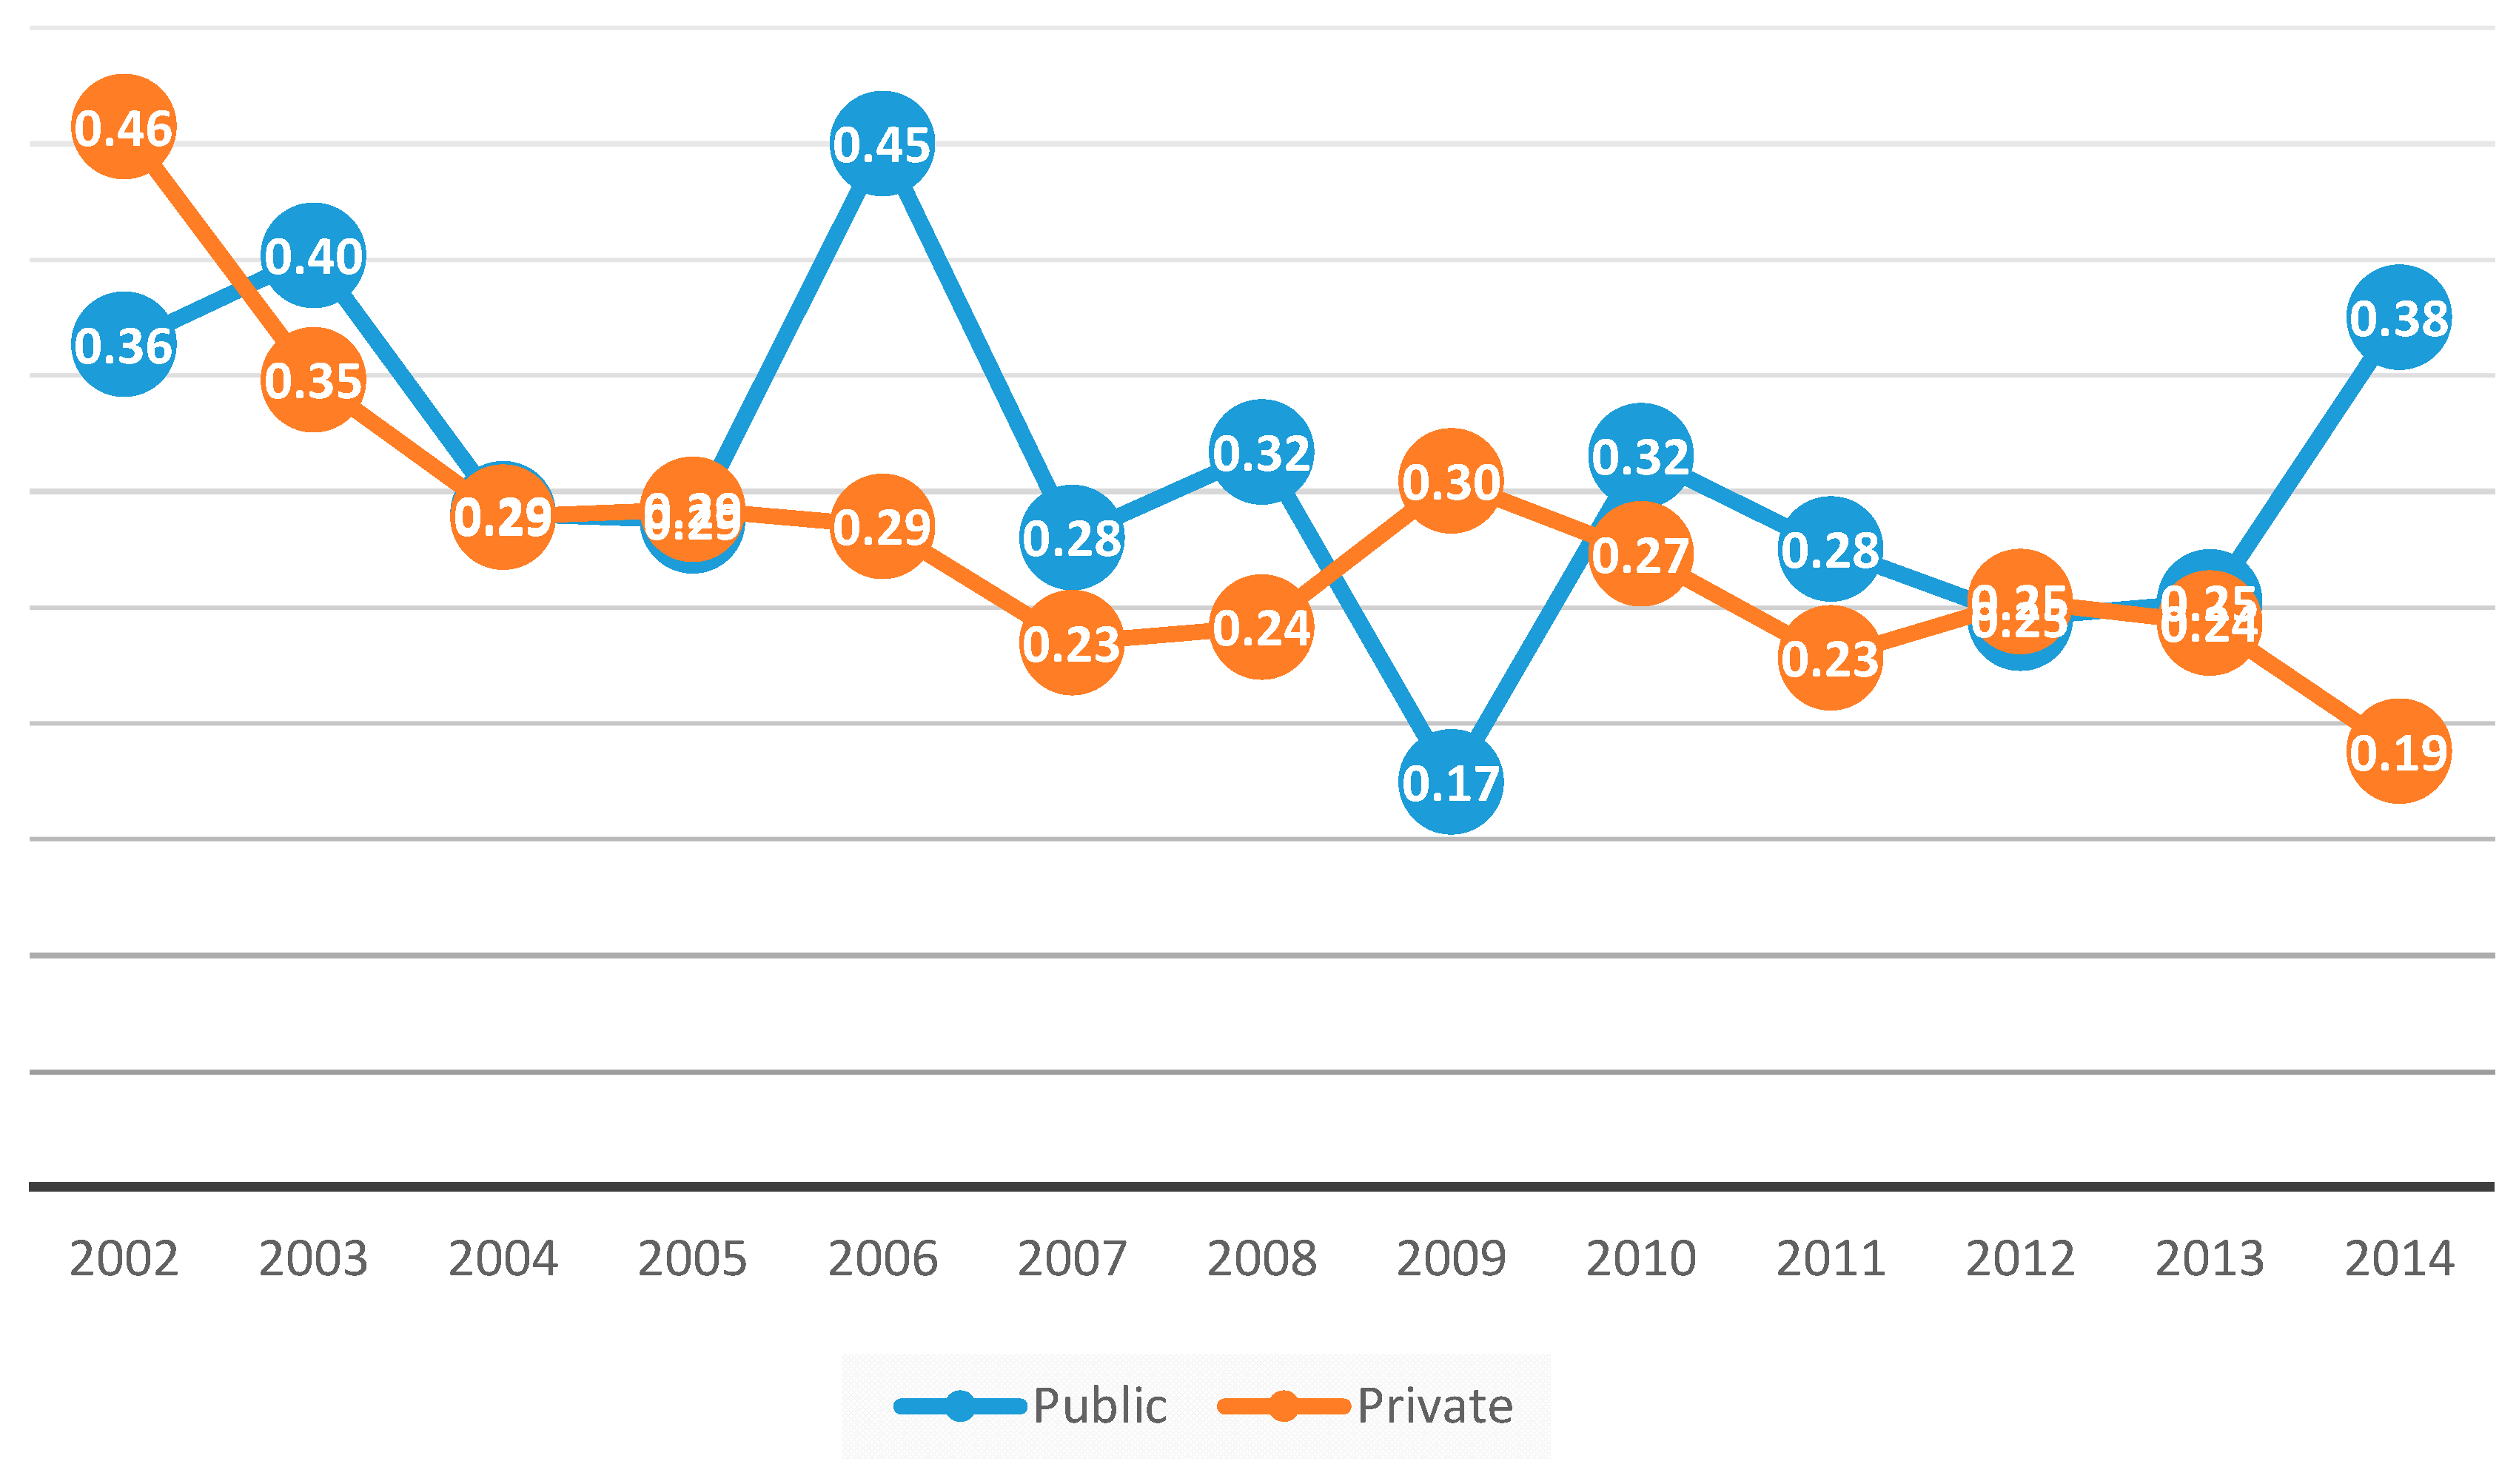
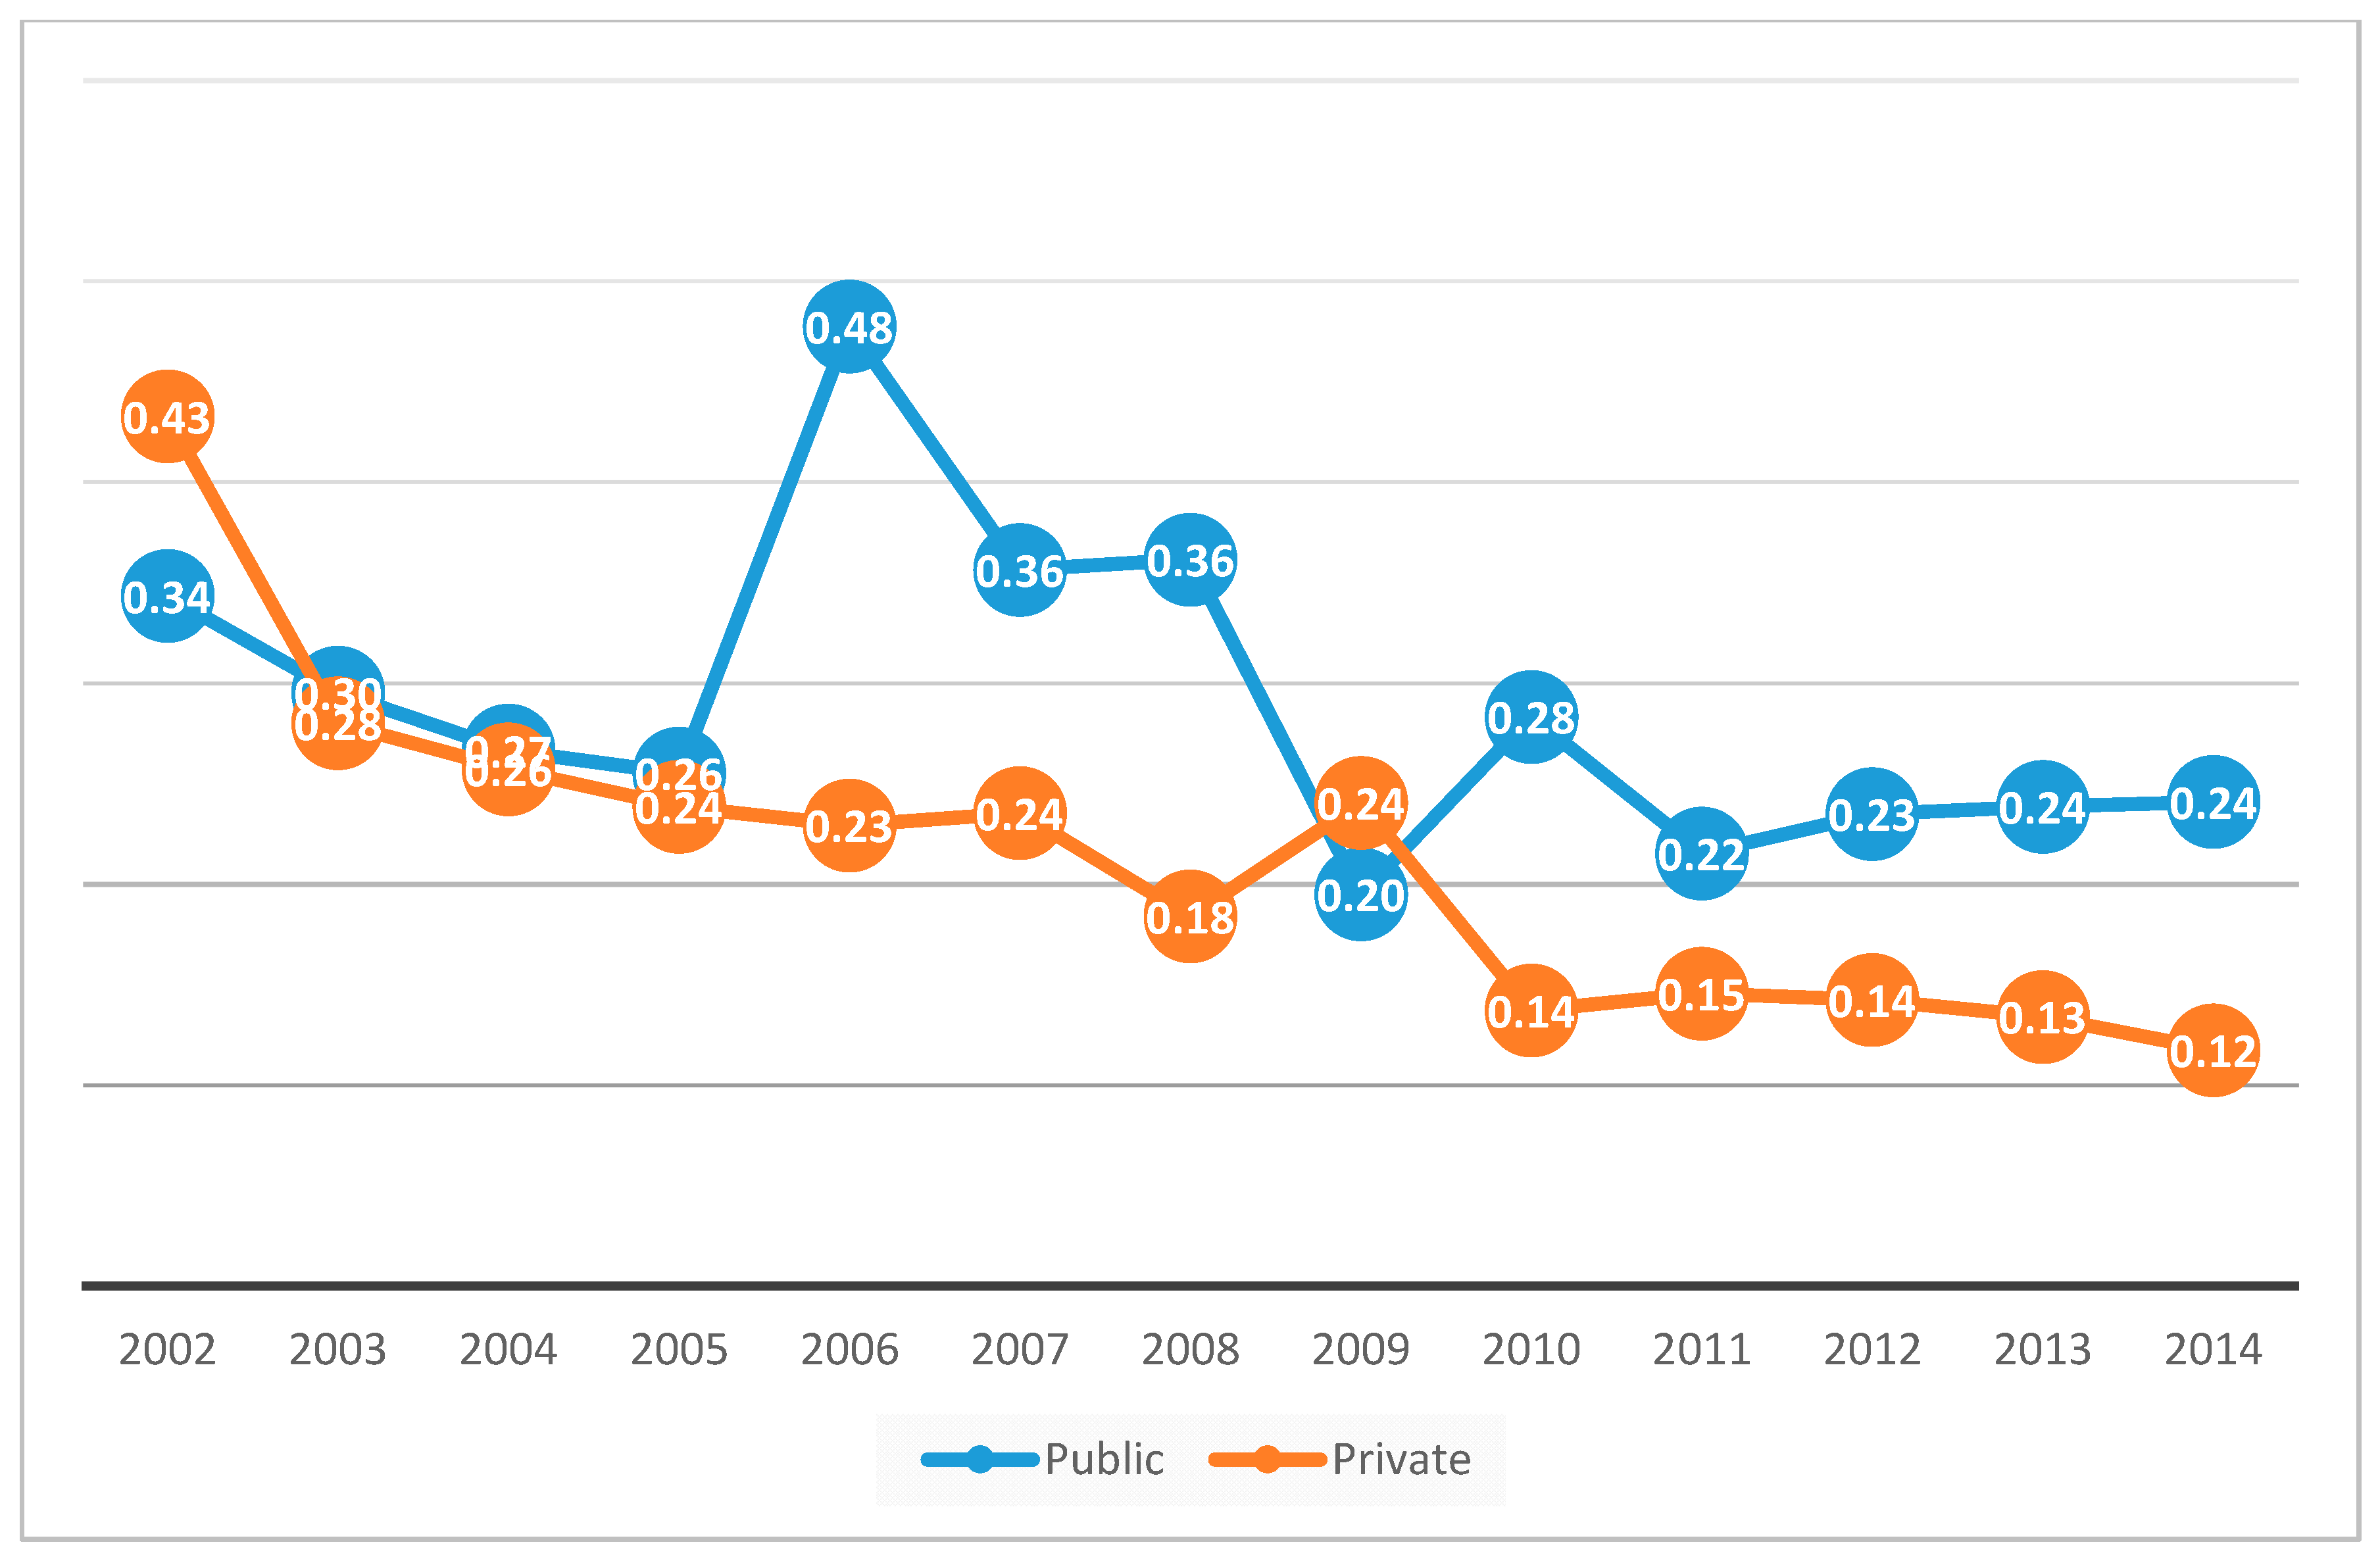
Analysis of these results according to the number of inhabitants and type of service provision (Figure 3, Figure 4 and Figure 5) shows that the efficiency of the waste collection service varies among the municipalities with a population of 5000 to 20,000 inhabitants (Figure 4), whereby those with public (direct) management recorded higher scores in this respect than those which had outsourced the service, throughout the study period. However, in the municipalities with 1000 to 5000 inhabitants (Figure 3) the average efficiency of both forms of service provision was very similar, except in 2002–2003, 2006–2009 and 2014. Among the largest municipalities, too, there was some variability in the mean efficiency scores recorded, although from 2003 to 2005 very similar results were obtained for both forms of service management.

5. Conclusions

The question of whether the waste collection service can be provided more efficiently by private or public management forms is a recurring theme in the literature. This debate has been rekindled in recent years by the remunicipalisation processes carried out by local authorities in various countries, where public managers have cancelled contracts with private waste collection companies after the expected results were not delivered. These changes and uncertainties reflect the fact that the greater efficiency of service provision, whether by public or private formulas, remains to be established. One of the problems in this respect is that most studies of the question have been cross-sectional, and so no long-term evaluation has been made with which more robust results could have been obtained. The present study addresses this shortcoming by analysing the efficiency of the waste collection service by private and public management forms over an extended period of time, and by employing order-m data panel methodology, which allows robust estimates to be obtained [102,103].
Order-m data panel estimation provides a year-on-year efficiency score, for each of the municipalities analysed. This approach, unlike contemporaneous frontiers, intertemporal frontiers and window analysis, enables the comparison of mean efficiency values from different sources and over an extended period. Moreover, the estimations made with this methodological extension obtain more robust results because they are less dependent on the specific values of the variables of a particular year, which facilitates the detection of superefficient units [27].
By applying the above method in this analysis of the efficiency of the waste collection service over an extended period (2002–2014), robust values are obtained for public and private forms of service provision, thus providing solid reasoning for preferring one form or the other. Specifically, over the whole time horizon considered, the results obtained show that public management forms achieve notably higher levels of efficiency than private provision. By population size, it is shown that for municipalities with 5000 to 20,000 inhabitants, throughout the study period, public management is more efficient. However, for smaller and larger municipalities (1000–5000 and 20,000–50,000 inhabitants), up to 2005 the two management forms obtained similar results; then, until 2008, public management was more efficient. The year 2009 was the only year when private management was more efficient. From then until the end of the study period in 2014, public management was again seen to be more efficient.
Even when the only criterion applied is that of population size, the results obtained by public management formulas are always superior. However, in the smallest and largest municipalities, the patterns of efficiency values present greater variability. Only during the first year of the Great Recession (2009) was the efficiency of private management greater than that of public management in two population categories (1000–5000 and 20,000–50,000 inhabitants), which implies that private forms adapted better to the changes produced by this transboundary crisis [104], although the effect was short-lived. However, a more detailed study is required to analyse this period (2009–2014).
A more detailed study of efficiency, according to the type of waste treated, could provide a basis for improved service management in the future. However, in the present case this was not possible, due to the lack of disaggregated information in this regard. This same non-availability of itemised service costs currently hampers decision making by public managers, and represents an information gap warranting attention.
Future research in this field should consider other options for providing the waste collection service and seek to determine the impact made by certain environmental factors in this context. Moreover, careful consideration should be paid to developing robust estimates such as those presented in this paper.

Author Contributions

All authors have substantially contributed to the conception and design of this study. J.L.Z.-G. and E.J.D.l.H.-M. have deeply analysed the theoretical framework and written it. G.P.-L., E.J.D.l.H.-M. and C.M.C.-A. have carried out the data processing of the research, and G.P.-L.and J.L.Z.-G. have undertaken and written the methodological section of the paper. Finally, conclusions were analysed, discussed and written by all the authors. The entire process was supervised by J.L.Z.-G. until the final draft.

Funding

This research was funded by the Spanish Ministry of Economy and Competitiveness (ECO2016-76578-R, and the Spanish Ministry of Education, Culture and Sports under Grant (FPU16/04279).

Conflicts of Interest

The authors declare no conflict of interest.

References

  1. Sjöström, M.; Östblom, G. Decoupling waste generation from economic growth—A CGE analysis of the Swedish case. Ecol. Econ. 2010, 69, 1545–1552. [Google Scholar] [CrossRef]
  2. Plata-Díaz, A.M.; Zafra-Gómez, J.L.; Pérez-López, G.; López-Hernández, A.M. Alternative management structures for municipal waste collection services: The influence of economic and political factors. Waste Manag. 2014, 34, 1967–1976. [Google Scholar] [CrossRef]
  3. Abrate, G.; Boffa, F.; Erbetta, F.; Vannoni, D. Voters’ Information, Corruption, and the Efficiency of Local Public Services. Sustainability 2018, 10, 4775. [Google Scholar] [CrossRef]
  4. Valerio, F. Environmental impacts of post-consumer material managements: Recycling, biological treatments, incineration. Waste Manag. 2010, 30, 2354–2361. [Google Scholar] [CrossRef] [PubMed]
  5. Hong, J.; Li, X.; Cui, Z. Life cycle assessment of four municipal solid waste management scenarios in China. Waste Manag. 2010, 30, 2362–2369. [Google Scholar] [CrossRef] [PubMed]
  6. Bovea, M.D.; Ibáñez-Forés, V.; Gallardo, A.; Colomer-Mendoza, F.J. Environmental assessment of alternative municipal solid waste management strategies. A Spanish case study. Waste Manag. 2010, 30, 2383–2395. [Google Scholar] [CrossRef]
  7. Guerrini, A.; Carvalho, P.; Romano, G.; Marques, R.C.; Leardini, C. Assessing efficiency drivers in municipal solid waste collection services through a non-parametric method. J. Clean. Prod. 2017, 147, 431–441. [Google Scholar] [CrossRef]
  8. Benito-López, B.; Moreno-Enguix, M.R.; Solana-Ibañez, J. Determinants of efficiency in the provision of municipal street-cleaning and refuse collection services. Waste Manag. 2011, 31, 1099–1108. [Google Scholar] [CrossRef] [PubMed]
  9. Bel, G.; Warner, M. Does privatization of solid waste and water services reduce costs? A review of empirical studies. Resour. Conserv. Recycl. 2008, 52, 1337–1348. [Google Scholar] [CrossRef]
  10. Bosch, N.; Pedraja, F.; Suárez-Pandiello, J. Measuring the efficiency of Spanish municipal refuse collection services. Local Gov. Stud. 2000, 26, 71–90. [Google Scholar] [CrossRef] [Green Version]
  11. Simões, P.; Marques, R.C. On the economic performance of the waste sector. A literature review. J. Environ. Manag. 2012, 106, 40–47. [Google Scholar] [CrossRef] [PubMed]
  12. Wang, J.; Maier, S.; Horn, R.; Holländer, R.; Aschemann, R. Development of an Ex-Ante Sustainability Assessment Methodology for Municipal Solid Waste Management Innovations. Sustainability 2018, 10, 3208. [Google Scholar] [CrossRef]
  13. Guerrero, L.A.; Maas, G.; Hogland, W. Solid waste management challenges for cities in developing countries. Waste Manag. 2013, 33, 220–232. [Google Scholar] [CrossRef]
  14. Rogge, N.; De Jaeger, S. Measuring and explaining the cost efficiency of municipal solid waste collection and processing services. Omega 2013, 41, 653–664. [Google Scholar] [CrossRef]
  15. Bel, G.; Warner, M.E. Inter-municipal cooperation and costs: Expectations and evidence. Public Adm. 2015, 93, 52–67. [Google Scholar] [CrossRef]
  16. Worthington, A.C.; Dollery, B.E. Measuring efficiency in local government: An analysis of New South Wales municipalities’ domestic waste management function. Policy Stud. J. 2001, 29, 232–249. [Google Scholar] [CrossRef]
  17. Vishwakarma, A.; Kulshrestha, M.; Kulshreshtha, M. Efficiency evaluation of municipal solid waste management utilities in the urban cities of the state of Madhya Pradesh, India, using stochastic frontier analysis. Benchmarking Int. J. 2012, 19, 340–357. [Google Scholar] [CrossRef]
  18. Jacobsen, R.; Buysse, J.; Gellynck, X. Cost comparison between private and public collection of residual household waste: Multiple case studies in the Flemish region of Belgium. Waste Manag. 2013, 33, 3–11. [Google Scholar] [CrossRef]
  19. Greco, G.; Allegrini, M.; Del Lungo, C.; Savellini, P.G.; Gabellini, L. Drivers of solid waste collection costs. Empirical evidence from Italy. J. Clean. Prod. 2015, 106, 364–371. [Google Scholar] [CrossRef]
  20. McDavid, J.C. Solid-waste contracting-out, competition, and bidding practices among Canadian local governments. Can. Public Adm. 2001, 44, 1–25. [Google Scholar] [CrossRef]
  21. Bel, G.; Mur, M. Intermunicipal cooperation, privatization and waste management costs: Evidence from rural municipalities. Waste Manag. 2009, 29, 2772–2778. [Google Scholar] [CrossRef]
  22. Hall, D.; Lobina, E.; Terhorst, P. Re-municipalisation in the early twenty-first century: Water in France and energy in Germany. Int. Rev. Appl. Econ. 2013, 27, 193–214. [Google Scholar] [CrossRef]
  23. Gradus, R.; Budding, T. Political and institutional explanations for increasing re-municipalization. Urban Aff. Rev. 2018. [Google Scholar] [CrossRef]
  24. Bel, G.; Gradus, R. Privatisation, contracting-out and inter-municipal cooperation: New developments in local public service delivery. Local Gov. Stud. 2018, 44, 11–21. [Google Scholar] [CrossRef]
  25. Máñez, J.; Pérez-López, G.; Prior, D.; Zafra-Gómez, J.L. Understanding the dynamic effect of contracting out on the delivery of local public services. Reg. Stud. 2016, 50, 2069–2080. [Google Scholar] [CrossRef]
  26. Pérez-López, G.; Prior, D.; Zafra-Gómez, J.L.; Plata-Díaz, A.M. Cost efficiency in municipal solid waste service delivery. Alternative management forms in relation to local population size. Eur. J. Oper. Res. 2016, 255, 583–592. [Google Scholar] [CrossRef]
  27. Garrido-Rodríguez, J.C.; Pérez-López, G.; Zafra-Gómez, J.L.; Prior, D. Estimación de la eficiencia a largo plazo en servicios públicos locales mediante fronteras robustas con datos de panel. Hacienda Pública Española 2018. [Google Scholar] [CrossRef]
  28. Stastna, L.; Gregor, M. Local Government Efficiency: Evidence from the Czech Municipalities. IES Working Paper No. 14/2011. 2011. Available online: https://ssrn.com/abstract=1978730 (accessed on 16 May 2018). [CrossRef] [Green Version]
  29. Da Cruz, N.F.; Marques, R.C. Revisiting the determinants of local government performance. Omega 2014, 44, 91–103. [Google Scholar] [CrossRef]
  30. Pérez-López, G.; Prior, D.; Zafra-Gómez, J.L. Rethinking new public management delivery forms and efficiency: Long-term effects in Spanish local government. J. Public Adm. Res. Theory 2015, 25, 1157–1183. [Google Scholar] [CrossRef]
  31. Narbón-Perpiñá, I.; De Witte, K. Local governments’ efficiency: A systematic literature review—Part I. Int. Trans. Oper. Res. 2018, 25, 431–468. [Google Scholar] [CrossRef]
  32. Andrews, R.; Entwistle, T. Four faces of public service efficiency: What, how, when and for whom to produce. Public Manag. Rev. 2013, 15, 246–264. [Google Scholar] [CrossRef]
  33. Karlaftis, M.G.; Tsamboulas, D. Efficiency measurement in public transport: Are findings specification sensitive? Transp. Res. Part A Policy Pract. 2012, 46, 392–402. [Google Scholar] [CrossRef]
  34. Boyne, G.A. Public and private management: what’s the difference? J. Manag. Stud. 2002, 39, 97–122. [Google Scholar] [CrossRef]
  35. Ronchi, E.; Federico, A.; Musmeci, F. A system oriented integrated indicator for sustainable development in Italy. Ecol. Indic. 2002, 2, 197–210. [Google Scholar] [CrossRef] [Green Version]
  36. Bel, G.; Fageda, X. Why do local governments privatise public services? A survey of empirical studies. Local Gov. Stud. 2007, 33, 517–534. [Google Scholar] [CrossRef]
  37. Simões, P.; Cruz, N.F.; Marques, R.C. The performance of private partners in the waste sector. J. Clean. Prod. 2012, 29, 214–221. [Google Scholar] [CrossRef]
  38. Hood, C. A public management for all seasons? Public Adm. 1991, 69, 3–19. [Google Scholar] [CrossRef]
  39. Hood, C. The “New Public Management” in the 1980s: Variations on a theme. Account. Organ. Soc. 1995, 20, 93–109. [Google Scholar] [CrossRef]
  40. Diefenbach, T. New public management in public sector organizations: The dark sides of managerialistic ‘enlightenment’. Public Adm. 2009, 87, 892–909. [Google Scholar] [CrossRef]
  41. Da Cruz, N.F.; Marques, R.C. Mixed companies and local governance: No man can serve two masters. Public Adm. 2012, 90, 737–758. [Google Scholar] [CrossRef]
  42. Andrews, R.; Van de Walle, S. New public management and citizens’ perceptions of local service efficiency, responsiveness, equity and effectiveness. Public Manag. Rev. 2013, 15, 762–783. [Google Scholar] [CrossRef]
  43. Hood, C.; Dixon, R. A model of cost-cutting in government? The great management revolution in UK central government reconsidered. Public Adm. 2013, 91, 114–134. [Google Scholar] [CrossRef]
  44. Kettl, D. The Global Public Management Revolution: A Report on the Transformation of Governance; Brookings Institution Press: Washington, DC, USA, 2000. [Google Scholar]
  45. Niskanen, W.A. Bureaucracy and Representative Government; Aldine: Chicago, IL, USA, 1971. [Google Scholar]
  46. Savas, E.S. Privatization. The Key to Better Government; Chatham House: Chatham, NJ, USA, 1987. [Google Scholar]
  47. Shleifer, A. State versus Private Ownership. J. Econ. Perspect. 1998, 12, 133–150. [Google Scholar] [CrossRef] [Green Version]
  48. Sánchez, I.M.G. La nueva gestión pública: Evolución y tendencias. Presupuesto y Gasto Público 2007, 47, 37–64. [Google Scholar]
  49. Christensen, T.; Lægreid, P. Complexity and hybrid public administration-theoretical and empirical challenges. Public Organ. Rev. 2011, 11, 407–423. [Google Scholar] [CrossRef]
  50. Vickers, J.; Yarrow, G. Economic perspectives on privatization. J. Econ. Perspect. 1991, 5, 111–132. [Google Scholar] [CrossRef]
  51. Warner, M.E.; Bel, G. Competition or monopoly? Comparing privatization of local public services in the US and Spain. Public Adm. 2008, 86, 723–735. [Google Scholar] [CrossRef]
  52. López-Hernández, A.M.; Zafra-Gómez, J.L.; Plata-Díaz, A.M.; de la Higuera-Molina, E.J. Modelling fiscal stress and contracting out in local government: The influence of time, financial condition, and the great recession. Am. Rev. Public Adm. 2017. [Google Scholar] [CrossRef]
  53. Stiglitz, J. Economics of the Public Sector; W.W. Norton & Company: New York, NY, USA, 2000. [Google Scholar]
  54. Savas, E.S.; Savas, E.S. Privatization and Public? Private Partnerships; Chatham House: New York, NY, USA, 2000. [Google Scholar]
  55. Swarts, D.; Warner, M.E. Hybrid firms and transit delivery: The case of Berlin. Ann. Public Coop. Econ. 2014, 85, 127–146. [Google Scholar] [CrossRef]
  56. Cannadi, J.; Dollery, B. An evaluation of private sector provision of public infrastructure in Australian local government. Aust. J. Public Adm. 2005, 64, 112–118. [Google Scholar] [CrossRef]
  57. Roy, W.; Yvrande-Billon, A. Ownership, contractual practices and technical efficiency: The case of urban public transport in France. J. Transp. Econ. Policy 2007, 41, 257–282. [Google Scholar]
  58. Bel, G.; Fageda, X. Between privatization and intermunicipal cooperation: Small municipalities, scale economies and transaction costs. Urban Public Econ. Rev. 2006, 6, 13–31. [Google Scholar]
  59. Donahue, J.D. The Privatization Decision. Public Ends, Private Means; Basic Books: New York, NY, USA, 1989. [Google Scholar]
  60. Warner, M.; Hefetz, A. Rural—Urban differences in privatization: Limits to the competitive state. Environ. Plan. C Gov. Policy 2003, 21, 703–718. [Google Scholar] [CrossRef]
  61. Bel, G.; Costas, A. Do public sector reforms get rusty? Local privatization in Spain. J. Policy Reform 2006, 9, 1–24. [Google Scholar] [CrossRef]
  62. Brown, T.L.; Potoski, M. Transaction costs and contracting: The practitioner perspective. Public Perform. Manag. Rev. 2005, 28, 326–351. [Google Scholar]
  63. Bel, G.; Fageda, X.; Mur, M. Does cooperation reduce service delivery costs? Evidence from residential solid waste services. J. Public Adm. Res. Theory 2012, 24, 85–107. [Google Scholar] [CrossRef]
  64. Dollery, B.; Byrnes, J.; Crase, L. Is bigger better? Local government amalgamation and the South Australian rising to the challenge inquiry. Econ. Anal. Policy 2007, 37, 1–14. [Google Scholar] [CrossRef]
  65. O’Toole, L.J., Jr.; Meier, K.J. Parkinson’s Law and the New Public Management? Contracting Determinants and Service-Quality Consequences in Public Education. Public Adm. Rev. 2004, 64, 342–352. [Google Scholar] [CrossRef]
  66. Warner, M.E.; Hefetz, A. Insourcing and outsourcing: The dynamics of privatization among US municipalities 2002–2007. J. Am. Plan. Assoc. 2012, 78, 313–327. [Google Scholar] [CrossRef]
  67. Mouwen, A.; Rietveld, P. Does competitive tendering improve customer satisfaction with public transport? A case study for the Netherlands. Transp. Res. Part A Policy Pract. 2013, 51, 29–45. [Google Scholar] [CrossRef]
  68. Bel, G.; Fageda, X. Empirical analysis of solid management waste costs: Some evidence from Galicia, Spain. Resour. Conserv. Recycl. 2010, 54, 187–193. [Google Scholar] [CrossRef] [Green Version]
  69. Von Hirschhausen, C.; Cullmann, A. A nonparametric efficiency analysis of German public transport companies. Transp. Res. Part E Logist. Transp. Rev. 2010, 46, 436–445. [Google Scholar] [CrossRef]
  70. Daraio, C.; Diana, M.; Di Costa, F.; Leporelli, C.; Matteucci, G.; Nastasi, A. Efficiency and effectiveness in the urban public transport sector: A critical review with directions for future research. Eur. J. Oper. Res. 2016, 248, 1–20. [Google Scholar] [CrossRef]
  71. Lane, J.E. Public Administration & Public Management: The Principal-Agent Perspective; Routledge: London, UK, 2006. [Google Scholar]
  72. Brown, T.L.; Potoski, M. Transaction costs and institutional explanations for government service production decisions. J. Public Adm. Res. Theory 2003, 13, 441–468. [Google Scholar] [CrossRef]
  73. Warner, M.E.; Hefetz, A. Managing markets for public service: The role of mixed public–private delivery of city services. Public Adm. Rev. 2008, 68, 155–166. [Google Scholar] [CrossRef]
  74. Pestana Barros, C.; Peypoch, N. Productivity changes in Portuguese bus companies. Transp. Policy 2010, 17, 295–302. [Google Scholar] [CrossRef]
  75. Albalate, D.; Bel, G.; Calzada, J. Governance and regulation of urban bus transportation: Using partial privatization to achieve the better of two worlds. Regul. Gov. 2012, 6, 83–100. [Google Scholar] [CrossRef]
  76. Saal, D.S.; Parker, D. Productivity and price performance in the privatized water and sewerage companies of England and Wales. J. Regul. Econ. 2001, 20, 61–90. [Google Scholar] [CrossRef]
  77. Reeves, E.; Barrow, M. The impact of contracting out on the costs of refuse collection services: The case of Ireland. Econ. Soc. Rev. 2000, 31, 129–150. [Google Scholar]
  78. Dijkgraaf, E.; Gradus, R.; Melenberg, B. Contracting out refuse collection. Empir. Econ. 2003, 28, 553–570. [Google Scholar] [CrossRef]
  79. Ohlsson, H. Ownership and production costs: Choosing between public production and contracting-out in the case of Swedish refuse collection. Fisc. Stud. 2003, 24, 451–476. [Google Scholar] [CrossRef]
  80. Dijkgraaf, E.; Gradus, R. Cost savings in unit-based pricing of household waste: The case of the Netherlands. Resour. Energy Econ. 2004, 26, 353–371. [Google Scholar] [CrossRef]
  81. Bel, G.; Fageda, X.; Warner, M.E. Is private production of public services cheaper than public production? A meta-regression analysis of solid waste and water services. J. Pol. Anal. Manage. 2010, 29, 553–577. [Google Scholar] [CrossRef] [Green Version]
  82. Shih, J.S.; Harrington, W.; Pizer, W.A.; Gillingham, K. Economies of scale in community water systems. J. Am. Water Works Assoc. 2006, 98, 100–108. [Google Scholar] [CrossRef]
  83. Zafra-Gómez, J.L.; Prior, D.; Plata-Díaz, A.M.; López-Hernández, A.M. Reducing costs in times of crisis: Delivery forms in small and medium sized local governments’ waste management services. Public Adm. 2013, 91, 51–68. [Google Scholar] [CrossRef]
  84. Filho, W.L.; Brandli, L.; Moora, H.; Kruopienė, J.; Stenmarck, Å. Benchmarking approaches and methods in the field of urban waste management. J. Clean. Prod. 2016, 112, 4377–4386. [Google Scholar] [CrossRef]
  85. Surroca, J.; Prior, D.; Tribó Giné, J.A. Using panel data DEA to measure CEOs’ focus of attention: An application to the study of cognitive group membership and performance. Strateg. Manag. J. 2016, 37, 370–388. [Google Scholar] [CrossRef]
  86. Pérez-López, G.; Prior, D.; Zafra-Gómez, J.L. Temporal scale efficiency in DEA panel data estimations. An application to the solid waste disposal service in Spain. Omega 2018, 76, 18–27. [Google Scholar] [CrossRef]
  87. Charnes, A.; Clark, C.T.; Cooper, W.W.; Golany, B. A developmental study of data envelopment analysis in measuring the efficiency of maintenance units in the US air forces. Ann. Oper. Res. 1984, 2, 95–112. [Google Scholar] [CrossRef]
  88. Tulkens, H.; Eeckaut, P.V. Non-parametric efficiency, progress and regress measures for panel data: Methodological aspects. Eur. J. Oper. Res. 1995, 80, 474–499. [Google Scholar] [CrossRef]
  89. Cullinane, K.; Wang, T. The efficiency analysis of container port production using DEA panel data approaches. OR Spectr. 2010, 32, 717–738. [Google Scholar] [CrossRef] [Green Version]
  90. Simar, L.; Wilson, P.W. Statistical inference in nonparametric frontier models: Recent developments and perspectives. In The Measurement of Productive Efficiency and Productivity Growth, 2nd ed.; Fried, H.O., Lovell, C.A.K., Schmidt, S.S., Eds.; Oxford University Press: Oxford, UK, 2008; pp. 421–521. [Google Scholar]
  91. Daraio, C.; Simar, L. Advanced Robust and Nonparametric Methods in Efficiency Analysis: Methodology and Applications; Springer: New York, NY, USA, 2007. [Google Scholar]
  92. Cherchye, L.; Demuynck, T.; De Rock, B.; De Witte, K. Nonparametric analysis of multi-output production with joint inputs. Econ. J. 2014, 124, 735–775. [Google Scholar] [CrossRef]
  93. Balaguer-Coll, M.T.; Prior, D.; Tortosa-Ausina, E. Decentralization and efficiency of local government. Ann. Reg. Stud. 2010, 45, 571–601. [Google Scholar] [CrossRef]
  94. De Witte, K.; Geys, B. Citizen coproduction and efficient public good provision: Theory and evidence from local public libraries. Eur. J. Oper. Res. 2013, 224, 592–602. [Google Scholar] [CrossRef] [Green Version]
  95. Simões, P.; De Witte, K.; Marques, R.C. Regulatory structures and operational environment in the Portuguese waste sector. Waste Manag. 2010, 30, 1130–1137. [Google Scholar] [CrossRef]
  96. R Development Core Team. R: A Language and Environment for Statistical Computing. R Foundation for Statistical Computing; R Development Core Team: Vienna, Austria, 2011; ISBN 3-900051-07-0. Available online: http://www.R-project.org/ (accessed on 15 March 2018).
  97. Wilson, P. FEAR: Frontier Efficiency Analysis with R; University of Clemson: Clemson, SC, USA, 2006. [Google Scholar]
  98. Li, Q. Nonparametric testing of closeness between two unknown distribution functions. Econom. Rev. 1996, 15, 261–274. [Google Scholar] [CrossRef]
  99. Simar, L.; Zelenyuk, V. On testing equality of distributions of technical efficiency scores. Econom. Rev. 2006, 25, 497–522. [Google Scholar] [CrossRef]
  100. Pastor, J.M.; Tortosa-Ausina, E. Social capital and bank performance: An international comparison for OECD countries. Manch. Sch. 2008, 76, 223–265. [Google Scholar] [CrossRef]
  101. Balaguer-Coll, M.T.; Prior, D. Short-and long-term evaluation of efficiency and quality. An application to Spanish municipalities. Appl. Econ. 2009, 41, 2991–3002. [Google Scholar] [CrossRef]
  102. Prior, D.; Martín-Pinillos, I.; Pérez-López, G.; Zafra-Gómez, J.L. Cost efficiency and financial situation of local governments in the Canary Isles during the recession. Revista de Contabilidad-Spanish Account. Rev. 2019, in press. [Google Scholar]
  103. Balaguer-Coll, M.T.; Ivanova-Toneva, M. La importancia de los efectos espaciales en la deuda municipal. Revista de Contabilidad-Spanish Account. Rev. 2019, 22, 61–72. [Google Scholar] [CrossRef]
  104. Ansell, C.; Boin, A.; Keller, A. Managing transboundary crises: Identifying the building blocks of an effective response system. J. Conting Crisis Manag. 2010, 18, 195–207. [Google Scholar] [CrossRef]
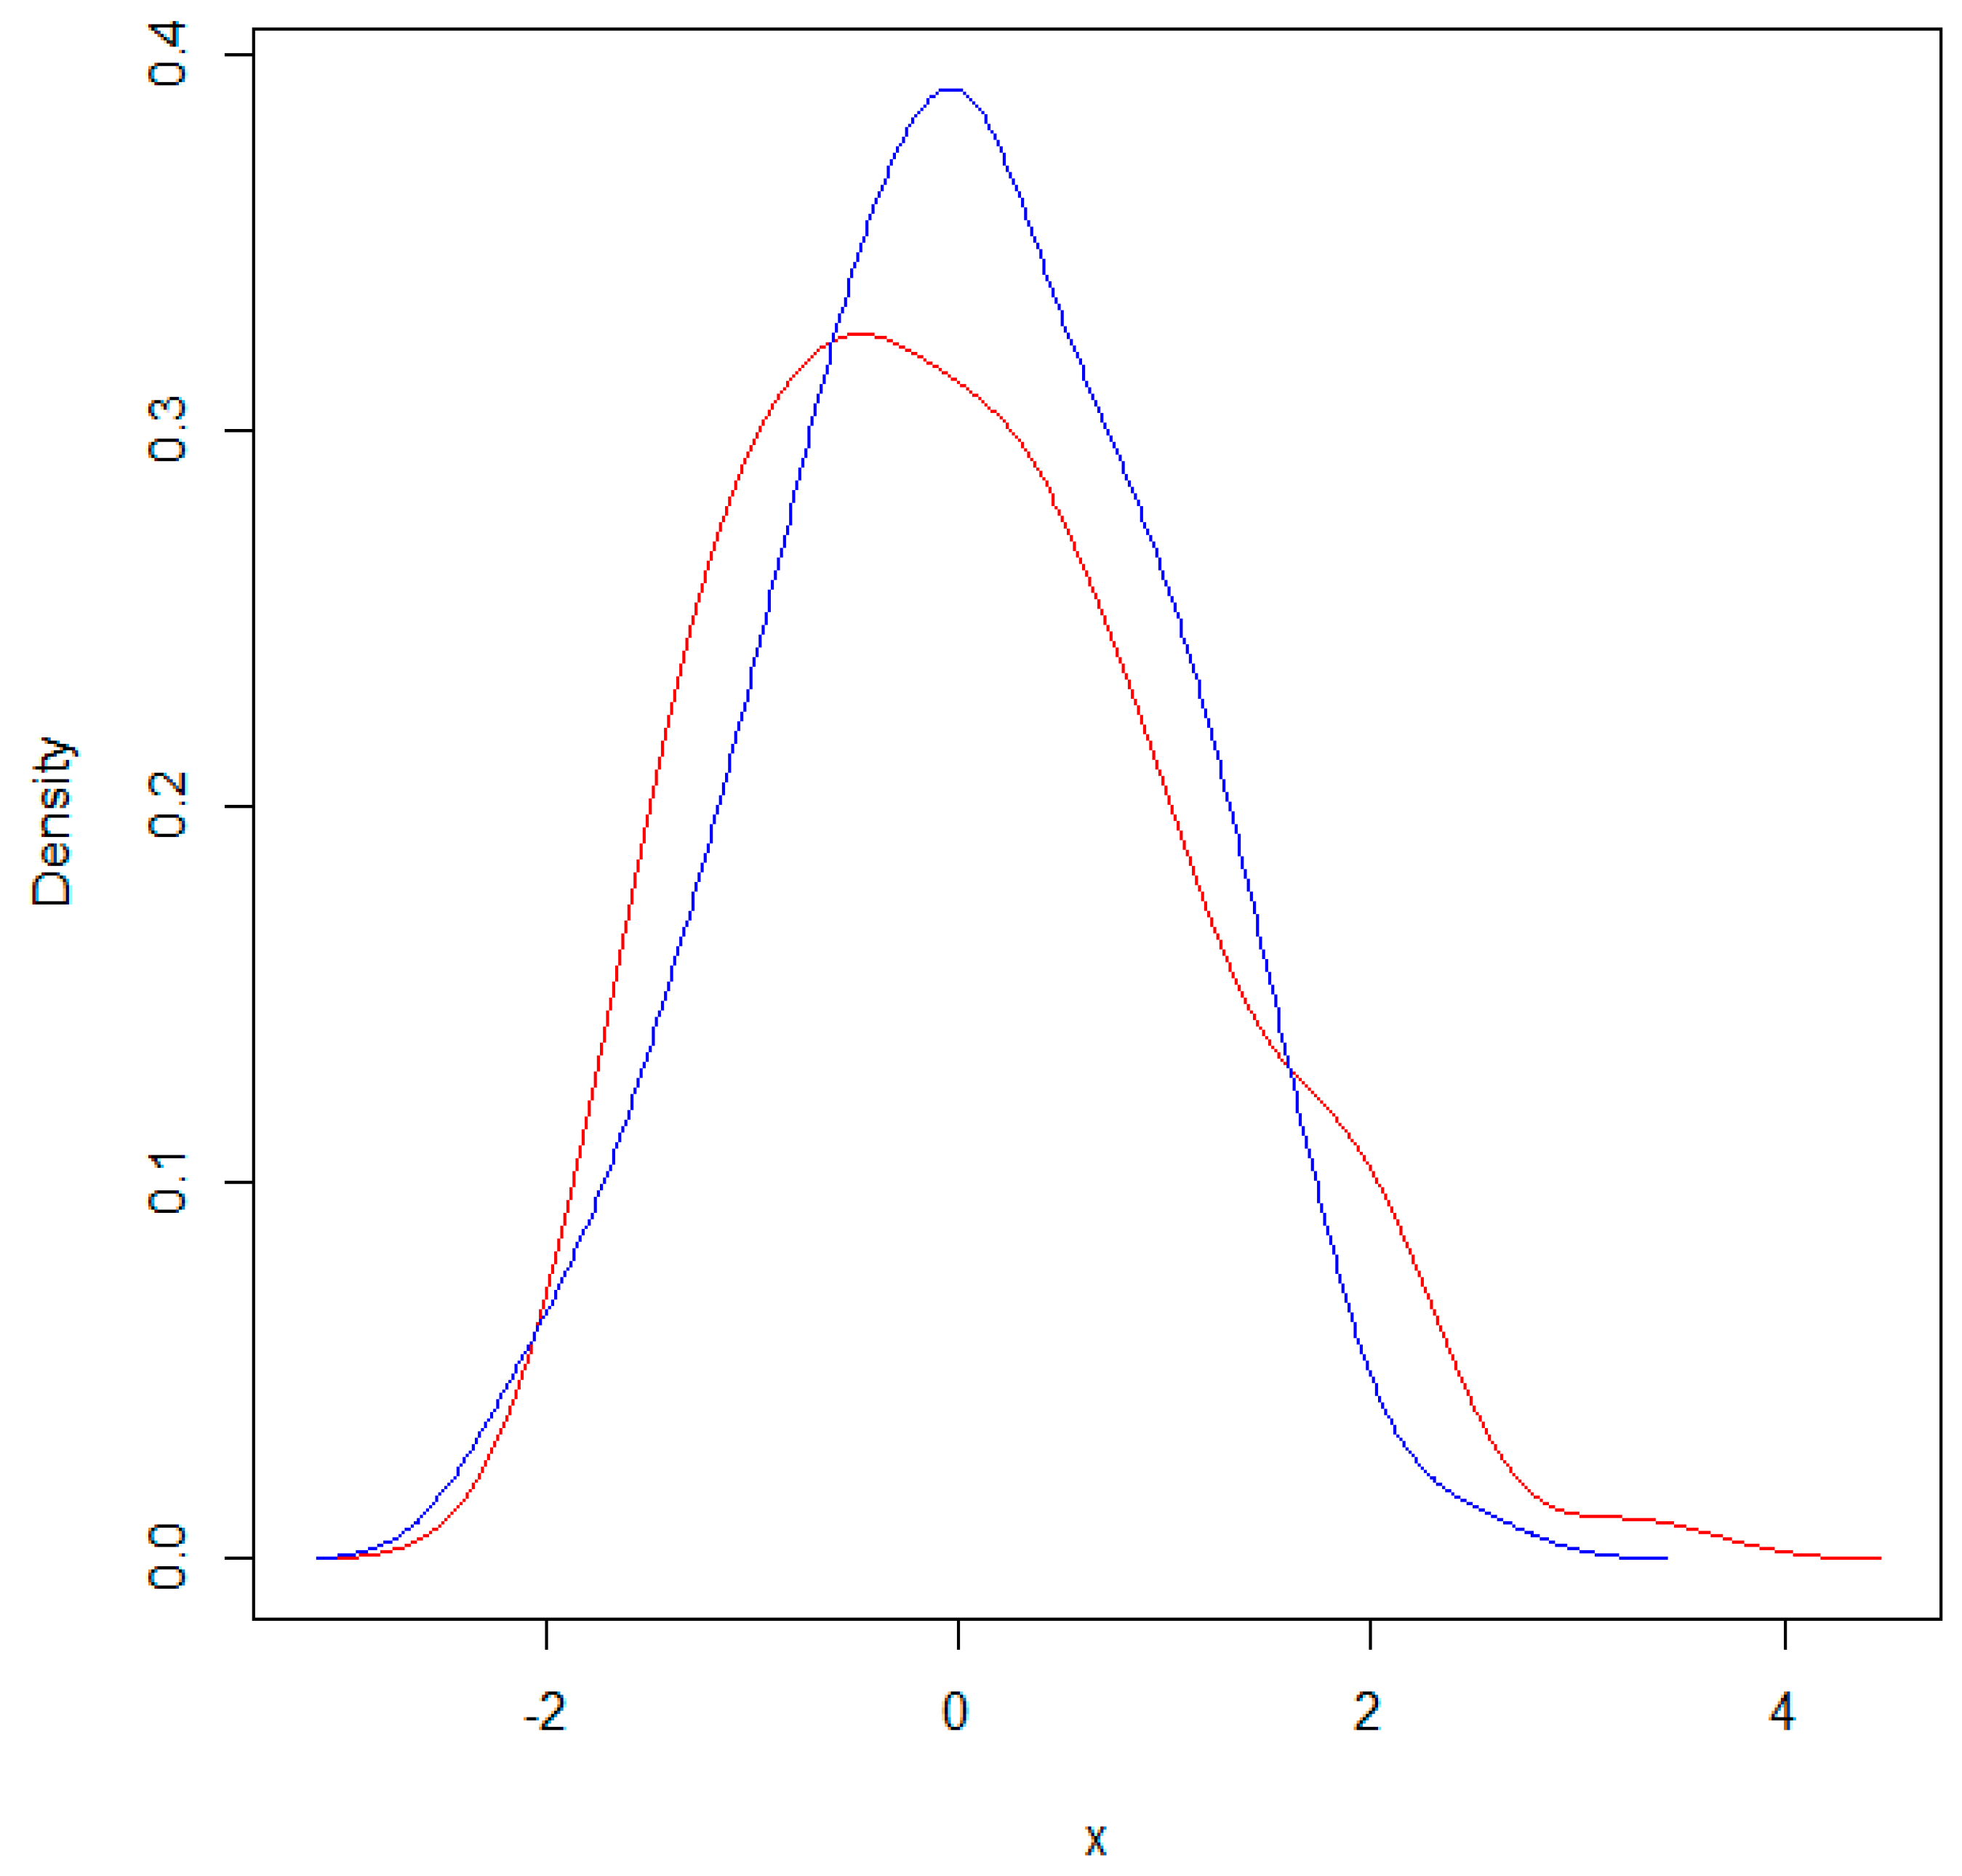
Figure 1. Density, according to management form (Li test; Red line: public management; Blue line: private management).
Sustainability 11 02056 g001
Figure 2. Mean efficiency scores for the waste collection service, by management form, 2002–2014.
Sustainability 11 02056 g002
Figure 3. Mean efficiency scores for the waste collection service, by management form and population with 1000–5000 inhabitants, 2002–2014.
Sustainability 11 02056 g003
Figure 4. Mean efficiency scores for the waste collection service, by management form and population with 5001–20,000 inhabitants, 2002–2014.
Sustainability 11 02056 g004
Figure 5. Mean efficiency scores for the waste collection service, by management form and population with 20,001–50,000 inhabitants, 2002–2014.
Sustainability 11 02056 g005
Table 1. Descriptive statistics of costs and outputs for the waste collection service in Spain, 2002–2014 by municipalities size and delivery forms (n = 164).
Public DeliveryPopulationVariableMeanMinMaxStd. Dev.
1000–5000 inhabitantsCost (euro)417,97466,349833,197234,896
Tonnes459735519,0165781
Tonnes * Quality898071137,31111,344
Containers33881583201
PopulationVariableMeanMinMaxStd. Dev.
5000–20,000 inhabitantsCost (euro)445,38968,2662,115,041310,963
Tonnes443870319,0163862
Tonnes * Quality8586140637,3117663
Containers504851299272
PopulationVariableMeanMinMaxStd. Dev.
20,000–50,000 inhabitantsCost (euro)962,845300,0001,918,332445,641
Tonnes9064457419,0165922
Tonnes * Quality17,815894337,31111,631
Containers6772501273188
Private DeliveryPopulationVariableMeanMinMaxStd. Dev.
1000–5000 inhabitantsCost (euro)544,50460,9741,361,950390,499
Tonnes8044117420,9207258
Tonnes * Quality15,253138539,20313,388
Containers27328488157
PopulationVariableMeanMinMaxStd. Dev.
5000–20,000 inhabitantsCost (euro)719,41458,4232,865,224539,759
Tonnes5598126820,9203779
Tonnes * Quality10,716253739,2037301
Containers340211467220
PopulationVariableMeanMinMaxStd. Dev.
20,000–50,000 inhabitantsCost (euro)1,330,167183,6493,530,963578,238
Tonnes11,820125520,9204718
Tonnes * Quality22,945251039,2038648
Containers636613101523
Table 2. Descriptive statistics of efficiency scores for the waste collection service in Spain with public direct provision, 2002–2014 (n = 56).
YearMeanMedianMin.Max.Std. Dev.
20020.4710.4690.09610.246
20030.4320.4210.06710.234
20040.3890.3630.06210.241
20050.3400.3110.0610.9020.210
20060.4270.3850.08410.278
20070.3820.3460.0550.9650.234
20080.3480.3140.0680.8900.212
20090.3070.2610.06510.205
20100.3480.2890.05710.229
20110.2680.2310.05310.209
20120.2500.2080.0530.9950.179
20130.2680.1710.05210.222
20140.2640.1730.0431.0010.238
Table 3. Descriptive statistics of efficiency score for the waste collection service in Spain with private provision, 2002–2014 (n = 108).
YearMeanMedianMin.Max.Std. Dev.
20020.3690.2710.0551.0250.291
20030.3040.2160.05210.245
20040.2520.1790.0380.9310.203
20050.2390.1490.03310.212
20060.2230.1790.03910.172
20070.2030.1430.03210.181
20080.1830.1660.0200.6930.141
20090.2200.1570.03010.227
20100.1750.1370.02210.173
20110.1440.1220.0300.6040.102
20120.1430.1080.0180.9120.139
20130.1450.1220.0261.0010.127
20140.1390.1150.0240.7650.102