1. Introduction
In recent years, global warming has intensified and the need to reduce energy consumption and CO
2 emissions has increased [
1,
2]. Rising temperatures due to urbanization, i.e., urban heat island (UHI) effect, are aggravating [
3,
4,
5,
6,
7,
8]. The loss of comfort increases the energy consumption for cooling during the summer in urban spaces [
9,
10]. Therefore, it is important to reduce the cooling demand and improve the thermal environment in urban areas to save energy and mitigate the impacts of global warming.
The introduction of green roofs is a strategy that can improve the urban thermal environment and reduce energy consumption for cooling [
11,
12,
13,
14,
15,
16,
17]. Although urban vegetation is known to be effective for temperature reduction through transpiration, there is a limited space for on-ground greening of urban areas [
18,
19]. Thus, in recent years, roof greening has become an attractive alternative.
As mentioned above, improvement of the urban thermal environment is an important issue linked to the measures being taken against global warming, and hence, it needs to be incorporated into the environmental policy of the local government. Therefore, it is necessary to quantify the effect not only on a building scale, but also on the urban scale when it is introduced to a large number of buildings. A decision support system has been developed to evaluate the measures against UHI by land use planning [
20], and the UHI effect of urban green areas can also be evaluated. However, this system does not include building-scale measures, such as the introduction of green roofs. Therefore, there is an urgent need to establish a method to understand the UHI mitigation effect on an urban scale when building-scale measures are widely applied.
Many existing studies on green roofs are based on actual observations conducted by installing test specimens on the roof surface. For example, Takebayashi and Moriyama [
21] observed the surface temperature, net radiation, water content ratio, etc., of green roof specimens installed on a building rooftop and investigated the estimation method for the sensible heat flux from the roof surface. Ayata et al. [
22] measured sensible heat fluxes on a green roof under different environmental conditions by using an experimental laboratory setup. Huang et al. [
23] compared the reductions in temperature and heat amplitude achieved by adopting four types of extensive green roofs. Coutts et al. [
24] compared the insulating properties, radiation, and surface energy balance of four experimental rooftops, including a green roof planted with sedum. Collins et al. [
25] measured the thermal conductivity and equivalent thermal resistance of the green roof system during winter conditions to understand how green roofs affect building energy performance under cold climatic conditions. Dvorak et al. [
26] monitored the temperatures and soil water content of three types of plants and one unplanted control module to understand rooftop temperature reductions of unirrigated green roofs. Jiang et al. [
27] evaluated the thermal performance of extensive green roofs to understand the temperature reduction and heat flux of extensive green roofs combined with night ventilation by using experimental cells installed on a building rooftop. In these studies, although detailed observations of heat flux and surface temperature could be conducted at this scale, determining factors such as the cooling energy consumption and resulting CO
2 emissions is difficult. Thus, it is a challenge to directly link their results with the evaluation of policies from the aforementioned perspective of measures to address global warming. There are also studies on the quantification of the effect of green roofs based on actual measurements of various buildings where green roofs have actually been introduced; examples of such buildings are a low-rise commercial building in Singapore [
28], a complex public/private facility “Acros Fukuoka” in Japan [
29], the Climate Change Research Hall of National Institute for Environmental Studies in Japan [
30], an office building located at the Gardeny Science and Technology Park in Spain [
31], the Nicholas J. Pirro Convention Center in New York [
32], and the buildings of universities and a private company in Hong Kong [
33]. The energy savings effect of green roofs has also been evaluated on a building scale, using air conditioning load calculation, by air conditioning load calculation being linked to observation results [
27,
34]. However, these studies are limited to the evaluation of a single or at most several buildings. In many cases, the outside air temperature of the surrounding atmosphere in the urban block hardly changes by the greening of a few buildings. Therefore, using such measurements to quantify the effect of green roofs on multiple buildings for the adoption of future policies has limitations in that they cannot provide findings that could contribute to decision-making by local governments.
The evaluation of large-scale effects requires urban district-scale simulations of the studied thermal environment. Many studies have already been conducted on the development of models to simulate the microclimate in urban canopies such as: the urban canopy parameterization (UCP) with building energy model (BEM) [
35,
36], the canopy interface model (CIM) with CitySim [
37], the weather research and forecasting (WRF) model coupled to a multilayer building energy scheme [
38], the WRF with the urban canopy model [
39], the coupled urban canopy and building energy model (CM-BEM) [
40,
41,
42,
43,
44,
45,
46,
47], architectural-urban-soil-simultaneous simulation model (AUSSSM) [
48,
49], the urban climate simulation system (UCSS) [
50,
51]. Surface energy balance measurements in an urban canopy and estimations of the anthropogenic heat release have also been conducted with a modeling perspective [
52]. Simulations linking local meteorological models and air-conditioning loads have already been conducted, as well as evaluations of UHI mitigation and reduction of energy consumption for space cooling by green roofs [
39,
40,
41,
42,
48,
49,
50,
51].
To calculate energy consumption other than through air-conditioning load calculation, we proposed a technique that combines intensity and temperature sensitivity methods [
53]. This technique can be used to quantify the effects of green roofs on air-conditioning energy consumption. However, only the changes in outdoor temperatures can be estimated by this method, not the changes in building surface temperature. Therefore, the most realistic approach to estimate the effects of green roofs on the energy consumption of air conditioners is the simulation-based evaluation using air-conditioning load calculation.
The local climate and weather conditions have a significant effect on this type of evaluation. The results depend on the type of greening and the building structure. In many cases of simulation-based evaluation at the district scale [
39,
40,
41,
42,
48,
49,
50,
51], surface wetness is parameterized as a fixed value of evaporation efficiency, evaporation ratio, and water vapor transfer conductance. Latent heat flux is calculated from the set parameters, and atmospheric and surface conditions. Calculations are generally performed without considering the amount of water and assuming that evapotranspiration continues indefinitely. However, in many cases, there are constraints on the water supply of a closed environment of a building rooftop. Therefore, the amount of water needed for evapotranspiration should be quantified to evaluate the effectiveness of green roofs under these conditions.
Latent heat flux can be regarded as a function of evapotranspiration. Thus, if irrigation is performed, the amount of water can be converted and quantified as heat. Since the volumetric heat capacity of air is regarded as a known quantity, we assume that the sensible heat flux decreases by the same amount that the latent heat flux increases. It is also assumed that the temperature reduction effect in response to the amount of watering depends only on atmospheric diffusion. We have previously derived a relationship between on-ground watering and temperature [
54] at the scale of a few kilometers using a mesoscale meteorological model. However, the study did not provide detailed data on the temperature reduction effect at the district scale. In addition, our previous research [
54] focused only on on-ground watering and did not cover the effects of green roofs and accompanying reduction in cooling energy. Many previous simulations did not consider the amount of water used, despite building roofs being mostly under closed conditions, where water is supplied through an irrigation system. Therefore, to properly evaluate the mitigation effects of green roofs in an urban thermal environment, it is necessary to conduct a detailed evaluation that combines air/surface temperature, surface heat balance, and supplied amount of water.
If the green roof is irrigated, the environmental load incorporates several new factors, such as energy consumption to power the water pumps. However, there is a limited amount of research that focus on the environmental load of green roofs.
Given this background, the purpose of this study was to quantify the effectiveness of green roofs in office building districts to mitigate UHI and CO
2 emissions. For that, a simulation of the urban thermal environment considering water volume for evapotranspiration and irrigation was performed. In many previous studies, surface wetness has been parameterized as a constant value, and simulations were conducted assuming that evaporation continues indefinitely in accordance with the atmospheric conditions [
39,
40,
41,
42,
48,
49,
50,
51]. However, a building rooftop is a relatively closed environment in comparison with natural environments. Thus, the amount of water supplied through irrigation and precipitation often act as a constraint for evapotranspiration. Therefore, the supplied amount of water needed to be estimated for a more realistic evaluation. Additionally, in many previous simulations, the results depended on given parameters of surface wetness, such as evaporation efficiency. However, since latent heat flux is a function of the amount of water alone, it is possible to derive a clearer physical relationship by directly linking the amount of water used for evapotranspiration to the latent heat flux. In addition, by analyzing the amount of watering, it is possible to add factors, such as CO
2 emissions from powering the pumps and the use of tap water, to the items being examined. Therefore, the originality of this research lies in the evaluation of the green roof effects by quantifying the evapotranspiration using latent heat flux and considering the necessary amount of watering. We calculated the CO
2 emissions from irrigation in a previous study [
43], where the surface wetness was expressed by a given parameter of water vapor transfer conductance, but the validation was not complete. Therefore, in this study, we first modified the calculations of the previous report [
43] based on observations of the rooftop of an office building [
30]. Next, we evaluated the relationship between the amount of evapotranspiration and the cooling effect. Further, by conducting numerical experiments under various conditions, the UHI mitigation and CO
2 reduction due to green roofs were quantified.
2. Calculation Conditions
The CM-BEM [
40,
41,
42,
43,
44,
45,
46,
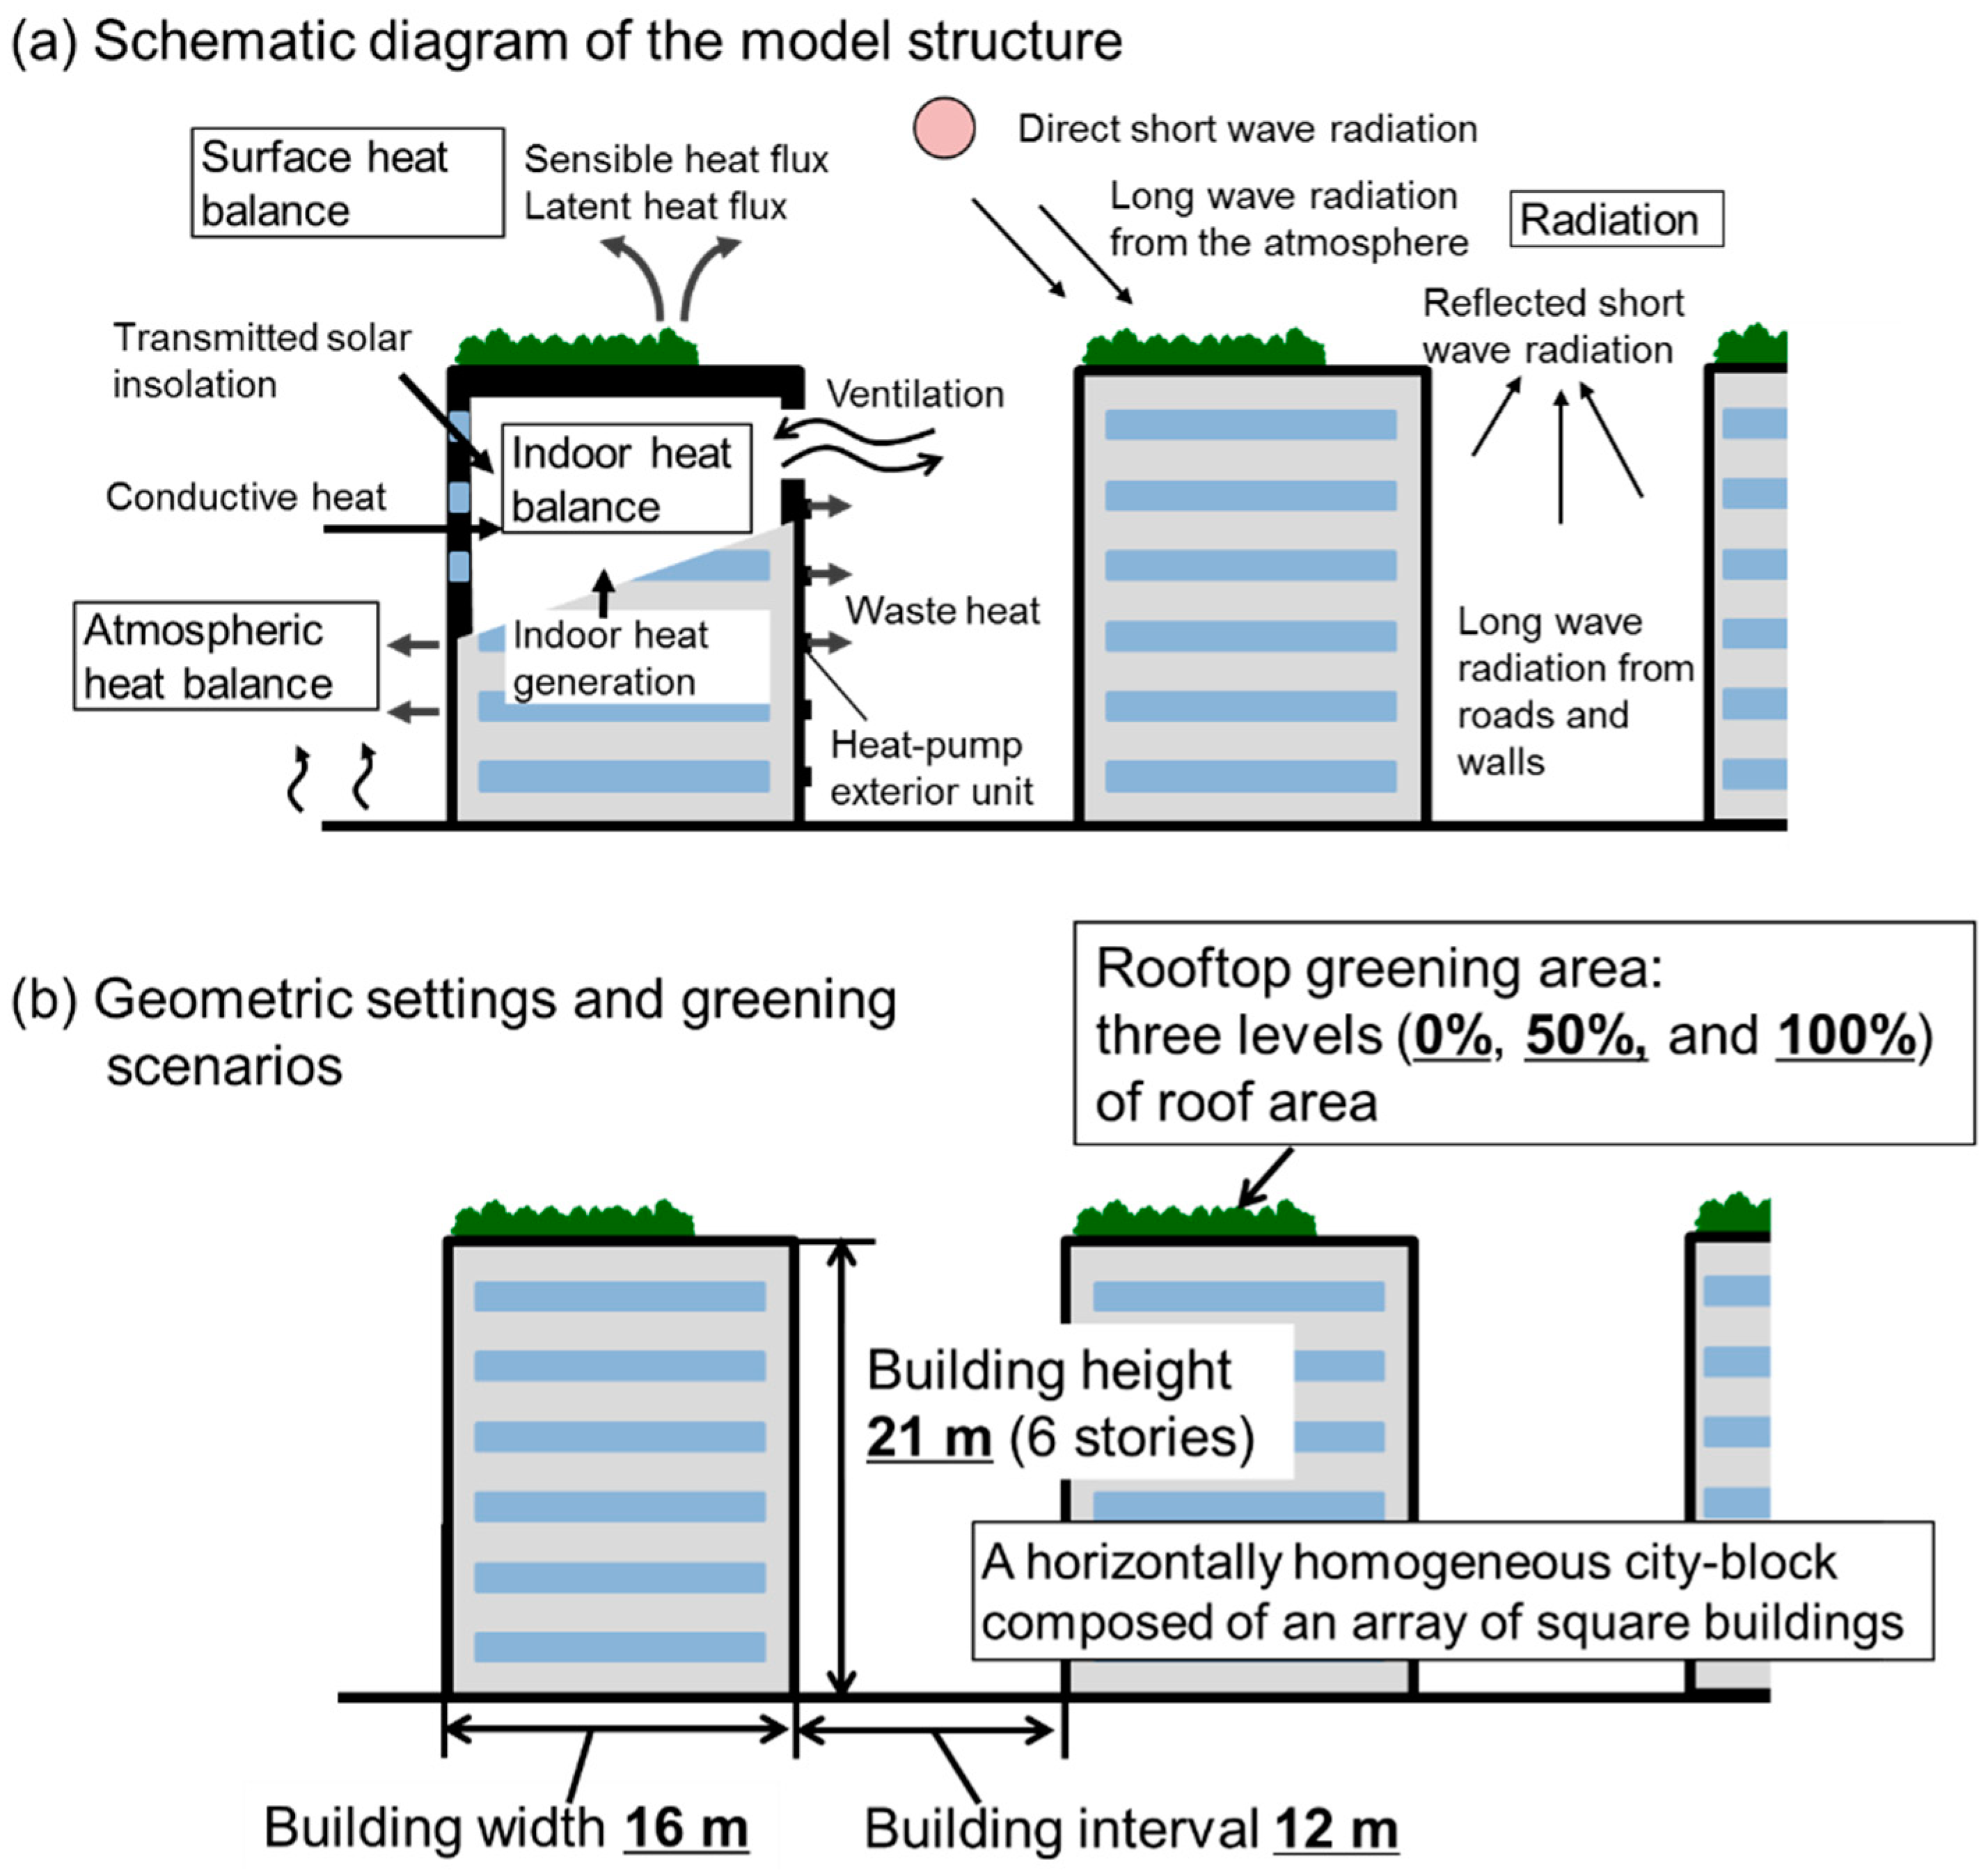
47] was used in this study to predict the heat load of the buildings in urban districts, the energy consumption by air-conditioning, and the air temperature variations. The urban canopy model (CM) is a local meteorological model that expresses a horizontally homogeneous city-block composed of an array of square buildings as multiple one-dimensional vertical layers. The model considered the following parameters: average building width, building interval, and vertical distribution of building density. The building energy model (BEM) calculates air-conditioning loads. Air-conditioning loads that include interaction with the outside atmosphere in a city-block scale can be calculated by combining both models.
In our previous study [
43], the conductance in the vegetation surface was set as a constant value. Based on that and on atmospheric conditions, the evaporation efficiency was calculated. However, in practice, it was difficult to obtain precise vegetation conductance values on green roof surfaces that are being watered. Therefore, in this study, the model was modified so that the evaporation efficiency on the green roof surface is constant based on the measurement results [
30] (except for the low evaporation efficiency condition in
Section 5).
Evaporation efficiency can be estimated from the following bulk equations [
30]:
where,
H: sensible heat flux;
lE: latent heat flux;
cp: specific heat of air;
ρ: air density;
Ta: air temperature;
Ts: surface temperature;
U: wind speed;
qSAT: saturation specific humidity for the surface temperature;
q: specific humidity of the air;
CH: bulk transfer coefficients for sensible heat flux;
CE: bulk transfer coefficients for latent heat flux; and
β: evaporation efficiency. The latent heat flux was estimated based on the time change of the weight of the greening sample. The sensible heat flux was estimated based on the Bowen ratio, which was calculated from the temperature and humidity observed at two points with different heights. Moreover, evaporation efficiency
β was calculated from the ratio between the bulk transport coefficient of sensible heat and latent heat (
CE/
CH). As a result, the evaporation efficiency was generally stable (approximately 0.2). Therefore, the evaporation efficiency was set as a constant value of 0.2 in this study. This constant value implies that the wet state of the surface is maintained through watering. We calculated the amount of water based on the latent heat flux obtained from the heat balance calculation.
Figure 1 shows the district model evaluated in this research. Three levels of roof greening were considered: 0% (no greening), 50%, and 100%. In addition, details such as the wall surface structure, operation schedule of air conditioner, composition of heat source equipment, bodily heat production, and equipment (other than air conditioner) heat production were based on the parameters for a typical office district simulation by Kikegawa et al. [
40], and Hirano and Fujita [
42] (
Table 1).
The calculations were performed on 8–10 August 2002, a period of consecutive fair-weather summer days in Tokyo. The first two days were considered a run-up calculation period, and the third day was used for the analysis. The CO2 emission intensity was 0.371 (kg-CO2/kWh] for electric power and 2.08 (kg-CO2/m3] for city gas. The heat production per volume was set as 44.8 (MJ/m3).
The electric power sensitivity to temperature was verified through comparison with power supply data [
45]. Reproducibility was ensured through comparison with air-conditioning load calculation software for homes [
40]. In addition, for the condition assumptions, reproducibility of outdoor weather elements was verified through meteorological observations in the district [
46]. We conducted a cross-comparison between the energy consumption estimation method [
53] and the air-conditioning load calculation using CM-BEM, and no major deviations were observed [
55].
3. Evaluation of UHI Mitigation Effect
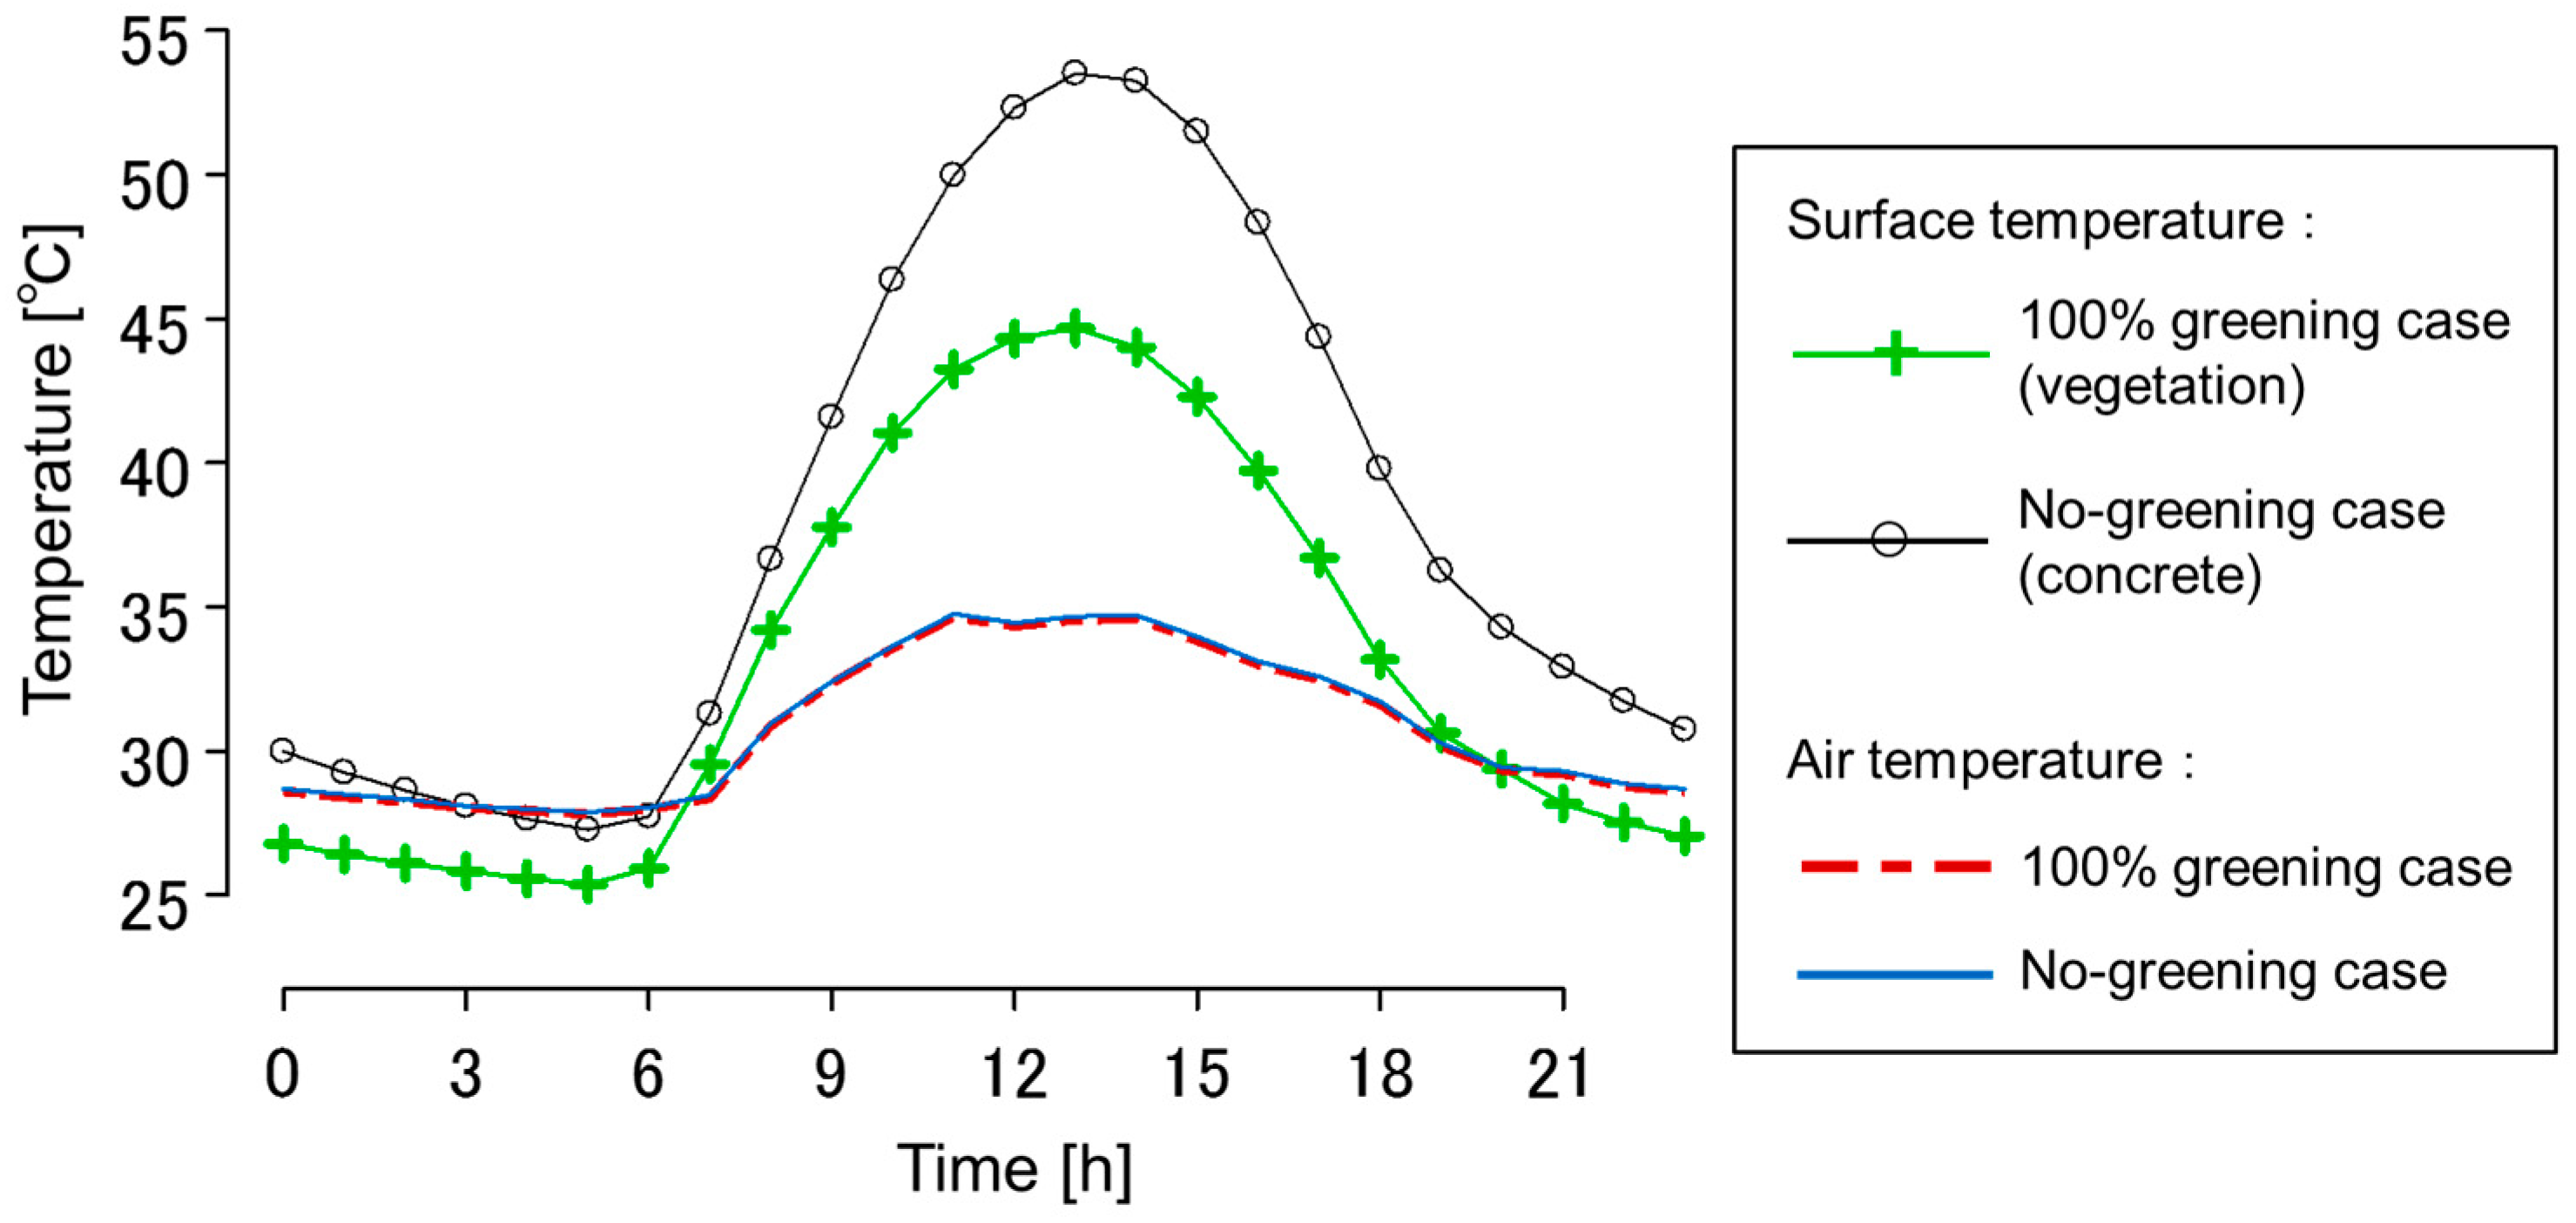
Figure 2 depicts the diurnal variation patterns of the rooftop surface temperature calculated under the assumed conditions for the no-greening (concrete) and 100% greening cases. For comparison, air temperature at the rooftop level is also depicted. The values of air temperature almost overlap each other. The maximum air temperature difference between the two cases was 0.13 °C, which is extremely small compared with the surface temperature differences. As seen in
Figure 2, a temperature difference of around 10 °C between the surfaces occurs during the day. There was a significant temperature reduction on green roofs. In contrast with the vegetated surface, the temperature of the concrete surface constantly exceeded the air temperature at night, except for a very short period in the early morning, mainly due to the amount of heat stored during the daytime. The vegetation surface had a consistently lower temperature than the air temperature at night because of the differences in the radiative cooling effect.
A similar examination was conducted for the 50% greening case. The concrete surface in the 50% greening case almost matched the no-greening case, and the vegetation surface almost matched the 100% greening case. The differences in daily averages were less than 0.1 °C (the graph is not shown). Air temperature and humidity near the rooftop varied when the area over which the roof greening was introduced. Therefore, there were some differences in the surface temperature, but the effect was extremely small compared with the total variation in surface temperature.
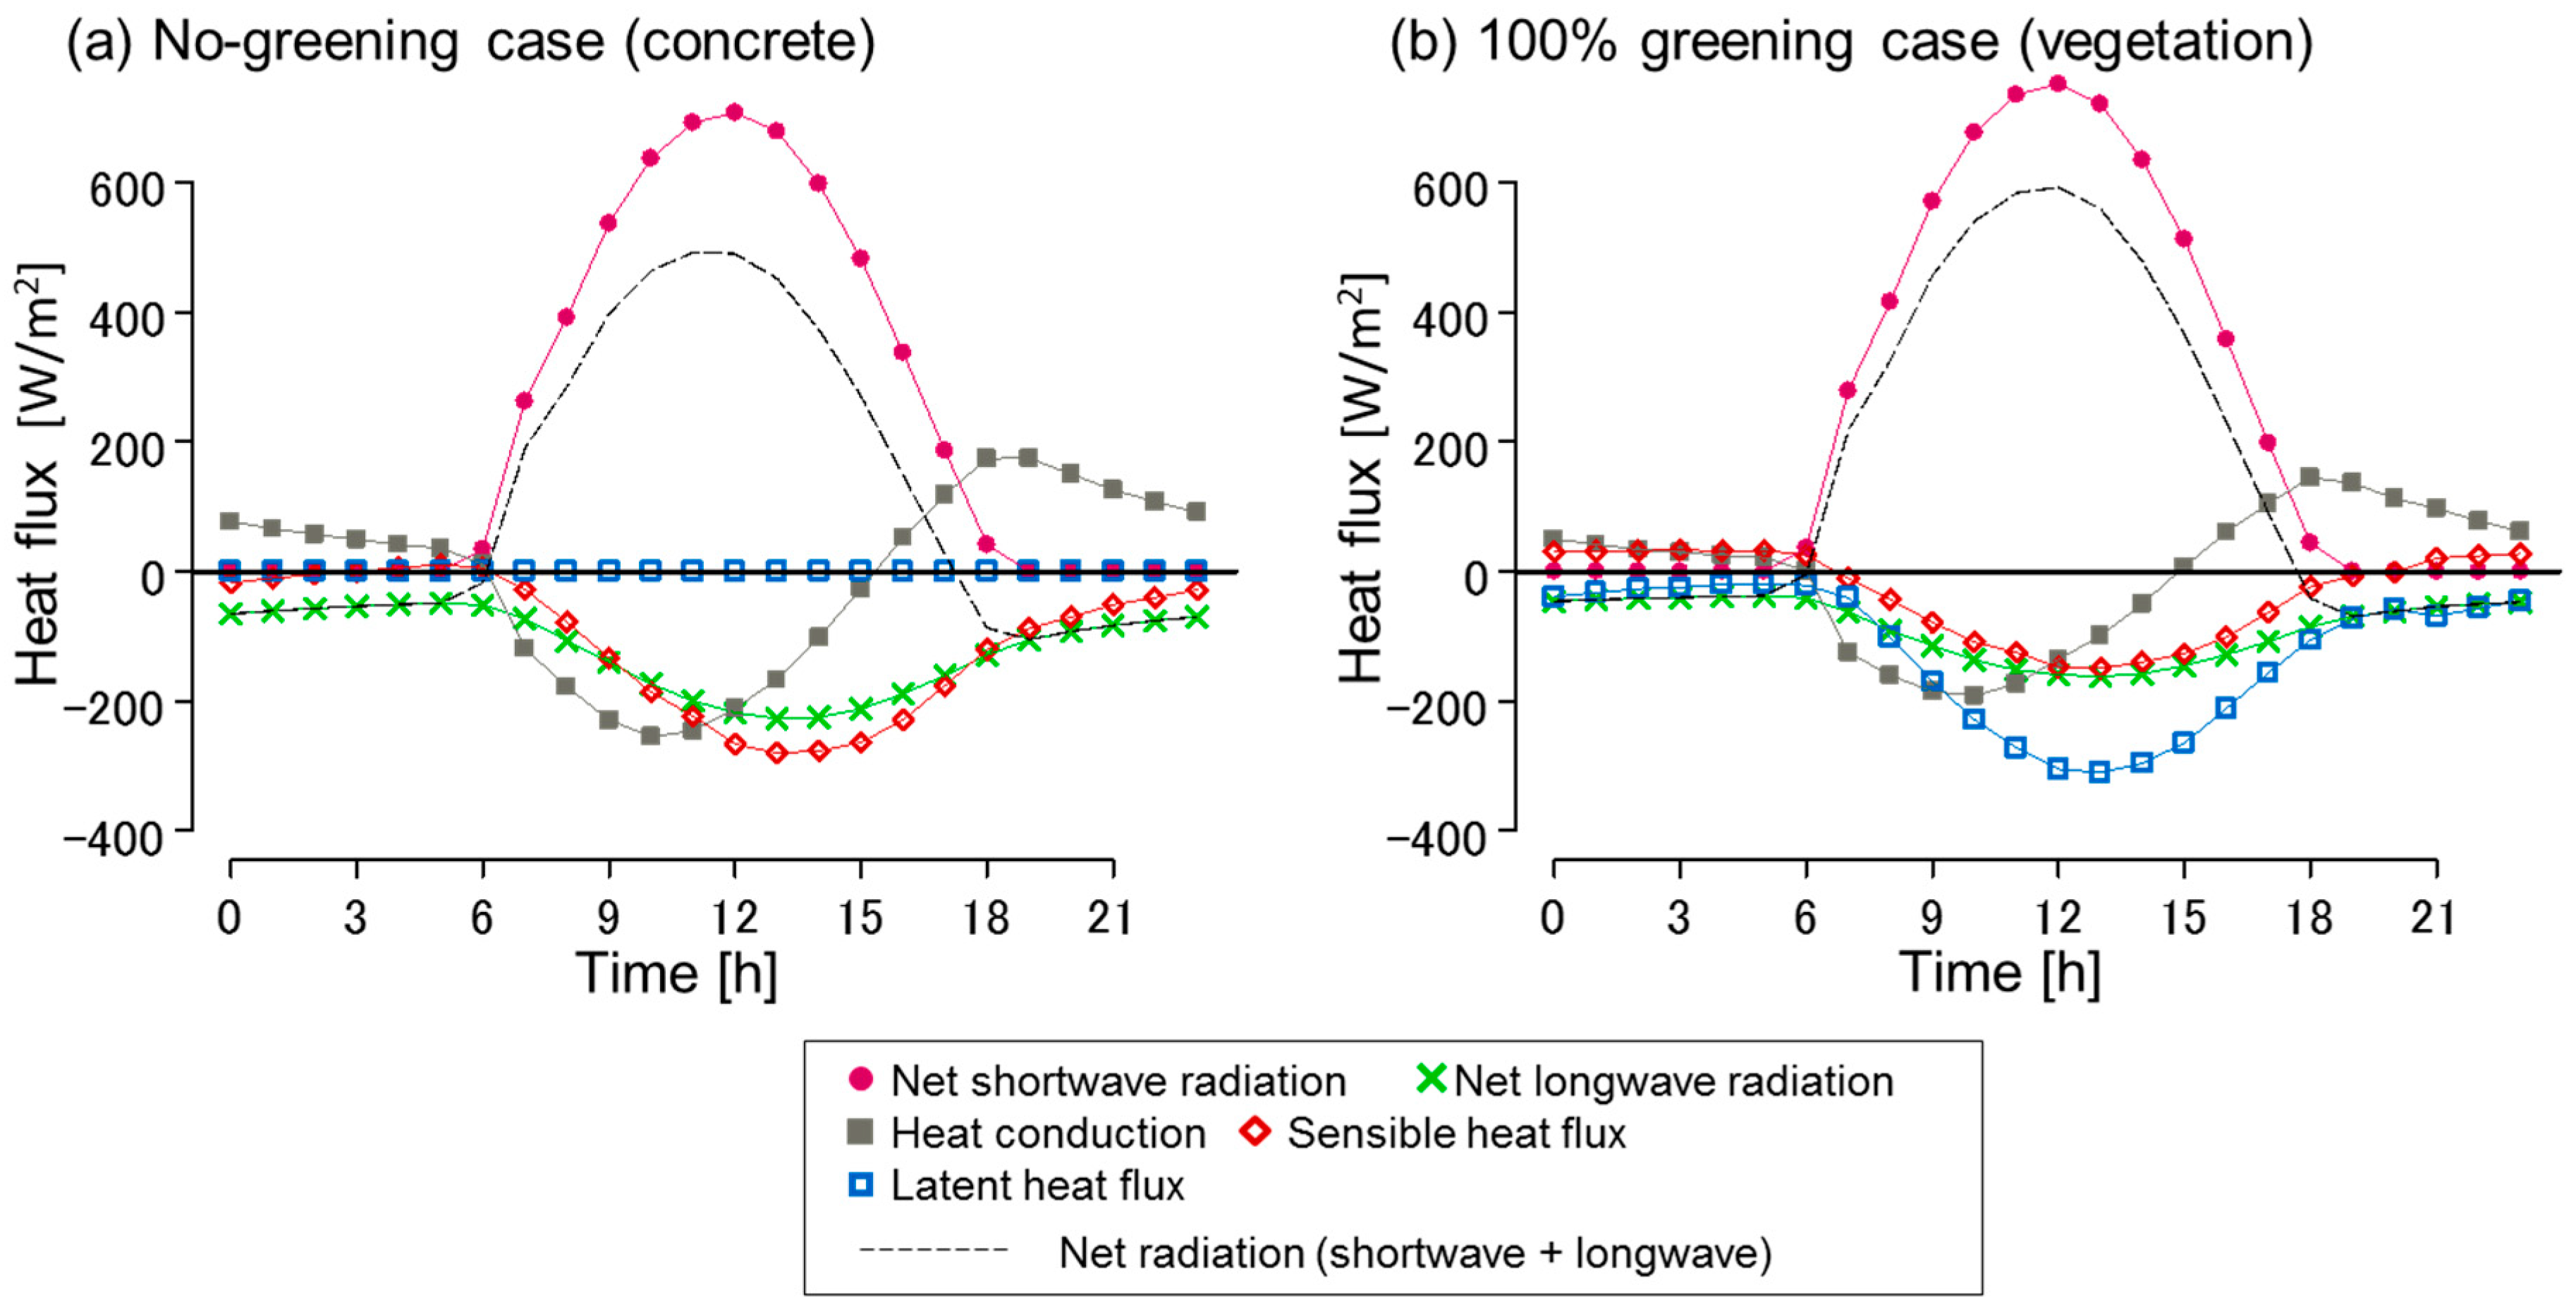
The roof surface heat balance was plotted for the no-greening and 100% greening cases (
Figure 3). Positive values were assumed for the direction in which heat enters the surface. The graph shows that, in the 100% greening case, about half of the net radiation was released into the atmosphere as latent heat flux. In the 50% greening case, the same examination conducted for the vegetation and concrete surfaces showed that the vegetation surface matched well with the 100% greening case, and the concrete surface matched well with the no-greening case.
The measurements taken by the authors on a roof surface with sedum greening demonstrated that during the day, the evaporation efficiency was 0.2, and the latent heat flux was 300–400 W/m
2. In addition to that, the Bowen ratio was 0.5 [
30]. Naturally, the surface heat balance depends on weather conditions, but the latent heat flux and the Bowen ratio roughly match
Figure 3b. Even if the comparison was done against a heat balance simulation of the Earth’s surface [
56,
57], the results shown in
Figure 3b are still valid.
In numerical experiments, the evaporation efficiency was varied in regular intervals using a mesoscale meteorological model. Almost all of the net radiation was released into the atmosphere as latent heat flux when the evaporation efficiency exceeded 0.5 (fair summer weather conditions) [
54]. The results were highly dependent on the wetness of the surface.
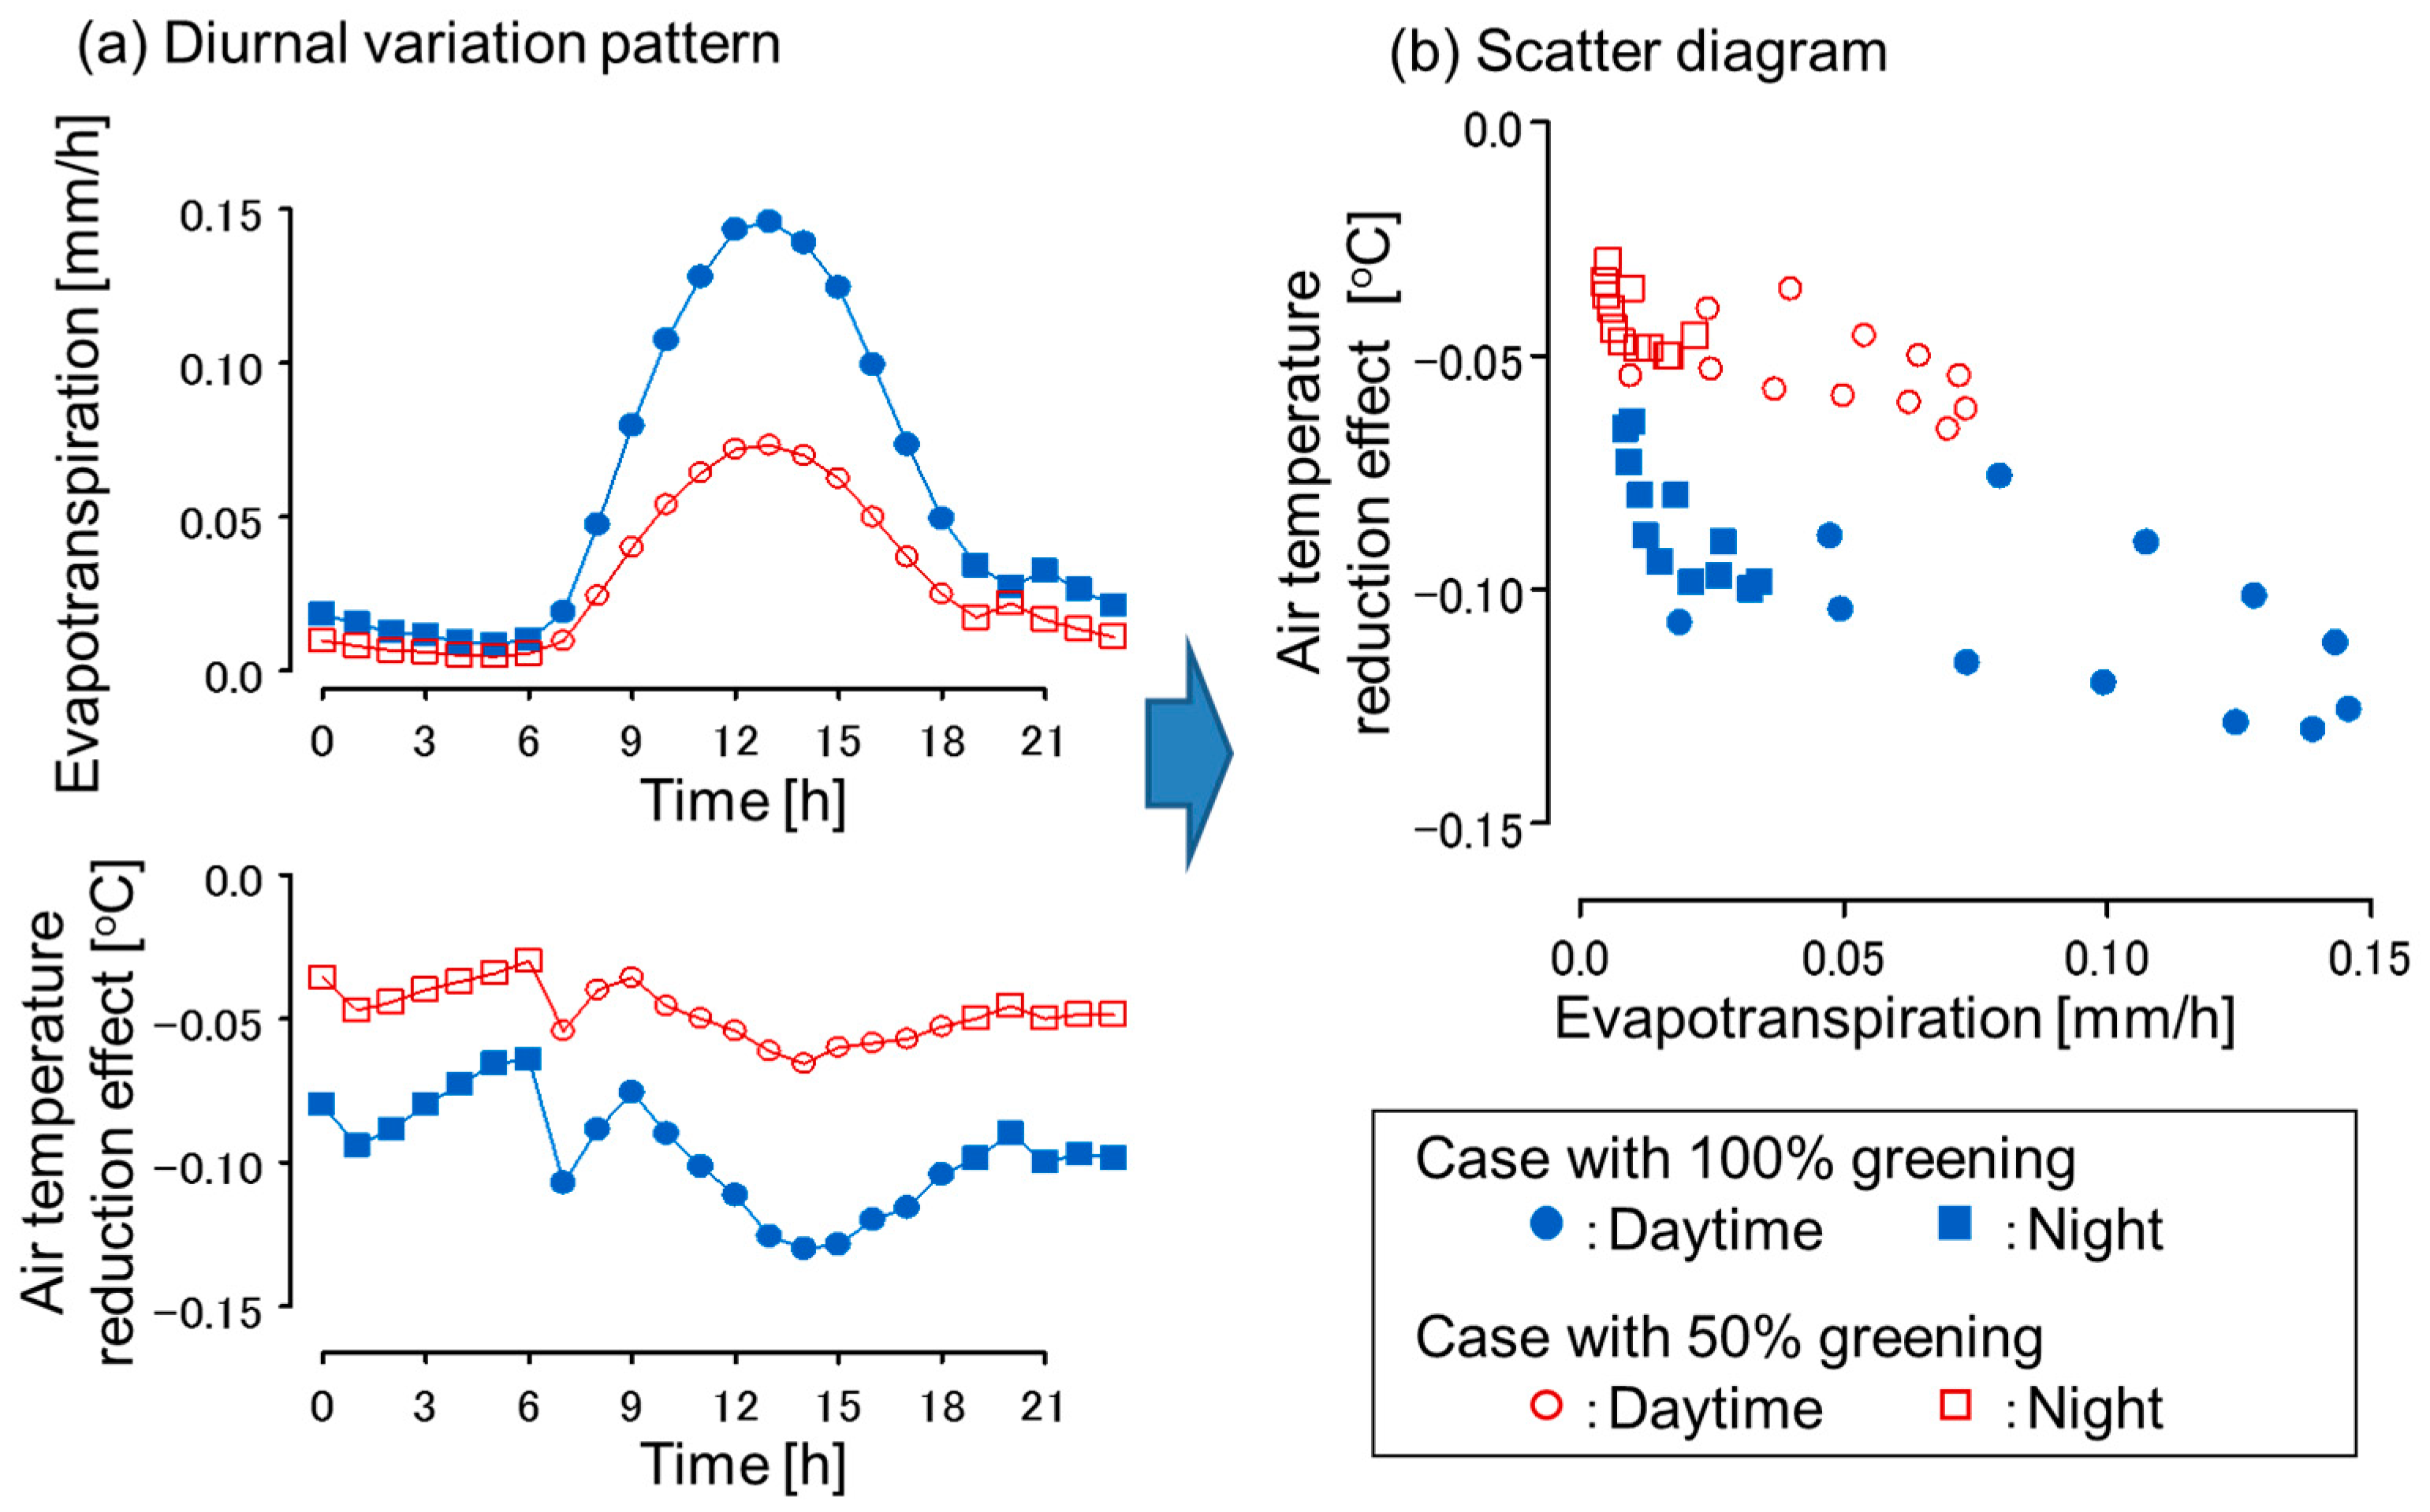
The relationship between the results for evapotranspiration and the air temperature reduction effect is shown in
Figure 4. The period from 7 a.m. to 6 p.m. was designated as “day”, and from 7 p.m. to 6 a.m. as “night”. The air temperature reduction effect was calculated using the differences between the cases, which were based on average air temperature of all layers from the ground to the rooftop in the urban canopy. However, even during the day in the 100% greening case, the maximum temperature reduction effect was 0.13 °C, which is small compared to the total variation in air temperature. These results are consistent with those obtained by Santamouris [
12], who reviewed a large number of studies and concluded that, although the temperature reduction effect of green roofs varies, greatly depending on regional conditions and other factors, when green roofs are installed in high-rise buildings, the effect on the surrounding air temperature can be almost negligible.
The amount of evapotranspiration was calculated using the latent heat flux shown in
Figure 3. The amount of water needed per building was 1.1 (m
3/d) in the 100% greening case and 0.55 (m
3/d) in the 50% greening case. The evapotranspiration per district area was 1.34 (mm/d) for the 100% case, and 0.71 (mm/d) for the 50% case. The numbers of evapotranspiration values for the entire district are shown in
Figure 4. The comparison between the cases in
Figure 4 show that the air temperature effect in the 100% greening case was twice the decrease in the 50% greening case at all times. As latent heat flux is a function of evapotranspiration alone, the results showing that the temperature reduction effect varies almost in proportion with evapotranspiration are valid.
If results from different times are compared within the same case, the relationship will not necessarily be proportional because atmospheric diffusion varies each hour, and the temperature reduction analysis includes the effects up to the previous time. In
Figure 4, evapotranspiration and temperature reduction effect were high during the day. However, there was a tendency for the temperature reduction effect per evapotranspiration to be smaller than at night because although evapotranspiration is greater during the day, the surrounding air can more easily diffuse away.
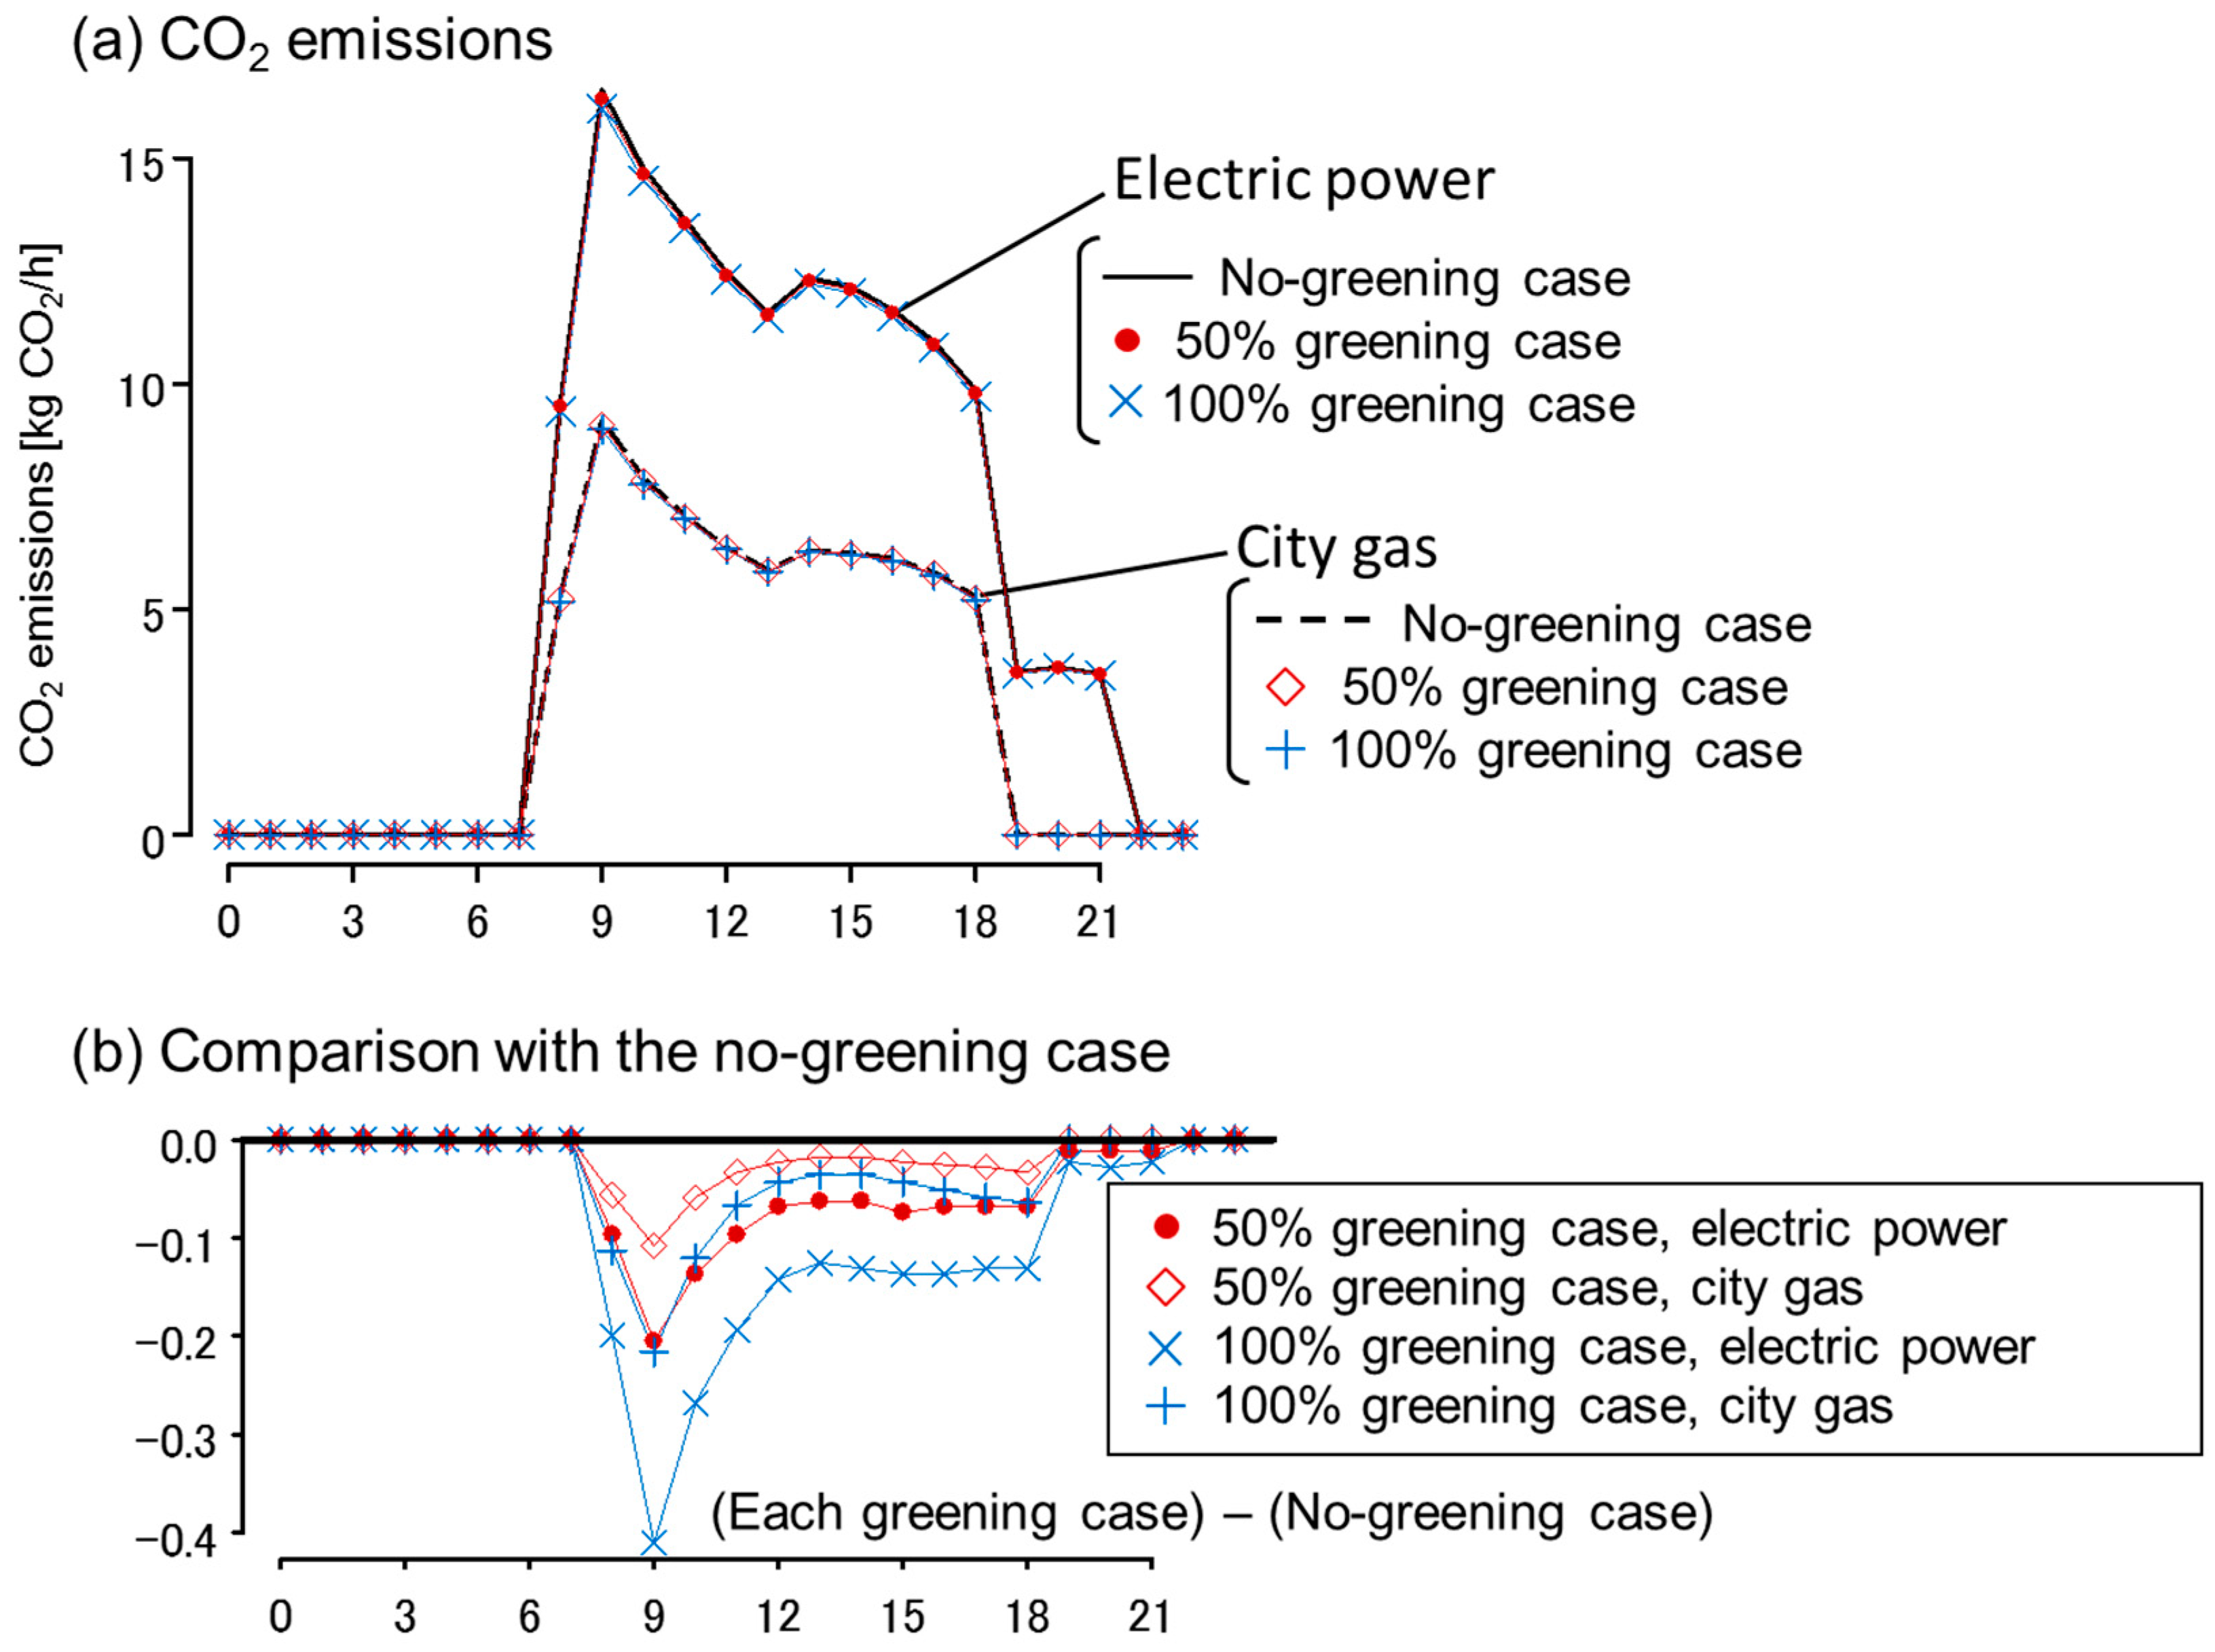
4. Evaluation of the CO2 Reduction Effect
To evaluate the CO
2 reduction effect of roof greening, CO
2 emissions due to energy consumption for space cooling in each case, and the differences between the cases (greening and no-greening cases) were plotted in
Figure 5. This figure shows the average value of CO
2 emissions for the entire district. There was a peak in CO
2 emissions and a peak in CO
2 reduction by greening in the morning when the cooling load in the office was high. In terms of daily accumulated values, the CO
2 reduction effect (the differences between the greening and no-greening cases) was 2.93 (kg-CO
2/d) in the 100% greening case, and 1.47 (kg-CO
2/d) in the 50% greening case. The maximum CO
2 reduction effect was 1.4% in the 100% greening case. The studied cases consider six-floor buildings. Therefore, for the entire building, the reduction effect is not necessarily large.
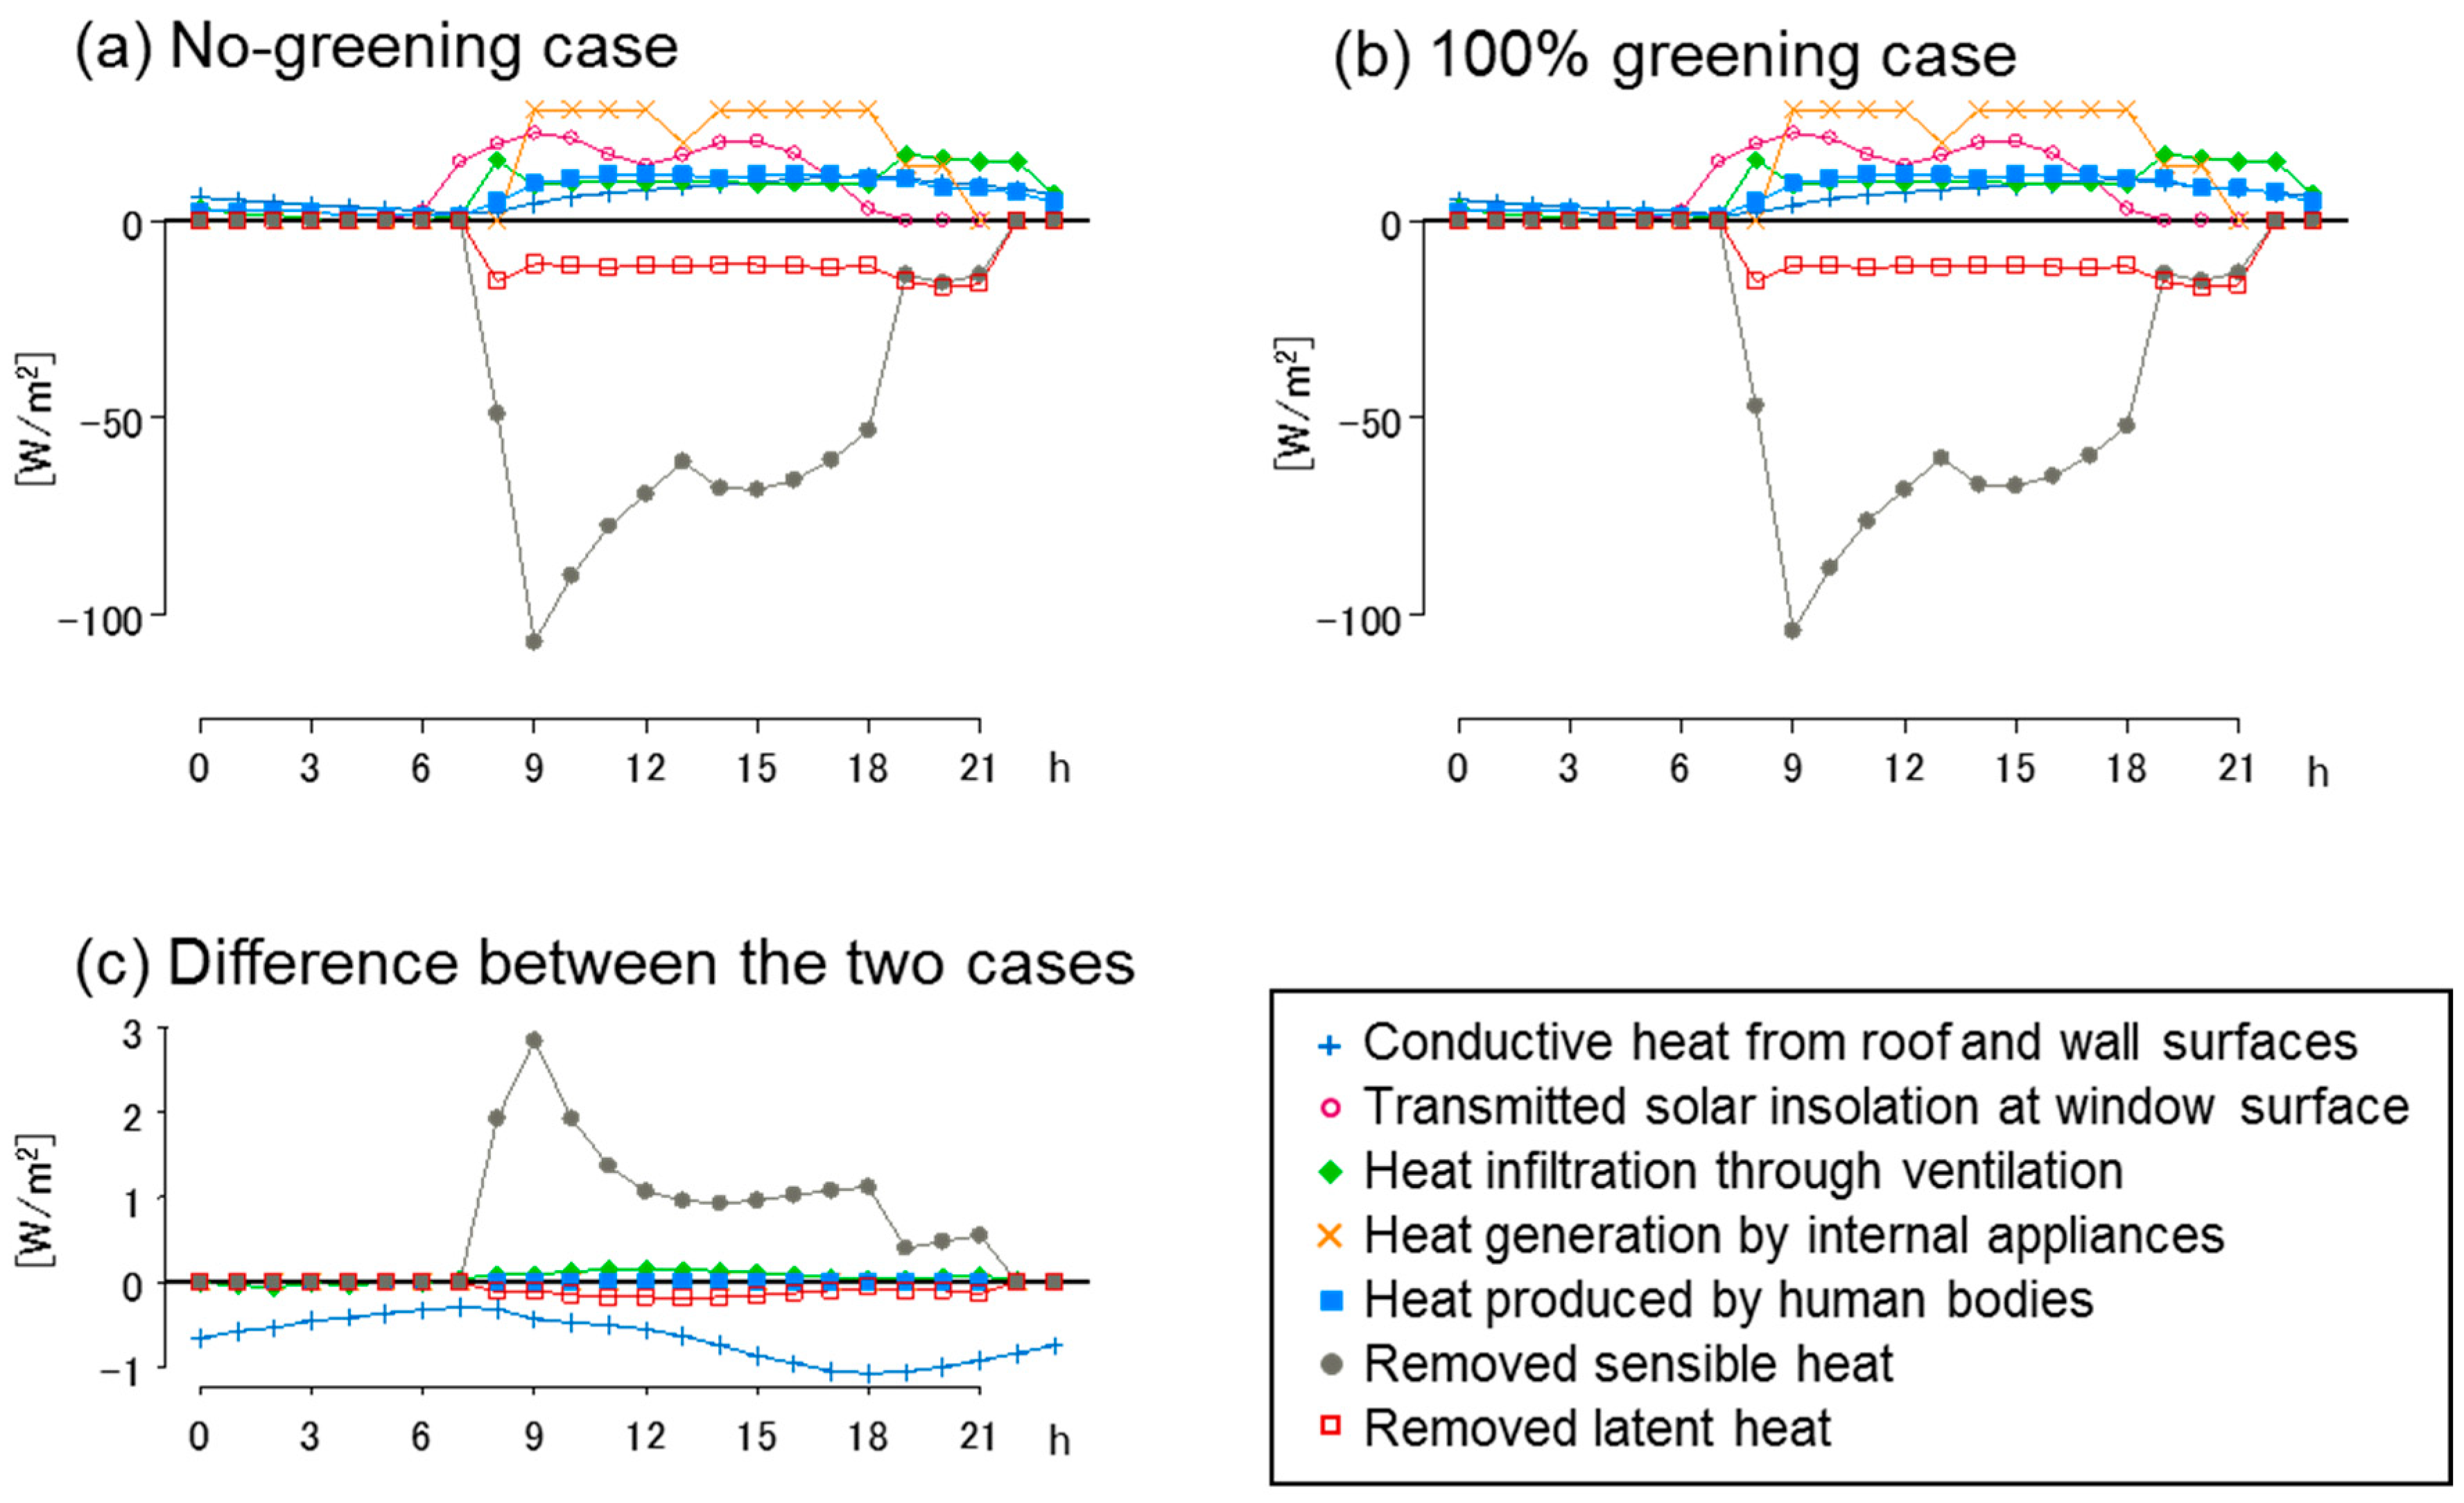
In order to quantify the factors underlying these energy savings and CO
2 reduction effects, the respective heat balances and differences between the two were plotted for the 100% greening case and no-greening case in
Figure 6. In the 50% greening case, the results were intermediate between the two cases. The direction in which heat enters the indoor space was assumed to be positive. The removed sensible heat and removed latent heat, indicated as negative values, were the quantities of heat removed by the air-conditioning equipment as sensible heat load and latent heat load, respectively. The graph of the differences between the two cases in
Figure 6c shows a particular reduction in heat conduction from roof and walls. Since the removed quantity of heat was negative, the difference graph indicates a load reduction when the value was positive. Therefore, as seen in
Figure 6c, the removed sensible heat decreased with heat conduction, whereas the removed latent heat increased to some extent because the outside humidity increased with roof greening. There was a slight increase in the heat infiltration through ventilation under the assumed conditions of this study. There was a greater increase in latent heat load because of the rise in humidity than a decrease in sensible heat load caused by the decrease in temperature. However, the increase in removed latent heat owing to the roof greening was smaller than the reduction of removed sensible heat. Therefore, the comparison done by combining heat conduction and heat infiltration through ventilation shows that the cooling load decreases due to roof greening.
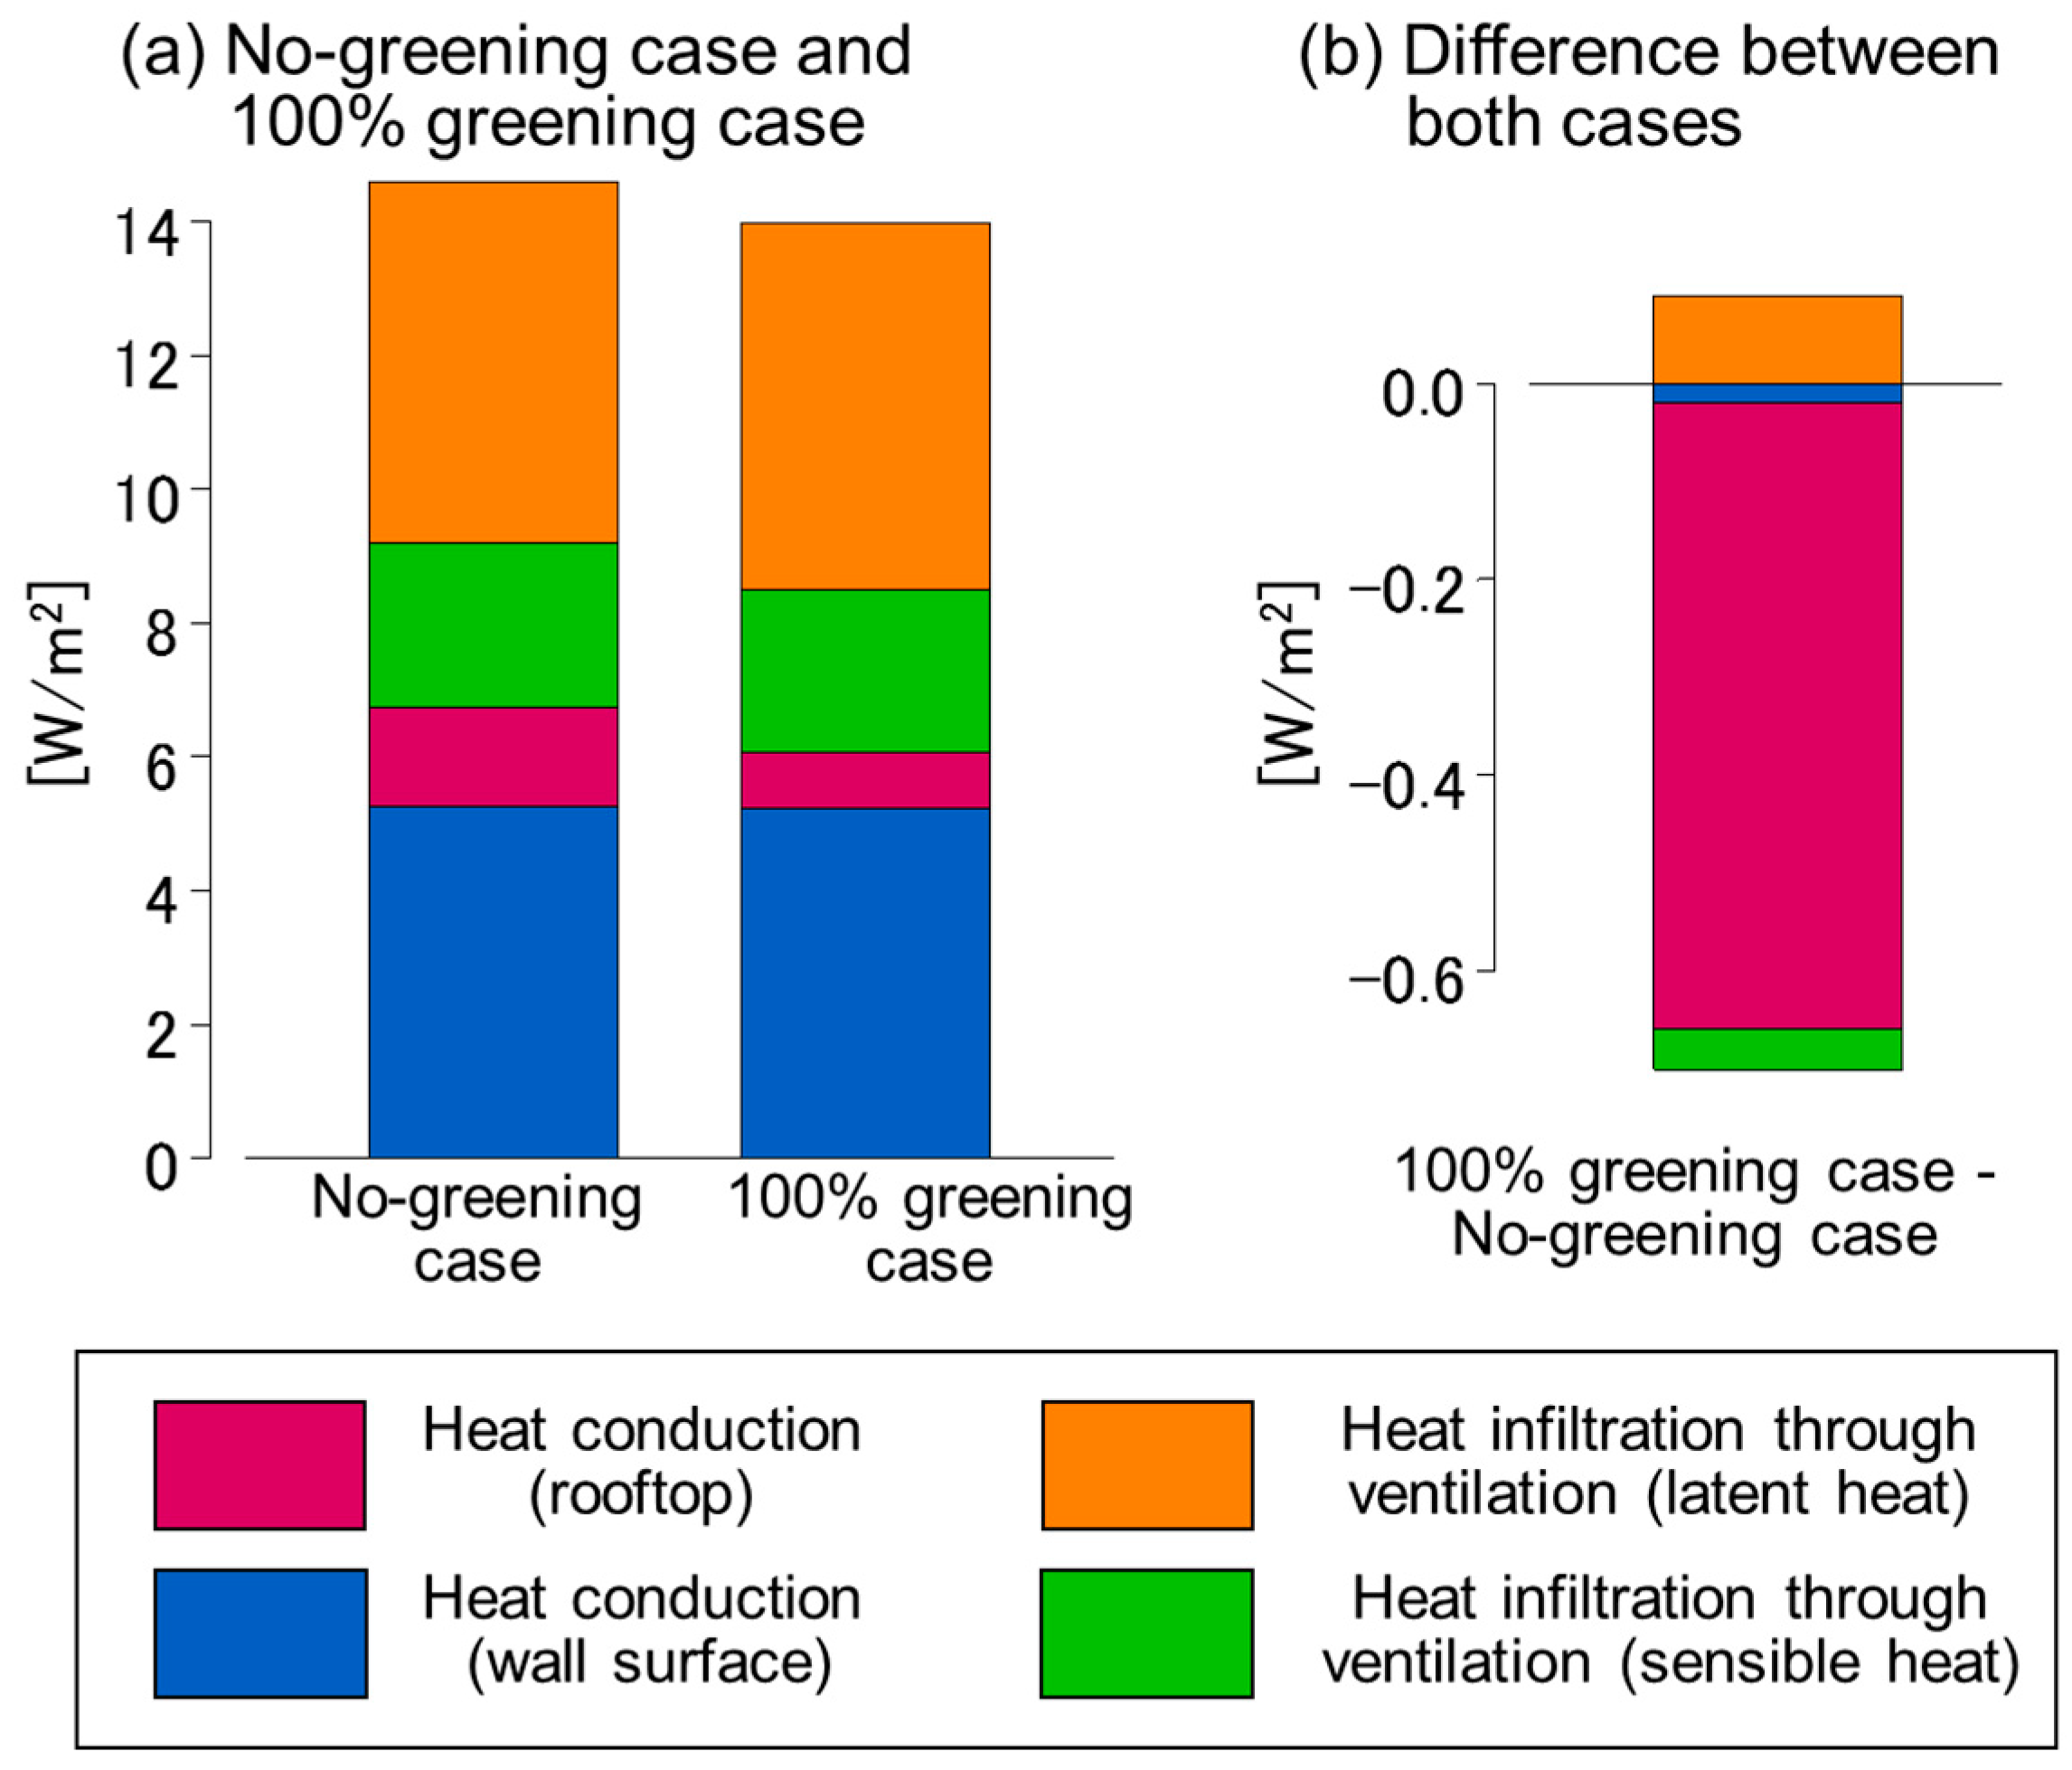
For a more detailed analysis of the changes in conductive heat and heat infiltration through ventilation, the conductive heat was divided into wall surface, rooftop, and heat infiltration through ventilation, which was further divided into sensible and latent heat. The daily average values per floor area were indicated in a bar graph (
Figure 7). There was a significant reduction in conductive heat from the rooftop due to greening. Although the total amount of conductive heat from wall surfaces was high, the reduction effect due to greening was extremely small. In heat infiltration through ventilation, the total increase in latent heat due to increased humidity was greater than the total reduction in sensible heat due decreased temperature (
Figure 7). The decrease in surface temperature on the roof surface was approximately 10 °C during the day (
Figure 2), and the maximum decrease in air temperature was 0.13 °C (
Figure 4).
Based on these results, the conductive heat from the rooftop was considered a direct effect of the reduction in roof surface temperature. The conductive heat from wall surfaces and heat infiltration through ventilation were considered an indirect effect of the outside air. The increase in heat infiltration through ventilation due to latent heat was greater than the conductive heat and heat infiltration through ventilation combined. This suggests that, when a green roof was installed, the effect of an increase in latent heat load was greater than the effect in which the sensible heat load was reduced in surrounding buildings. This conclusion conflicts with the common notion that roof greening mitigates the UHI effect and reduces the energy consumption for cooling. However, it is not appropriate to generalize this result because, in practice, the effects depend on weather and applicable building conditions. The direct and indirect effects were not separately analyzed in this study, and the CO2 reduction effect obtained as a result of both effects was the subject of evaluation.
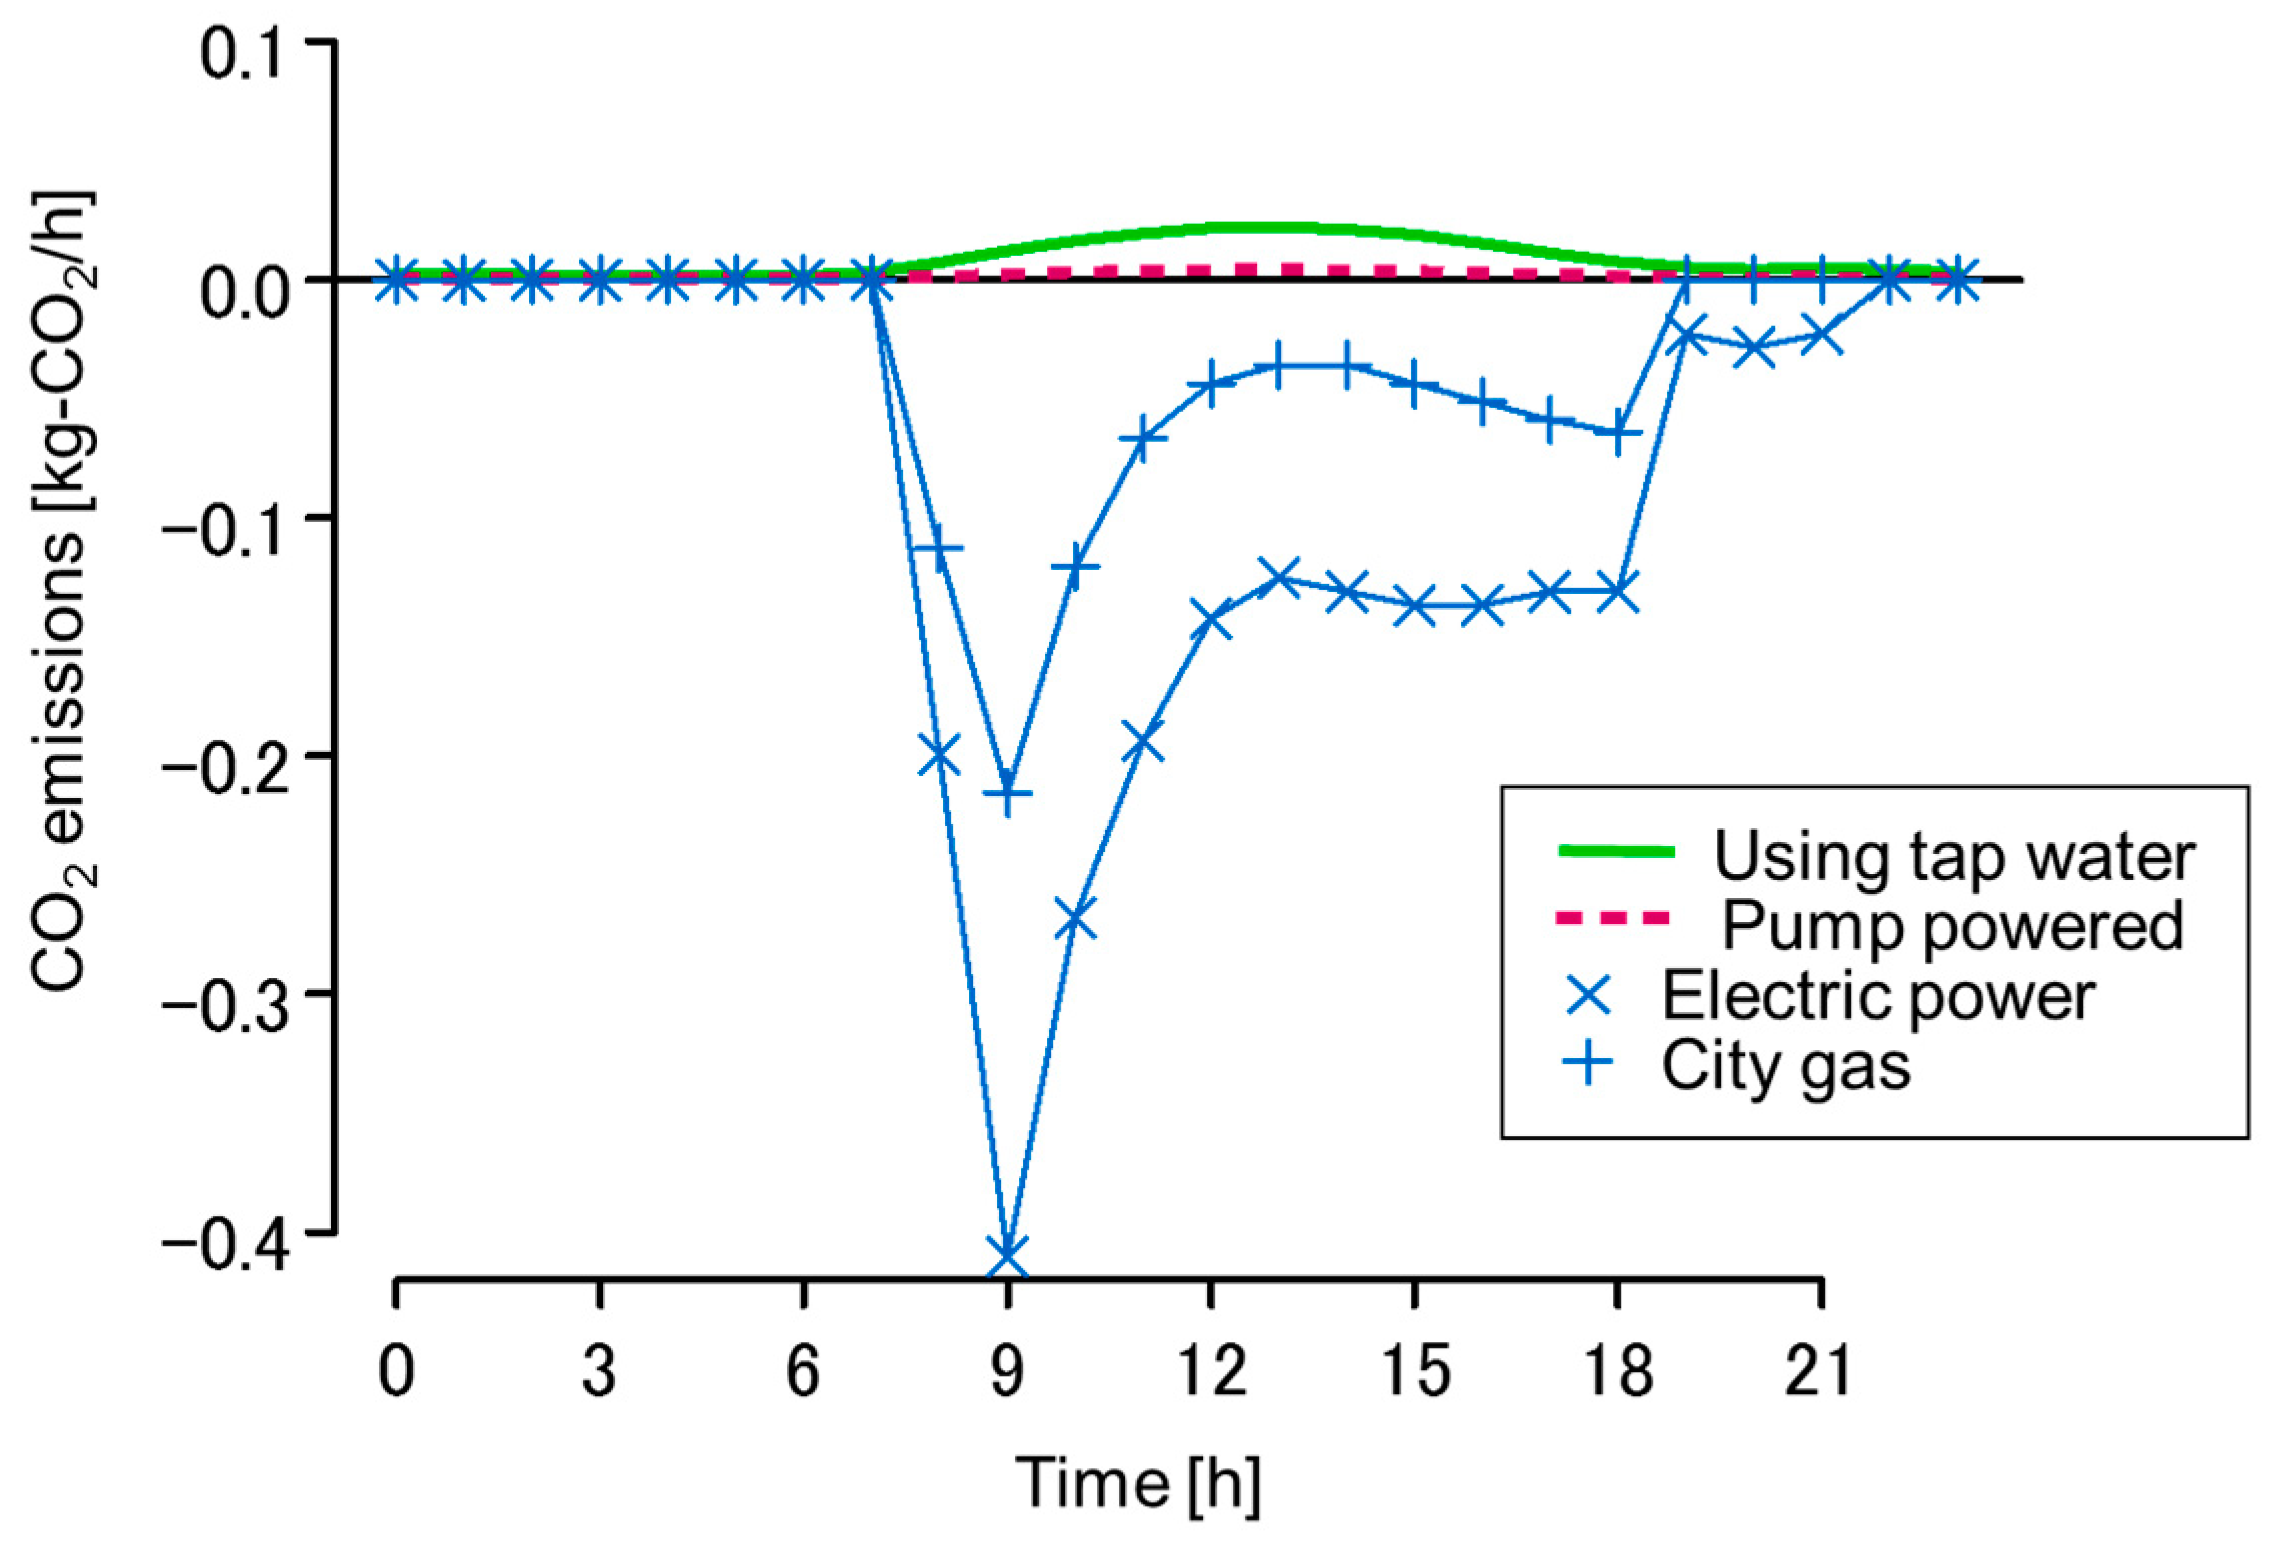
CO
2 emissions from irrigation were calculated based on the assumption that the amount of water needed for evapotranspiration was supplied by the waterworks. The CO
2 emissions from powering the pumps to lift water to the roof and from the use of tap water were considered. Pump power was calculated by setting the pump efficiency at 0.6 and assuming the rooftop height to be the lifting height. For tap water, the calculation was performed with CO
2 emissions of 0.193 (kg-CO
2/m
3) for water purification, delivery and distribution, based on the estimations by Genchi et al. [
58]. CO
2 emissions for each case were shown in
Figure 8. For comparison, CO
2 reduction by the cooling effect of green roofs shown in
Figure 5 were added to
Figure 8.
CO
2 emissions from the tap water use (0.21 (kg-CO
2/d) in the 100% greening case and 0.11 (kg-CO
2/d) in the 50% greening case) were greater than CO
2 emissions from powering the pumps (0.038 (kg-CO
2/d) in the 100% greening case and 0.020 (kg-CO
2/d) in the 50% greening case) (
Figure 8). These values account for 8–9% of the CO
2 reduction by the cooling effect of green roofs. Under the calculation conditions of this study, it can be concluded that a CO
2 reduction effect can be obtained by using green roofs, even considering the CO
2 emissions from irrigation.
5. Evaluation under Various Calculation Conditions
The relationships between evapotranspiration, UHI mitigation, and CO
2 reduction were investigated using the calculation results presented in
Section 4. These relationships depend on the assumed building conditions, which were considered standard conditions hereafter. From these assumed parameters, heat insulation, performance of the roof and evaporation efficiency at the green roof area were likely to significantly affect the results. Therefore, an investigation was conducted considering variations of these two parameters, a high insulation condition, and a low evaporation efficiency condition. For the high insulation condition, the roof insulation material was assumed to be equivalent to the next generation energy savings standard, similar to the high insulation cases by Kikegawa et al. [
40], and Hirano and Fujita [
42]. The coefficients of heat transmission and heat capacity per cross-sectional area were set to 0.38 (W/m
2/K) and 2.12×10⁵ (J/m
2/K), respectively. In addition, similar to the standard conditions, the green roof ratio varied among 0%, 50%, and 100%.
Specific values related to roof insulation were provided by Kikegawa et al. [
40]. In this study, only roof changes were considered. Changes in wall surfaces to analyze the influence of factors other than roof greening were not studied. The values, other than the roof insulation performance were the same as the standard conditions.
In the low evaporation efficiency scenario, the evaporation efficiency at greening areas, which was set as 0.2 in the standard conditions, was changed at regular intervals from 0.0 to 0.2, instead of changing the vegetation cover ratio. The remaining factors were the same as in the 100% greening case under standard conditions.
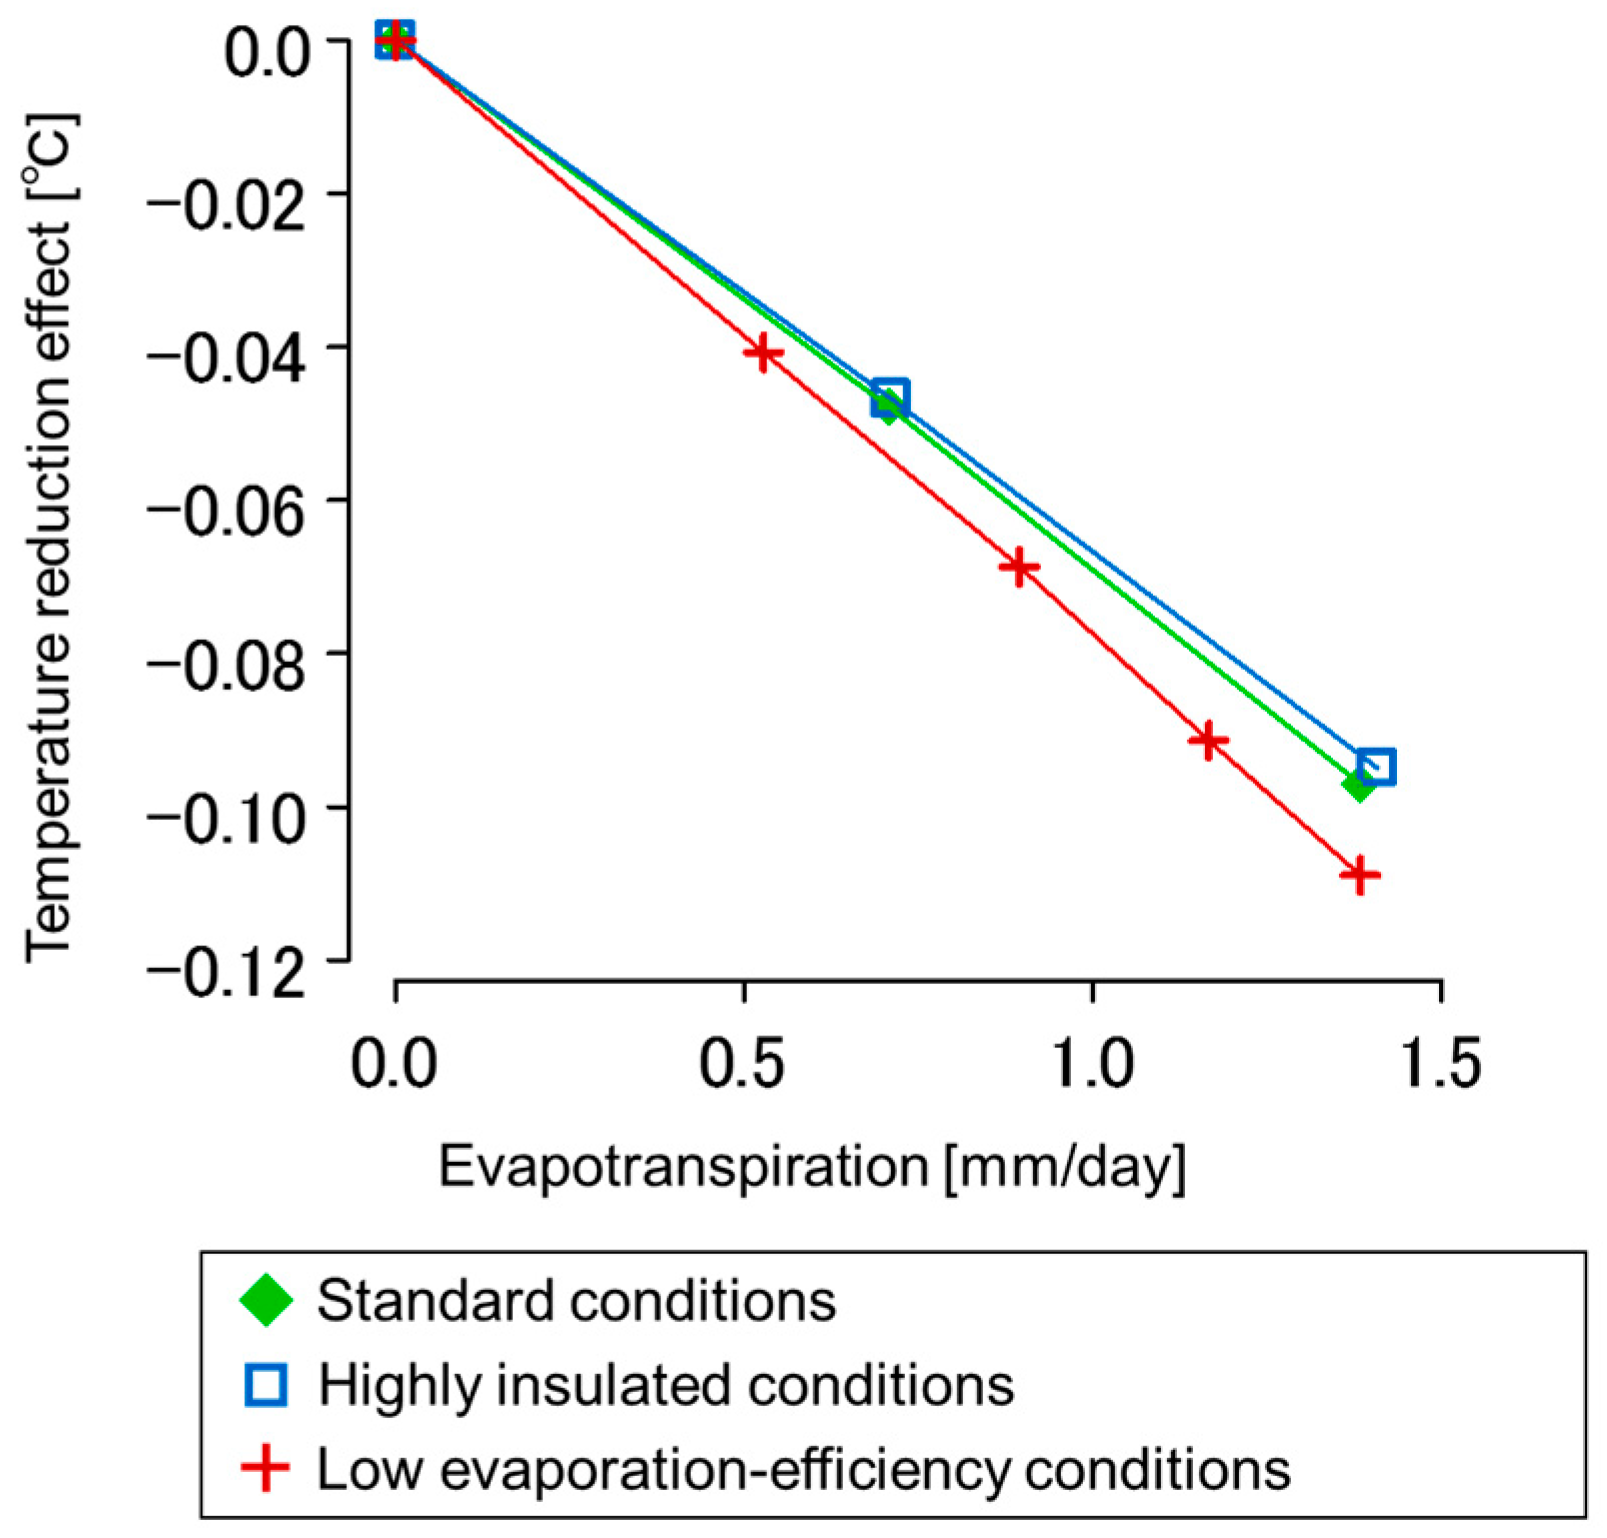
Figure 9 shows the relationship between evapotranspiration and temperature reduction, and
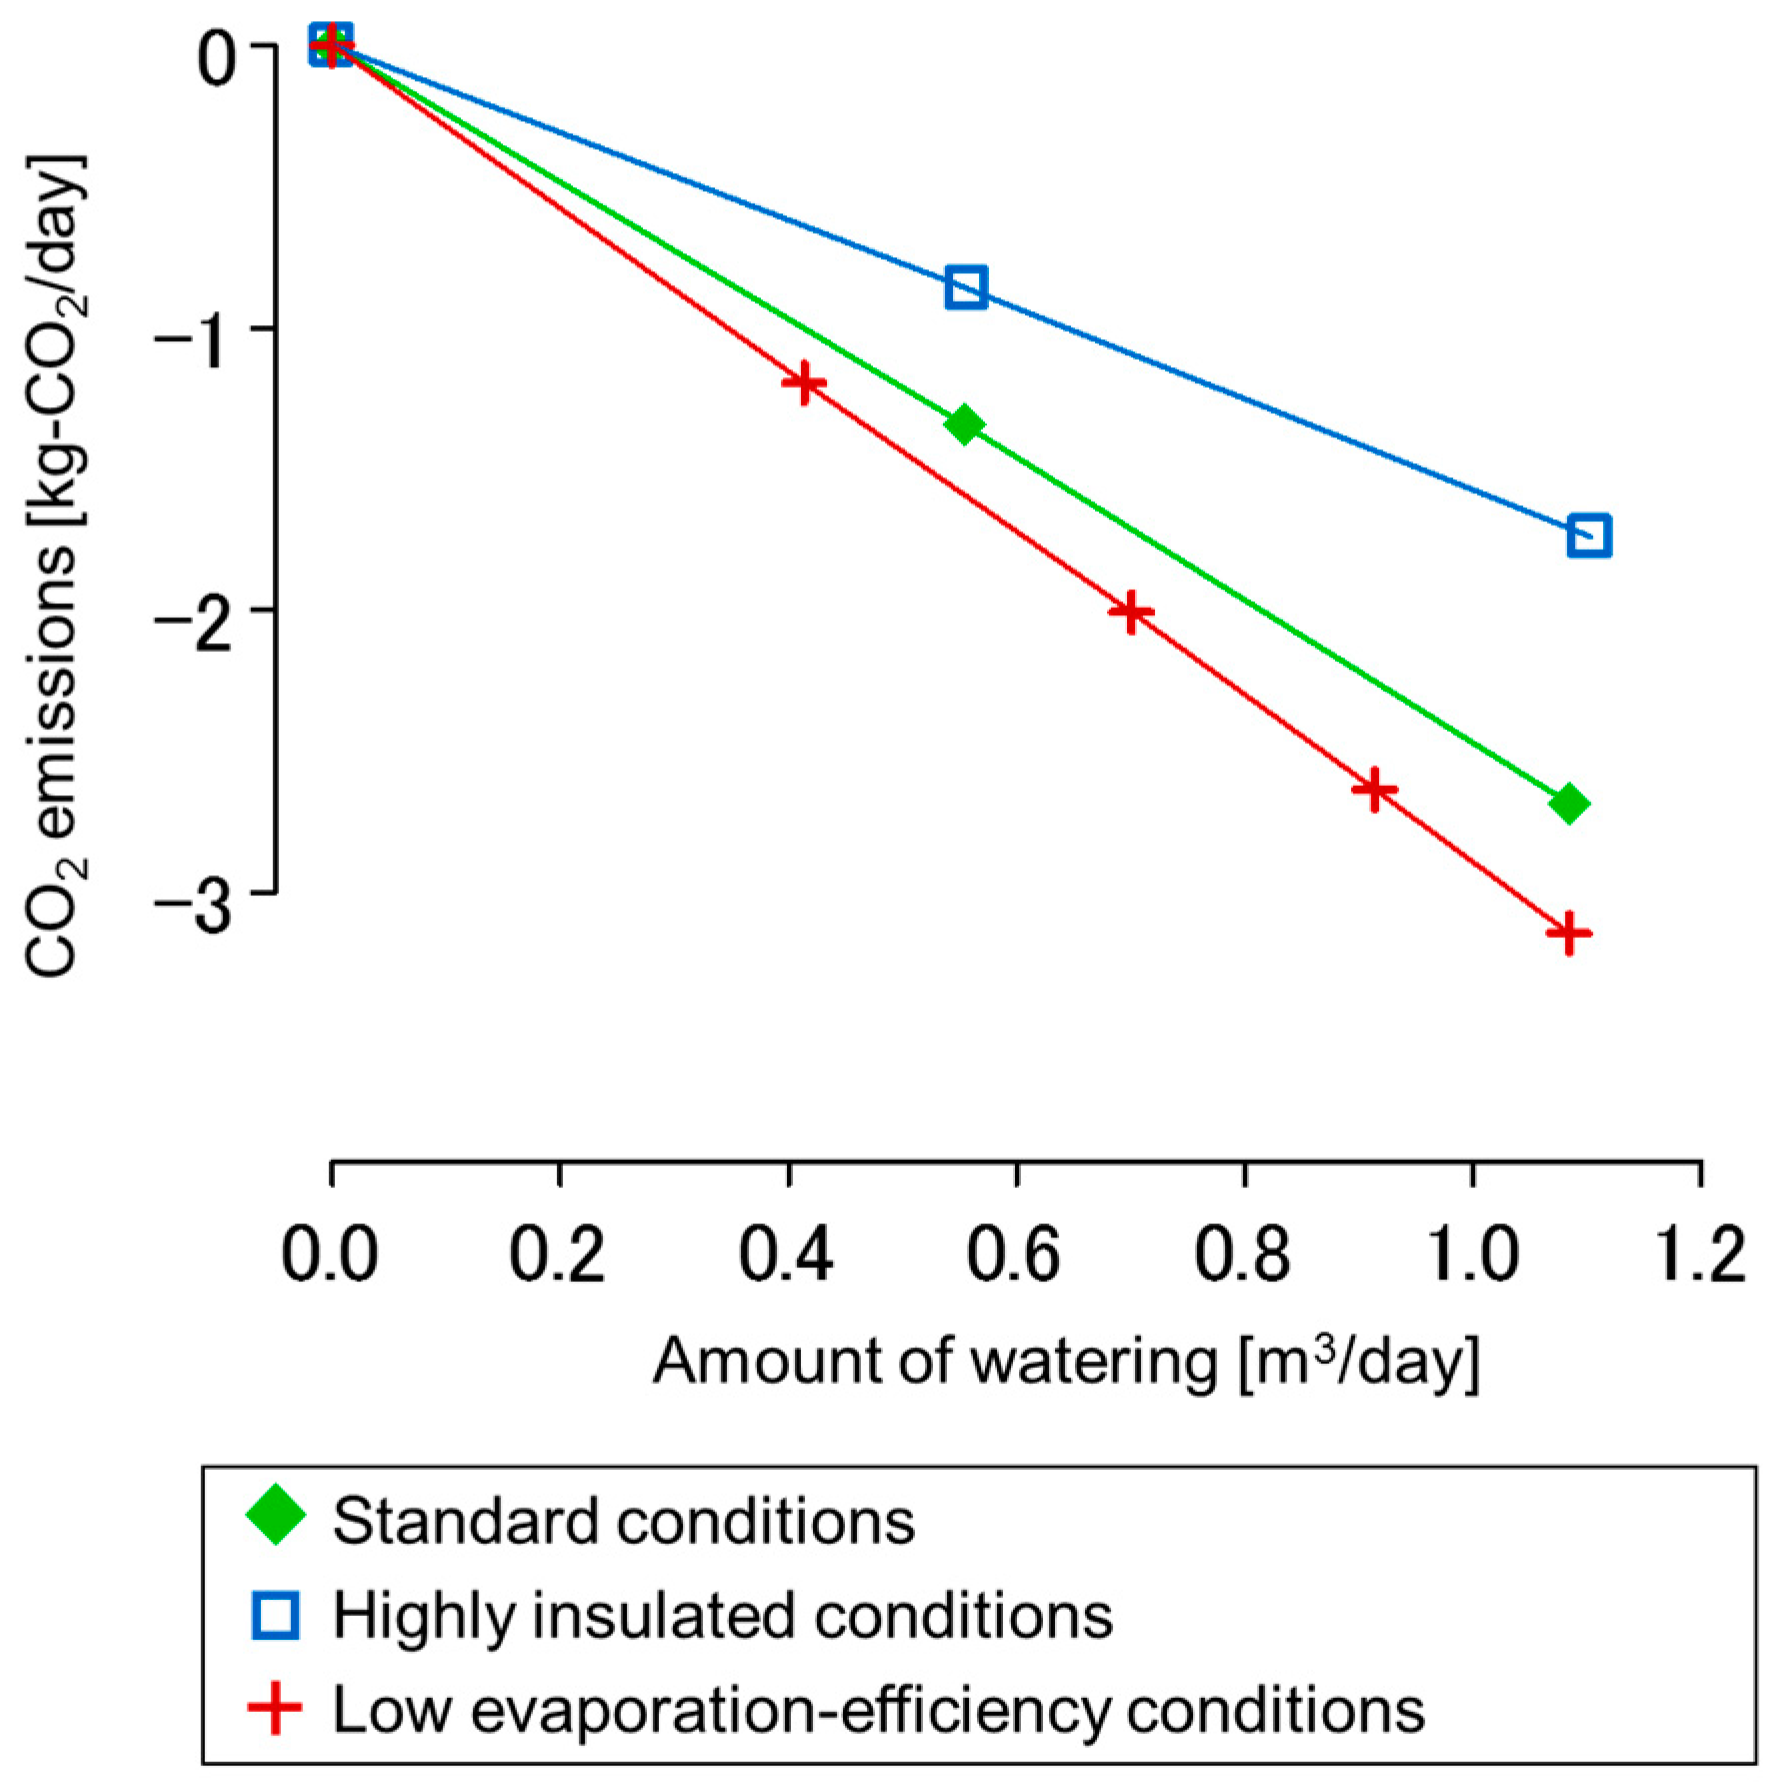
Figure 10 shows the relationship between watering and CO
2 emissions. Differences between the greening and no-greening cases were plotted under standard, high insulation, and low evaporation efficiency (evaporation efficiency is 0) conditions. As seen in
Figure 9, the differences regarding the temperature reduction effect were small among all conditions and roughly formed straight lines. It is likely that the temperature decrease in response to evapotranspiration depends almost entirely on atmospheric diffusion, thus, these results are valid. In practice, some differences may appear due to the changes in radiation, heat storage, and air-conditioning. However, because such effects were small in the present study, it was concluded that evapotranspiration is the main influencing factor. Nevertheless, the slopes shown in
Figure 9 can change depending on weather conditions. Therefore, for a more accurate future analysis, the same evaluation should be performed under various weather conditions.
Figure 10 shows the net CO
2 reduction considering the reduction in cooling energy and CO
2 emissions from irrigation. There are no significant differences between the standard and the low evaporation efficiency condition.
Figure 7 shows that the reduction in heat conduction was the dominant factor affecting air-conditioning load, and there was a relationship between the increased latent heat flux and decreasing heat conduction.
Figure 10 shows that the CO
2 reduction effect in response to evapotranspiration was nearly half under highly insulated conditions, compared with the other cases. Therefore, the effectiveness of green roofs showed a strong dependence on building structure and insulation performance of the construction exterior. Therefore, it is necessary to accumulate evaluations of various types of buildings for more general findings in the future.
6. Conclusions
In this study, CM-BEM was used to evaluate the effects of roof greening of office buildings in the reduction of UHI and CO2, considering the necessary amount of water to maintain the green roof.
The main results of this research can be summarized as follows:
- (1)
The UHI mitigation effect of green roofs was evaluated. Under the assumed conditions and parameters of this study, the maximum air temperature decrease of large-scale green roofs was 0.13 °C. The relationship between this air temperature decrease and evapotranspiration was also determined.
- (2)
The CO2 reduction effect of green roofs was evaluated. In particular, the evaluation considered CO2 reduction by lower cooling energy consumption and CO2 emissions due to powering the pumps and using waterworks for irrigation. The CO2 reduction due to cooling energy saving was greater than CO2 emissions from irrigation, in terms of the direct effects of the reduction in surface temperature. A CO2 reduction effect could be achieved in buildings where green roofs were installed. However, the indirect effects of the outside air could significantly impact CO2 emissions due to the latent heat load. Therefore, the effects on surrounding buildings should be considered in the future.
- (3)
In addition to the standard conditions, we considered conditions in which the roof insulation performance and evaporation efficiency of the green roof area varied. The results were compared with the standard conditions. The relationships between water amount, UHI mitigation, and CO2 reduction, were investigated under each calculation conditions.
Under the standard conditions, the evaporation efficiency of the green roof surface was set as 0.2, but this was a value measured with sedum planting and no watering during the day [
30]. Therefore, it can be considered a conservative value for green roofs. In practice, a larger effect can likely be obtained by increasing the amount of watering.
A suggestion for future research in this area is to incorporate a detailed water balance model that considers precipitation and water retention effectiveness of the soil layer. In this research we evaluated the effect of green roof by quantifying the evapotranspiration using the latent heat flux and considering the necessary amount of watering. This is a useful method considering that, in previous studies, heat balance calculations were carried out, whereas the water supply amount was left unknown, even for building rooftops where watering was done artificially. However, in practice, artificial watering increases evapotranspiration regardless of vegetation [
30], thus, the calculations alone may not show the true value of green roofs. If the current urban cover of the Earth’s surface was considered, it would be important to provide water retention capacity of roof surfaces. Therefore, in the future, it would be necessary to conduct a more detailed evaluation considering the water balance of green roof areas, by incorporating precipitation and water retention effectiveness into the thermal environment simulation model.
Another topic for future studies is the direct effect of decreased roof surface temperature and indirect effects of outside air. The energy savings effect of green roofs has already been verified in previous models [
39,
40,
41,
42,
48,
49,
50,
51], but it is difficult to use these models for conditions where there is a mixture of buildings with and without green roofs in the same district. Previous studies assumed that there was a large direct effect of the reduction in surface temperature, but the indirect effect of outside air has not been adequately considered. In practice, it is difficult to implement the same green roof in all buildings in a district. Therefore, to evaluate the effects on the surrounding buildings, it is essential to distinguish these direct and indirect effects. In this research, a preliminary evaluation was performed to distinguish direct and indirect effects based on the calculated indoor heat balance (
Figure 7). The results suggest that, for indirect effects, under the assumed conditions and parameters of this research, the increase in latent heat load due to increased humidity was greater than the decrease in sensible heat load due to decreased temperature. This is an important result that implies that, if a green roof is installed at a certain building, there is a possibility that the air-conditioning load of the surrounding buildings may increase rather than decrease. However, in practice, these results depend on weather conditions and the condition of the evaluated buildings. Therefore, it is not appropriate to make generalizations based only on the obtained results. In particular, the rates of conductive heat and heat infiltration through ventilation have a strong dependence on the building scale and insulation performance. The coefficient of performance (COP) of air-conditioning equipment varies with sensible and latent heat loads. Therefore, further studies considering these factors are necessary.


