1. Introduction
Only in a few instances are water utilities in many European countries, such as Italy, listed companies or owned by institutional investors. Frequently, municipalities and other public bodies totally or partially own these utilities. Thus, their payout policy—that is, the set of guidelines used to define how much of their earnings a firm will pay out to shareholders—is under scrutiny, being part of the great public–private debate that started in Italy with a 2011 referendum that attracted wide participation [
1]. This referendum was the citizens’ response to an Italian government law (no. 133/2008 art. 23-bis) that encouraged private or mixed management of the water services, and was regarded as more efficiency-oriented than those involving public management. As an outcome of the referendum, mixed or privately-owned firms are now no more preferred to publicly-owned firms in the management of water services. Indeed, dividends may have an impact on the development of new infrastructure or the renewal of existing infrastructure—an aspect that has great influence on citizens, the environment, and regulators, as the new Italian tariff-setting methods that were introduced in 2012 and 2016 by the Italian National Regulator called ARERA allow tariffs to be raised to help utilities overcome pressing investment needs [
1,
2]. Citizens might prefer that water utilities reinvest their profits instead of paying returns to shareholders. This is part of a broader criticism of the role of corporations in relation to water [
3,
4]. However, owing to current budget constraints in Western economies, along with the existence of private shareholders, even shareholders such as municipalities and other public bodies could be interested in receiving returns from their participation in water utilities. Thus, they will be reluctant to abandon their rights, using payouts as a “safe and steady source of financing” ([
5], p. 410) to obtain funds for political purposes, without the need to tax citizens/voters. In Italy, the need for investment is urgent; according to the Italian National Institute of Statistics [
6], average water losses were 41.4% in 2015 (with 38.3% real losses), with some areas and regions reaching more than 50% on average. Moreover, on numerous occasions, Italy failed to comply with European legislation due to its lack of wastewater treatment. This issue has exposed Italy to onerous penalties and jeopardized the fulfillment of water quality objectives [
7].
In this study, we investigate if Italian water utility shareholders received returns from their participations by examining 128 Italian water utilities during the period 2009–2014. By creating clusters of firms, the study also analyses factors that could affect returns, such as firm size, localization (in the north, central, or south of Italy), ownership structure, and strategy features (membership of a corporate group and being a mono- or multi-utility).
Our study contributes to the literature and scientific debate in several ways. First, it adds to the literature on water utilities, examining their choices in paying returns to their shareholders, considering wholly publicly owned companies, mixed companies (i.e., entities co-owned by public and private investors), and private water utilities. It does this in the context of the Italian water industry where these management models coexist [
8] under the same regulatory framework (i.e., the same law and regulatory schemes applied). Moreover, we investigate other potentially relevant factors, such as firm size, localization, and two relevant strategy and operational features (membership of a corporate group and being a mono- or multi-utility). Second, we focus on water utilities, which are under-researched despite their importance to the global economy because most studies exclude both regulated and non-listed firms when investigating returns to shareholders. In fact, most water utilities do not list shares on stock exchanges and are regulated. Finally, this study provides relevant information to water regulators and water utility stakeholders, and could therefore influence future regulatory decisions and the current policy debate about the effects of different management models in the water industry and their impact on investments and tariffs.
The remainder of the paper is organized as follows.
Section 2 reviews the existing literature.
Section 3 provides a brief overview of the Italian water sector, while
Section 4 presents materials and methods.
Section 5 presents the empirical results, while the final section discusses the results and concludes the paper.
2. Literature Review
Despite the extensive literature on the issue of returns to shareholders and dividend policy and its importance to the economy, most studies exclude non-listed firms [
9] and regulated firms [
10,
11] from their analyses, since obtaining a large sample of financial data on private firms is an obstacle to such research. Moreover, empirical studies on dividend or gearing policy usually exclude regulated companies from the analysis, owing to the influence of regulation on their financial choices [
10,
11,
12,
13]. In regulated firms, regulators influence dividend policies directly or indirectly [
5,
14,
15], and their accounting information has different characteristics from that of other industries [
16].
However, in recent decades, network industries have been among the highest-dividend-paying sectors [
5,
17,
18]. Wansley [
18] showed that unregulated firms pay out a smaller portion of their earnings than do firms in most regulated industries. Cambini and Spiegel [
19] showed in their model that regulated firms issue more debt, invest more, and enjoy higher regulated prices when they face more independent regulators; they are more privatized when regulators are more pro-firm. Cambini and Spiegel [
19] also showed that regulatory independence, higher degree of privatization, and pro-firm regulatory climate are associated with higher social welfare. Moreover, Petrasek [
20] showed that high corporate payouts are the outcome of transparency and shareholder protection. “Regulated firms are generally less risky, insulated from product and even capital markets discipline and regulators may influence, directly or indirectly, how much dividend they can pay” ([
5], p. 409).
The literature on the dividend policy of utilities focuses on the electricity sector [
5,
17], and less on other regulated network sectors such as water, although water companies are large-scale dividend payers in some countries [
4,
10]. Considering the dividend policy of electricity utilities, Bremberger et al. [
5] analyzed an unbalanced panel sample of 106 firms operating in the European electricity market from 1986 to 2010 and found that dividend smoothing, impact effects, and target payout ratios were sensitive to the regulatory regime that companies face. Specifically, electric utilities subject to incentive regulation smooth their dividends less and respond more readily to profit changes than do those subject to cost-based regulation. Moreover, Bremberger et al. [
5] found that state-controlled firms continue to smooth their dividends and pay larger dividends, despite moving from cost-based to incentive regulation. Bremberger et al. [
5] explained this result by affirming that excessive and stable dividends could be a more covert method to enforce political inclinations than direct taxation.
Most studies empirically analyze utility firms mainly in aggregate panels instead of considering the specificities of each regulated industry. This is probably because only using data from many utility industries (electricity, water, gas, etc.) allows researchers to obtain large panels of listed firms. In fact, Hansen et al. [
17] analyzed all US-listed utilities that paid cash dividends and had positive earnings over the five-year periods of 1981–1985 (81 firms) and 1986–1990 (70 firms), and for which all other relevant data were complete. The authors found that dividends were used to increase the probability of primary market monitoring. These results are consistent with the hypothesis that paying higher dividends increases the monitoring of stockholder–manager and stockholder–regulator conflicts. Therefore, utilities facing higher regulatory and managerial conflicts, lower flotation costs, and lower asset growth pay proportionally greater dividends. Saxena [
21] examined a sample of 235 unregulated and 98 regulated firms listed on the NYSE over the period 1981–1990 and found that regulated firms were less risky, had lower growth rates, had far fewer insiders holding their common stock, and had fewer investment opportunities, but paid a higher percentage in dividends. Bortolotti et al. [
22] investigated electricity, natural gas, water supply, telecommunications, freight roads concessions, ports, and airports and obtained an unbalanced panel of 92 publicly traded utilities and transportation infrastructure operators (but only 13 water supply companies). The authors showed that firms included in the analysis had higher leverage if they were privately controlled and regulated by an independent regulatory agency. Moreover, privately controlled regulated firms used leverage strategically to obtain better regulatory outcomes, since increased leverage was associated with higher regulated prices. Thus, it seems that high leverage protects regulated firms against the risk that regulators will lower prices once investments become sunk, in order to benefit consumers. They conclude that debt financing may boost the incentives of privately controlled regulated firms to invest as a desirable consequence. Based on the same dataset, Cambini et al. [
23] confirmed that privately controlled firms tend to have higher leverage than state-controlled firms and that regulated firms are more leveraged and invest more when subject to regulation by an independent regulatory authority.
Few empirical studies focus on the water sector, with the exception of an analysis of the UK water industry [
10], where the high payouts of utilities seem driven by investor demand, and investors and analysts consider water utilities as natural payers of high dividends in relation to profits.
In conclusion, prior literature focused mainly on returns by listed utilities and the effects of the regulation model on returns. Privately controlled firms seem to have more leverage, relying on debt financing to obtain higher tariffs from regulators. Furthermore, utilities subject to incentive regulation (e.g., price and revenue cap and yardstick competition) smooth their dividends less than firms subject to cost-based regulation (e.g., the “rate of return” method).
3. Overview of the Italian Water Industry
According to the dataset of the national water authority (
Autorità di regolazione per Energia, Reti e Ambiente, ARERA), approximately 2000 entities provide water services in Italy. Of these, more than 1000 are municipalities or other public entities (representing 17% of all Italian municipalities), and only 366 are independent enterprises. Among these 366 firms, only 164 simultaneously provide all of the main water services—that is, collection, adduction/transportation, distribution of water for civilian use, sewerage, and wastewater treatment [
7]. The national and local authorities in Italy are now responsible for the water sector in Italy, and water companies are responsible for service delivery and implementation of the necessary infrastructure (for details, see [
7]).
According to Law 152/2006, the Italian national regulatory authority should define the national framework under which all firms must operate, select the tariff method, and the service contract type; subsequently, it should periodically monitor the implementation of rules in every area of the country. The local regulator authority (AATO, since renamed EGA) is responsible for controlling the entities that manage the services locally.
In 2011, a new water national regulatory authority was established (ARERA). In terms of tariff method, the ARERA introduced the tariff transitory method (MTT) for 2012 and 2013, which was replaced by the
Metodo Tariffario Idrico (MTI) 2014–2015, and then the MTI 2016–2019. Before the introduction of the ARERA tariff methods, the differences between expected investments (i.e., agreed ex ante with municipalities and local authorities) and realized investments were usually very high, as reported by CONVIRI [
24] in its annual reports. For example, in 2009, CONVIRI [
24] reported that only 56% of planned investments were realized and only 49% in the previous year. Actually, ARERA [
25] reported that despite controls, a gap (albeit highly reduced) remains between realized and planned investment, with realized investments at 81.9% of planned investments in 2014 and 77.6% in 2015.
The former normalized method, in force until 2012, requires a progressive reduction of operating expenditure (OPEX) to achieve a modeled cost curve. This curve was calculated through a parametric function in accordance with a benchmarking procedure. However, several local water authorities did not effectively implement this provision, allowing the recovery of extra costs and leading to inefficiency [
24]. The tariff methods MTI 2014–2015 and MTI 2016–2019 mitigated the incentives for efficiency improvements for both OPEX and capital expenditure (CAPEX), avoiding any comparison among utilities. The OPEX charged every year in tariffs is based on that recorded in 2011 and updated with inflation, while CAPEX includes depreciation on assets realized until two years before, cost of capital, and fiscal costs. The last two components of CAPEX are estimated by multiplying specific rates provided by the ARERA with the value of regulatory asset base and regulatory working capital. Per this method, the tariff changes every year. From 2016, the new MTI introduced incentives and penalties for the achieved standards of quality, allowing tariff variation linked to this index. Furthermore, provision 655/15 of ARERA provides compulsory standards for service quality for all water companies. With this law, the self-regulation of water service quality was delayed [
26].
The effect of these changes on the regulatory framework was highlighted in Romano et al. [
26]. For instance, in some areas (northern and central regions of Italy), the water tariffs increased in 2014 from 2013, and the investment per inhabitant in these areas also improved. The association between tariff increase and the expected investment growth is one of the main aims of the new tariff method instituted by the national authority ARERA, that is, the realization of investment through tariff levels [
26]. The acceptance of a link between tariffs and investments to overcome high water leakage, meet the increasing urban demand for water, and improve sewage and wastewater treatment and water quality is of outmost importance in many countries [
2].
4. Materials and Methods
The dataset was constructed using many sources. The data collection process began with the database published by ARERA. This database, available on the authority’s website, includes information on all independent firms and public bodies involved in the provision of Italy’s water services. Among these operators, municipalities and other public bodies (e.g., consortia of local governments or mountain communities) were excluded. The survey focused only on independent firms (water utilities) that simultaneously provide all water services (collection, potabilization, adduction/transportation, distribution of water for civilian use, sewerage, and wastewater treatment, or the so-called
Servizio Idrico Integrato), thereby eliminating the effect of differentiated operations from its statistical analysis, which could severely affect firm performance [
27].
The ARERA database also provides information about firms belonging to a group. This is relevant because this strategic and organizational choice could affect economic results and dividend policy. The list was crosschecked against the
Analisi Informatizzata delle Aziende Italiane (AIDA) database of Bureau Van Dyck. The AIDA database was used to collect data on the distinction between “fully publicly owned” firms and “not fully publicly owned” firms as well as economic and financial items referring to the six-year period analyzed (2009–2014) before and after the ARERA regulation, that is, total assets, net profit, corporation stock, equity, and return on equity (ROE). The payout information was manually collected from the minutes of shareholders’ meetings that were also retrieved from AIDA or corporate websites. We then calculated the payout ratio, payout to equity (PE), and payout to total assets (PTA), as described in
Table 1. As is well known, ROE measures return on equity. PE is the proxy we used to measure the percentage of equity distributed to shareholders, and PTA is the proxy that represents the portion of assets that cannot be realized or renewed because of the payout policy. We used PTA to reflect that firms may finance investment through sources other than retained earnings, although we could use other financial indicators to investigate this issue further. As the primary aim of this study was to investigate the payout policy of water utilities, its determinants, and related effects, we chose to investigate empirical indicators based on dividends paid.
Table 1 reports all the variables collected and used in the empirical analysis. We eliminated those utilities for which we could not obtain all the needed information. The final panel obtained includes 768 observations on 128 Italian water utilities for a six-year period.
Table 2 summarizes the observed characteristics of the dataset in the last year of the observed period, regarding governance, strategic, and economic variables. The dataset includes a majority of wholly publicly owned utilities (
Table 2), as this type of ownership structure is the most widespread in Italy [
7,
8]. Firms in the dataset are primarily large ones (with Total Assets exceeding 43 million Euros) located in Northern Italy. There are fewer observations from other regions because large firms primarily cover the central regions, while municipalities frequently manage services in the southern regions directly, with some exceptions, such as the large water utilities in Puglia (AQP) and Sardinia (Abbanoa), which are publicly owned. About 30% of water utilities are part of a group, while another 30% provide services besides water distribution and treatment, such as waste collection, energy, and gas distribution.
Conducting both parametric and non-parametric tests helps to analyze differences between clusters. Non-parametric tests do not need any distributional assumption underlined. In accordance with previous studies about the water industry [
28,
29,
30], we used the Mann–Whitney U (for the variables ownership, scope of operations, and group) and Kruskal–Wallis (for size and localization) non-parametric tests to test whether or not there were statistically significant differences among clusters according to the variables under scrutiny. The null hypothesis posed that clusters originated from the same populations. It could be rejected if the
p-value was equal to or less than 0.05 (95% significance level), which means that the differences among clusters of water utilities were statistically significant.
5. Results
Table 3 shows firms that paid returns in all six of the years analyzed and focuses on clusters, considering the observed characteristics investigated (size, membership of a corporate group, being a mono- or multi-utility, localization, and ownership structure). On average, 17% of water utilities paid returns to their shareholders, ranging from 14% in 2009 to 20% in 2013, when one out of five firms paid returns. Therefore, most Italian water utilities do not distribute any returns to shareholders and reinvest profits in self-financing.
On the basis of the analysis of the full dataset over 6 years, on average, large utilities paid more frequent returns than medium-sized and small ones, as confirmed also by the Kruskal–Wallis test (
Table 4). However, in the last year (2014), 21% of medium firms paid returns to shareholders versus 20% of the large ones.
Examining the different strategy features (membership of a corporate group and being mono- or multi-utility), the data and the Mann–Whitney test confirmed that water utilities that are part of a group and multi-utilities always paid returns more frequently than others. The shareholders of such utilities had a higher probability of obtaining returns; in the last two years investigated (2013 and 2014), more than 30% of firms in these two clusters paid returns to shareholders.
Firms located in the center of Italy paid more frequent returns than did others, as confirmed by the Kruskal–Wallis test; on average, 29% of firms in the center cluster paid returns in the observed period, with maximum levels in the last two years (35%). Southern firms did not usually pay returns and we observed only one case in the last two years.
Finally, as expected, totally or partially privately owned water utilities paid more frequent returns to shareholders in the observed period, with an average percentage of 39% versus only 7% of publicly owned firms. In 2010, approximately half of privately owned firms paid returns, and in all the observed years at least one-third of such utilities paid returns to their shareholders. Only in a few cases did publicly owned firms pay returns, although the number of such cases increased in the final years. The results seem to confirm the expectations; therefore, ownership affects returns’ policy, with private shareholders requiring more frequent returns for their investments in terms of payout.
Table 5 shows the average ROE recorded for all 768 observations of the dataset. The average ROE was negative in four out of six years. A very positive result was recorded in 2014. This could be due to the changes in the regulatory framework and the resulting tariff growth in 2014, as previously highlighted. As this study aimed to investigate the returns distributed by water utilities, it was crucial to eliminate data on utilities that in some years were unable to distribute any payout to shareholders because of economic loss. Therefore, the following analysis focused on 666 observations of the dataset, after omitting data on water utilities that showed a negative ROE. Of relevance is that high ROE could actually mask an unsatisfactory financial situation (e.g., companies that have not made adequate provisions for bad credit, or hold a large amount of unpaid bills accounted for as revenue).
The adjusted ROE was estimated by avoiding observations with negative ROE. This measure had a positive and saw-tooth trend during the observed period, as did payout ratio (PR), payout (P), payout to equity (PE), and payout to total assets (PTA) when they were estimated using the same procedure.
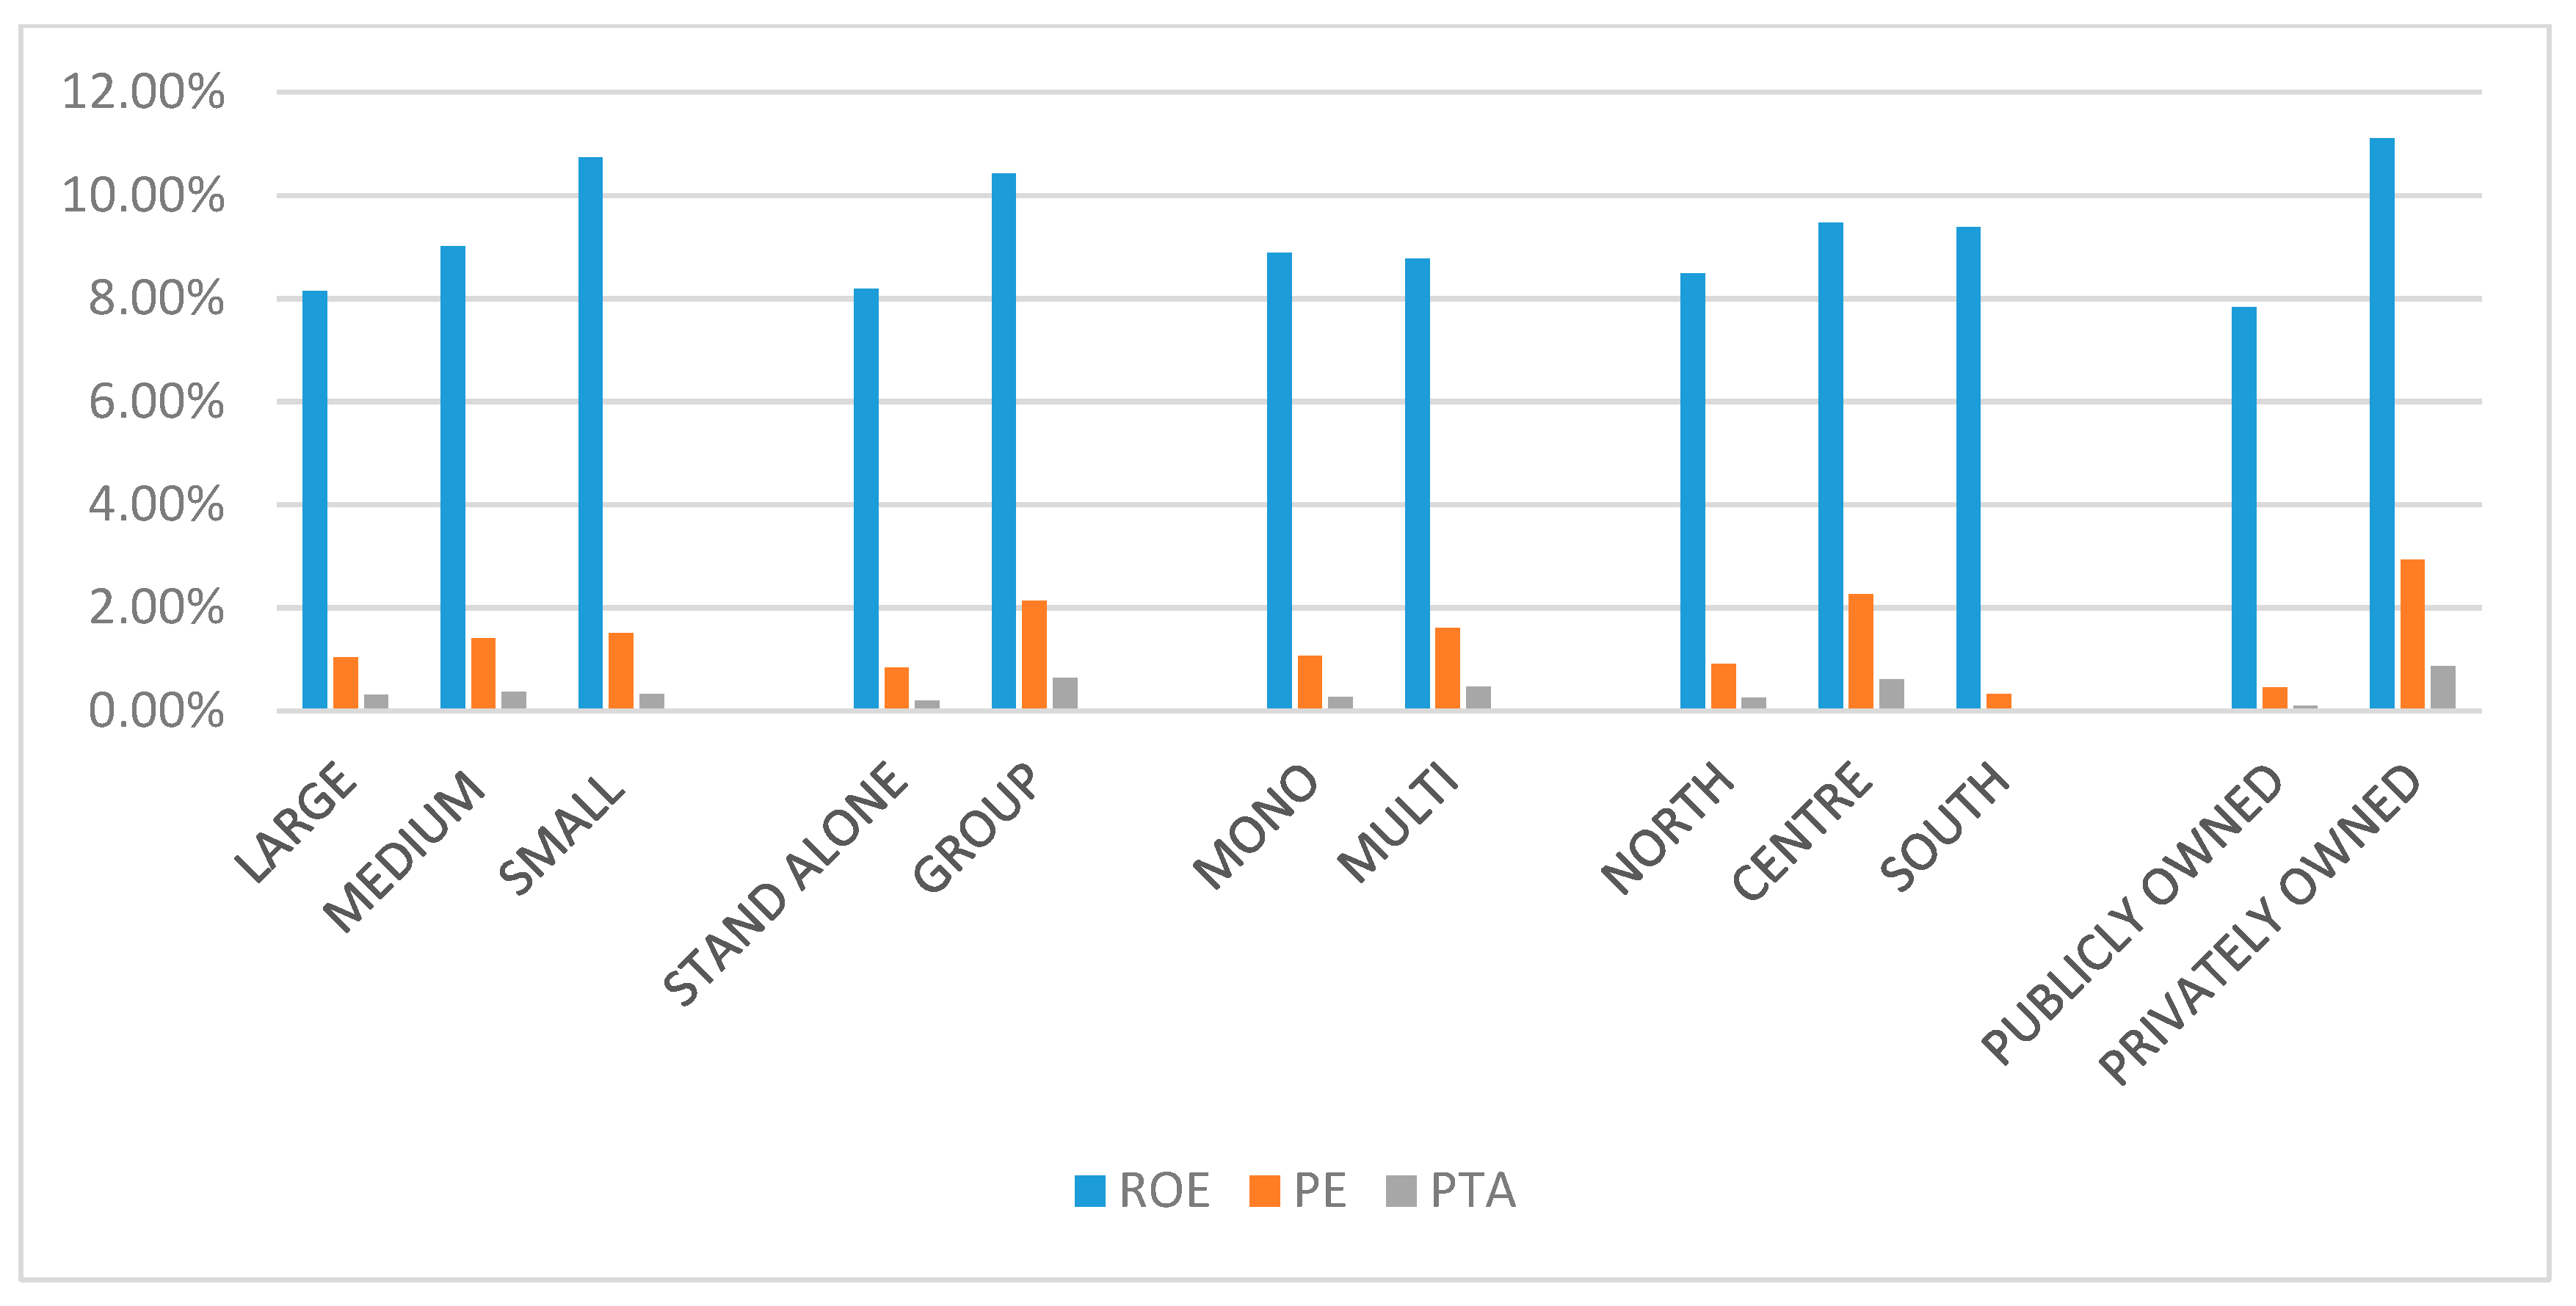
Figure 1 shows ROE, PE, and PTA for the clusters of utilities investigated. While ROE measures the return on equity, PE measures the percentage of equity distributed to shareholders, and PTA is the proxy to represent the portion of assets that cannot be realized or renewed because of the payout policy. It is clear that firms might not finance investment from retained earnings; therefore, this indicator should only be considered as a proxy.
ROE, PE, and PTA were higher for companies with mixed and private ownership, small size, located in the center of Italy, and operating in a business group. Considering the scope of operation, both mono- and multi-utilities had similar ROE, but the multi-utilities showed a greater payout on equity and on total assets. This could be because businesses other than water in which multi-utilities operate (e.g., energy and gas) are partially regulated in Italy and have highly competitive segments, whose expected payout could be higher due to their higher risk profile.
6. Discussion and Conclusions
This study investigated the returns paid by Italian water utilities during the six-year period of 2009–2014. Despite the importance of utilities—particularly of water utilities—to the global economy, and the urgent need to finance and increase investments to improve the quantity and quality of service while reducing environmental impact, most studies that investigate dividends exclude utilities and other regulated non-listed firms (water utilities are mostly non-listed firms and are highly regulated). Thus, this is an important topic, providing data on returns paid to shareholders of water utilities in a major European country such as Italy.
Results show that most Italian water utilities do not distribute any returns to shareholders, and instead reinvest profits in self-financing. This result partially contradicts existing literature, which places network industries such as the water industry among the highest dividend-paying sectors [
5,
17,
18]. However, in the two years since the enforcement of the new national tariff method, the share of Italian water utilities paying dividends increased (20% and 19% of the total in 2013 and 2014, respectively). This supports the literature that revealed that most regulated firms pay out a higher portion of their earnings than firms in non-regulated industries [
18,
21] and that high corporate payouts are the outcome of higher transparency and shareholder protection induced by a clear tariff-setting method [
20]. Therefore, regulation may directly or indirectly influence dividends paid by regulated firms [
5,
21].
This study empirically examined some operating and environmental factors that might affect the returns paid by water utilities, such as firm size, localization, ownership structure, and strategy features (membership of a corporate group and being a mono- or multi-utility).
Large water utilities, those that belong to a group, multi-utilities, and firms located in the center of Italy always paid more frequent returns than did others. In most cases, these water utilities realize higher returns on equity than do firms in other clusters. As expected, we found that mixed and private water utilities tended to distribute more frequent returns to their shareholders than did wholly publicly owned companies. In many cases, this policy gave financial returns to both private investors and municipalities that participate in a mixed company. As expected, publicly owned water utilities (and their shareholders) were keener than other types to renounce the payment of returns. Except the obvious profit orientation of private shareholders, the forthcoming expiration date of concession contracts, associated with a low likelihood of infrastructure renewal, could also affect the choice of dividend maximization in private and mixed utilities: thus, the improvements in cash collection through dividends could be a form of risk mitigation. Past studies showed that privately owned Italian water utilities and those that had mixed ownership realized lower investments than publicly owned utilities, demonstrating the higher propensity of the latter to invest to improve water and sewerage mains and water treatment and wastewater plants [
31]. However, this result contradicts empirical results about another regulated industry, that is, the electricity industry [
5], where state-controlled firms are found to pay larger dividends than firms with a different ownership type, supporting the idea that publicly owned utilities prefer to use dividends instead of direct taxation to enforce political preferences.
Payout reduces cash flow and may constrain the investment decisions of managers. Opportunities to use self-financing to realize new investments instead of paying out profits are vast and should be evaluated considering the decision at the shareholders meeting to distribute dividends. This evaluation should be made with particular caution in publicly owned utilities. Payouts might instead be used to make investments needed to reduce water losses—an aspect that conflicts with the common water scarcity for Mediterranean countries and that is further increased due to the impact of climate change. Without payouts, firms could increase their investment to improve wastewater treatment, reducing the infringements of the European legislation and improving environmental sustainability. In addition, new plants to increase treated water reuse could be realized in a circular economy approach, in particular to support agricultural needs in increasingly dry areas and in the growing number of arid areas.
To achieve further investment to improve water quality, water availability, and service quality, managers can utilize different types of leverage, that is, collecting funds from banks and third parties, or improving equity through profitability, and then self-financing. This second pattern can be followed by bargaining over tariff increases with local regulators and/or exerting more stringent control over both operating costs (even by reducing water quality, water availability, and service quality) and financial costs incurred on debt collection. Although the utilities cannot directly handle the tariff, and is “cost-reflective” in the Italian regulatory system, the local water authority has the power to “cut the fat” setting lower tariffs for the company than those allowed by the tariff method (and consequently, lower margins) to the company. The bargaining power of utilities also conditions this choice, as they can exert pressure on the local water authority to recognize the allowed tariff growth, to enable them to collect more funds, for example, through a higher amount of the tariff component allowed for new investments, under a new tariff-setting component called the Fund for New Investments (FoNI).
Further research is necessary to investigate these issues. The dataset can be extended by including data for more years, adding new financial indicators, new data about the number and type of shareholders (i.e., number of municipal shareholders, amount of collected FoNI, and its bookkeeping method), and allowing cross-country comparisons to investigate the impact of different regulatory frameworks. Moreover, adding data about tariffs could support the analysis of links between tariff increase, investment realization, and dividend policy.


