1. Introduction
Fueled by the spiking demand for sustainable solutions in recent years [
1], sustainability is increasingly recognized as an important competitive leverage [
2] and a key innovation capability for manufacturers [
3]. This has triggered the rapid evolution of the design for sustainability discipline [
4,
5,
6], which is shifting focus from the selection of resources with low environmental impact, to life cycle design and eco-design of products, to designing for eco-efficient product-service systems (PSS) [
7]. By broadening the notion of the system to be optimized, PSS has the potential to create synergies among profit, competitiveness, and environmental benefits that cannot be obtained when focusing on product development only [
8]. Yet, not all shifts to PSS result in an improved sustainability profile for manufacturers. Rather, a PSS must be specifically designed, developed, and delivered if it is to be highly eco-efficient and/or socially sustainable [
7].
The broadening system perspective challenges existing methods and tools for design and development, forcing the engineering team to move from product thinking to system thinking [
8]. Going beyond a single product life cycle to an interconnected series of product/service cycles highlights the importance of including “downstream” objectives (e.g., serviceability, flexibility, upgradeability, recyclability) in design decision making. These are often conflicting with product-related requirements and need to be carefully traded-off from an early design stage [
9]. For instance, making a product more durable for lasting along several life cycles may hinder resource efficiency in the design, even if this strategy may generate a positive net value in the long term [
10]. Similarly, modifying the PSS hardware to improve components’ accessibility—so to improve serviceability, maintainability, and changeability—may weaken its construction, thus its performances in operation [
11]. After-sales service requirements further influence the design of the PSS hardware, and need to be considered already in the early stage of the design process [
12].
A large network of stakeholders is typically involved in the design of the PSS eco-system. The information they carry needs to be modelled during the evaluation of PSS options [
13], so to identify optimal solutions from the perspectives of technological feasibility, user-acceptability, and sustainability [
7]. Processes and tools for PSS assessment shall then be designed to facilitate participation in the definition of the evaluation criteria, mixing value- and sustainability-related considerations [
14]. To facilitate a participatory process, they shall be simple enough to be understood by the design team members across disciplines and roles. By “sitting in the middle” among disciplines and roles, they shall facilitate individuals in sharing primary domain knowledge [
15], supporting them in describing what they know about the functional and behavioral characteristics of the PSS. These tools shall be “transparent” so that individuals from different disciplines can probe assumptions and models to learn about dependencies across the disciplinary boundaries [
16]. They shall also be “pragmatic” [
17] enough to be applicable not only at a strategical and tactical level (e.g., those reported in [
18]), but also at an operational one.
A main challenge in designing decision making support to support such a participatory process is to find the right trade-off between simplicity and detail. Several popular tools for sustainable PSS concept evaluation are based on qualitative marks based on a checklist (e.g., in [
7,
19]), or on simple scoring scales (e.g., [
20]). Yet, literature recognize the need to be more systematic in this task [
21], something which is observed to positively affect the market success of the PSS offering, leading to fewer design modifications and shortened time-to-market [
13]. There are several challenges in being “systematic” when balancing between functionality, cost, environmental, and social impacts. Firstly, early-stage design decisions are dominated by ambiguity, uncertainty, and lack of data, which impede the application of quantitative models to “frontload” [
22] the PSS development process. Secondly, sustainability implications are difficult to compare against performance-related capabilities. Customer value and sustainability are often considered two opposite perspectives that need to be reconciled [
14]. Sustainability requirements are not discussed exclusively in PSS design [
15], rather they are traded-off with other customer satisfaction- and performance-related attributes, such as weight, purchase price, or fuel burn requirements in the aerospace sector [
23,
24]. Hence, it is far from evident how sustainability-related criteria shall be defined in conjunction with more traditional performance parameters, and how they shall be “mixed and matched” with, for instance, quality, time, and cost in PSS design decision-making [
25,
26].
The research work is motivated by the perceived absence of processes and tools able to seamlessly resolve sustainability vs. value trade-offs in PSS design. The objective of this paper is to investigate how multi-criteria decision making (MCDM) models shall be applied to down-select PSS concepts from a value perspective, by considering sustainability as one of the attributes contributing to the overall value of a solution. After a systematic review of the literature, the paper describes the main results from a multiple case study conducted in collaboration with two Swedish manufacturing companies with experience on PSS design. Based on these findings, the paper prescribes a five-step iterative process for the systematic assessment of value and sustainability of PSS concepts, which is later applied in the design of a fully electrical load carrier. The paper later discusses the validity of the proposed approach and the criticalities of the research design, as well as the opportunity of creating a physical environment to gather the cross-functional design team to negotiate PSS design trade-offs from a value and sustainability viewpoint.
2. Research Design
The design research methodology (DRM) proposed by Blessing and Chakrabarti [
27] was used as the main reference throughout the research. DRM consists of four stages: Research Clarification (RC), Descriptive Study I (DS-I), Prescriptive Study (PS), and Descriptive Study II (DS-II). This paper covers a review-based RC, comprehensive DS-I and PS, and an initial DS-II. The research was further based on a multiple case study approach [
28]. The multiple case design kicked-off by selecting relevant case studies on the basis of theory developed from a literature review on the topic of value and sustainability assessment for PSS design (see
Section 3). From this understanding, two cases were selected to gather empirical data and draw cross-case conclusions; one in the construction equipment and the other one in the aerospace sector. The first case study company is a world-leading total-solution provider (offering servicing, financing, used equipment, rental, and other services) of articulated haulers, wheel loaders, excavation equipment, road development machines, and compact construction equipment. The second one is active on the global market as a design-make supplier to major aero-engine manufacturers, in various product and technology development projects, mainly for gas turbines, aircraft, and rocket engines. It functions as an independent risk and revenue sharing partner, and assumes responsibility for certain engine components, from development, design, and manufacturing, to repair and maintenance services throughout the entire lifetime of an engine type. Noticeably, the selection of cases with such different sectorial requirements follows a logic of “literal replication” [
28], which is that of finding similar results in different contexts to eventually provide compelling arguments for the initial proposition. Yet, they show some important similarities: both companies are active in the business-to-business sector and offer PSS-based contracts to their customers as part of their portfolio. They have experience with cross-functional design teams and have cultivated lessons learned on the need to facilitate a participatory process in the design. At the same time, their business is facing rapid transformations, largely driven by the same macro trends: digitalization, connectivity, electrification, artificial intelligence, and resource scarcity.
The empirical data collection protocol was designed in parallel with the selection of the cases, as prescribed by [
28]. The main aspect of interest in the empirical data gathering stage was to understand the role “value” has in the collaboration between different expertise in the organization (e.g., marketing, engineering, aftermarket, service solutions) when dealing with early stage PSS design decision making. From this understanding, the research has investigated how sustainability is interpreted in the different roles, and how it is linked to a value perspective by the use of appropriate argumentation. The selection of the interview respondents was based on a “strategic and purposive” sampling strategy [
29]. This means that the sample was not intended to be statistically representative, rather the individuals being interviewed were selected “with a purpose.” Experience with model-based support for engineering and PSS design, together with knowledge of design decision-making tools, were considered as main criteria for purposive selection. The sample was identified using snowballing techniques [
30], with an industrial contact point helping to locate relevant individuals through his/her social network. Researchers took advantage of this opportunity and shortlisted the final sample from the list of names provided, having the care to preserve diversity by including both the “meatiest” respondents and the “peripheries” [
31], so to uncover central themes which cut across the variety of sub-cases or people.
The primary mode of data collection was semi-structured interviews [
32] (average duration: 50 min), with questions being modified or added according to the respondents’ roles as far as the dialogue proceeded. A total of 12 “focused interviews,” eight in the construction, and four in the aerospace sector, were conducted between December 2016 and April 2017. They can be described as exploratory and largely descriptive and were guided by an interview protocol focused on four main areas:
The design process and design concepts generation;
Decision making in cross-functional teams for new products/services;
Value analysis; and
Sustainability assessment and sustainability compliance.
Each phase featured mapping questions to “open up” the subject, featuring minimal probing to allow respondents to raise issues that were most relevant for them. Content mining questions were used to obtain a full description of phenomena and to understand the underpinning behavior of each respondent. This stage featured the use of explanatory probes, asking “why” to search for behaviors, events, and decisions. The use of such probes was iterative and likened the laddering technique from the design thinking methodology [
33]. Amplificatory probes were further used to obtain in-depth understanding of the manifestation or experience of a phenomenon, while exploratory probes (i.e., probing for “feelings”) were seldom used. Perspective-widening questions further encouraged respondents to look at issues from different standpoints, ensuring comprehensive coverage and stimulating further thoughts (e.g., how to visualize the results of modeling activities).
All interviews were audio-recorded, transcribed, and validated by the respondents. Interview transcripts were analyzed using elemental (such as “descriptive,” “in-vivo,” and “process” coding), affective (mainly evaluation coding), and exploratory coding [
31]. The codes were revised as experience with coding techniques for this task grew, and later arranged into patterns. Individual case reports were produced for both cases and cross-company conclusions were drawn by conducting co-located workshops with process owners and other practitioners from both manufacturers. In these events, visual representations and demonstrators of the emerging modeling concepts were verified with company stakeholders to identify critical topics for modeling. Multi-day physical co-creation workshops and analysis of internal company documentation were used as a triangulation method. Participation in regular debriefing activities with the industrial partners and other academics allowed the researchers to step back from their learning experience, to develop critical thinking and improve their analytical approach.
3. Sustainability and Value Assessment in PSS Design: A Systematic Literature Review
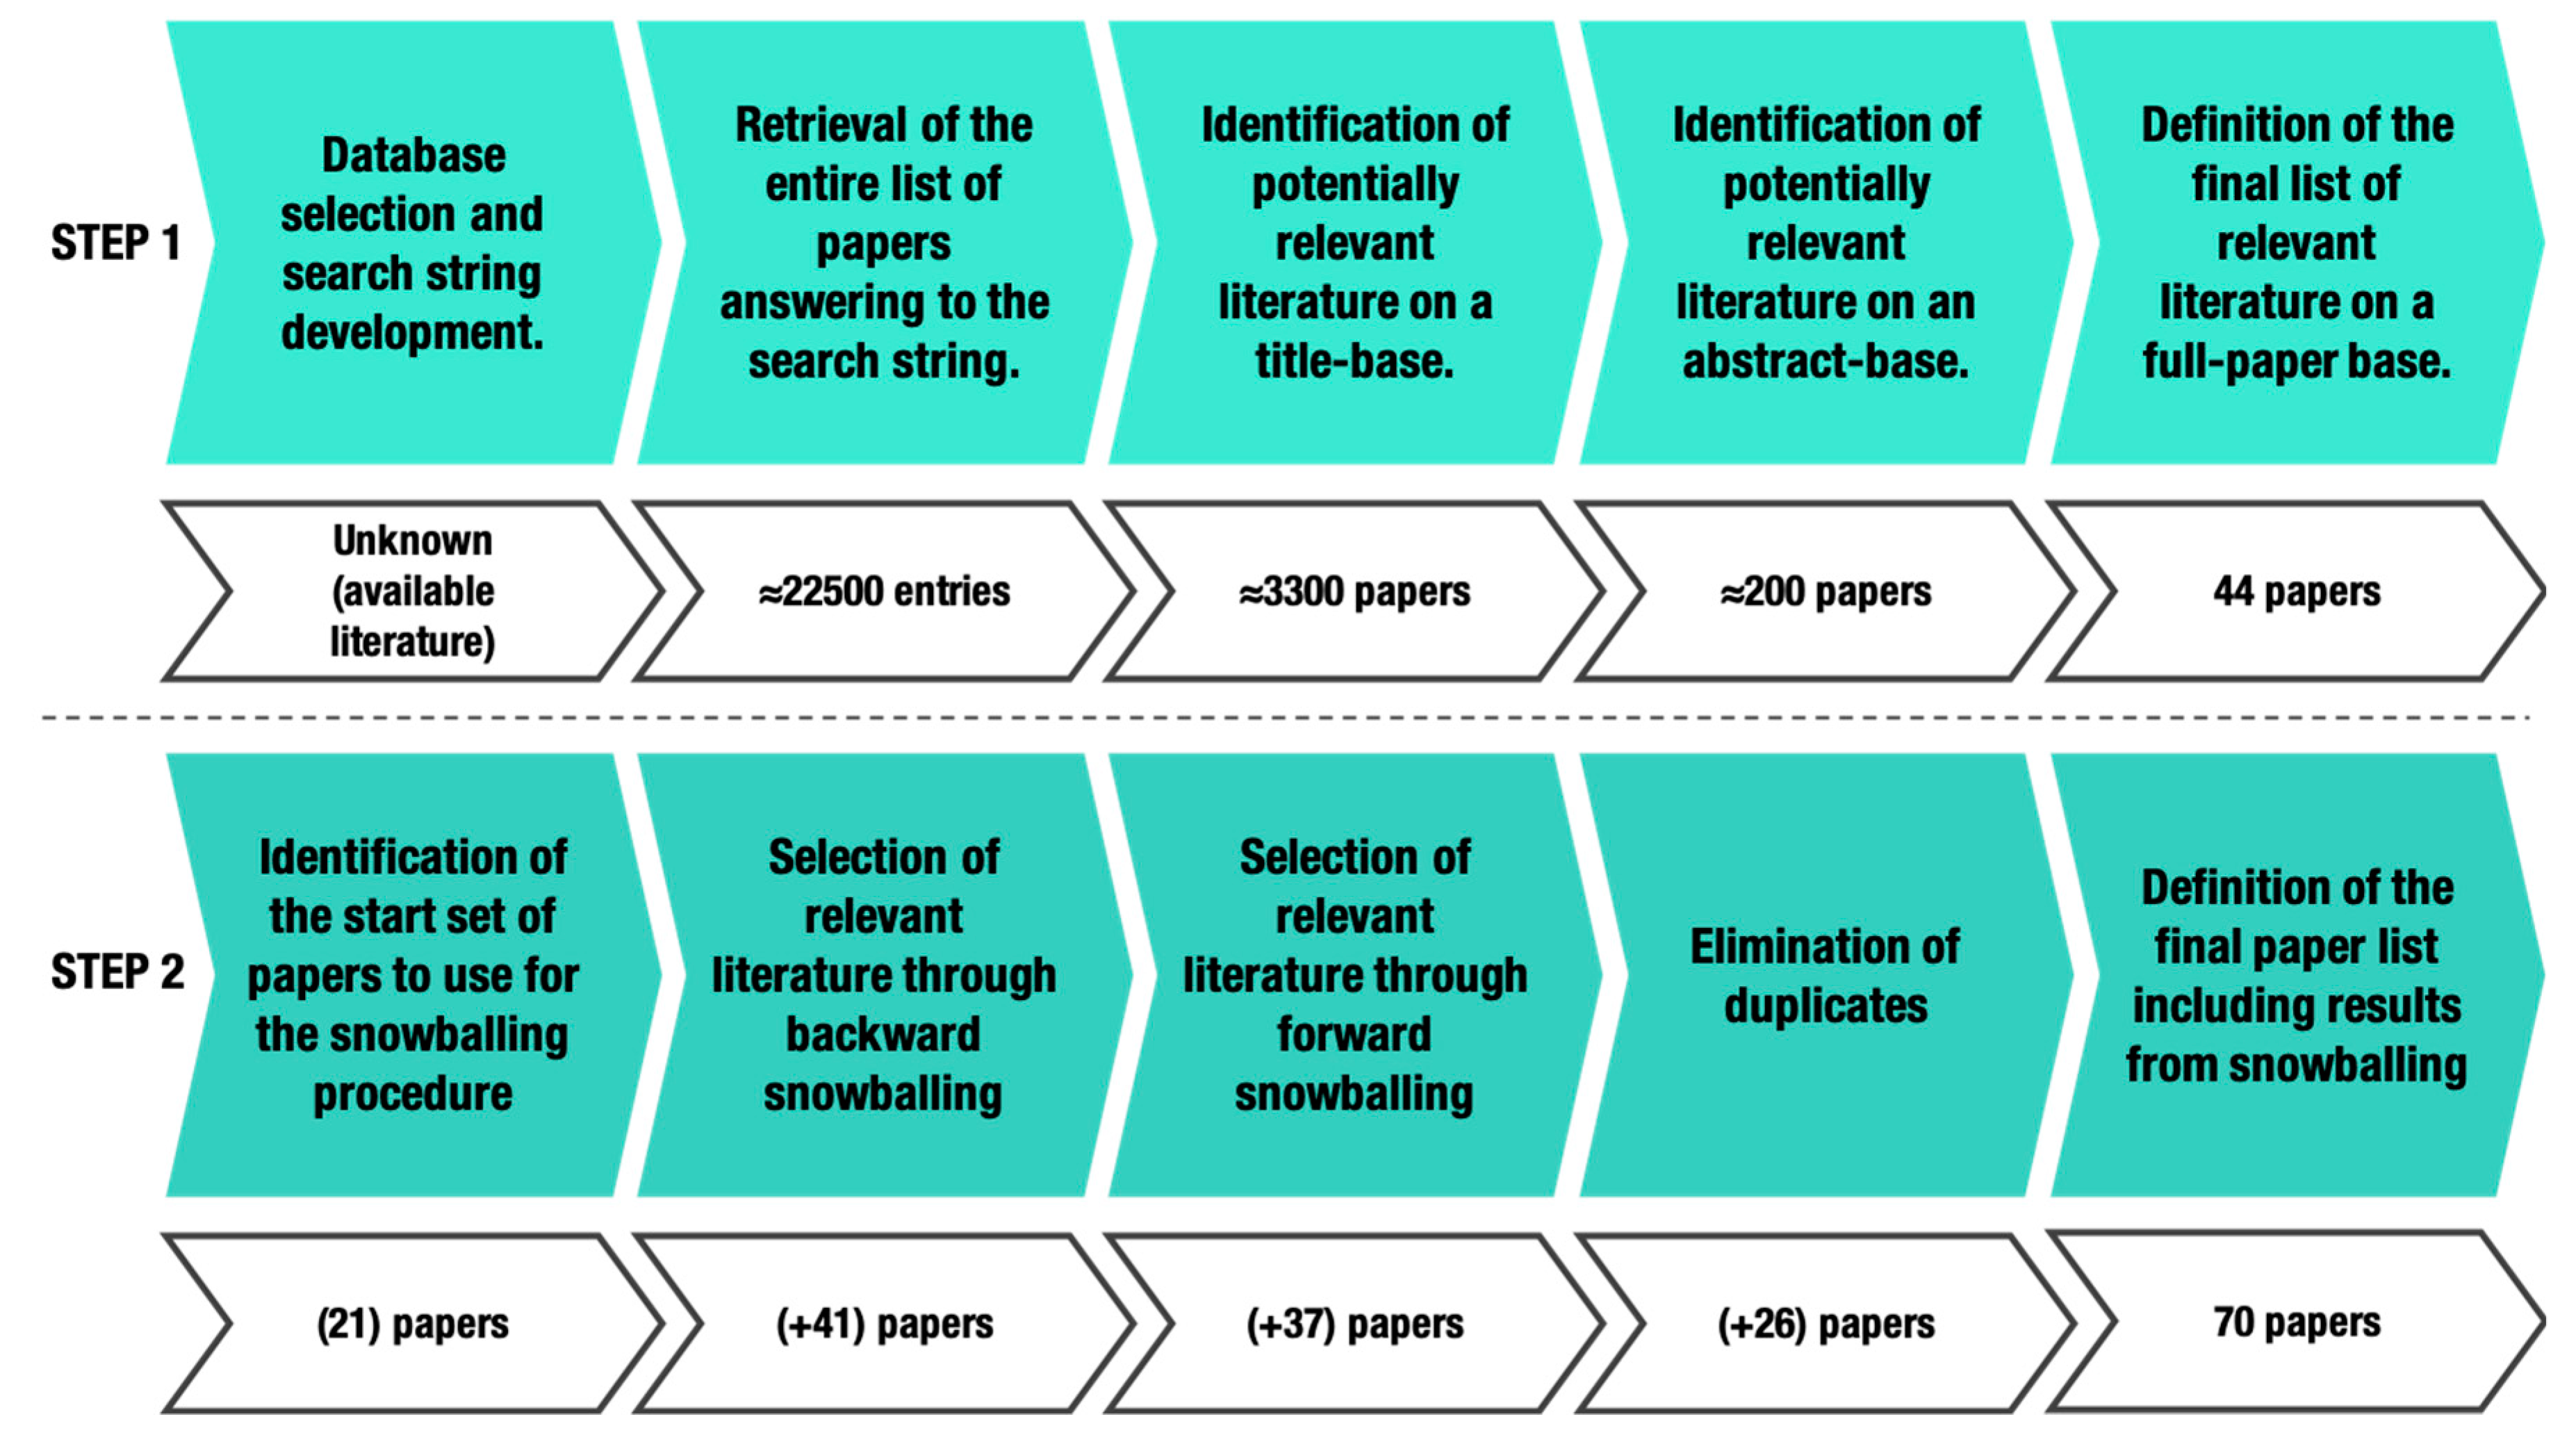
The multiple case design kicked-off by conducting a review on assessment methods and tools used in the literature to link sustainability and value creation in design decisions making. The investigation of scholarly publications followed a two-step process (
Figure 1), with complementary objectives and approaches.
The first step was designed to raise understanding of method and tools for “system” assessment when undertaking innovation and technology development activities. For this reason, the investigation was conducted across different fields and applications to reveal the heterogeneity of methods and techniques for sustainability and value analysis. This analysis aided the identification of several MCDM methods (e.g., analytical hierarchical process, Pugh matrixes, and more), which were further investigated in the PSS field using snowballing. The analysis of the literature in step one followed a process of systematic review through the SCOPUS database. Due to the highly explorative nature of the activity, the search query was kept relatively simple and broad to maximize the number of hits in the database, with publication- and content-based exclusion criteria being later applied to down select contributions. Value and sustainability were considered main keywords to be included in the designed search string. To include nearby terms (i.e., for sustainability: “sustainable,” “sustainably,” etc.), the string was refined using abbreviations and the search operator*. The search was further limited to the domains of “innovation,” “design,” “development,” and “engineering”. An additional set of keywords—”system,” “technology,” “offer,” “product,” and “service”—helped in narrowing down the focus of the investigation by specifying the “item” on which assessment techniques are applied. The resulting search query was:
TITLE-ABS-KEY (Value* AND Sustainab* AND (engineer* OR innovat* OR design* OR develop*) AND (system* OR technolog* OR offer* OR product* OR service*)) AND PUBYEAR > 2006 AND (LIMIT-TO(DOCTYPE, “ar”) OR LIMIT-TO(DOCTYPE, “re”) OR LIMIT-TO(DOCTYPE, “ch”))
A list of publication- and content-based exclusion criteria was used to ensure quality and comprehensiveness of the final list of papers for analysis. Only items of type “article” (journal papers), “book chapter,” and “review” were included in the study. Non-academic, journalistically-written articles, opinion, and experience papers were excluded, together with dissertations, industrial reports, and other technical documents. All contributions published prior to 2007 were eliminated too because they were considered obsolete. Furthermore, only articles in the English language were kept. As for content, articles that mention sustainability or value only incidentally were excluded. Contributions not referring to models, matrixes, and support tools for the MCDM exercise were excluded too, because they were not in the scope of this study. Besides that, articles were not excluded for other content-related aspects, such as research domain, research topic, and specific focus to certain tasks/themes, due to the explorative nature of the review. A total of 44 papers were identified from step one.
The second step aimed at spotlighting specific MCDM methods in the field of PSS, through backward and forward snowballing. The author first made use of the reference list of a paper to identify additional papers relevant for the given research objective (backward snowballing). In a later stage, the citations to the paper were also analyzed to ensure a broader coverage of the literature (forward snowballing). The start set of papers to use for the snowballing procedure was selected from the list obtained in step one, having care to include papers coming from different communities, as well as different publishers, years, and authors. As inclusion criteria, only those contributions explicitly referring to sustainability in the proposed methodology (e.g., using sustainability-related criteria in the MCDM exercise) were retained. A total of 26 papers were added to the final paper list for analysis, for a total of 70 contributions.
Systematic Literature Review Results
Appendix A summarizes the results of the systematic literature review along two main dimensions. Firstly, the selected contributions belonged to six main domains and were concerned with assessing the following items: Organizations, Business models Materials, Projects and Processes, Products and Services, Buildings, and Materials. Secondly, they were classified as discerning between major MCDM methods. Eventually, a distinction was made between those contribution based on the triple bottom line (TBL) framework [
34]—one of the most popular attempts to reconcile economic, social, and financial value when assessing the performances of a system from an overall perspective—and those that are not.
The results highlighted the uneven distribution of the research effort in the different areas. The main observation was that literature was scattered with regards to the application of MCDM methods in the different competence domains, as well as to the definition of the criteria for the decision-making exercise. At the same time, the review showed the application of seven multi-criteria matrix for sustainability and value analysis. The analytical hierarchical process (AHP) was seemingly one of the most popular and “horizontal” approaches to mix sustainability and value aspects in the decision-making process. Its popularity was transversal across applications, mainly because the logic of pairwise comparison was easy to grasp by the members of the decision-making team. The analytical network process (ANP) was also a popular choice in the field. Its main strength was found in the ability to model the dependencies and feedback between the decision-making elements, which AHP does not consider. In this way, it was possible to calculate more precise rank-weights for the sustainability and value criteria, at the cost of increased complexity in the assessment.
Quality function deployment (QFD) and the technique for order of preference by similarity to ideal solution (TOPSIS) are popular assessment techniques in the PSS field. QFD, which is often used in conjunction with the life cycle analysis and life cycle costing tools, is often chosen not only for its ability to support the definition of the main PSS features, but also of the PSS tangible and intangible assets, resources needed for service implementation and partners in the network. Its ability to display, in a clear and understandable way, the relative importance among design requirements, resources, and process activities in relation to the main customer need(s) is another reason for its widespread use. Industrial practitioners are found to appreciate the intuitiveness of the approach and have been observed to manipulate weights and correlation coefficients with ease, as well as to be able to learn quickly the mechanisms of the assessment. While the house of quality in QFD creates a clear link between value criteria and requirements for a product or a service, the main selling point of TOPSIS is its ability to render an ideality score (from 0 to 1) that is easy to communicate to all relevant stakeholders. TOPSIS is advocated to be an optimal choice in early-stage PSS decision making, due to its relatively low computation complexity. The method requires comparably less time than other MCDM methods to assign scores and grades. For instance, pairwise comparison requires multiple hierarchies to be established, which limit the ability of the cross-disciplinary team to manipulate the tool. Furthermore, the pairwise benchmarking of a large number of criteria pairs is much more time consuming than the TOPSIS setup.
Fuzzy logic and rough numbers are popular techniques to handle uncertainty in the models, even though no more than half of the reviewed publications foresees mechanisms to account for uncertainty in the assessment. The review further showed isolated attempts to exploit other techniques, such as data envelopment analysis (DEA), grey relational analysis (GRA), and the TOPSIS method. Several other multi-criteria approaches were identified, together with highly customized methods built on the approaches mentioned above. Noticeably, a great deal of contributions exploited the triple bottom line framework to guide the definition of the criteria for the assessment, particularly in the building/constructions sector and for the selection of supply chain partners. The list of contributions, reviewed in
Appendix A, further spotlighted the problem of generalizing an approach from which to initiate the construction of a value and sustainability model. Several methods are developed ad-hoc for a specific problem or industrial application, and research efforts are often poorly connected with similar initiatives in other industrial sectors. Furthermore, most contributions are backward looking and rarely applied to proactively set future targets for the design of a new system. The literature showed only a few examples of how to use MCDM to grow understanding of the consequences generated by future courses of action in a given scenario, and of how MCDM can boost organizational integration capabilities, stimulating learning in the what-if analysis exercise.
4. Empirical Study Findings
The literature review results guided the selection of the case companies for the empirical investigation. Empirical data were gathered to better understand those factors that contribute to (or prohibit) success in PSS design assessment activities in the organization, supporting the development of the prescriptive approach presented in
Section 5. The empirical study insisted on several aspects of interest for the development of a MCDM approach for value and sustainability. Initially, it investigated how industrial practitioners undertake down-selection activities for system concepts. An aspect of interest with regards to enabling a “participatory” process is how PSS are described in these decision events, and to what extent such representations carry “value” and “sustainability” information in a systematic way. The study further aimed at understanding to what extent PSS design decisions are “participatory” today, by analyzing the power balance between different functions and disciplines at decision gates. It further highlighted what criteria are believed to be important to guide early-stage decision making activities with an outlook on the value and sustainability dimensions. Eventually, it explored how the contribution of a design along such criteria shall be displayed correctly to the team at the decision gates.
4.1. Describing and Assessing Early-Stage PSS Concepts
Decision making across the case studies was found to follow a set-based approach along the complete PSS design and development process. This working mode foresees the generation and progressive deselection of concepts that are considered not feasible. Once a target value is set, different ideas are compared based on their ability to achieve given performance or requirement targets. In case they do not, the concept is excluded. In order to understand how sustainability and value shall be described in the early-stage MCDM exercise, it is important to know how design concepts are described in an early phase. Respondents were asked to describe how PSS design concepts are represented in the early phases of the design process, and how these representations mature as far as more information becomes available. The interviews reveal the lack of a standard approach for documenting PSS concepts. These are commonly described using those tools that are familiar to the specific discipline of the idea owner:
“(in an early stage) …It could be a few lines of text… It could be something written down on a meeting… It could be a software thing, it could be a hardware thing, it could be… it could be really anything. (…) If you are good in simulations… it is probably the way are going to do it, to present ideas. If you are a CAD, a mechanical engineer, you would probably go directly to make a 3D model.”
The use of a quantitative model to describe these early concepts is often discouraged, and a qualitative approach is considered by most to be a better fit for the initial down-selection loop.
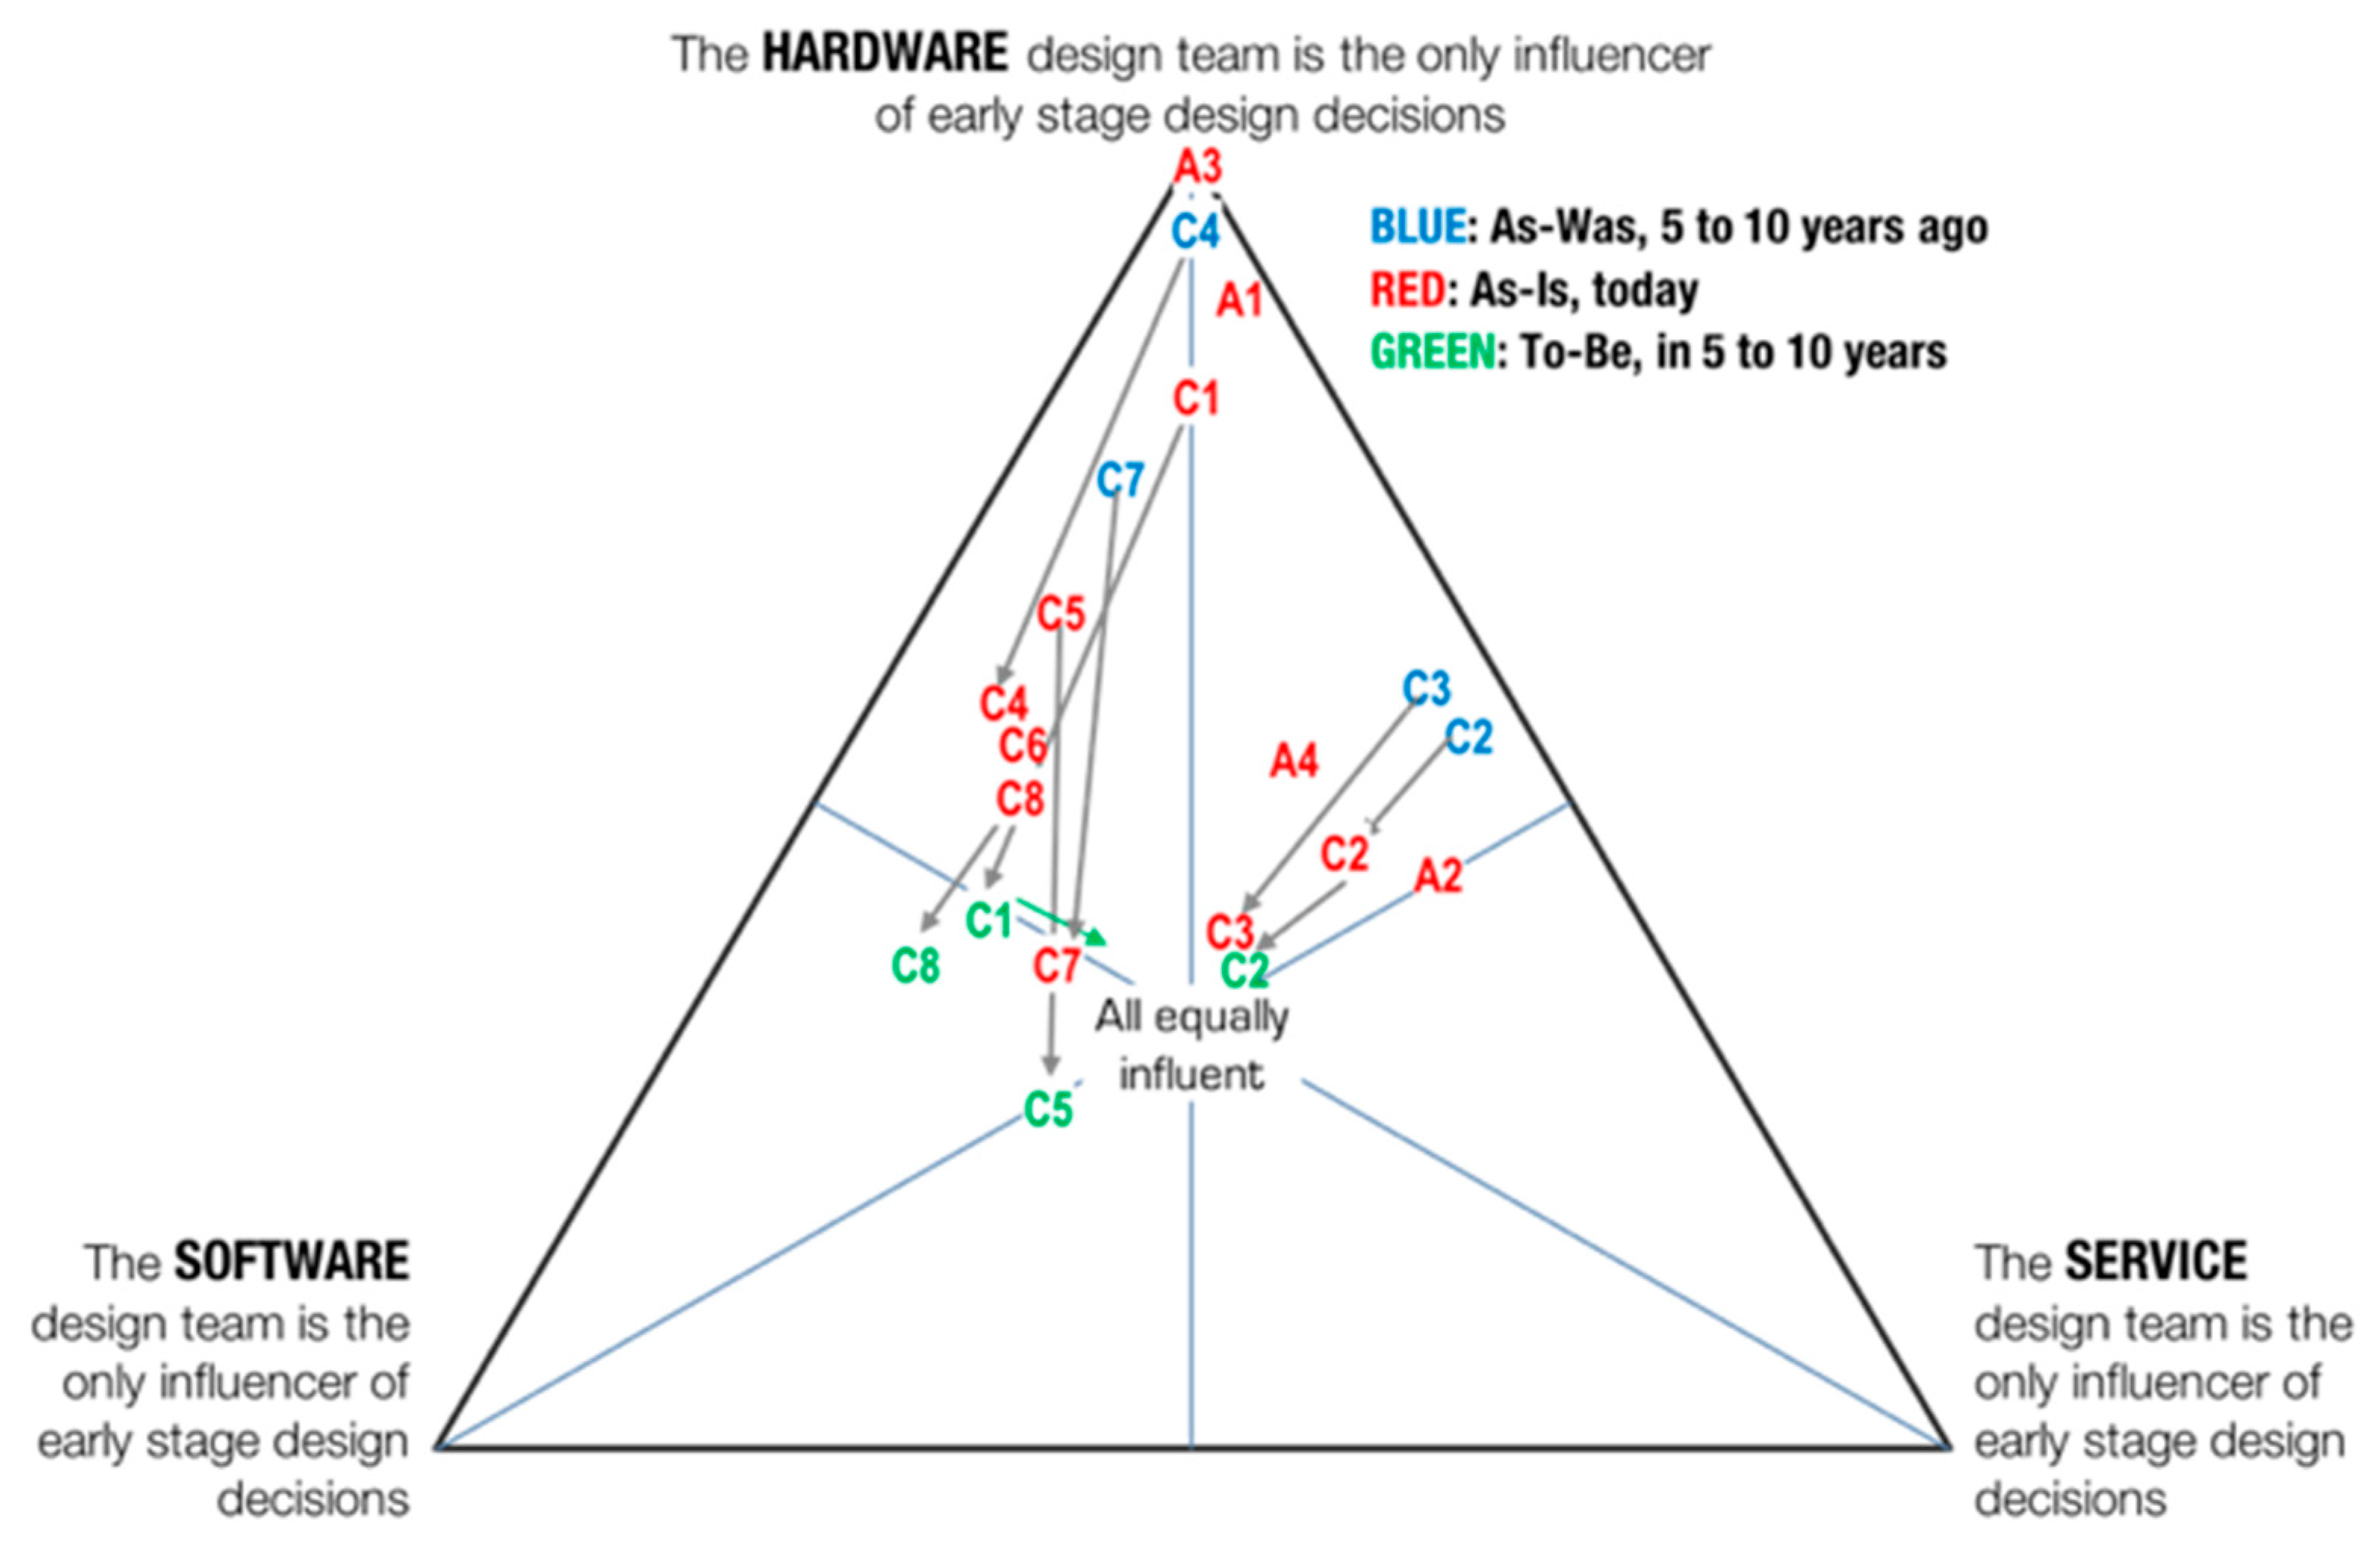
The interview respondents were further asked to elaborate on which discipline is the most influential today when it comes to driving early stage decision making for PSS. Responses were collected using a Ternary plot. The latter, also known as Finetti diagram, graphically depicts the ratios of three variables as positions in an equilateral triangle. Every point on a plot represents a different composition of three variables (a, b, and c) under the assumption that these are not independent of one another. Since their proportions cannot vary independently—there are only two degrees of freedom—two variables must be known to find a sample’s point on the graph and their sum must always render a constant value of 1 or 100%.
The three edges of the plot shown in
Figure 2 represent three broad disciplines within the PSS cross-functional design team. On the top of the diagram, the HARDWARE function refers to those individuals developing technologies and physical products. The SOFTWARE function deals with the development of the software architecture of the system, at different levels (from sensor programming to cloud service architectures). The SERVICE function represents those individuals working with the development of all the necessary services (above and below the customer line of sight in the service blueprint) featured by a PSS solution. The area at the center of the triangle captures situations in which these three teams are equally influencing early stage decisions. Moving towards one edge of the triangle means that the related function becomes more influential in decision-making than the remaining two.
Each respondent (A1 to A4: aerospace sector, C1 to C8: construction sector) was asked to pinpoint how the three functions influence the outcome of early-stage decision making at the company, at different points in time. They did so by placing one or more crosses on the plot to indicate what aspects have been, are, and will be influential in their organization.
The main observation was that, in the past, early stage decisions were largely dominated by product-based considerations. Historically, the performances of the physical hardware have to be given higher priority compared to service considerations, which tend to be overlooked when down selecting solutions. In practice, the “hardware” design team is often the one responsible for allocating the budget, taking the final decision in terms of project prioritization and kick-off. Yet, there is a growing awareness among the sample about the need to integrate software and service skills to guide future decision-making activities, as a PSS thinking will become more acknowledged and established. This shift requests a new type of decision-making support that is “generalist” enough to be understood, used, and manipulated by all the functions in the organizations, and that can seamlessly integrate with more domain-specific tools.
4.2. Decision Criteria for Early Stage PSS Assessment
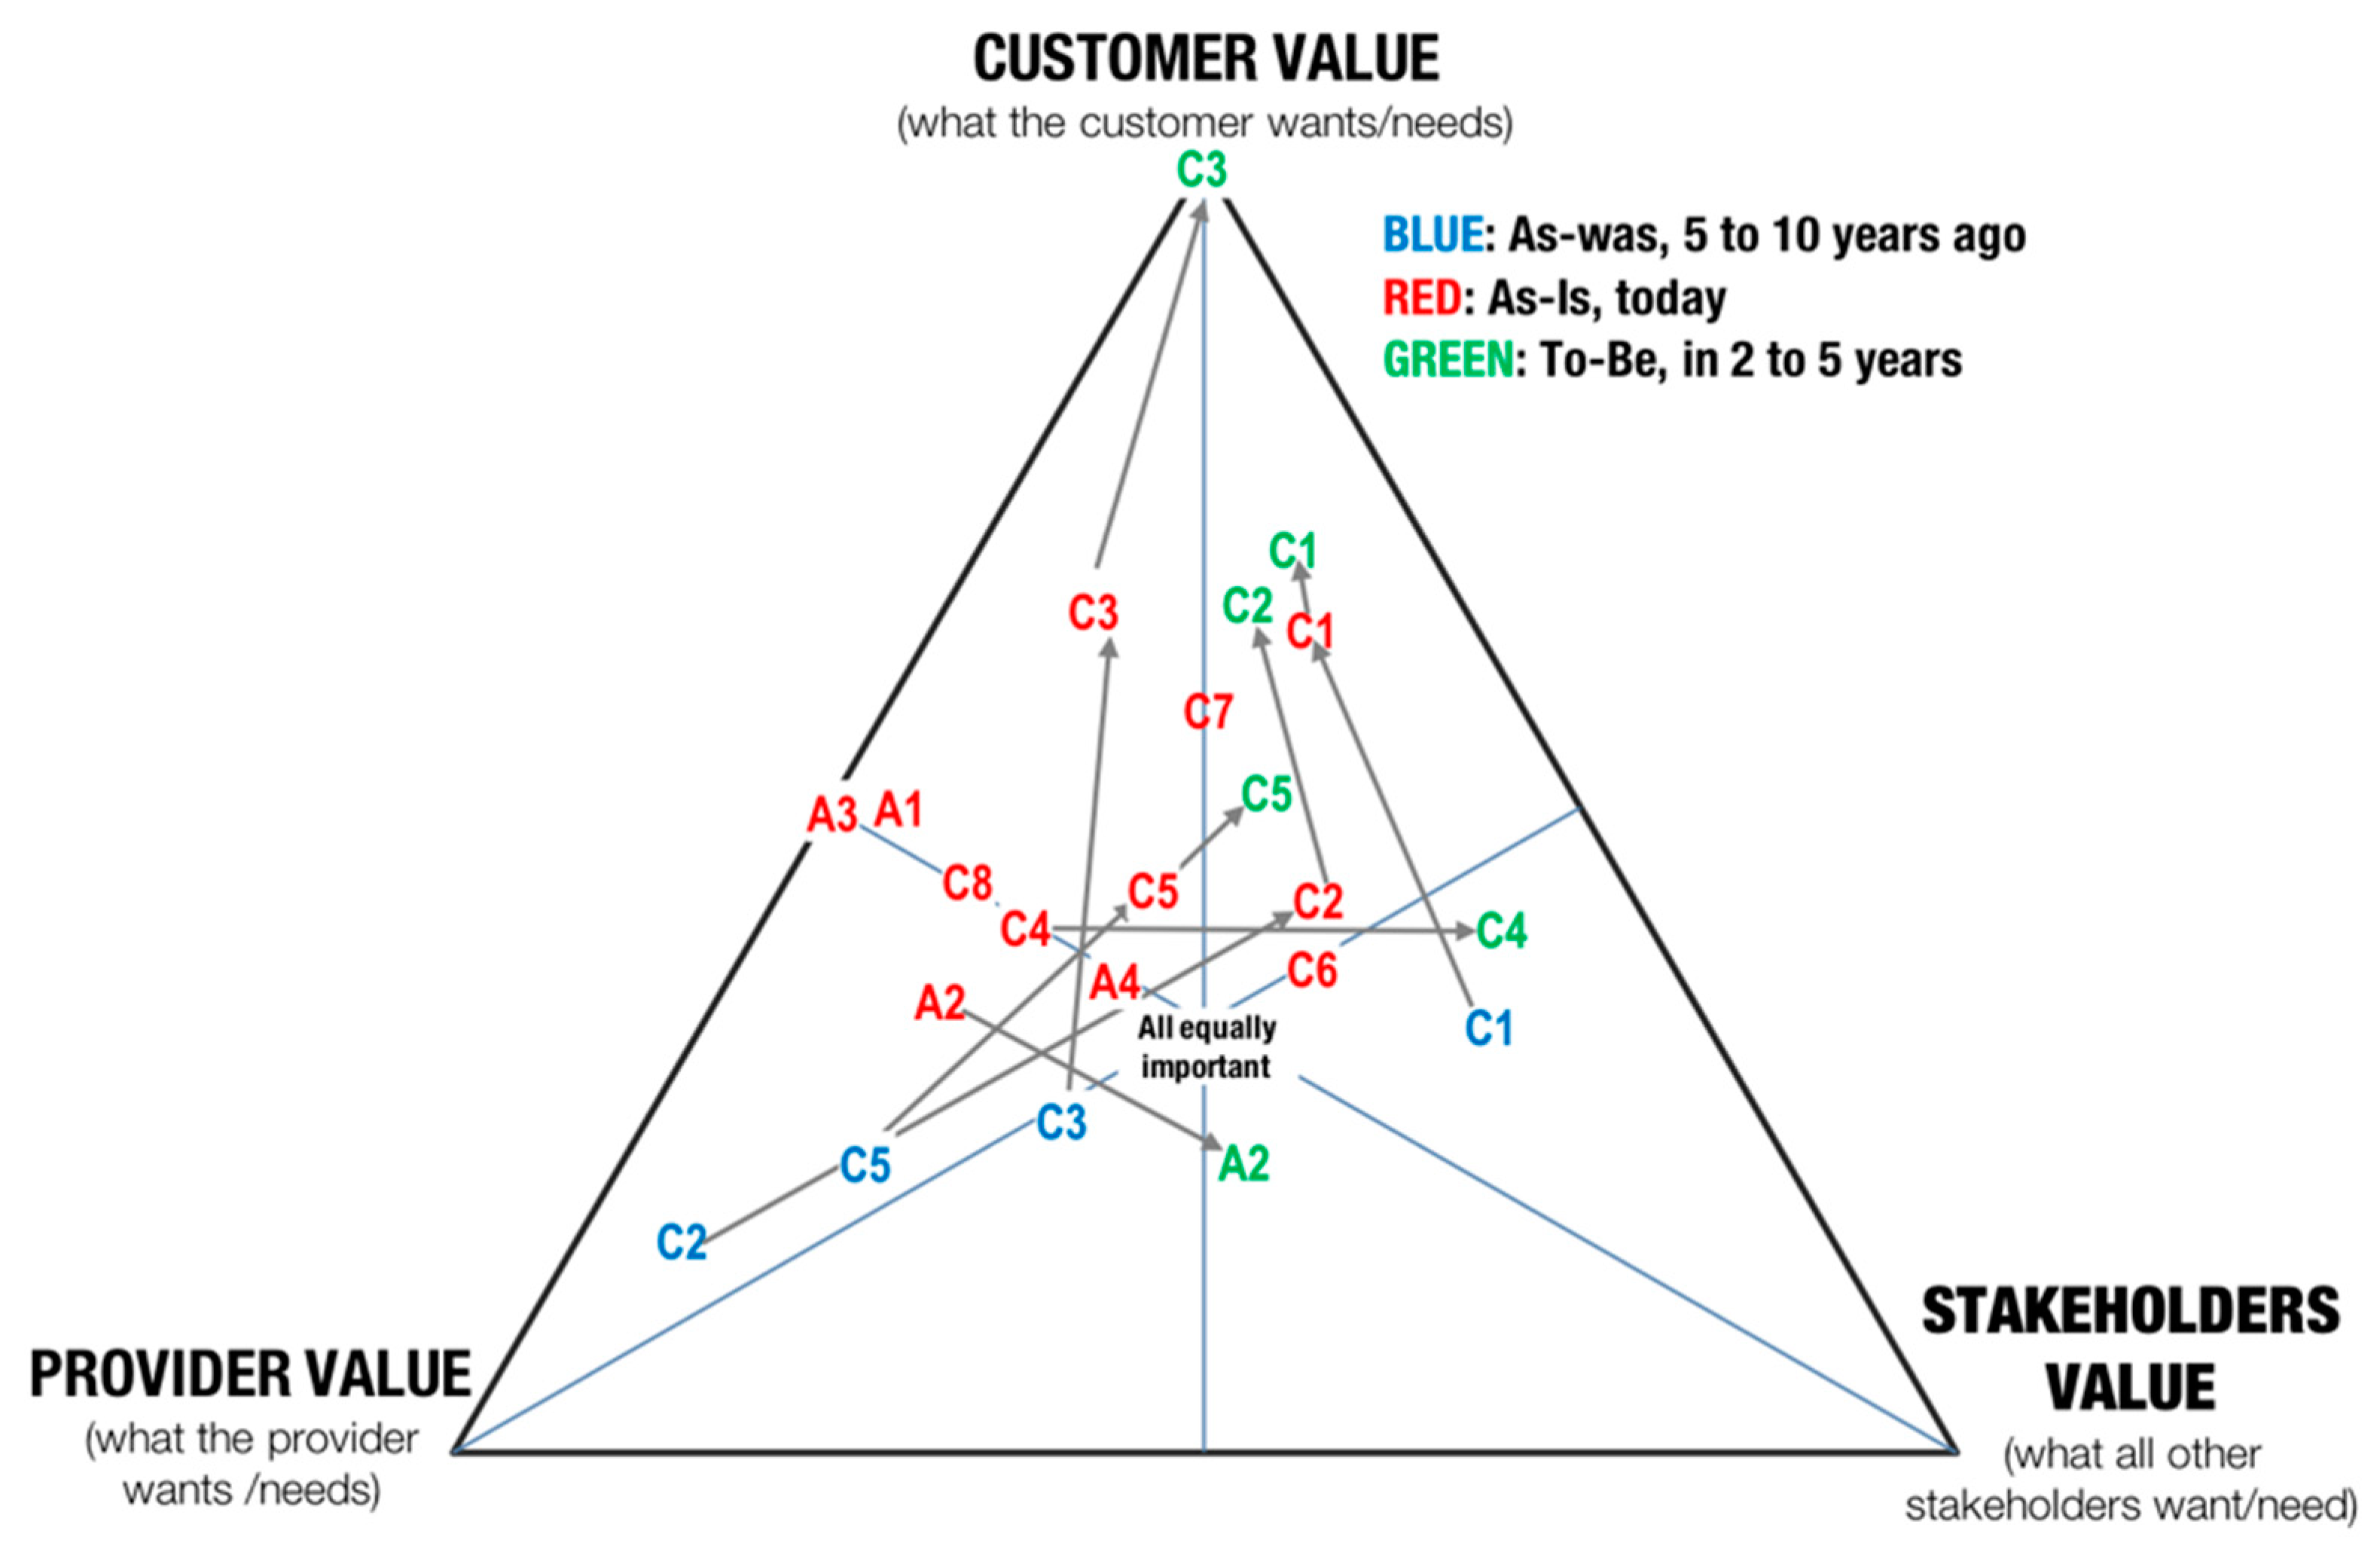
The empirical study further investigated what aspects of “value” are used to drive early-stage design decision making at the company. Additionally, in this case, the interview respondents were asked to formalize their answers by indicating a specific point on the Ternary plot (
Figure 3). The edges of the new plot referred to three “areas” of value in the organization, which were customer value (what the customer wants or needs), provider value (the strategic goals of the provider organization), and stakeholder value (what other actors, including suppliers, governmental organizations or local communities might want or need). The red dots featured in
Figure 3 show a good balance between these three main areas, with customer value considerations being found to be a dominant argument to “sell” a design concept within the cross-functional team. Some of the respondents pinpointed, also, where the company was positioned in the past (blue dots) and where it is directed in the near future (green dots). These trajectories reveal a growing awareness about the need for including a diverse and multifaced mix of decision-making criteria for early-stage design. While in the past early stage decisions were dominated mostly by internal considerations (revenue, profit, margins, commonality in manufacturing, and more), there is a need for proxies that are able to picture, with more granularity, what creates value for the customers and the broad range of stakeholders of the system.
Another aspect of interest in the empirical study concerns the trade-off between simplicity and detail in decision making. Some of the respondents highlighted the importance of avoiding complexity in down-selection activities, because “too complex spoils the decision”, and too many parameters make it harder to spotlight what they key drivers are. Still, several practitioners acknowledge that, even if simplicity is welcome in an early stage, it raises the risk of oversimplifying the message and missing what is important. When design concepts are similar, benchmarking activities shall be conducted using several criteria. Yet, when concepts are very different in nature, a few representative metrics are preferable. The targeted audience is a major aspect in resolving the trade-off between simplicity and complexity. Within the engineering community there is a need to display more nuances in the data, while the involvement of business and managerial skills in the decision implies a transition towards simple messages that are easily communicated and grasped. Time pressure is further considered the main aspect playing in favor of simplicity, as highlighted by one of the respondents:
… we are so busy that we do not have time to dig in and to understand all these details… simplicity is very important. Otherwise, people would just say “it is too complex; I do not care”
A follow-up question investigated the exact number of criteria that is believed to be ideal for guiding decision-making activities in an early stage. Most of the respondents agree on the use of very few metrics in an early stage. As a rule of thumb, as far as the design concept is detailed and the information is added, the number of criteria considered in the assessment grows by a power of 2, with an upper boundary of approximatively 40 criteria to be considered at a time.
4.3. Displaying Sustainability and Value Assessment Results
The descriptive study aimed also at verifying the degree to which the dimension of “sustainability” shall be considered separated and independent from the dimension of “value”—similarly to what proposed in Equations (1) and (2). The interview protocol featured a set of questions supported by visual means. Two diagrams, featuring “sustainability” in relation to “customer value” and “provider value” were tested with the respondents to reveal the interdependence between these perspectives. The visual aid aimed at probing the respondents’ opinion with regards to the following questions: (1) Is sustainability compliance a competing factor with value? And (2), shall sustainability compliance be traded off with value? The majority of the interview respondents expressed skepticism about the opportunity to display the sustainability and value dimensions in isolation. When asked if it would be possible for them to compare and down select PSS design concepts using a representation articulated on these two axes, they were aligned in stating that sustainability shall not be treated in isolation, but shall rather be considered a contributing factor for other value-related criteria:
“They (sustainability and value) go hand in hand, they are kind of the same (thing). It depends on the customer but also on the market you are. For some customers, sustainability is directly customer value.”
The study shows the need to “control” the sustainability contributions for new products and services, cascading down sustainability-related concerns into “pragmatic” metrics, such as the investment needed to achieve regulatory compliance for new products and services.
“I think (sustainability) is more a contributing factor… it is not in this dimension… Customer value is for us, and I think will still be more important. But sustainability is something that you need to control in a good way.”
A main finding from the empirical study is that sustainability shall not be considered independent from value creation as often proposed in literature [
35,
36,
37], but rather as a component of a broader objective function representing how much customers and other stakeholders ‘value’ the capabilities of a design concept over each other’s.
5. Prescriptive Study Findings: An MCDM Process for Sustainability and Value Assessment
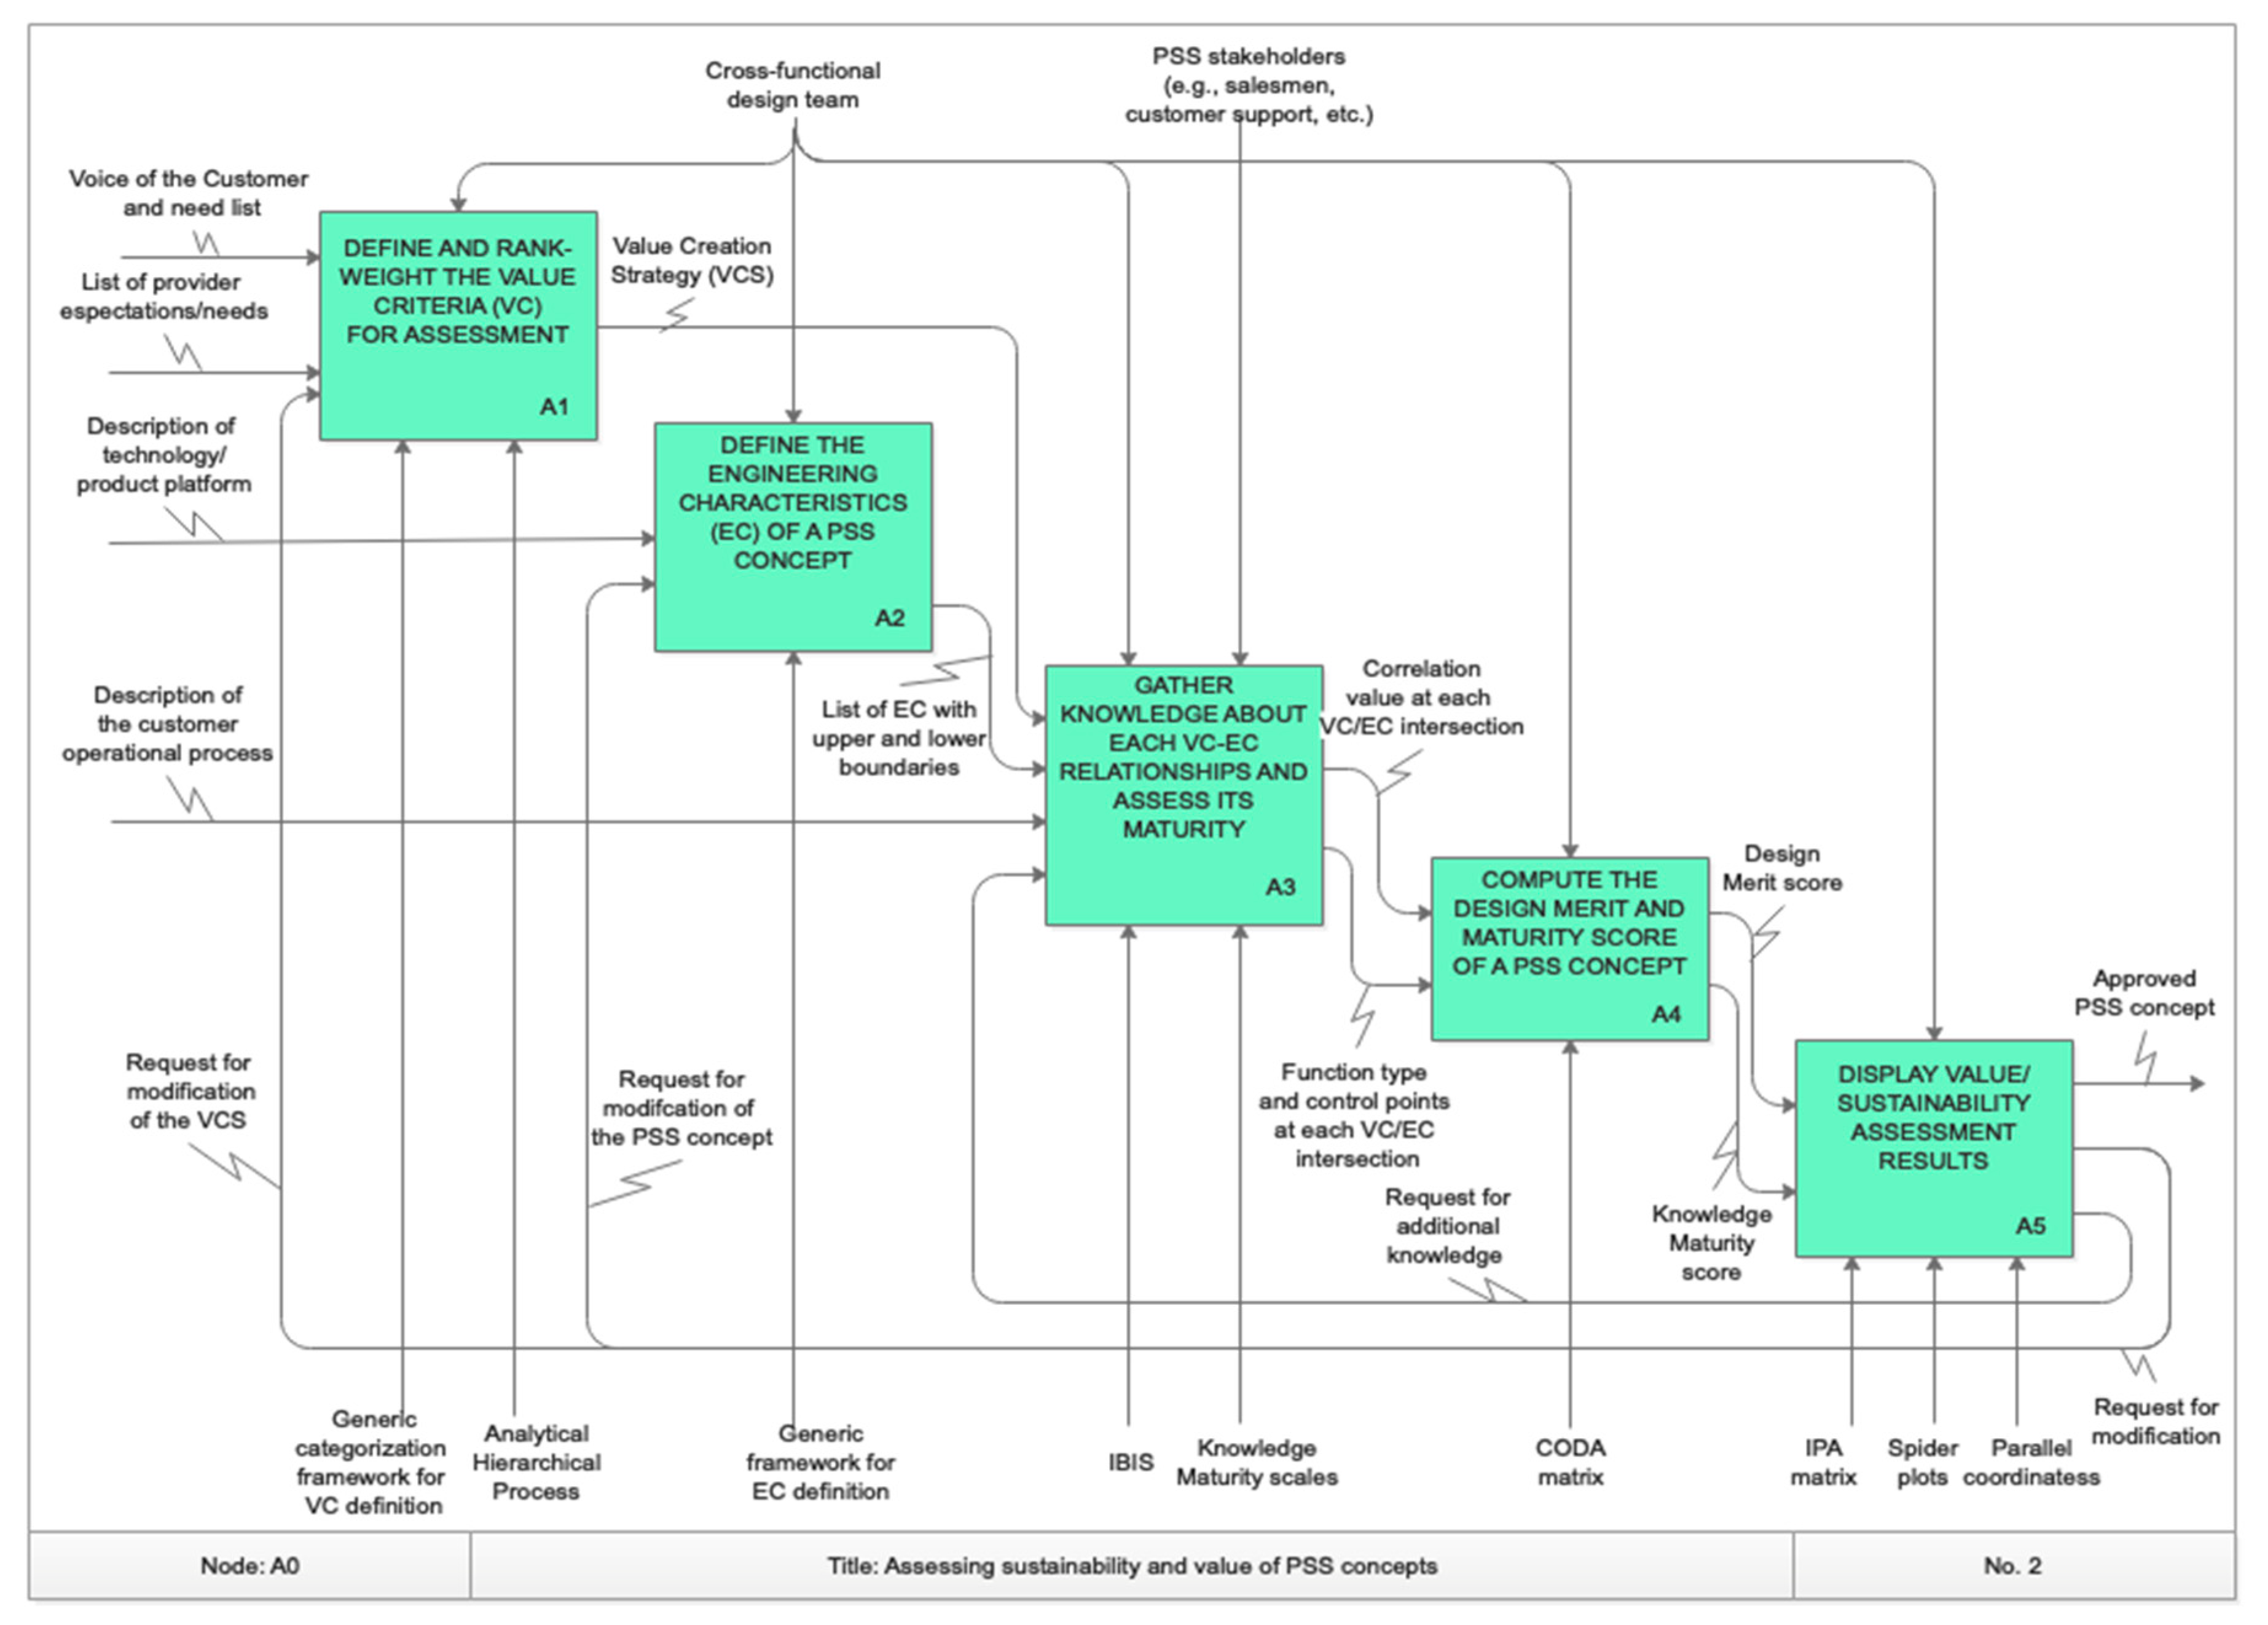
Figure 4 describes the results of the prescriptive study (PS) in the form of an iterative process for the systematic assessment of alternative PSS concepts from a value and sustainability perspective.
The process is described using the standard ‘Icam DEFinition for Function Modeling’ (IDEF0) notation and is based on the results of both the literature review and of the empirical investigation. The activities (boxes) in the IDEF0 model and their input/output connections capture the sequence of activities by which the analysis of the value space renders a modified design space in the set-based engineering exercise. Noticeably, the process features several iterations aimed at generating and progressively eliminating design concepts. The set of tools enabling the process to be executed (i.e., the arrows pointing upward in the IDEF0 model) are prescribed based on the literature review and on the empirical study findings.
5.1. Define and Rank-Weight the Value Criteria for Assessment
The process kicked-off by gathering the voice of the customer (VoC) statements and internal expectations for the new system. This (typically) large number of items needed to be organized and synthesized, so to perform the assessment more efficiently. This first task was driven by a generic categorization framework for value and sustainability criteria (
Table 1), which was adapted from [
38]. It considered customer and provider criteria separately, and grouped value metrics in relevant families of criteria, in a way that likens the “main headings” for design evaluation proposed in product development and engineering design literature by Pahl and Beitz [
39] (p. 179).
The framework distinguished between “gains” vs. “pains”, similarly to what was proposed in the value proposition canvas (VPC) framework [
40]. The feasibility–viability–desirability (FVD) from design thinking research [
41] and the triple bottom line (TBL) model [
34] helped in further detailing and defining the nature of such gains and pains. Each family may feature one or more (and sometimes none) case-specific value criteria (VC) for the assessment, with different rank-weights. Isaksson et al. [
42] propose the concept of value creation strategy (VCS) to support the definition of value criteria that are specific for the system at hand. The VCS consists of a set of guidelines for defining value criteria that captures the value-adding capabilities of a system, while satisfying the independence condition. In the VCS, the original need may be decomposed in several VC and vice versa. The rank-weight assigned to each value criteria aims mirror the chosen business strategy. A product-oriented PSS features different weights than a result-oriented one, because different aspects are prioritized in the value creation process. For instance, the ability to return equipment to provider is highly emphasized in a circular business model compared to a one-sale model, similarly to the ability to disassemble/recondition the system. A feasible method to assign these rank-weights is to use the analytical hierarchical process (AHP). The design team can choose different judgment scales, depending on the information availability, on the size of the team, and on the confidence the team has with the AHP logic. In extreme cases, a 0–1 scale may suffice, while for more detailed evaluations, the use of a more fine-grained assessment (e.g., a scale from 1/9 to 9) is considered. A consistency check algorithm ensures that the consistency ratio (CR) is kept into acceptable limits, which is 0.10 or less (see: [
43]).
5.2. Define the Engineering Characteristics of a PSS Concept
In the second step of the process, the design space was explored by experimenting with feasible conceptual designs. An important observation from the empirical study was that, during the set-based engineering exercise, the overall functional structure of the targeted system was already known. Looking at the design of the PSS hardware, it was noticeable that designs were seldom radically new concepts, but rather improvements of already known technology or product platforms [
44]. The necessity to comply with a number of requirements related, for instance, to manufacturing commonality, logistics, and supply chain management, limits design freedom to incremental improvements of a given product platform. Hence, early in the design process, the assessment of a PSS hardware kicks-off from the identification and further development of such a platform. From this, a number of platform “variants” (i.e., design configurations) were tested for “suitability” for the targeted PSS business models. The objective of the value and sustainability assessment exercise becomes that of supporting the progressive development of alternative platform variants from the available functional description, down-selecting them on the basis of the rank-weighted list of VC.
The process prescribes the use of engineering characteristics (EC) to describe these variants. These are defined as design attributes that “should describe the product in measurable terms and should directly affect customer perceptions” [
45]. Similarly, to classical requirements, they are expressed as a criterion plus an associated value. Yet, they encompass only those technical features (e.g., geometry or material) and life cycle aspects (e.g., expected manufacturability, maintainability or recycling performances) that differ between a new concept and a given baseline solution. The EC for a PSS hardware are obtained either from engineering models (differential equations, algebraic equations, or mathematical logic) or from 3D parametrical geometrical models. The use of case models and service blueprints are later used as inputs to identify relevant EC able to capture alternative configurations of the service/operational processes.
5.3. Gather Knowledge about VC vs. EC Relationships
An important step in populating the multi-criteria decision-making model is being able to map the effects of micro-level engineering decisions on the macro-level life cycle behavior of the PSS. Previous research [
46] shows that this activity is highly collaborative and requires the involvement of a number of individuals in the PSS network. All those stakeholders having relevant knowledge for the design task—about customer preferences, operational performances, and hardware features—shall be able to share their arguments about how changes at the micro-level determine the macro-level behavior of the system. Previous research pinpointed the need for “lightweight” means to locate expertise in the extended organization, for capturing the “context” of the information managed, and for assessing and validating knowledge assets in a more collaborative fashion [
47]. The issue-based information system (IBIS) [
48] has emerged as a preferred approach to help PSS stakeholders in capturing rationale and arguments related to a PSS concept. The elements of IBIS are issues (expressed in form of questions to be answered), each of which are associated with alternative answers. Each of these “positions” is supported by pro or con arguments, which are iteratively fed into the system as far as they are discussed by the design team. In practice, each intersection of the MCDM matrix is represented as a branch in the IBIS tree composed of driving issues (or nodes), for which different positions (i.e., coefficients, functions or simply numbers) must be stated. For each issue, IBIS gathers the pros and cons of the proposed answers. Finally, a decision is made about which answer or answers to accept and reject for the given issue. IBIS has a two-fold function: It collects and structure the results of need-finding activities (e.g., from interviews and observations); and labels the discussion occurring during design workshops and meetings for later reuse in the modelling environment.
5.4. Compute the Design Merit and Maturity Score of a PSS Concept
Step four is at the core of the entire value assessment process. Once VC and EC are determined, together with their relationships, the cross-functional team is left with the problem of choosing the most suitable MCDM approach to perform such mapping. The literature review highlights several possible options in this respect, with the analytical hierarchical process (AHP), QFD, and TOPSIS being popular tools for this task. Yet, the results of the empirical study reveal the need for a more systematic and granular approach, able to capture the intrinsic non-linearity of the relationship between customer satisfaction and a system property [
49]. It also shows the need to maintain a high degree of transparency in the process, making it possible for a non-domain expert (e.g., a business strategist) to understand the underlying logic of the MCDM model, without this being perceived as a black-box by cross-functional team participants. The use of artificial neural networks to model non-linearity is not a preferred approach, because it is in conflict with the “repeatability” and “transparency” principles. The MCDM method chosen to support this activity exploits the popularity of quality function deployment (QFD) and takes a step further in modeling non-linearity by replacing QFD linear numeric relationships with non-linear functions. The COncept Design Analysis (CODA) [
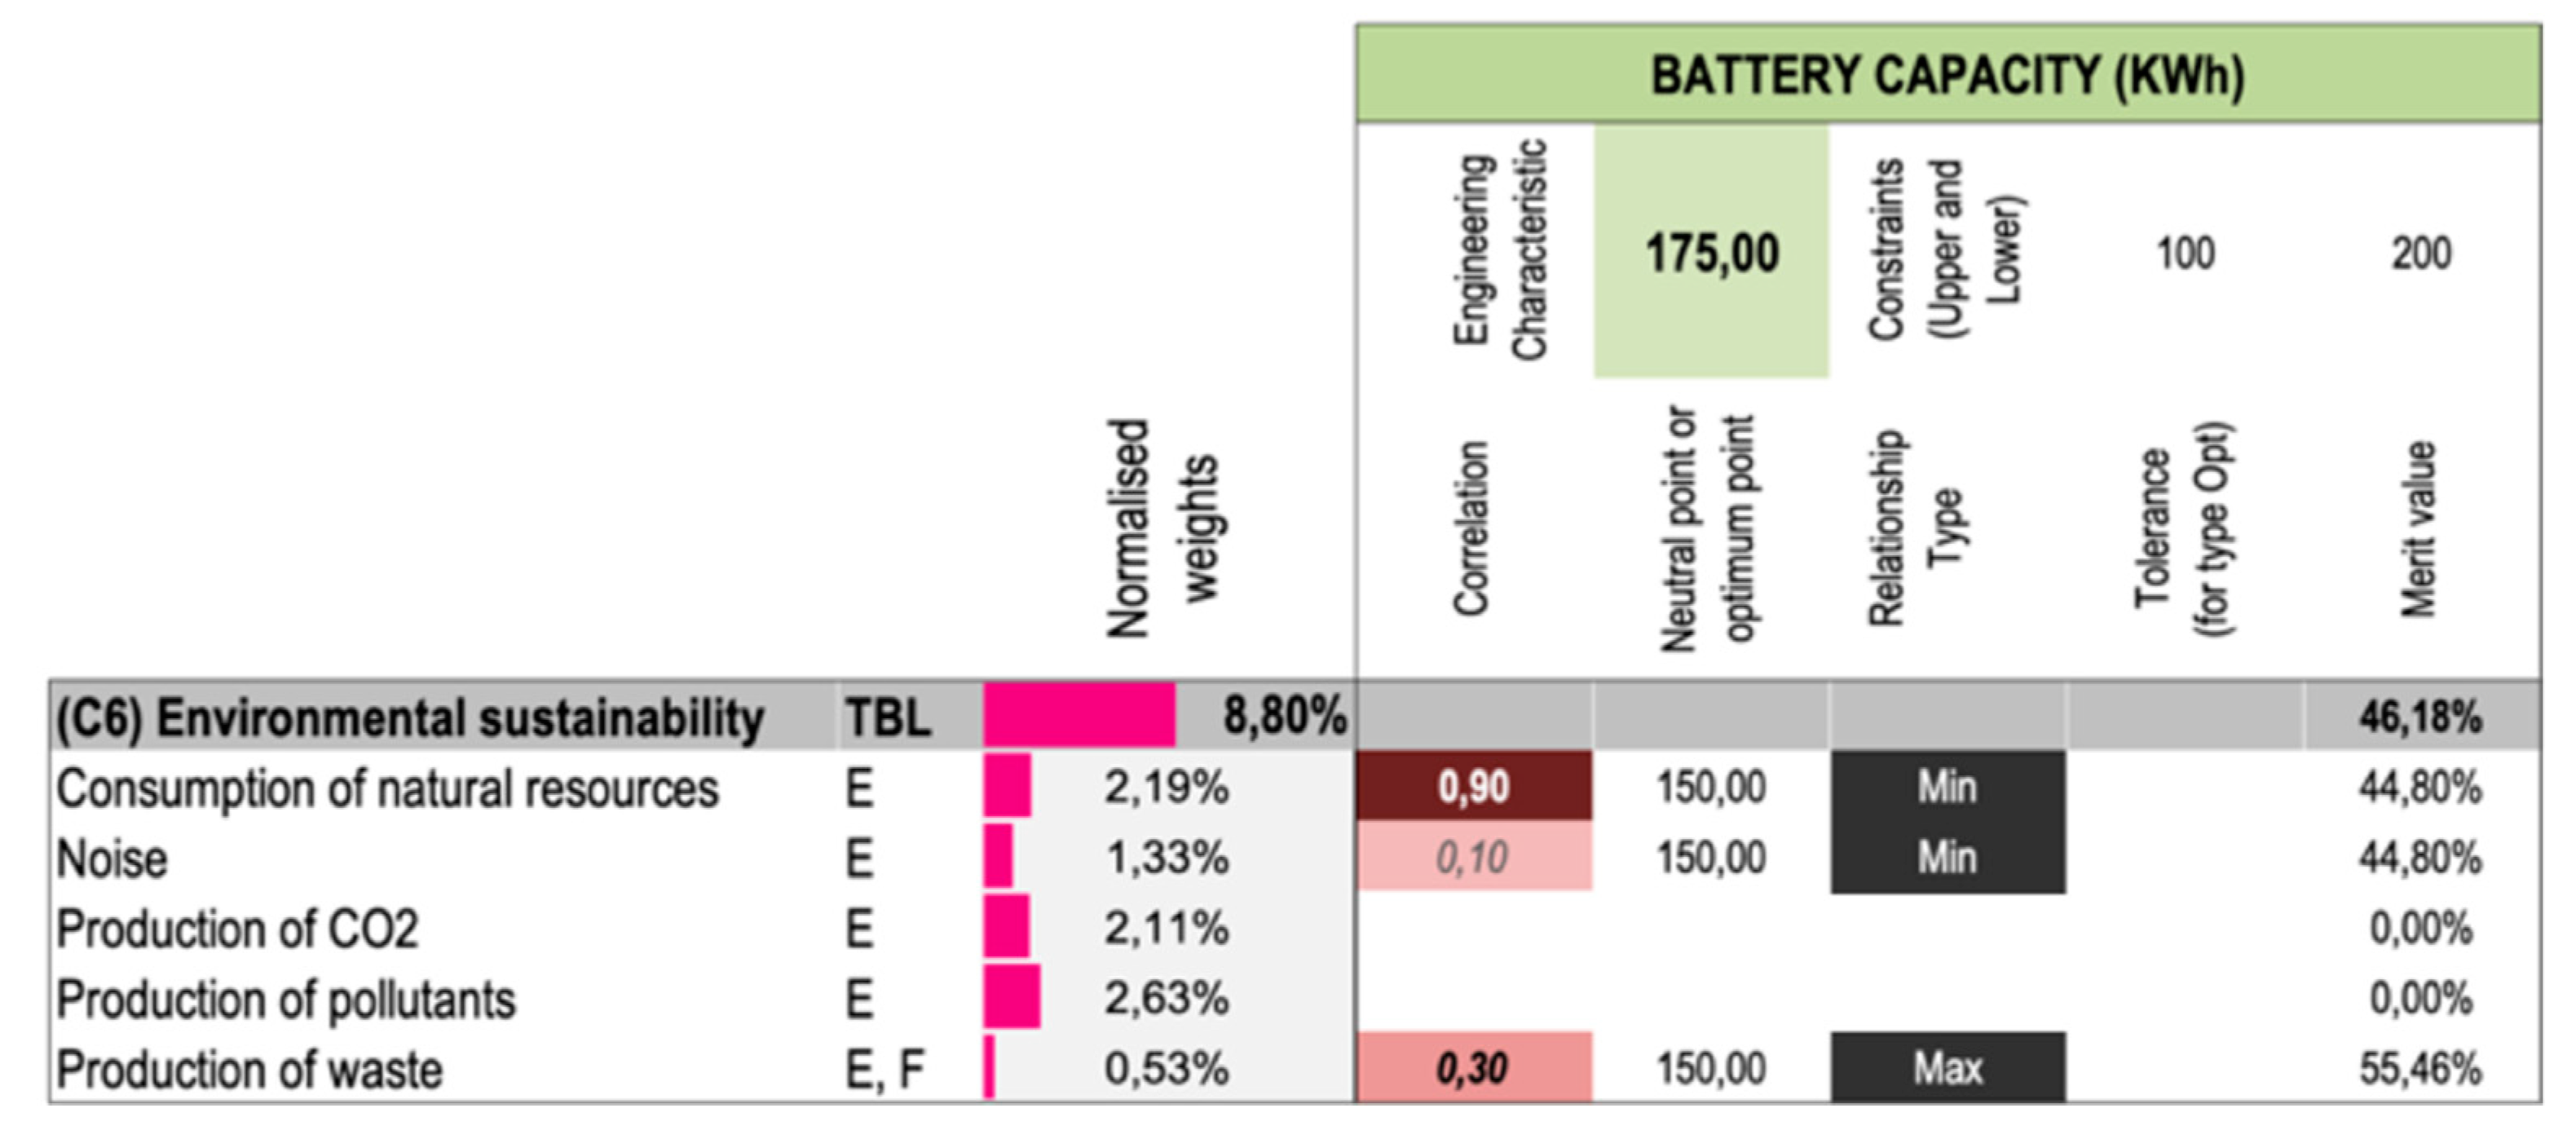
45] is one of the methods that embed this logic and was eventually chosen to realize the VDs vs. ECs mapping in the process.
In the CODA matrix—which displays VC along the rows and EC along the columns—each intersection features coefficients (0.9—0.3—0.1—0) similar to those used in mainstream QFD to express strong, weak, minimal, or no correlations between two items. CODA further adds merit functions—which are of four types: minimization (Min), maximization (Max), optimization (Opt), and avoidance (Avo)—to compute a score representing the “merit” of a design. These functions are shaped on an exponential curve that describes the change in the satisfaction (i.e., in “design merit”) of the value criteria when modifying an EC. A Max function means that the design merit increases when the value of an EC increases in case of, while Min function follows an opposite logic. The shape of Opt and Avo functions mirrors that of a Gaussian distribution anchored on target value representing the maximum (and conversely minimum) satisfaction for a given intersection. Noticeably, most of the time, maximizing an engineering characteristic increases the design merit only for a set of VCs, while decreasing others. Hence, the engineering team’s task is about finding the right trade-offs to optimize a solution towards the best possible outcome of the MCDM matrix [
45], within the domain of feasible solutions.
The descriptive study findings further highlighted the need to accompany the MCDM matrix results with a proxy indicating how much the engineering team can trust the material entering in the value assessment activity. This “reliability” issue was raised by many interview respondents: to what extent can the value-sustainability assessment results be trusted when making the final decision on which PSS design concept to pursue? The process pictured in
Figure 4 exploits the concept of knowledge maturity (KM)—in the form proposed by Johansson et al. [
50]—to cope with this issue. A KM score is computed using a narrative scale over three dimensions: input, method (tool), and expertise (experience) on a scale from 1 to 5, and later attached to each pro/con argument in the IBIS map. Each argument may reflect mathematical formulas or experimental evidence (high KM) or might be the result of educated guesses (low KM). Eventually, a total KM score for each PSS concept is eventually calculated in the CODA matrix. This aggregated score considers the rank-weight of the different value criteria, as well as how much a given EC gets close to its upper/lower boundary. By computing a KM score, the design team can direct their action on gathering more knowledge on specific aspects of the PSS solution that strongly affect the end results, while under prioritizing the maturity of models with a low impact on the end result.
5.5. Display Value/Sustainability Assessment Results
The last step is dedicated to the visualization of the design merit scores obtained from the CODA matrix. In order to facilitate discussion and negotiation among the team members, the results are displayed in an ad-hoc environment based on the importance—performance analysis (IPA) approach [
51]. IPA features a two-dimensional map, with provider value on the
x-axis and customer value on the
y-axis. The main aim is to highlight highly “meritable” (i.e., valuable and sustainable) concepts, as well as solutions that are worth additional analysis and modifications to increase their merit along one of the axes. Each design can be further selected in the IPA matrix, and the team can benchmark it against other proposals, with a higher level of granularity. In this task, spider diagrams and parallel coordinates have emerged as preferred means to communicate the value contribution of a design alternative at the decision gate, highlighting strengths and weaknesses from a life cycle perspective and spotlighting integration opportunities. In the environment, decision makers can then jump back and forth between a system-level view and a more fine-grained, component-level view. This process is intended to facilitate the recognition of “patterns of behavior” to an expert eye, while maintaining the link with specific features of the PSS solution. Based on this data, the team can then deliberate on the opportunity to select a PSS design concept for further analysis, or to iterate the process in the search for better solutions. The team might choose to test the value and sustainability contribution of a set of PSS solutions by varying the rank-weights of the different value criteria, creating a new VCS. At the same time, they may intervene to modify specific EC to generate and test new PSS concepts. Additionally, they invest time to gather input from the PSS network, raising the level of maturity of the knowledge collected in the IBIS map.
6. Case Study
The process pictured in
Figure 4 was applied in a case study related to the design of an electric site for mining operations. The opportunity of electrifying each transport stage in a quarry—from excavation to primary crushing, and transport to secondary crushing—is appealing for construction equipment manufacturers, as it may generate 95% reduction in carbon emissions and up to a 25% reduction in customer total cost of ownership. Together with new work methods, site management systems, fleet control systems, and logistics solutions, the case study focuses on the development of electric and autonomous load carriers (i.e., the PSS hardware). The design challenge is to explore the optimal equipment configuration from a value viewpoint, finding the best trade-off among geometrical dimensions, cargo size, engine power, battery capacity, charging time, and more. Additionally, it investigates how alternative hardware concepts will affect the opportunity to implement circular business models, for instance by prolonging the life cycle of the load carriers’ components, by remanufacturing and refurbishing sub-systems, or by regenerating the battery module.
The process kicked-off by defining a list of specific value criteria for sustainability and value assessment, emerging from the generic framework presented in
Table 1.
Appendix A presents the complete list of criteria as applied in the study, which was composed of 42 items for customer value and 43 for provider value. During the first iteration, only the generic categories of criteria were considered in the MCDM matrix. After selecting the most valuable concept for further analysis, a new, more detailed list of product platform variants for the load carrier was generated by the team. These were assessed in the second iteration using the full set of value criteria described in
Appendix A. Ranked-weights were obtained using an AHP matrix, following a two-step approach: pairwise comparison was first applied to the families of criteria, and then on the VC within each family.
A list of EC was then defined to describe the product platform for the load carrier, which consisted of seven main sub-systems: the frame of the machine supporting the battery pack, the electrical engines, the cargo module, wheels, suspension system, hydraulic system, and electronics. Product platform variants were described by a list of 17 EC, that captured geometrical dimensions for the most critical hardware sub-systems, as well as performance data (e.g., battery capacity and charging time, etc.), life cycle data and more. An IBIS model was implemented to captured knowledge related to the upper and lower bounds of the selected EC, and to their relationship with the value criteria. Pro/con arguments in the tree were further tagged with a knowledge maturity score, as described in
Section 5.3.
Figure 5 shows an extract from the CODA matrix at the intersection of “battery capacity” (expressed in kilowatt-hour) and five environmental-related value criteria. A larger capacity was strongly correlated with the consumption of natural resources (e.g., the lithium in the battery). A preferred direction to increase the value for sustainability-aware customers is to realize smaller batteries with less material per unit. At the same time, the size of the battery shall be also minimized to produce comparably less noise than larger ones. Capacity is also inversely correlated with waste. Electrical load carriers are typically recharged after every loading-unloading cycle in the construction site, which is smaller batteries discharge more than large ones during a cycle. A deeper depth-of-discharge translates into a shorter life cycle for the batteries, which need to be replaced more often producing more waste (under the assumption that the battery cannot be fully recycled).
Depending on the specific customer operational process, correlations and relationship types may change at each iteration. For instance, the design team might discover that the electrical machine is not used in isolation but is rather part of a fleet of diesel-powered machines. In this scenario, if the battery capacity is not sufficient to complete an entire cycle, a diesel machine will take over the job. Maximizing battery capacity becomes, then, a valuable feature when considering the first VC (“consumption of natural resources”). For this reason, the associated correlation function will change from Min to Max. In the same fashion, several other intersections in the matrix will need to be reconsidered under the new circumstances.
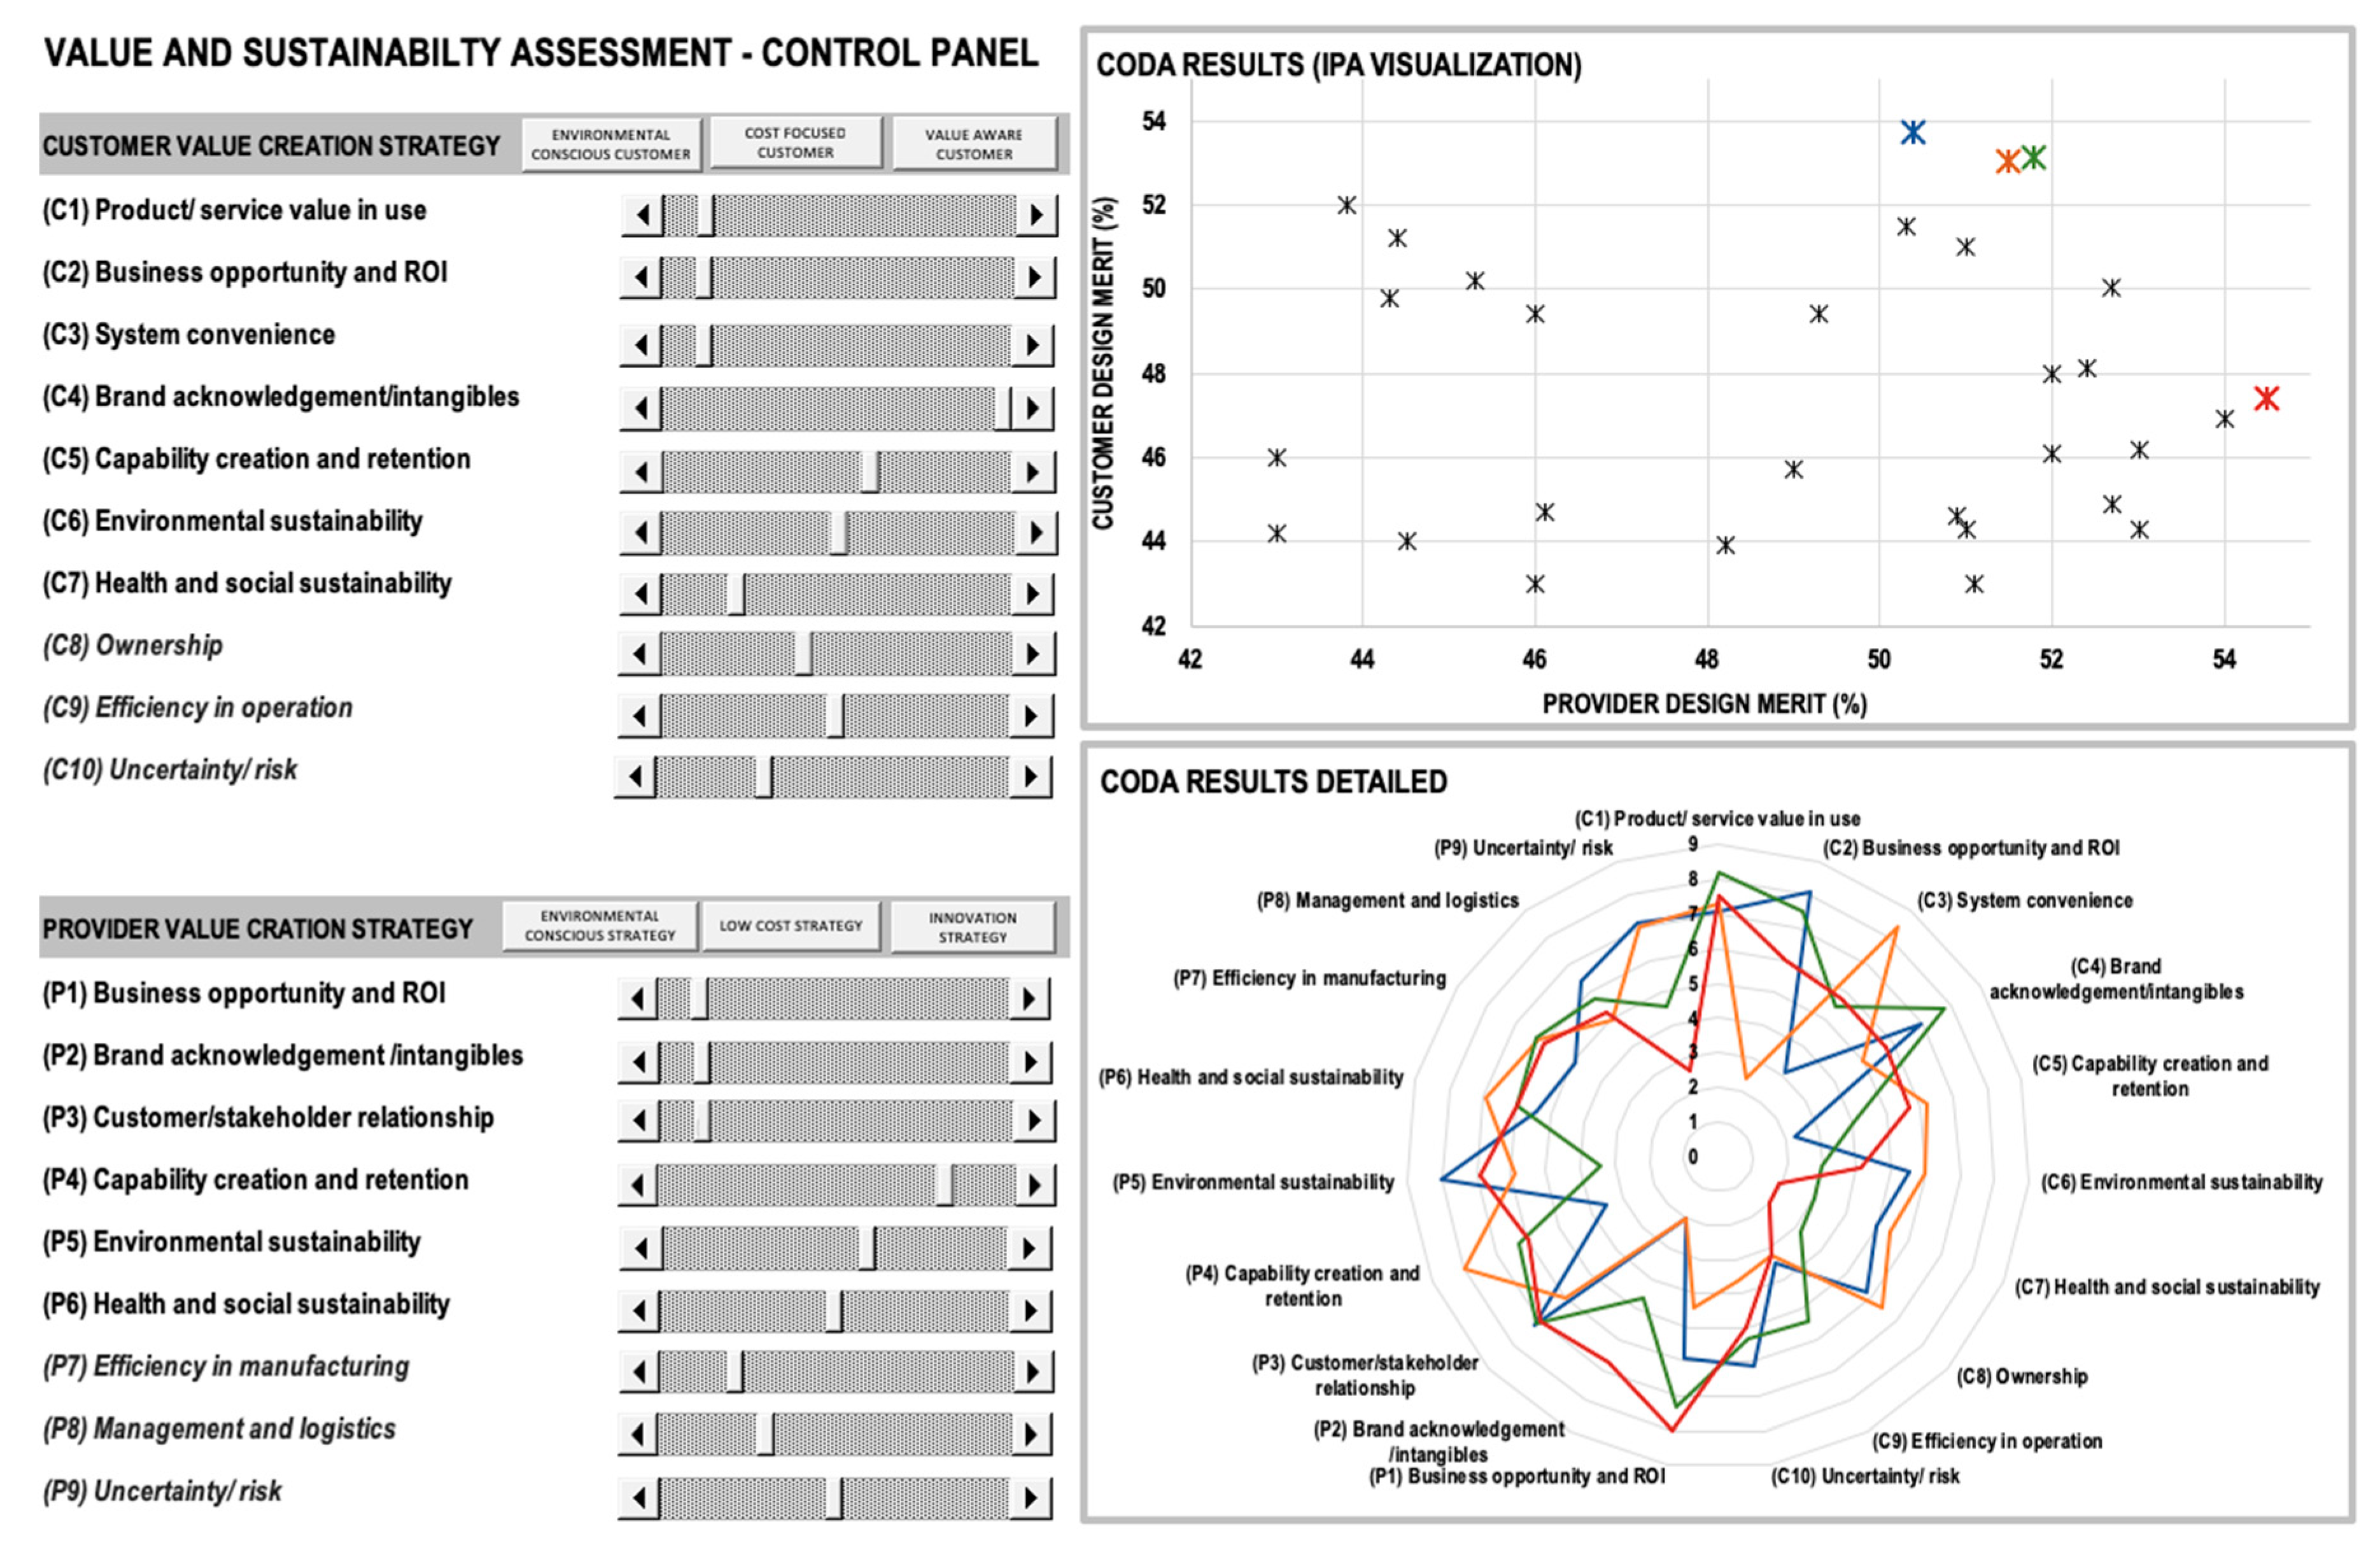
Figure 6 shows how the results of the CODA model were visualized for 30 alternative load carrier concepts (please note that the data have been scaled up/down due to confidentiality). The left-hand side of
Figure 6 displays the families of value criteria considered in the assessment, with their associated rank weights. The control panel allows decision makers to interactively modify these rank-weights (obtained by the AHP matrix) in two ways. Firstly, different rank-weights are obtained from the AHP matrix, reflecting the preferences of different customers, as well as different company strategies. It is possible to load these data by clicking on the related button (e.g., “environmental conscious customer” and “low-cost strategy”) in the provided interface. In order to provide further flexibility, the team can refine these weights acting on the scroll bar associated with each item. Through the use of macros in MS Excel, the results of the CODA matrix are automatically updated to reflect the new preferences and displayed in the IPA matrix.
In the example above, which is taken from one of the process iterations conducted in the study, four load carrier concepts were selected for further investigation, so as to identify areas of improvement for each solution. These designs differed in terms of nominal battery capacity (varying approximatively between 150 to 200 KWh), as well as in terms of motor power and related geometrical dimensions. In a usage scenario featuring both electrical and fossil fuel-driven machines, the PSS hardware concept with larger battery capacity (in orange) was ranked third best for customer value (see top-left quadrant of
Figure 6). The detailed value view showed excellent capabilities with regards to the value criteria C3 (System convenience) as well as along the different sustainability criteria at customer and provider level. Yet, the concept was also the riskiest from a customer viewpoint, due the increased complexity of the technology (e.g., of the battery management system) and the inherent higher costs of a larger battery pack. From a provider viewpoint, such an extreme solution represented an interesting test bed to learn more about “electrification”, empowering competences and attracting external expertise. Noticeably, the model warned about the side effects of a large battery pack, which could have resulted in a bulky, unattractive design for the machine, lowering the brand acknowledgement dimension for the provider. The value contribution in the spider plot can be further broken down to visualize the outcome of the CODA matrix for each electric site concept, along each specific value criteria, using a parallel coordinates approach. Once a commonly-agreed PSS concept is found, its specifications are brought forward to the detailed design stage. Otherwise, the process is iterated by testing new value creation strategies, altering the description of the PSS concepts or modifying relationships and functions in the CODA matrix to more realistically picture relevant scenarios.
7. Discussion
The proposed process and tools were verified through the iterative development of capability demonstrators, which were demoed with company representatives (as well as with academic researchers) in co-located physical workshops. In these events, process owners from both companies involved in the descriptive study—as well as practitioners from other industrial stakeholders—had the opportunity to test the proposed approach, provide feedback, and co-design methods and tools with the academic researchers.
The verification activities show that, even though reliability and trustability limit the opportunity of “engineering” the system on the basis of such assessment, the introduction of a MCDM approach (contra check-list-based methods) represents a step forward in the way the discussion around the value of a sustainability-oriented strategy is systematically organized. On the one end, the use of a value creation strategy construct forces managers and engineers to confront themselves on how sustainability can be “monetized” from a business perspective. Paraphrasing a process owner taking part in the verification activities, a main function of the MCDM model becomes that of “selling sustainability to technology developers.“ By modifying the rank-weights in the model, engineers can observe how the “merit” of their proposals changes at varying customer and market preferences, hence learning about how the design is affected by the business environment. On the other end, the correlations coefficients, value functions, and control points, featured in the CODA model, provides a quick and intuitive way—and a commonly understood language—for technology experts to articulate the impact of specific engineering feature on the different business- and sustainability-related criteria. At the same time, they facilitate the identification—and later negotiation—of value and sustainability “hotspots”, which are defined as concerns of serious impact potential, along the entire life cycle of a proposed solution.
One aspect of interest is the ability of the model to embed a circular thinking in the MCDM exercise. Circularity is addressed at different levels. Some of the proposed value criteria in the case studies (see:
Table A2) were designed as direct proxies for circularity. Among them, the “ability to recondition the system,” “ability to recover materials,” and the “ability to minimize landfill waste” aim at providing a direct feedback to decision makers on the suitability of a given design configuration for some basic operations in the circular flow. If a design concept scores low on these criteria, its overall design merit is negatively affected. Hence, the design team is informed about the opportunity of optimizing the design so as to enable a seamless implementation of a circular strategy. Other criteria highlight the value contribution of a design with regards to a list of “supporting operations” for circularity, such as the “ability to return equipment to provider” or the “ability to disassemble the system.” A final set of criteria inform the decision makers about the sustainability hotspots hidden in the transition towards a circular approach. For instance, a design might score high from a “recovering materials” perspective. Yet, the same design might feature a large production of CO
2 in transportation and logistics operations (see
Table A2), balancing out the environmental gain. The feedback from the demonstration activities shows that the proposed MCDM process is beneficial for decision makers to analyze the sustainability-value trade-off with detail, raising awareness on opportunities and challenges for the next design iterations.
An important aspect in the implementation of the proposed approach is the opportunity of creating a physical environment [
52] where the design team can learn about the long-term consequences of their designs, so to improve timeliness and quality of design decisions at gate meetings. This is inspired by the concept of decision theatre (DT) [
53]. In its current implementation at the author home institution [
54,
55], the DT is composed of a large fixed screen, where tailor-made visualization techniques are exploited to communicate the results of the assessment. A large touch screen gives the opportunity to interact with the data, for instance, by modifying the rank-weights for given criteria to test new scenarios, to edit the underlying knowledge base and update models/matrixes. The main reason for coupling the theoretical process with a physical space is that of facilitating the sharing of tacit, contextual knowledge about the product/service being designed. Due to the complex nature of design problems combined with the vast amount of data generated in the proposed design exploration scheme, the availability of a physical environment is considered a key enabler to support design concept explorations based on value and sustainability.
From a research method perspective, the main reason for choosing SCOPUS for conducting the systematic literature review shall be found in its multidisciplinary and in its wide coverage of social science and engineering studies. SCOPUS is acknowledged to be one of the largest abstracts and citations database of peer-reviewed literature, including research from both major and minor publishers, such as Elsevier, Emerald, Springer, Wiley, and more. In order to ensure the “systematic” nature of the review, the search string was iteratively designed to render a rather broad list of publications, from several different fields, taking care at the same time to mitigate “noise” in the search. Initial iterations of the string only featured the keywords “value” and “sustainability”—similarly to that described in [
56]—rendering approximatively 28,000 items in SCOPUS. Additional terms were progressively added to filter out contributions not related to the main topic of the study. The resulting list of papers on which manual filters were applied featured 22,500 items, a number which is only 25% smaller than the one featured by the most basic search string. In order to mitigate the risk of missing out on important contributions in the PSS field not explicitly referring to “value” and “sustainability”, the analysis of the literature was complemented with snowballing. This activity brought to the identification of additional contribution (26), after filters were applied and duplicates eliminated. The interchangeable use of “sustainability” and “environment” in PSS literature was found as main reason for these contributions to have been filtered out in the SCOPUS search. With regards to the empirical data gathering stage in the multiple case study, several triggers were used to gathered focused insights from the interview respondents. Yet, the literature provides little evidence of the suitability of these triggers for qualitative research, in particular with regards to the use of the Ternary plots and similar representations. It is also important to pinpoint that the data displayed in
Figure 2 and
Figure 3 do not hold a statistical meaning, rather they were intended to help the respondents in providing focused feedback to the questions.
8. Conclusions
The proposed process and tools allow decision makers to benchmark solutions that challenge the traditional linear value creation models, emphasizing the value creation opportunity of circular product/service offerings vs one-sale models. In the latter, the “best design” is often chosen today based on a performance vs. investment function. In order to do so, the paper has proposed:
A systematic and iterative process for PSS concept assessment that seamlessly incorporates sustainability considerations when defining value criteria for a system.
An MCDM approach for converging the sustainability and value discussion and to synthesize the sustainability-value trade-off in a unique figure for design merit, for each design.
A visualization approach that highlights the trade-off between provider vs. customer value in the assessment of sustainability-oriented solutions.
A major conclusion from the work concerns the suitability of the approach for creating a “hub” where argumentations related to “value” and “sustainability” of solution concepts can be systematically captured, in a way that supports the discussion on the appropriate quantification strategy. Rather that optimizing a design, process and methods for value and sustainability assessment shall enable the exploration of feasible solutions in different future scenarios, where different strategies for value creation are considered. Qualitative MCDM models are considered important in a situation where design moves from a sequential single discipline to multidiscipline evaluation and design. Here, the focus is shifted from purely evaluating a design to leverage tacit knowledge sharing and negotiation among all the stakeholders having stakes in the decision. By configuring a process where MCDM methods and argument-based knowledge management systems work in synergy, the design team can not only coordinate decisions, but also gather facts, trigger negotiation, and learn about the design in a way across organizational roles and boundaries. Furthermore, the opportunity of simulating the response of the model at varying VCSs for a number of design configurations was largely appreciated by practitioners. The use of the CODA matrix is beneficial in the way it forces users in elaborating and reflecting not only about the strength of the relationship between needs and characteristics of a product but also on the direction of improvement.
Some intrinsic limitations of the proposed research approach constrain the validity and application of the findings. Multiple case designs have distinct advantages—the evidence being often considered more compelling—and disadvantages. These designs require extensive resources and time, and this meant that the researchers were only able to focus only on a few cases, hence pursuing “literal replication”, which is to predict similar results. A few more cases would have been needed to predict contrasting results but for predictable reasons (a “theoretical replication”, see [
28]), so to provide a more compelling support for the initial set of propositions. Future work will aim at enabling more replications of the findings, for instance by involving a larger pot of companies in the same sector, to further investigate contradictions and, in this way, develop a richer theoretical framework.
Future work will focus on how to ensure that methods and tools are able to effectively support design decision making in a cross-functional engineering setting. A great challenge in sustainability and value assessment is that all decisions usually made on their “own”, by the different functional groups, need now to be jointly evaluated and merged in a decision environment. The purpose is to move from testing methods and tools with students in laboratory environments to full-scale verification with industrial practitioners in real-life decision situations. Protocol analysis of design episodes is one of the methods proposed to test the effectiveness of such a decision environment. Experimental sessions in ad-hoc design episodes are currently planned to provide more factual data about the ability of the proposed approach to reduce lead time and improve the quality of early design decisions. Future work will also aim at verifying the effectiveness of the IBIS notation to bring formalization to the negotiation process occurring within the cross-functional team. The underlying “labeling” mechanism of IBIS is intended to stimulate a process where participants turn their tacit knowledge to explicit, sharing their “positions” and feeding them with arguments. The purpose is to encourage a greater degree of participation, particularly in the earlier phases of the process, so that sweet spots and weak spots of the proposed solution, can be collaboratively identified.


