Measuring Industrial Customer Satisfaction: The Case of the Natural Gas Market in Greece

 ,
,  ,
,
Abstract
1. Introduction
2. Literature Review
2.1. Industrial Customers’ Satisfaction
2.2. Customer Satisfaction Surveys in Energy Sector
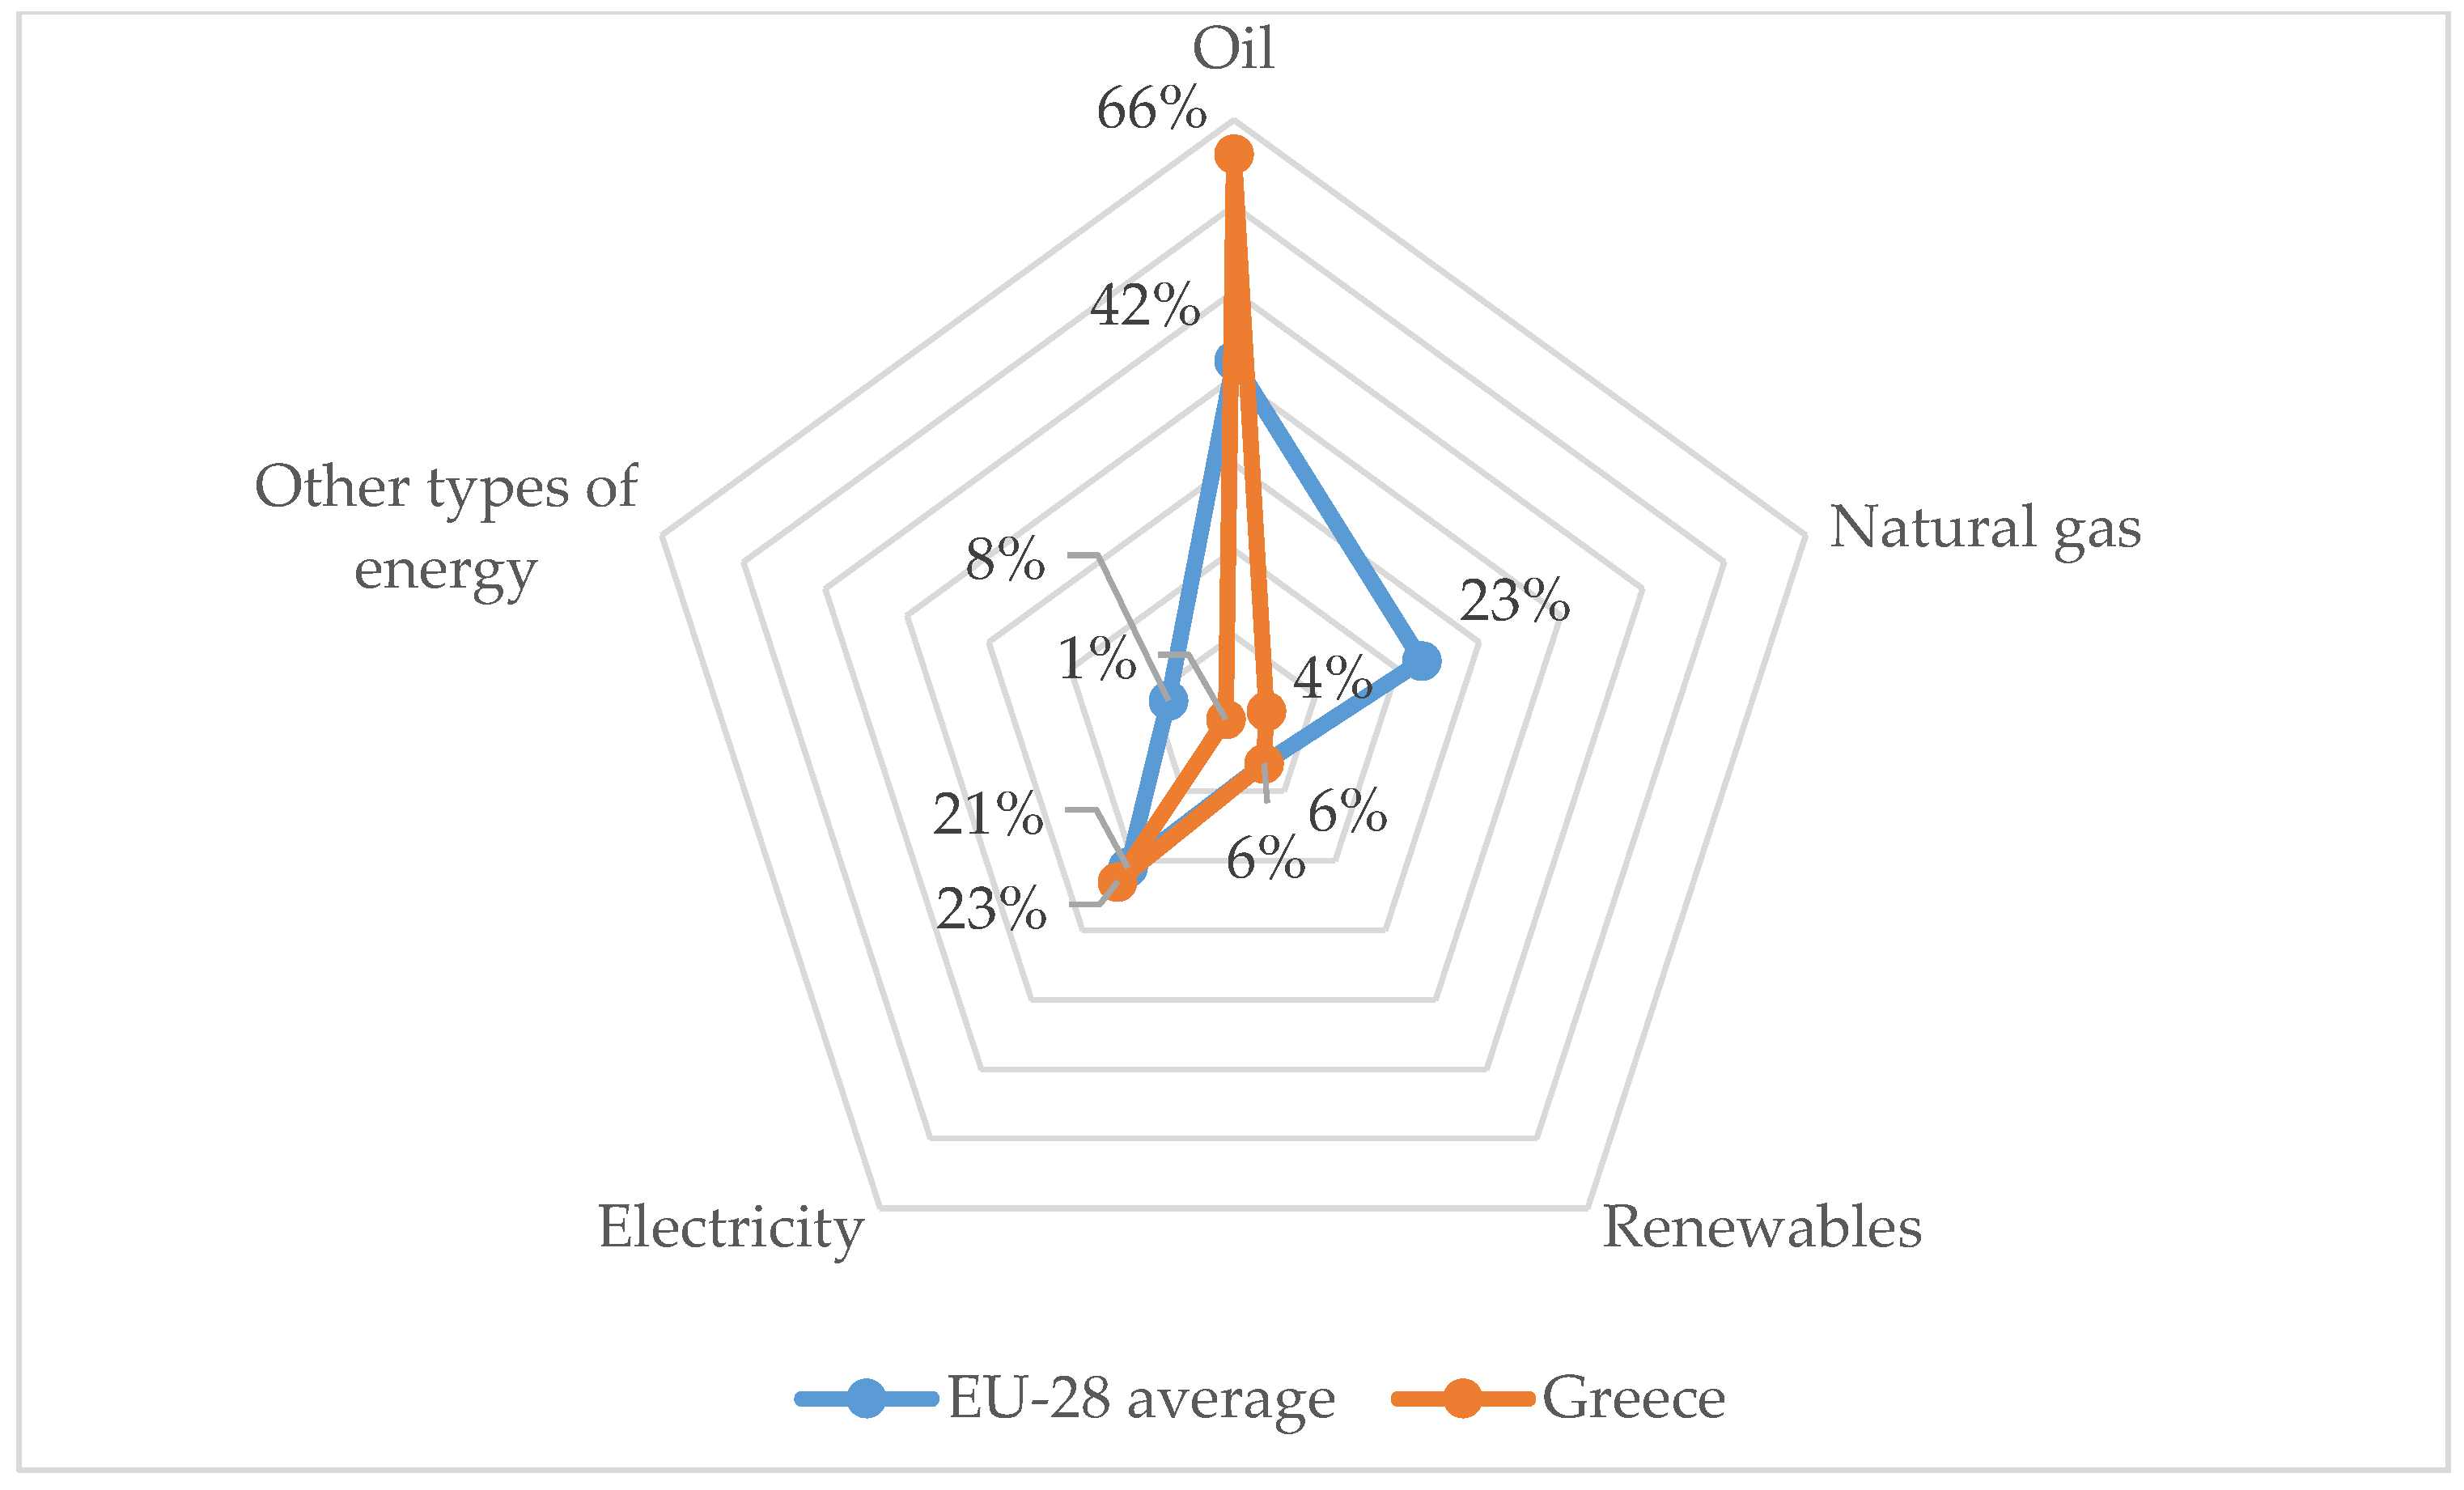
2.3. Natural Gas Market in Greece
3. Research Methodology
3.1. Data and Research Tool
3.2. An Overview of the Mulitcriteria Satisfaction Analysis (MUSA) Method
4. Research Results
5. Discussion and Conclusions
Author Contributions
Funding
Conflicts of Interest
References
- Ahmad, N. Quality Attribute and Customer Satisfaction: Using Kano’s Model to Prioritize What Matters Most to Customers. J. Mark. Consum. Behav. Emerg. Mark. 2017, 1, 15–28. [Google Scholar]
- Skordoulis, M.; Alasonas, P.; Pekka-Economou, V. E-government services quality and citizens’ satisfaction: A multi-criteria satisfaction analysis of TAXISnet information system in Greece. Int. J. Prod. Qual. Manag. 2017, 22, 82–100. [Google Scholar] [CrossRef]
- Homburg, C.; Rudolph, B. Customer satisfaction in industrial markets: Dimensional and multiple role issues. J. Bus. Res. 2001, 52, 15–33. [Google Scholar] [CrossRef]
- Pham, C.H. Customer satisfaction on service quality of consumer goods retailers: Evidence from Vietnam. Int. J. Civ. Eng. Technol. 2019, 10, 1159–1175. [Google Scholar]
- Shin, D.H. Effect of the customer experience on satisfaction with smartphones: Assessing smart satisfaction index with partial least squares. Telecommun. Policy 2015, 39, 627–641. [Google Scholar] [CrossRef]
- Churchill, G.A., Jr.; Surprenant, C. An investigation into the determinants of customer satisfaction. J. Mark. Res. 1982, 19, 491–504. [Google Scholar] [CrossRef]
- Yashin, N.S.; Popova, L.F.; Bocharova, S.V.; Bagautdinova, N.G. Customer satisfaction assessment in management quality system of industrial enterprises. Int. Bus. Manag. 2016, 10, 5720–5726. [Google Scholar]
- Festge, F.; Schwaiger, M. The Drivers of Customer Satisfaction with Industrial Goods: An International Study. Adv. Int. Mark. 2007, 18, 179–207. [Google Scholar]
- Ismail, H.; Bakar, Z.; Salleh, A.H.M. Buyer satisfaction and loyalty - Evidence from the industrial goods market. J. Pengur. 2006, 25, 47–61. [Google Scholar]
- Tong, L.; Hou, X.; Li, X. Empirical study on customer satisfaction influencing factors of industry application products based on experiential level theory. China Commun. 2016, 13, 260–268. [Google Scholar] [CrossRef]
- Dincer, I. Environmental and sustainability aspects of hydrogen and fuel cell systems. Int. J. Energy Res. 2007, 31, 29–55. [Google Scholar] [CrossRef]
- Papageorgiou, A.; Skordoulis, M.; Trichias, C.; Georgakellos, D.; Koniordos, M. Emissions trading scheme: Evidence from the European Union countries. In Communications in Computer and Information Science; Kravets, A., Shcherbakov, M., Kultsova, M., Shabalina, O., Eds.; Springer International Publishing: Cham, Switzerland, 2015; pp. 222–233. [Google Scholar]
- Chalikias, M.S.; Kolovos, K.G. Citizens’ views in Southern Greece part II. Contribution of forests to quality of life. J. Environ. Prot. Ecol. 2013, 2, 629–637. [Google Scholar]
- Chalikias, M. Effect of natural recourses and socioeconomic features of tourists on the Greek tourism. J. Environ. Prot. Ecol. 2012, 13, 1215–1226. [Google Scholar]
- Ntanos, S.; Kyriakopoulos, G.; Chalikias, M.; Arabatzis, G.; Skordoulis, M. Public perceptions and willingness to pay for renewable energy: A case study from Greece. Sustainability 2018, 10, 687. [Google Scholar] [CrossRef]
- Ntanos, S.; Kyriakopoulos, G.; Skordoulis, M.; Chalikias, M.; Arabatzis, G. An Application of the New Environmental Paradigm (NEP) Scale in a Greek Context. Energies 2019, 12, 239. [Google Scholar] [CrossRef]
- Skordoulis, M.; Chalikias, M.; Galatsidas, S.; Arabatzis, G. Competitive Advantage Establishment through Sustainable Environmental Management and Green Entrepreneurship: A Proposed Differential Equations Framework. In Springer Earth System Sciences; Theodoridis, A., Ragkos, A., Salampasis, M., Eds.; Springer International Publishing: Cham, Switzerland, 2019; pp. 205–219. [Google Scholar]
- Di Pascoli, S.; Femia, A.; Luzzati, T. Natural gas, cars and the environment. A (relatively) ‘clean’ and cheap fuel looking for users. Ecol. Econ. 2001, 38, 179–189. [Google Scholar] [CrossRef]
- Zerva, A.; Tsantopoulos, G.; Grigoroudis, E.; Arabatzis, G. Perceived citizens’ satisfaction with climate change stakeholders using a multicriteria decision analysis approach. Environ. Sci. Policy 2018, 82, 60–70. [Google Scholar] [CrossRef]
- Manolitzas, P.; Kostagiolas, P.; Grigoroudis, E.; Intas, G.; Stergiannis, P. Data on patient’s satisfaction from an emergency department: Developing strategies with the Multicriteria Satisfaction Analysis. Data Brief 2018, 21, 956–961. [Google Scholar] [CrossRef]
- Borishade, T.; Kehinde, O.; Iyiola, O.; Olokundun, M.; Ibidunni, A.; Dirisu, J.; Omotoyinbo, C. Dataset on customer experience and satisfaction in healthcare sector of Nigeria. Data Brief 2018, 20, 1850–1853. [Google Scholar] [CrossRef]
- Drosos, D.; Tsotsolas, N.; Skordoulis, M.; Chalikias, M. Patient satisfaction analysis using a multi-criteria analysis method: The case of the NHS in Greece. Int. J. Prod. Qual. Manag. 2018, 25, 491–505. [Google Scholar] [CrossRef]
- Fang, Y.H.; Chiu, C.M.; Wang, E.T. Understanding customers’ satisfaction and repurchase intentions: An integration of IS success model, trust, and justice. Intern. Res. 2011, 21, 479–503. [Google Scholar] [CrossRef]
- Kadlubek, M.; Grabara, J. Customers’ expectations and experiences within chosen aspects of logistic customer service quality. Intern. J. Qual. Res. 2015, 9, 265–278. [Google Scholar]
- Tsafarakis, S.; Kokotas, S.; Pantouvakis, A. A multiple criteria approach for airline passenger satisfaction measurement and service quality improvement. J. Air Transport. Manag. 2018, 68, 61–75. [Google Scholar] [CrossRef]
- Vijayabanu, C.; Renganathan, R.; Badrinath, V.; Vijay Anand, V.; Chandrasekar, S.; Parthasaarathy, A.K.; Ganapathi Narendra Subburam, U. Customer satisfaction in aviation industry. Int. J. Appl. Bus. Econ. Res. 2017, 15, 397–405. [Google Scholar]
- Bouranta, N.; Siskos, Y.; Tsotsolas, N. Measuring police officer and citizen satisfaction: Comparative analysis. Policing 2015, 38, 705–721. [Google Scholar] [CrossRef]
- Aouadni, I.; Rebaï, A.; Christodoulakis, N.; Siskos, Y. Job satisfaction measurement: The multi-criteria satisfaction analysis. Int. J. Appl. Decis. Sci. 2014, 7, 190–207. [Google Scholar] [CrossRef]
- Chen, S.C. The customer satisfaction-loyalty relation in an interactive e-service setting: The mediators. J. Retail. Consum. Serv. 2012, 19, 202–210. [Google Scholar] [CrossRef]
- Drosos, D.; Tsotsolas, N.; Manolitzas, P. The relationship between customer satisfaction and market share: The case of mobile sector in Greece. Int. J. Eng. Manag. 2011, 3, 87–105. [Google Scholar]
- Ostrom, A.; Iacobucci, D. Consumer trade-offs and the evaluation of services. J. Mark. 1995, 59, 17–28. [Google Scholar] [CrossRef]
- Woodside, A.G.; Frey, L.L.; Daly, R.T. Linking service quality, customer satisfaction and behavioral intention. J. Health Care Mark. 1989, 9, 5–17. [Google Scholar]
- Yi, Y. A critical review of consumer satisfaction. In Review of Marketing; Zeithaml, V.A., Ed.; American Marketing Association: Chicago, IL, USA, 1990; pp. 68–123. [Google Scholar]
- Aghamirian, B.; Dorri, B.; Aghamirian, B. Customer knowledge management application in gaining organization’s competitive advantage in electronic commerce. J. Theor. Appl. Electron. Comm. Res. 2015, 10, 63–78. [Google Scholar] [CrossRef]
- Kotler, P. Marketing Management: Analysis, Planning, Implementation, and Control; Prentice Hall: Englewood Cliffs, NJ, USA, 1991. [Google Scholar]
- O’Sullivan, D.; McCallig, J. Customer satisfaction, earnings and firm value. Eur. J. Mark. 2012, 46, 827–843. [Google Scholar] [CrossRef]
- Balmer, J.M.T.; Chen, W. Corporate heritage brands, augmented role identity and customer satisfaction. Eur. J. Marke. 2017, 51, 1510–1521. [Google Scholar] [CrossRef]
- Luo, X.; Homburg, C.; Wieseke, J. Customer satisfaction, analyst stock recommendations, and firm value. J. Mark. Res. 2010, 47, 1041–1058. [Google Scholar] [CrossRef]
- O’Connell, V.; O’Sullivan, D. The impact of customer satisfaction on CEO bonuses. J. Acad. Mark. Sci. 2011, 39, 828–845. [Google Scholar] [CrossRef]
- Ryu, K.; Lee, H.R.; Kim, W.G. The influence of the quality of the physical environment, food, and service on restaurant image, customer perceived value, customer satisfaction, and behavioral intentions. Int. J. Contemp. Hosp. Manag. 2012, 24, 200–223. [Google Scholar] [CrossRef]
- Anderson, E.W.; Mittal, V. Strengthening the satisfaction-profit chain. J. Serv. Res. 2000, 3, 107–120. [Google Scholar] [CrossRef]
- Alegre, J.; Cladera, M. Analysing the effect of satisfaction and previous visits on tourist intentions to return. Eur. J. Mark. 2009, 43, 670–685. [Google Scholar] [CrossRef]
- Steven, A.B.; Dong, Y.; Dresner, M. Linkages between customer service, customer satisfaction and performance in the airline industry: Investigation of non-linearities and moderating effects. Transp. Res. Part E 2010, 48, 743–754. [Google Scholar] [CrossRef]
- Banker, R.D.; Mashruwala, R. The moderating role of competition in the relationship between nonfinancial measures and future financial performance. Contemp. Acc. Res. 2007, 24, 763–793. [Google Scholar] [CrossRef]
- Jani, D.; Han, H. Investigating the key factors affecting behavioral intentions: Evidence from a full-service restaurant setting. Int. J. Contemp. Hosp. Manag. 2011, 23, 1000–1018. [Google Scholar] [CrossRef]
- Ranaweera, C.; Prabhu, J. On the relative importance of customer satisfaction and trust as determinants of customer retention and positive word of mouth. J. Target. Meas. Anal. Mark. 2003, 12, 82–90. [Google Scholar] [CrossRef]
- Pantelidis, I.S. Electronic meal experience: A content analysis of online restaurant comments. Cornell Hosp. Q. 2010, 51, 483–491. [Google Scholar] [CrossRef]
- Tsai, H.T.; Huang, H.C. Determinants of e-repurchase intentions: An integrative model of quadruple retention drivers. Inf. Manag. 2007, 44, 231–239. [Google Scholar] [CrossRef]
- Williams, P.J.; Naumann, E. Customer satisfaction and business performance: A firm-level analysis. J. Serv. Mark. 2011, 25, 20–32. [Google Scholar] [CrossRef]
- Yeung, M.C.H.; Ennew, C.T. Measuring the impact of customer satisfaction on profitability: A sectoral analysis. J. Target. Meas. Anal. Mark. 2001, 10, 106–116. [Google Scholar] [CrossRef]
- Dong, K.Y.; Jeong, A.P. Perceived service quality: Analyzing relationships among employees, customers, and financial performance. Int. J. Qual. Reliabil. Manag. 2007, 24, 908–926. [Google Scholar]
- Chi, C.G.; Gursoy, D. Employee satisfaction, customer satisfaction, and financial performance: An empirical examination. Int. J. Hosp. Manag. 2009, 28, 245–322. [Google Scholar] [CrossRef]
- Gruca, T.S.; Rego, L.L. Customer satisfaction, cash flow, and shareholder value. J. Mark. 2005, 69, 115–130. [Google Scholar] [CrossRef]
- Winkler, G.; Schwaiger, M.S. Is customer satisfaction driving revenue—A longitudinal analysis with evidence from the banking industry? J. Bus. Econ. Res. 2004, 2, 11–22. [Google Scholar] [CrossRef]
- Grewal, R.; Chandrashekaran, M.; Citrin, A.V. Customer satisfaction heterogeneity and shareholder value. J. Mark. Res. 2010, 47, 612–626. [Google Scholar] [CrossRef]
- Merrin, R.P.; Hoffmann, A.O.I.; Pennings, J.M.E. Customer satisfaction as a buffer against sentimental stock-price corrections. Mark. Lett. 2013, 24, 13–27. [Google Scholar] [CrossRef]
- Tuli, K.; Bharadwaj, S. Customer Satisfaction and Stock Returns Risk. J. Mark. 2009, 73, 184–197. [Google Scholar] [CrossRef]
- Gounaris, S.P.; Avlonitis, J.G.; Kouremenos, A.; Papavassiliou, N.; Papathastopoulou, P. Market share and customer satisfaction: What is the missing link? J. Euromark. 2002, 10, 61–82. [Google Scholar] [CrossRef]
- Rego, L.L.; Morgan, N.A.; Fornell, C. Reexamining the Market Share—Customer Satisfaction Relationship. J. Mark. 2013, 77, 1–20. [Google Scholar] [CrossRef]
- Rossomme, J. Customer satisfaction measurement in a business-to-business context: A conceptual framework. J. Bus. Ind. Mark. 2003, 18, 179–195. [Google Scholar] [CrossRef]
- Raj Kumar, R.J.; Krishnaven, V. Satisfaction of industrial customers with regard to usage of zippers. J. Adv. Res. Dyn. Control Syst. 2017, 9, 144–148. [Google Scholar]
- Gerson, R.F. Measuring Customer Satisfaction: A Guide to Managing Quality Service; Crisp Publications: Menlo Park, CA, USA, 1993. [Google Scholar]
- Siskos, Y.; Grigoroudis, E.; Zopounidis, C.; Saurais, O. Measuring customer satisfaction using a collective preference disaggregation model. J. Glob. Optim. 1998, 12, 175–195. [Google Scholar] [CrossRef]
- Chalikias, M.; Drosos, D.; Skordoulis, M.; Tsotsolas, N. Determinants of customer satisfaction in healthcare industry: The case of the Hellenic Red Cross. Int. J. Electron. Mark. Retail. 2016, 7, 311–321. [Google Scholar] [CrossRef]
- Medjoudj, R.; Aissani, D.; Haim, K.D. Power customer satisfaction and profitability analysis using multi-criteria decision making methods. Int. J. Electr. Power Energy Syst. 2013, 45, 331–339. [Google Scholar] [CrossRef]
- Walsh, G.; Dinnie, K.; Wiedmann, K.P. How do corporate reputation and customer satisfaction impact customer defection? A study of Private Energy Customers in Germany. J. Serv. Mark. 2006, 20, 412–420. [Google Scholar] [CrossRef]
- Elliot, J.; Serna, C. Managing customer satisfaction involves more than improving reliability. Electr. J. 2005, 18, 84–89. [Google Scholar] [CrossRef]
- Mutua, J.; Ngui, D.; Osiolo, H.; Aligula, E.; Gachan, J. Consumers satisfaction in the energy sector in Kenya. Energy Policy 2012, 48, 702–710. [Google Scholar] [CrossRef]
- J.D. Power. Gas Utility Business Customer Satisfaction Study; J.D. Power: Troy, MI, USA, 2016. [Google Scholar]
- J.D. Power. Gas Utility Residential Customer Satisfaction Study; J.D. Power: Troy, MI, USA, 2016. [Google Scholar]
- American Customer Satisfaction Index. ACSI Utilities, Shipping, and Health Care Report; ACSI: Ann Arbor, MI, USA, 2017. [Google Scholar]
- Liu, B.; Zhang, T.; Zhou, W.; Chan, X. Research of electricity customer satisfaction evaluation on service blueprint. Wirel. Commun. Netw. Mob. Comput. 2007, 3168–3171. [Google Scholar]
- Chodzaza, G.E.; Gombachika, H.S. Service quality, customer satisfaction and loyalty among industrial customers of a public electricity utility in Malawi. Int. J. Energy Sect. Manag. 2013, 7, 269–282. [Google Scholar] [CrossRef]
- Jannadi, O.A.; Al-Saggaf, H. Measurement of quality in Saudi Arabian service industry. Int. J. Qual. Reliabil. Manag. 2000, 17, 949–966. [Google Scholar] [CrossRef]
- Medjoudj, R.; Laifa, A.; Aissani, D. Decision making on power customer satisfaction and enterprise profitability analysis using the Analytic Hierarchy Process. Int. J. Prod. Res. 2012, 50, 4793–4805. [Google Scholar] [CrossRef]
- Ibáñez, V.A.; Hartmann, P.; Calvo, P.Z. Antecedents of customer loyalty in residential energy markets: Service quality, satisfaction, trust and switching costs. Serv. Ind. J. 2006, 26, 633–650. [Google Scholar] [CrossRef]
- Hartmann, P.; Ibáñez, V.A. Managing customer loyalty in liberalized residential energy markets: The impact of energy branding. Energy Policy 2007, 35, 2661–2672. [Google Scholar] [CrossRef]
- García-Acebrón, C.; Vázquez-Casielles, R.; Iglesias, V. The effect of perceived value and switching barriers on customer price tolerance in industrial energy markets. J. Bus.-to-Bus. Mark. 2010, 17, 317–335. [Google Scholar] [CrossRef]
- Fuels Europe. Statistical Report 2018; Fuels Europe: Brussels, Belgium, 2018. [Google Scholar]
- Eurostat. Natural Gas Supply Statistics. 2019. Available online: https://ec.europa.eu/eurostat/statisticsexplained/index.php?title=Natural_gas_consumption_statistics&oldid=88292 (accessed on 3 February 2019).
- Public Company of Gas Supply of Greece (DEPA). Commercial Operation. 2015. (In Greek). Available online: http://www.depa.gr/content/article/002003007/112.html (accessed on 20 December 2018).
- Ipsilandis, P.G.; Samaras, G.; Mplanas, N. A multicriteria satisfaction analysis approach in the assessment of operational programmes. Int. J. Proj. Manag. 2008, 26, 601–611. [Google Scholar] [CrossRef]
- Grigoroudis, E.; Siskos, Y. Preference disaggregation for measuring and analysing customer satisfaction: The MUSA method. Eur. J. Oper. Res. 2002, 143, 148–170. [Google Scholar] [CrossRef]
- Ipsos; London Economics; Deloitte. Second Consumer Market Study on the Functioning of the Retail Electricity Markets for Consumers in the EU. Country Fiches; European Commission: Brussels, Belgium, 2016. [Google Scholar]
- Agnihotri, R.; Gabler, C.B.; Itani, O.S.; Jaramillo, F.; Krush, M.T. Salesperson ambidexterity and customer satisfaction: Examining the role of customer demandingness, adaptive selling, and role conflict. J. Pers. Sell. Sales Manag. 2017, 37, 27–41. [Google Scholar] [CrossRef]
- Kumar, V.; Batista, L.; Maull, R. The impact of operations performance on customer loyalty. Serv. Sci. 2011, 3, 158–171. [Google Scholar] [CrossRef]
- Drosos, D.; Tsotsolas, N.; Chalikias, M.; Skordoulis, M.; Koniordos, M. Evaluating customer satisfaction: The case of the mobile telephony industry in Greece. In Communications in Computer and Information Science; Kravets, A., Shcherbakov, M., Kultsova, M., Eds.; Springer International Publishing: Cham, Switzerland, 2015; pp. 249–267. [Google Scholar]
- Jacoby, J. Consumer research: A state-of-the-art review. J. Mark. 1978, 42, 87–96. [Google Scholar] [CrossRef]


| Satisfaction Criteria | Satisfaction Sub-Criteria | |
|---|---|---|
| Products-services [3,61,65,68,69,70,75,77] |
|
|
| Communication and collaboration with staff [3,60,61,65,68,72,76] |
|
|
| Customer service [3,61,69,70,72,73,74,76] |
|
|
| Pricing policy [3,60,65,69,70,75,77,78] |
|
|
| Website [61,72,76,77] |
|
|
| Satisfaction Criteria | Number of Sub-Criteria | Cronbach’s a |
|---|---|---|
| Products–services | 5 | 0.801 |
| Communication and collaboration with staff | 5 | 0.710 |
| Customer service | 6 | 0.725 |
| Pricing policy | 7 | 0.823 |
| Website | 5 | 0.703 |
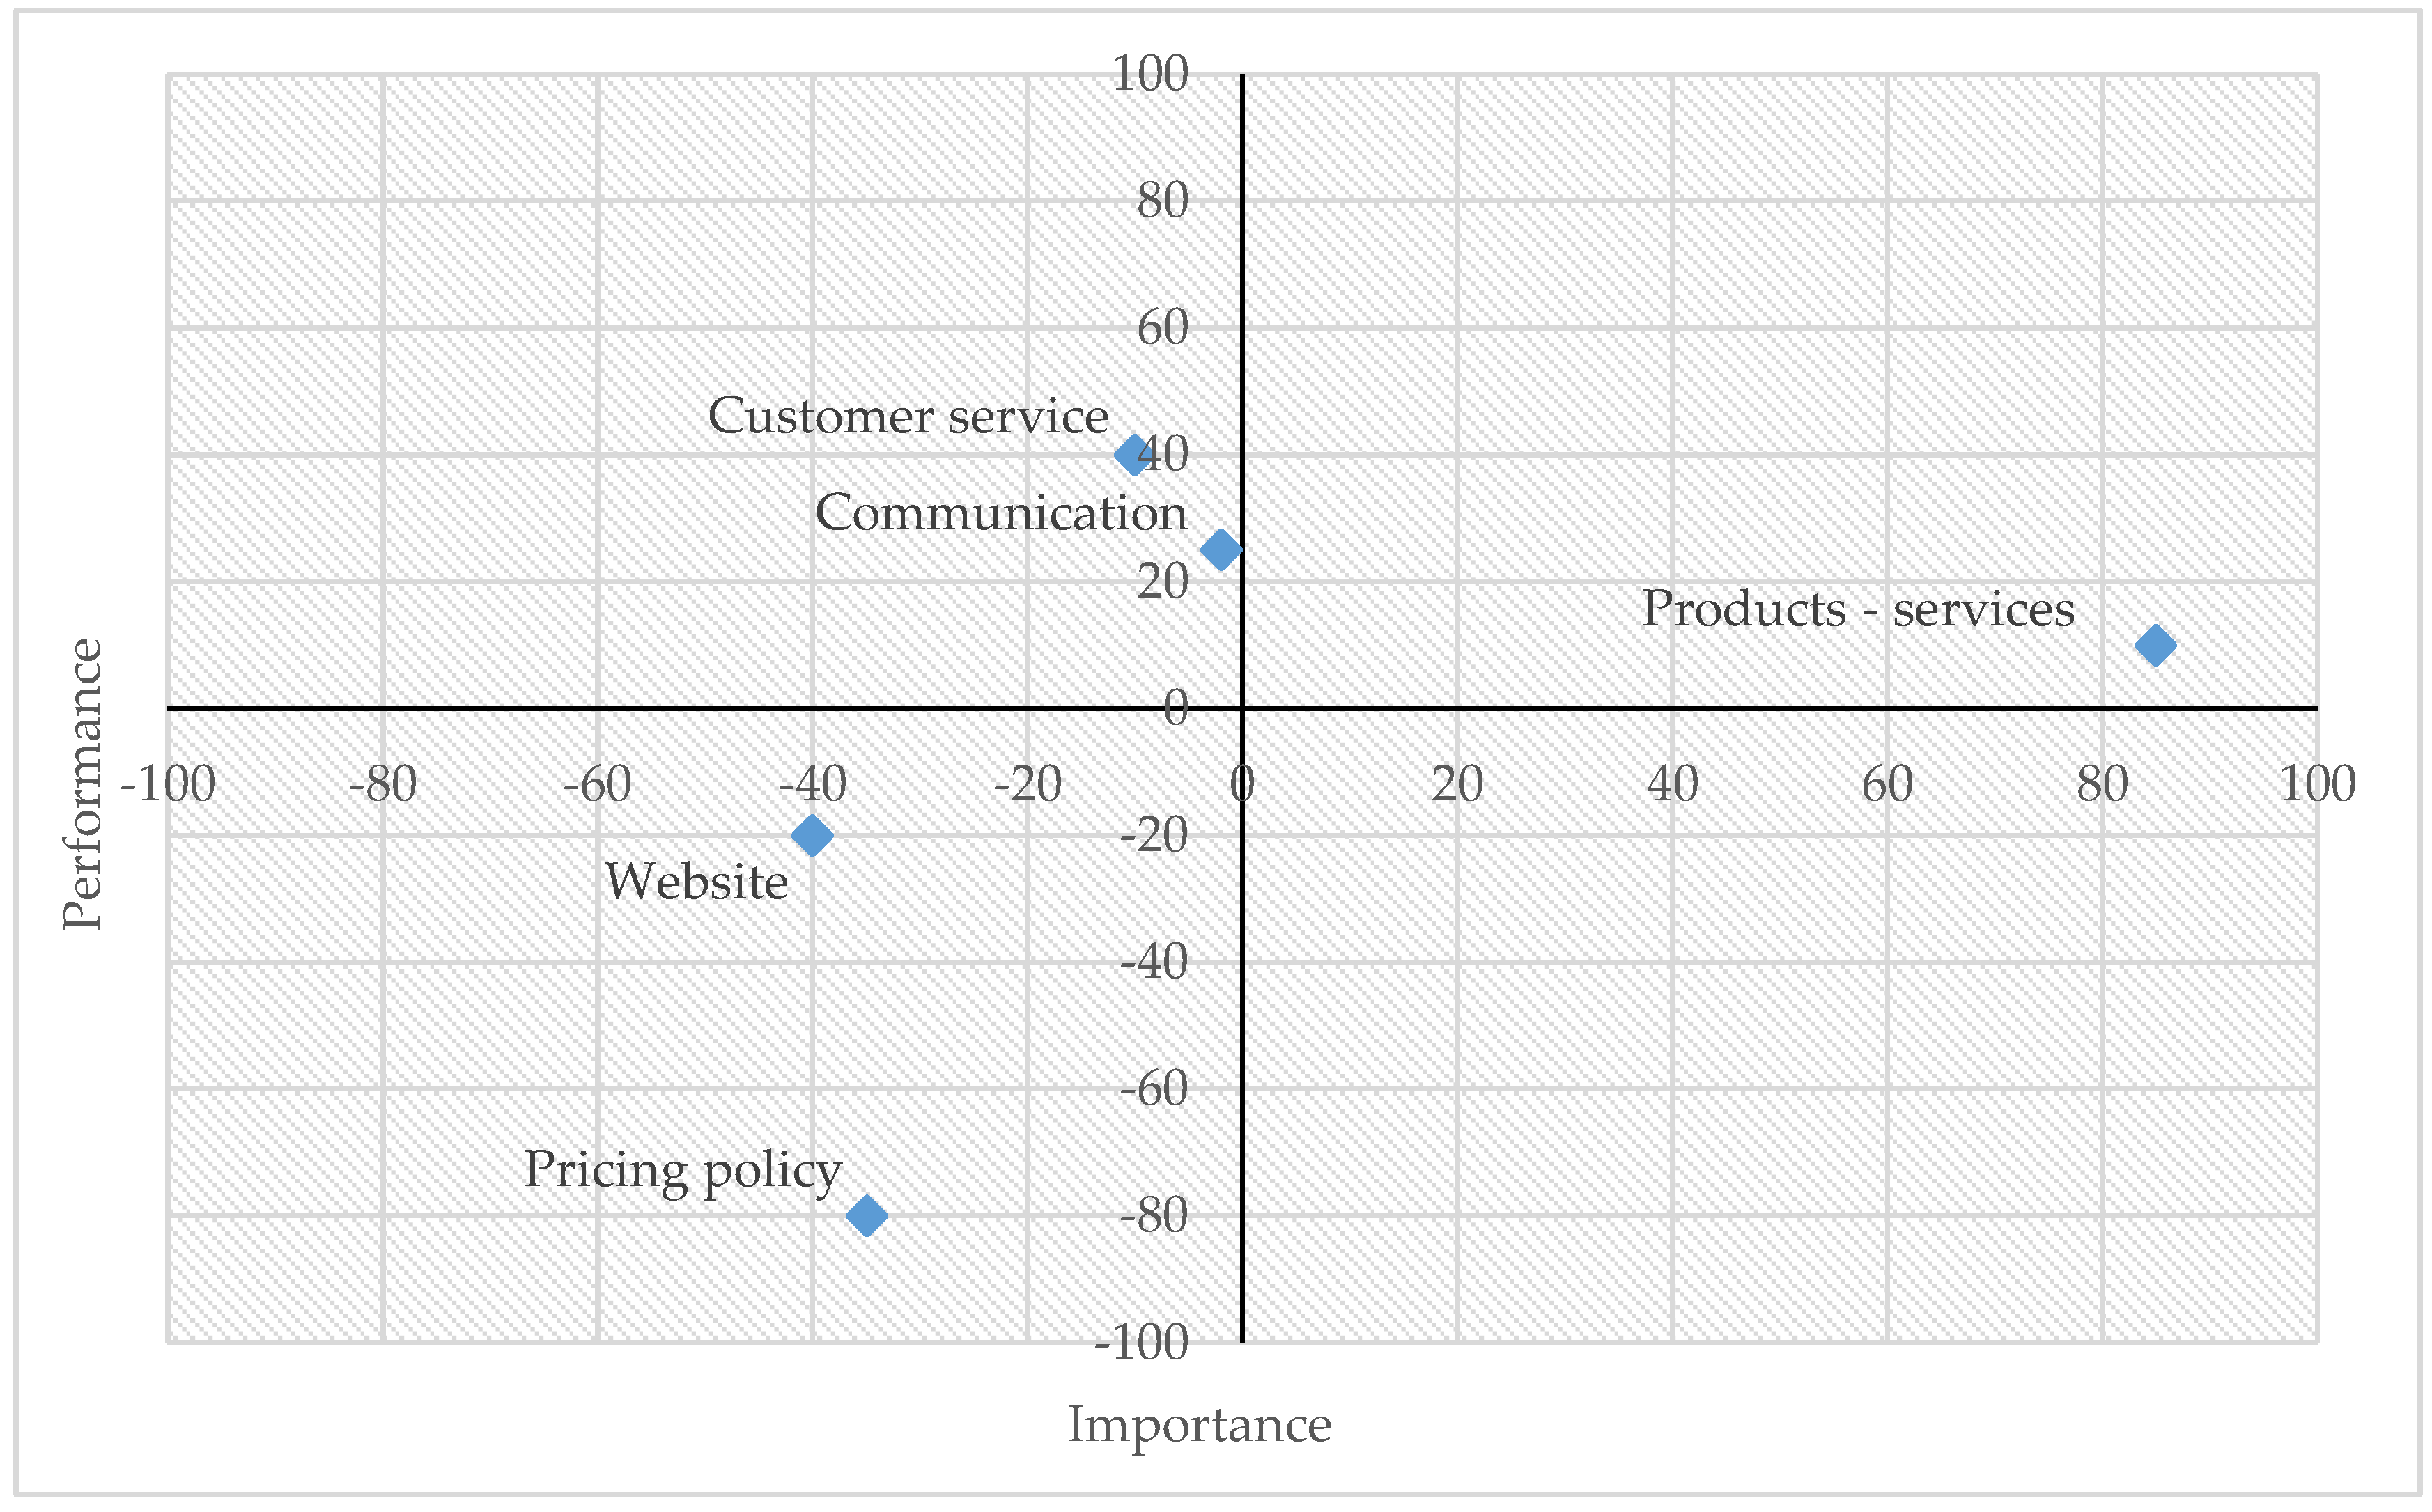
| Satisfaction Criteria | Level of Importance for Global Satisfaction |
|---|---|
| Products–services | 24.50% |
| Communication and collaboration with staff | 19.60% |
| Customer service | 19.90% |
| Pricing policy | 18.10% |
| Website | 17.90% |
| Satisfaction Criteria | Level of Satisfaction |
|---|---|
| Products–services | 78.99% |
| Communication and collaboration with staff | 86.46% |
| Customer service | 83.51% |
| Pricing policy | 55.58% |
| Website | 70.47% |
| Satisfaction Scale | Level of Satisfaction |
|---|---|
| Totally dissatisfied | 4.55% |
| Dissatisfied | 2.27% |
| Neutral | 27.27% |
| Satisfied | 40.91% |
| Totally satisfied | 25% |
| Satisfaction Criteria | Chi-Square | df | p-Value |
|---|---|---|---|
| Products–services | 9.412 | 4 | 0.082 |
| Communication and collaboration with staff | 3.877 | 4 | 0.423 |
| Customer service | 2.597 | 4 | 0.627 |
| Pricing policy | 3.170 | 4 | 0.530 |
| Website | 9.017 | 4 | 0.061 |
| Global satisfaction | 4.751 | 4 | 0.314 |
© 2019 by the authors. Licensee MDPI, Basel, Switzerland. This article is an open access article distributed under the terms and conditions of the Creative Commons Attribution (CC BY) license (http://creativecommons.org/licenses/by/4.0/).
Share and Cite
Drosos, D.; Skordoulis, M.; Arabatzis, G.; Tsotsolas, N.; Galatsidas, S. Measuring Industrial Customer Satisfaction: The Case of the Natural Gas Market in Greece. Sustainability 2019, 11, 1905. https://doi.org/10.3390/su11071905
Drosos D, Skordoulis M, Arabatzis G, Tsotsolas N, Galatsidas S. Measuring Industrial Customer Satisfaction: The Case of the Natural Gas Market in Greece. Sustainability. 2019; 11(7):1905. https://doi.org/10.3390/su11071905
Chicago/Turabian StyleDrosos, Dimitrios, Michalis Skordoulis, Garyfallos Arabatzis, Nikos Tsotsolas, and Spyros Galatsidas. 2019. "Measuring Industrial Customer Satisfaction: The Case of the Natural Gas Market in Greece" Sustainability 11, no. 7: 1905. https://doi.org/10.3390/su11071905
APA StyleDrosos, D., Skordoulis, M., Arabatzis, G., Tsotsolas, N., & Galatsidas, S. (2019). Measuring Industrial Customer Satisfaction: The Case of the Natural Gas Market in Greece. Sustainability, 11(7), 1905. https://doi.org/10.3390/su11071905