Abstract
Farmers living in a state of poverty in semi-arid areas are the main victims of drought. They suffer most from drought, which makes it particularly important to assess their capacity to cope with it. The present study developed a new approach for such assessment. Famers’ resources and initiatives to deal with drought were evaluated, and appropriate coping strategies are proposed by analyzing the differences between the coping capacities of two categories of farmers; tenants (with large holdings) and smallholders. Tenants’ capacity to cope with drought was 1.7 times that of smallholders. Also, tenants showed greater initiative during droughts, whereas smallholders made greater efforts in preparing for droughts. Farmers’ resources were positively correlated to the degree of their initiative (correlation coefficient = 0.49). Farmers showed greater initiative when they had larger holdings and were less dependent on agricultural income. The state should give more financial support to subsidy-dependent farmers and encourage smallholders—whose major income comes from crops—to augment their income through livestock husbandry. Such a policy would prove more conducive to increasing the capacity of not only local farmers but also of the entire region to cope with droughts and to promote sustainable development of local agriculture.
1. Introduction
Drought is one of the most widespread and long-lasting natural disasters. As a consequence of global climate change, droughts are likely to be both more frequent and more intense [1]. Agricultural production is severely affected by droughts. From 2006 to 2016, 83% of all economic losses due to drought were incurred by the agricultural sector [2], which makes strengthening research on the management and governance of risk from agricultural droughts a key issue in current research on disasters [3].
The main victims of agricultural drought are farmers, especially those who are living in poverty and heavily dependent on crop production [4]. The impact of drought on farmers is not only reflected in economic losses but also in potential reduction in employment opportunities available to farmers and in the dampening of farmers’ enthusiasm to invest in crop production, which is not conducive to the sustainable development of regional agriculture [5]. Therefore, improving farmers’ capacity to cope with drought is the key to improving a region’s resilience to drought.
Different studies offer different definitions of farmers’ capacity to cope with drought. Some scholars believe that farmers’ capacity to cope with drought is a part of social vulnerability, which includes natural resources, economic capacity, human resources, and agricultural innovation [6], whereas others believe that farmers use their own experience and resources to cope with drought through agronomic management, crop intensification, water resources development, etc., which form a part of the farmers’ adaptability to drought [5,7]. Others believe that farmers’ capacity to cope with drought is mainly affected by the resilience of agro-ecosystems, diversity of livelihoods, and access to resources [8]. Another school of thought proposes that resilience and adaptability are a reflection of farmers’ capacity to cope with drought [9]. These different definitions of farmers’ capacity to cope with drought are interrelated and may overlap. With the development of the social economy, actions to resist drought are no longer focused on the merits and demerits of the social system; instead, the actions focus on the coping strategies developed by farmers themselves. Farmers often overcome the difficulties caused by drought by modifying the cropping system, improving crop management, diversifying their sources of income, and increasing their social interaction [10,11]. The capacity to cope with drought is related to many factors, including food shortages faced by households, food production, social welfare, farmland management (including cropping patterns and reducing water loss), social networks, access to information, response to drought, and recovery after drought [12,13]. In general, these factors can be roughly divided into ecological factors, physical factors, social factors, economic factors, family structure, and farming experience (Table 1) [14,15].

Table 1.
Common indicators for evaluating farmers’ capacity to cope with drought.
It is apparent from the definitions and indicators of farmers’ capacity to cope with drought that the capacity is an attribute of an individual farming household, which is affected by its concrete or tangible resources, and can be measured by objective and quantitative indicators. However, such intangible resources as the farmers’ enthusiasm and initiative are often neglected in these measurements. Such subjective and intrinsic motivating factors as the initiatives taken by farmers to face drought, including investing in irrigation [32], communicating with other farmers [33], and buying crop insurance [34], also affect the ability to cope with drought. These initiatives often depend on such subjective aspects as the farmer’s experience of disasters, views on the mechanism of responding to disasters, and awareness of future risks from disasters [35,36]. People’s subjective willingness affects their response to disasters, and thus the level of risk governance [35,37]. Therefore, we believe that it is necessary to consider both subjective factors and the resources available to farmers in assessing their capacity to cope with drought.
Since the 1990s, as the income gap in China between those who live in cities and those who live in villages has continued to widen, young workers have been migrating to cities in growing numbers, leaving behind an ageing rural workforce [38]. Due to the shortage of labor, the decreasing rate of utilization of cultivated land in rural areas, and the fact that farmers have become more willing to lease their land to large tenants. This has resulted in widespread transfer of land in rural areas [39,40,41]. In Xinghe county, 30% of the cultivated land is concentrated in the hands of large tenants, who enjoy greater flexibility in crop planning and a more stable income than smallholders do, and are therefore better equipped to cope with economic and environmental changes [42,43]. In addition, fluctuating precipitation in the local semi-arid areas leaves smallholders ill prepared to face droughts—the only mitigation option open to them is to change the cropping pattern [44]. Large tenants, however, have been able to switch from rain-fed farming to irrigated farming, and thus have obvious advantages over smallholders when it comes to crop production. Therefore, in assessing the capacity of local farmers to cope with drought, we should consider both large tenants and smallholders.
The present study proposes a new perspective to assess farmers’ capacity to cope with drought. We sought to make the initiatives taken by farmers to cope with drought a part of the system to evaluate their coping capacity and to include both groups—smallholders and tenants (in this paper, a tenant is defined as one who has leased land from other farmers for crop production)—in the evaluation, given the significant differences in the resources available to them. The study was limited to a sample of tenants cultivating more than 100 Mu (1 Mu = 0.067 ha). Mu is a statistical unit of area adopted in China, with a large population and fragmented cultivated land. This unit has been used in a number of studies [45,46]. The study was planned to: (1) explore the difference between smallholders’ and tenants’ resources and initiatives to cope with drought; (2) find out the main factors that affect the farmers’ initiatives; and (3) suggest, based on the differences in farmers’ capacities to cope with drought, a suitable livelihood strategy for farmers in semi-arid areas to strengthen the region’s overall resilience to drought.
2. Material and Methods
2.1. Overview of the Study Area
Located in the central part of Inner Mongolia in China, Xinghe county is a typical rain-fed farming area in a semi-arid region of northern China. Because the county lies on the edge of the region served by the south-east monsoon, rainfall is unstable with wide annual fluctuations. Over the past 50 years, the minimum and the maximum average annual precipitation has fluctuated between 50% and nearly 150% of the average of 313.4 mm, making Xinghe one of the most vulnerable farming regions in China.
Local smallholders are constrained by high irrigation costs and are often helpless in the face of drought, whereas large tenants can manage it better by using irrigation, including sprinkler irrigation and drip irrigation, although, as with the smallholders, the costs incurred by the tenants are also often influenced by their other initiatives, which therefore become important to the ability of both categories of farmers to cope with drought.
2.2. Questionnaire Survey
We collected household-level data, in August and September 2017, from 68 administrative villages distributed over nine towns of Xinghe county. The households were selected using multi-stage random sampling—40% of the total villages in each town, and about ten households from each of the selected villages were selected at random. If a village had any large tenants, a couple of them were also included (Figure 1). The final data set comprised 636 valid household surveys consisting of 551 smallholders and 85 tenants.
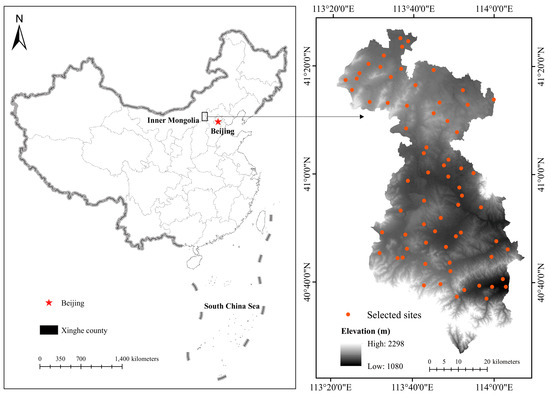
Figure 1.
Distribution of sampling sites. In the northern part of Xinghe county, farmlands are relatively flat and suitable for large-scale farming, and therefore attract many large tenants. The central region lies at a lower elevation and has more abundant groundwater resources than other regions. The southern region is mountainous with uneven topography, and it is mostly the hill slopes that are cultivated.
The survey was conducted by trained investigators, who used a semi-structured questionnaire (Appendix A) and varied their technique as required to suit each household being interviewed. Most of the items were designed to elicit objective information about the resources available using open-ended questions. On the other hand, the Likert scale was used for assessing such subjective aspects as the willingness to deal with drought.
2.3. Methods
2.3.1. Research Ideas
The coping capacity of a farmer (CC), defined as comprising the resources available to the farmer and the initiatives taken by the farmer to deal with drought, was calculated using Equation (1), as follows:
where OR is the objective resource score, which consists of four dimensions, namely economic resources (ER), social resources (SR), human resources (HR), and physical resources (PR); SI stands for subjective initiatives taken by the farmer to deal with drought, which consists of preparations before the drought (PB), the response during the drought (RD), and initiatives for recovering after the drought (RA). The individual capacity to cope with drought includes a large number of physical and objective variables, as well as psychological variables. In a model of farmers’ behavior and decision-making established by researchers, farmers’ behaviors are affected by their own resources and attitudes [47]. Therefore, this paper uses Equation (1) to comprehensively consider the resources and attitudes of farmers.
2.3.2. Indicators of Resources and Initiatives
The resources available to a farmer were quantified based on 12 indicators grouped into four dimensions. Of the 12 indicators, two ratios, namely (1) the ratio of agricultural income to total income and (2) youth and old-age dependency ratio (dependent because of being either too young or too old to work) are negative indicators and the rest are positive indicators. We used the Shannon-Wiener index to characterize the diversity of crops grown by farmers because the index not only takes into account the number of crops but also the discreteness of the planting area [48]. The Shannon-Wiener index can be calculated by Equation (2):
where H denotes the Shannon-Wiener index, N represents the number of crop species, and pi indicates the proportion of the sown area of the ith crop to the total cultivated area. When farmers grow only one kind of crop, the Shannon-Wiener index has a minimum value of 0. The Shannon-Wiener index is larger when farmers grow multiple crops in more evenly distributed areas.
Information on the initiatives before, during, and after a drought was collected through three sets of questions, with each set consisting of three questions—one each for the initiatives before, during, and after the drought, the responses to each question being recorded in the form of the Likert scale (Table 2).
Table 2.
Description of different indicators used in estimating farmers’ abilities to cope with drought.
Each indicator was assigned a weighting using the entropy method and analytic hierarchy process (AHP). The entropy method was used to assigning appropriate weightings to the underlying indicators, and the higher weightings were revised based on expert experience. Such a combination of the subjective and objective methods of assigning weightings may make the evaluation more accurate [49,50].
We collected opinions from 45 professors and researchers from the Faculty of Geographical Science of Beijing Normal University, China Agricultural University, and the National Disaster Reduction Center of the Ministry of Civil Affairs. These experts have many years’ research experience in fields such as disaster risk assessment, risk governance, physical geography, natural resource management, and agricultural production in arid areas. Each expert assigned a score to the importance of the indicators in the first and second columns of Table 1. We calculated the weightings of the indicators according to the AHP method [51] and the weightings of the underlying indicators according to the entropy method (assigning weightings according to the index information entropy: if the value of a given index is more discrete, the amount of information provided by the index is larger [52,53]). The weightings of the underlying indicators calculated by the entropy method were adjusted based on the weightings of the indicators calculated through expert scoring to obtain the final weightings of the indicators (Table 2).
Suppose that the initial matrix X has n samples, each sample containing m indicators (Equation (3)). Xij represents the jth indicator value of the ith sample in the X matrix.
In the present study, the negative and positive indicators were normalized by Equations (4) and (5), respectively,
where denotes the normalized value and min (xj) and max (xj) represent the minimum and maximum values of the jth indicator, respectively.
The experts generally believed that farmers’ subjective initiatives play a slightly greater role in drought resistance than the amount of resources available to the farmers, the proportion being approximately 1.27:1. Among the resources owned by the peasant households, economic resources (ER) had the greatest weight, as high as 0.145, whereas the other three factors had weightings that were more or less similar. For farmers’ initiatives, the weight of the response during drought (RD) was the highest (0.17; Table 2).
3. Results
3.1. Smallholders and Tenants’ Capacity to Cope with Drought
The average score of tenants was higher than that of smallholders in the assessment of resources related to coping with drought. The biggest difference between tenants and smallholders is reflected in the PR score, the average score of tenants being 3 times that of smallholders. The extent of cultivated area and water resources of smallholders were far less than those of tenants. Thus, in terms of the utilization and distribution of resources, tenants enjoy greater choice and flexibility than smallholders do [42,54]. During the fieldwork we found that the smallholders are constrained by lack of irrigation in this semi-arid region, and most of them choose such drought-tolerant crops as millet and oat without hulls for some assured income. On the other hand, tenants have more choices and can cultivate sunflower, beetroot, and other crops that can earn more money (such as cabbage and spinach, etc.). Therefore, the results show greater individual differences in allocation of resources, and the tenants scored higher than the smallholders did in terms of the initiatives taken to deal with drought (Figure 2).
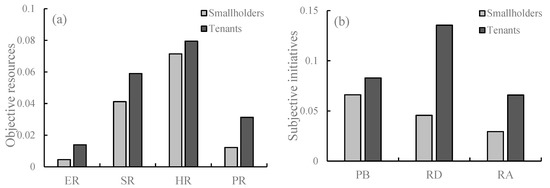
Figure 2.
Objective resources (a) and subjective initiatives (b) of smallholders and tenants. Smallholders scored lower than tenants on all aspects of objective resources and subjective initiatives. The average score of smallholders’ objective resources was 0.13, and that of smallholders’ initiative was 0.14, whereas the corresponding scores for the tenants were 0.18 and 0.28.
Most smallholders showed the greatest initiative in preparing for drought (the highest score was 0.07), less during drought, and the least after drought (the lowest score was 0.03), whereas most tenants showed the greatest initiative during drought (the highest score was 0.14), less before it, and the least after it (the lowest score was 0.07).
Local meteorological departments release information on soil moisture and medium-and long-term weather forecasts to the masses every ten days. For smallholders in the research region, paying attention to weather information before the drought is obviously more practical than taking appropriate countermeasures during the drought. For the tenants, a more effective way to cope with drought is to take appropriate actions during the drought. Thus, the tenants showed greater initiative during drought.
3.2. Resources and Initiatives to Resist Drought
The resources and initiatives were positively correlated (the correlation coefficient was 0.49; Figure 3). This correlation means that the more resources a farmer has, the greater the initiative shown by the farmer in coping with drought. Farmers short on resources are known to be conservative in dealing with drought, whereas farmers with greater resources are more willing to adopt a variety of measures to mitigate the impact of drought [55,56].
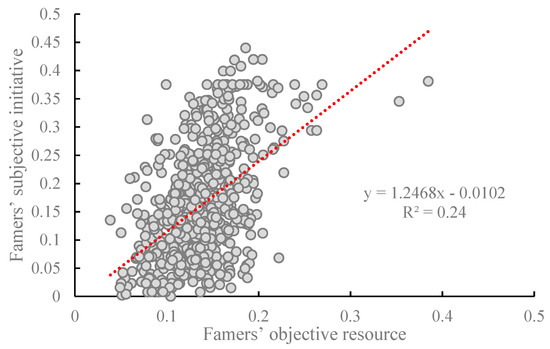
Figure 3.
Correlation between farmers’ objective resources and subjective initiatives. Each point in the figure represents one farmer. The correlation is positive (R2 = 0.24) and the correlation coefficient is 0.49 (significant at 0.01 level).
We also calculated the correlation between all four dimensions of resources (ER, SR, HR, and PR) and all four initiatives (PB, RD, RA, and SI) in coping with drought (Figure 4). The initiative in preparing for drought was weakly correlated to most of the objective resources. Farmers with larger landholdings (correlation coefficient = 0.46) and those who depend less on agricultural income (correlation coefficient = −0.37) and cultivate fewer kinds of crops (correlation coefficient = −0.32) showed greater initiative during drought. The size of the holding was also a key factor in the initiatives taken by the farmers after drought (correlation coefficient = 0.37).
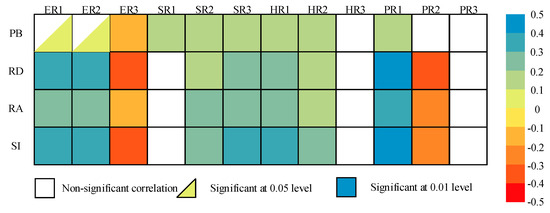
Figure 4.
Correlations between different levels of four kinds of resources—economic (ER1, ER2, ER3), social (SR1, SR2, SR3), human (HR1, HR2, HR3), and physical (PR1, PR2, PR3)—available to farmers and the level of initiatives taken by the farmers: preparations before (PB), response during (RD), and recovery after (RA) drought; SI (subjective initiative) represents the total initiatives in coping with drought. White squares: no significant correlation; triangles: correlation significant at 0.05 level; colored squares: correlation significant at 0.01 level; shades of blue: positive correlation (the deeper the shade of blue, the closer the correlation); shades of red: negative correlation (the deeper the shade of red, the closer the correlation). For specific descriptions of indicators, see Table 2.
On the whole, the extent of cultivated land had a marked positive effect on the initiatives shown by the farmers. Those farmers who depend more on agricultural income showed lower initiative in coping with drought, especially during the drought and after it. Faced with a drought, the very high irrigation costs prevent farmers from saving their crop and dampens their initiative in coping with drought. After the drought, it is too late to replant or to switch to another crop, because crops in these regions take a year to mature. Thus, these farmers have fewer strategies for cutting their losses after drought.
3.3. Strategies to Increase Farmers’ Capacity to Cope with Drought
Xinghe county is part of the agro-pastoral ecotone in northern China. Farmers in the county not only grow crops but also raise some ruminant livestock. Based on their main sources of income (according to the criterion in which a source of income exceeds 50% of the total household income), farmers in this area can be roughly divided into four categories, namely those depending mainly on migrant labor (ML) (the farmers still own houses and cultivated land in the local area, but the main labor force in the household moves to other regions and is employed in different operations in the period of a year), on planting crops (PL), on livestock husbandry (LH), and on government subsidies (GS).
In Xinghe county, the largest proportion (38.53%) in the total is of PL farmers, followed by that of GS (20.76%). Among all types of smallholders, the resource scores were not significantly different and ranged from 0.12 to 0.13, whereas the SI scores showed significant differences: ML farmers showed the highest SI score (approximately 0.16), whereas GS showed the lowest (0.11). The least able to cope with drought were GS farmers, with an average coping ability of 0.23, whereas the tenants’ average ability was double of that. GS farmers also had the lowest average household income among all farmers, with an average income that was less than half that of ML farmers (Table 3), and showed little enthusiasm in coping with drought, which, along with the low income, lowered their overall ability to cope with drought. Smallholders who depend on state subsidies during the drought are less proactive in dealing with drought, not only during a drought but also afterwards [57].
Table 3.
Drought resistance ability and family income of tenants and of four categories of farmers.
By comparing and analyzing the age distribution of different types of farmers (Figure 5), we found that PL and LH farmers were mostly 55–65 years old (median, 60 years); ML farmers were relatively young, mostly 47–63 years old (median, 55 years); and GS farmers were much older, mostly 64–72 years old (median, 68 years).
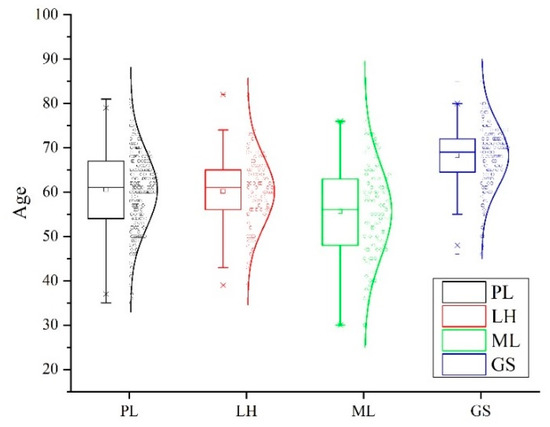
Figure 5.
Age distribution of different categories of smallholders. Each circle within the box represents a sample of smallholders; the number of points arranged horizontally represents the concentration within the age group; and the solid line is the age-distribution curve fitted by the point distribution. Categories based on main source of income: PL, planting crops; LH, livestock husbandry (LH); ML, migrant labor; and GS, government subsidies.
The ranking of the above categories based on their coping ability was as follows: ML > LH > PL > GS. Therefore, PL and GS farmers should be encouraged to move to the two categories that showed greater coping ability, namely ML and LH. Based on the earlier analysis, we propose a framework of livelihood strategies to improve the farmers’ capacity to cope with drought (Figure 6). Those PL farmers younger than 55 years should be encouraged to work for wages so as to move to the category ML. PL farmers who own level lands can also lease their farmland to tenants to obtain a stable rental income, whereas those who cultivate hill slopes can diversify into livestock husbandry. Neither ML farmers nor LH farmers need large tracts of cultivated land, and can transfer their surplus land to tenants to obtain additional income. Those in the GS category who are unable to work can also lease their land, and those who can should be encouraged to keep a small number of livestock. The state should focus on supporting the former and subsidizing the latter.
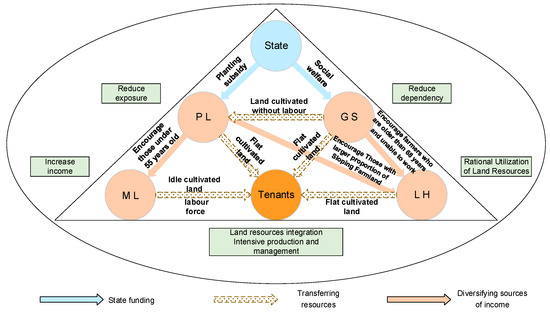
Figure 6.
Livelihood strategies framework. Circles of different colors represent different categories of stakeholders based on their main source of income: PL, planted land; GS, government subsidies; ML, migrant labor; and LH, livestock husbandry. The blue line indicates the direction that the state should focus on in supporting and subsidizing. The orange line indicates the direction that farmers’ family income structures should be encouraged to shift. The dotted line represents the direction in which farmers should be encouraged to transfer part of their resources (land, labor, etc.). Through the transfer of resources among smallholders, tenants, and government, and the change of family income structure of smallholders, the capacity of local farmers to cope with drought is improved, and sustainable development of regional agriculture is promoted.
Finally, three categories of farmers (ML, LH, and tenants) make up the main body of farmers who can cope with drought in this region. Increasing the proportion of these three categories and increasing their coping ability even further are measures that will make the region as a whole more capable of coping with drought. Farmers with relatively low ability to cope with drought (PL and GS) can limit their exposure to drought and their dependence on the state by transferring their resources (mainly the land) and by diversifying their sources of income. The state should support and subsidize these weaker groups to increase their ability to cope with drought, so that, ultimately, the entire region becomes better equipped to face droughts.
4. Discussion
4.1. Capacity to Cope with Drought with and without Considering Farmers’ Initiatives
We included some open-ended questions to assess the economic losses incurred by the farmers due to drought. This loss, the relative loss due to drought (RLD), was expressed as a ratio of the estimated loss to the average total agricultural income. In order to evaluate the difference between the ability to cope with drought with and without taking into account famers’ initiatives, we compared the RLD with CC of the farmers (Figure 7a) and also with the resource-dominant drought-coping capacity (Figure 7b).
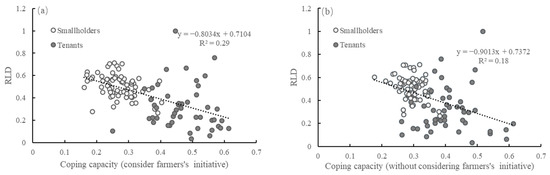
Figure 7.
Correlation between coping capacity and relative loss due to drought (RLD). Capacity with taking into account the initiatives of farmers and RLD (a) and that without (b). Each point in the figure represents the mean value of drought-coping capacity and the RLD in each village. Filled circles represent tenants and blank circles represent smallholders. The results of taking the initiatives into account led to R2 = 0.29, and those of not taking them into account (that is, taking only the resources into account) led to R2 = 0.18.
Both the comparisons showed that CC and RLD were negatively correlated—the higher the capacity, the lower the relative loss. However, the R2 of coping capacity estimated after taking into account the initiatives (R2 = 0.29) was significantly higher than that estimated without taking them into account (R2 = 0.18). The correlation coefficient calculated by the former option was −0.54 and that by the latter was −0.43. Both were significant at a level of 0.01. Thus, the capacity to cope with drought after taking famers’ initiatives into account was more accurate and comprehensive than that after taking only the resources into account.
4.2. Positive Feedback from Supplementing Farming with Livestock Husbandry
As seen in Section 3.3, the income of farmers from category LH was greater than that of farmers from category PL. Therefore, we recommend a shift from PL to LH; farmers from category PL should, however, retain part of the cultivated land for growing silage crops for feeding the livestock, which is to be the main source of income for the family.
To explore the benefits of the transformation from PL to LH in combating droughts, we analyzed the relationship between the proportion of area allotted to silage crops to the total area and the RLD (Figure 8). The greater the share of the area set aside for silage crops, the steeper the decline in the RLD; for every 10% increase in the area set aside for silage crops, the RLD decreased by 23.5%.
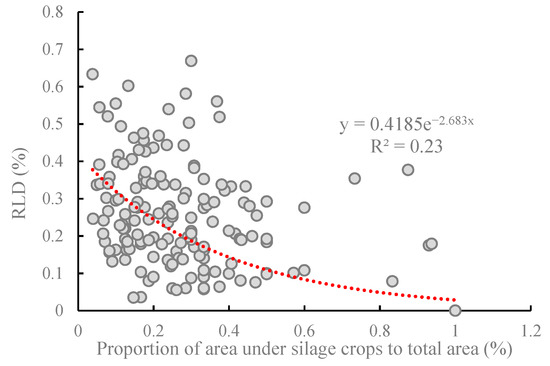
Figure 8.
The relationship between the proportion of area under silage crops to total area and relative loss due to drought (RLD). Each point represents one household that set aside part of its cultivated land to grow silage crops as feed for livestock. The greater the proportion of area under silage crops, the steeper the decline in the RLD (R2 = 0.23).
Livestock is a source not only of income but also of draft power, transport, manure, etc. [58]. For farmers in semi-arid areas, raising small ruminants and properly integrating crop cultivation and livestock rearing is an effective means of earning a livelihood [59]. Studies have shown that in areas with frequent droughts, it is a poor strategy to depend solely on either crops or livestock; a far better strategy is to combine farming with livestock husbandry, which can help farmers in adapting to climate change [60,61].
We propose that a shift from PL to LH does not mean that farmers do not grow grain crops at all. Instead, farmers are advised to increase the area of silage crops appropriately to establish mixed crop–livestock farm systems, which would transform a heavy dependence on crop income into dependence on livestock income. Appropriate cultivation of silage crops helps to improve ruminant production, increases biodiversity, and decreases disaster risk through diversification [62,63]. Corn and silage sorghum are common silage crops because of their high yield and their ability to be easily mixed with other feedstuffs [64]. In addition, they can enable more effective water use, and even under drought conditions, they can achieve satisfactory yields [65,66]. Planting silage crops enables people in arid areas to pay minimal attention to crop production, and silage crops can provide part of the feed for livestock even in severe droughts. In our survey, we found that silage crops are usually sown in April and harvested in August to September in Xinghe County. Silage crops can still be planted after the first season, although the silage crops in this season cannot fully mature, but can provide straw for livestock.
4.3. Improving the Drought Resistance Level in the Region
The purpose of this paper is to propose new ideas for evaluating farmers’ capacity to cope with drought. The evaluation results represent only the general state of farmers in this region. However, with the changes in the market economy and local policies, the farmer’s planting structure and family income structure will also change, which will in turn affect the ability of farmers to cope with drought. Therefore, according to this research method, the changes in farmers’ capacity to cope with drought under different driving forces in the future (mainly the market economy and social policy) deserve further study.
In addition, according to the results of this study, farmers’ initiatives and attitudes differ before, during, and after a disaster, and changes in initiative also lead to the changes in the capacity to cope with drought. For example, increasing people’s awareness of disasters before disasters occur improves the regional capacity to withstand disasters [67]. Disaster severity also affects people’s attitudes and initiatives to fight the disaster [68]. After a disaster, people form a collective consciousness and a sense of belonging through active cooperation and voluntary service, which improves the ability to cope with drought in the region [69,70]. Therefore, it is crucial to explore the changes in farmers’ ability to cope with drought at different stages of disasters and the factors that improve regional drought resistance level.
The capacity of a single farmer to cope with drought is only a part of the comprehensive drought resistance in a region. The construction of local anti-drought infrastructure and the popularization of anti-drought technology have also played important roles in improving the level of drought resistance in the entire region. For smallholders, the use of straw or plastic film mulching can effectively increase soil moisture and decrease crop water consumption, thereby decreasing the impact of drought on crops [71,72], and can also improve factors such as plant height and leaf area [73,74]. Tenants decrease the effects of drought on crops mainly through groundwater irrigation. However, the literature shows that the efficiency of agricultural irrigation water is low; therefore, water-saving irrigation is important for enhancing regional drought resistance [75]. Through real-time measurement of soil water content [76] and rational allocation of irrigation times and amounts according to soil water content, real-time precise irrigation can be achieved [77]. This achievement would help to improve the efficiency of regional irrigation, decrease regional vulnerability to drought, and promote the sustainable development of regional agriculture.
5. Conclusions
The present study proposed a new approach to assess farmers’ capacity to cope with drought, taking the subjective initiatives of farmers into account in the evaluation system. We also analyzed the differences between smallholders of four different categories in their ability to cope with drought, and put forward appropriate livelihood strategies for farmers in the agro-pastoral ecotone of semi-arid areas. The livelihood strategies proposed in the present study can be widely applied to arid and semi-arid areas elsewhere in the world, wherever agriculture and livestock husbandry are practiced together. The major findings are given below.
- (1)
- The value of the initiatives and resources by tenants was larger than that by smallholders. Smallholders showed greater initiatives before drought, whereas most of the large tenants did so during drought.
- (2)
- The more resources a farmer has, the greater the farmer’s enthusiasm to lower the adverse impacts of drought (correlation coefficient = 0.49). Generally, the larger the cultivated area, the lower the dependence on agricultural income and the higher the enthusiasm.
- (3)
- In terms of increasing the ability to cope with drought and raising household income, working for wages and livestock husbandry are two better ways of making a livelihood.
- (4)
- To increase the coping capacity of the region as a whole, it is suggested that the tenants be encouraged to grow crops, and that smallholders be encouraged to raise livestock. Land resources and part of the labor force are concentrated in large contracting households—a situation conducive to achieving intensive production and management, reducing the risk of regional agricultural drought, and promoting sustainable development of agriculture.
Increasing attention is being paid to integrated risk governance, which emphasizes involving multiple stakeholders, adopting multiple scales, and developing multiple measures [78]. Therefore, taking into account farmers’ initiatives in combating drought is not only conducive to a more comprehensive and accurate assessment of their capacity to cope with drought but is also helpful to policymakers in understanding farmers’ needs and priorities, and in turn, in formulating appropriate policies [79,80] to foster collaboration between farmers and the state to achieve a common purpose, thereby increasing the consilience of the entire social-ecological system.
Author Contributions
Conceptualization, H.G.; data curation, H.G.; formal analysis, H.G.; investigation, H.G., Y.W., Y.S., and H.Y.; methodology, H.G. and J.W.; project administration, J.W.; supervision, Y.S. and J.W.; visualization, H.G. and Y.W.; writing—original draft, H.G.; writing—review and editing, H.G., Y.W., and H.Y.
Funding
This research was funded by the National Natural Science Foundation of China (No. 41671501) and the National Key Research and Development Program (No. 2016YFA0602402).
Acknowledgments
We gratefully acknowledge the support of the National Natural Science Foundation of China and the National Key Research and Development Program, and thank the investigators and interviewees who participated in the questionnaire survey. We also thank the experts from the Faculty of Geographical Science of Beijing Normal University, China Agricultural University, and the National Disaster Reduction Center of the Ministry of Civil Affairs for their comments on the weightings assigned to the indicators, and thank officials of the local government and those of the agriculture and statistics departments of Xinghe county for their cooperation and support.
Conflicts of Interest
The authors declare no conflict of interest.
Appendix A
Questionnaire to Assess Farmers’ Capacity to Cope with Drought
Town: _______ Village: _____ Date:__________ Recorder:________ No:______
Hello! Thank you for taking the time to fill out this questionnaire!
This is a research questionnaire on agriculture drought risk governance. The information you supply is particularly valuable for drought governance. Your choice should reflect your actual situation—there are no right or wrong answers. This survey is anonymous. The survey content is for research purposes only. We will keep the answers provided by you strictly confidential—please do not have any concerns on that note. Thank you very much for your cooperation!
1. Basic Information on Respondent
| Age | Ethnic group | Gender | Education |
|
|
2. Basic Information on Respondent’s Family
- #Family members____________, #Family members < 14 years old________, # Family members > 70 years old ________;#Family members engaged in agricultural production ________, #Family members going out to work ________.
- Cultivated area_______ Mu (1 Mu = 0.0667 hectares), concrete information on cultivation:
Parcel_ID Type of Crops Area Production Purchase Price 1 2 3 4 5 - Annual average pesticide cost: __________yuan;Annual average fertilizer cost: __________yuan;Annual average seeds cost: __________yuan;Annual average irrigation cost: __________yuan.
- # Cows_______, # Sheep_______, # Horses / Donkeys_______, # Pigs ______.
- Total family income: ____________yuan, Agricultural income: _________yuan, Income from wages: _________yuan, Government subsidy: _________yuan.
- Average annual loss due to drought: ___________yuan.
- Type of water supply (multiple choice):
- Tap water supply throughout the day
- Well owned by the farmer
- Tap water supply at fixed hours
- Public well
- Other types: ______
- Channel of information on prior warnings of drought (multiple choice):
- Short messaging service (SMS)
- Television
- Internet
- Newspaper
- Other types: ______
- Access to market (multiple choice):
- On-site buying by wholesalers
- Selling to retailers
- Selling by the farmer directly
- Signed contract with a company
- E. Not for sale
- Frequency of buying agricultural insurance:
- Rarely
- Occasionally
- Often
- Annually
Please Give Your Score According to the Actual Situation Degree of Initiative 1 2 3 4 5 Focus on planting technology Contributing to the maintenance of public water facilities Focus on weather information Attention to crop growth Seeking emergency water sources Combating secondary disasters associated with drought Focus on sales channels for farm produce Efforts to increase income Summarizing the experience and learning from it and sharing relevant information with others
References
- Field, C.B. Managing the Risks of Extreme Events and Disasters to Advance Climate Change Adaptation: Special Report of the Intergovernmental Panel on Climate Change; Cambridge University Press: Cambridge, UK, 2012. [Google Scholar]
- FAO. The Impact of Disasters and Crises on Agriculture and Food Security; FAO: Roma, Italy, 2018. [Google Scholar]
- Wilhite, D.A.; Sivakumar, M.V.K.; Pulwarty, R. Managing drought risk in a changing climate: The role of national drought policy. Weather. Clim. Extrem. 2014, 3, 4–13. [Google Scholar] [CrossRef]
- Pandey, S.; Bhandari, H.S.; Hardy, B. Economic Costs of Drought and Rice Farmers’ Coping Mechanisms: A Cross-Country Comparative Analysis; International Rice Research Institute: Los Baños, Philippines, 2007. [Google Scholar]
- Habiba, U.; Shaw, R.; Takeuchi, Y. Farmer’s perception and adaptation practices to cope with drought: Perspectives from Northwestern Bangladesh. Int. J. Disaster Risk Reduct. 2012, 1, 72–84. [Google Scholar] [CrossRef]
- Iglesias, A.; Moneo, M.; Quiroga, S. Methods for evaluating social vulnerability to drought. In Coping with Drought Risk in Agriculture and Water Supply Systems; Springer: Dordrecht, The Netherlands, 2009; pp. 153–159. [Google Scholar]
- O’farrell, P.; Anderson, P.; Milton, S.; Dean, W. Human response and adaptation to drought in the arid zone: Lessons from southern Africa. S. Afr. J. Sci. 2009, 105, 34–39. [Google Scholar]
- Vetter, S. Drought, change and resilience in South Africa’s arid and semi-arid rangelands. S. Afr. J. Sci. 2009, 105, 29–33. [Google Scholar]
- Keshavarz, M.; Karami, E.; Kamgare-Haghighi, A. A typology of farmers’ drought management. Am. Eurasian J. Agric. Environ. Sci. 2010, 7, 415–426. [Google Scholar]
- Keshavarz, M.; Karami, E.; Vanclay, F. The social experience of drought in rural Iran. Land Use Policy 2013, 30, 120–129. [Google Scholar] [CrossRef]
- Rathore, J.S. Drought and household coping strategies: A case of Rajasthan. Indian J. Agric. Econ. 2004, 59, 689. [Google Scholar]
- Campbell, D.; Barker, D.; McGregor, D. Dealing with drought: Small farmers and environmental hazards in southern St. Elizabeth, Jamaica. Appl. Geogr. 2011, 31, 146–158. [Google Scholar] [CrossRef]
- Enfors, E.I.; Gordon, L.J. Dealing with drought: The challenge of using water system technologies to break dryland poverty traps. Glob. Environ. Chang. 2008, 18, 607–616. [Google Scholar] [CrossRef]
- Bachmair, S.; Stahl, K.; Collins, K.; Hannaford, J.; Acreman, M.; Svoboda, M.; Knutson, C.; Smith, K.H.; Wall, N.; Fuchs, B. Drought indicators revisited: The need for a wider consideration of environment and society. Wiley Interdiscip. Rev. Water 2016, 3, 516–536. [Google Scholar] [CrossRef]
- Nazari, S.; Rad, G.P.; Sedighi, H.; Azadi, H. Vulnerability of wheat farmers: Toward a conceptual framework. Ecol. Indic. 2015, 52, 517–532. [Google Scholar] [CrossRef]
- Ghimire, Y.N.; Shivakoti, G.P.; Perret, S.R. Household-level vulnerability to drought in hill agriculture of Nepal: Implications for adaptation planning. Int. J. Sustain. Dev. World Ecol. 2010, 17, 225–230. [Google Scholar] [CrossRef]
- Keil, A.; Zeller, M.; Wida, A.; Sanim, B.; Birner, R. What determines farmers’ resilience towards ENSO-related drought? An empirical assessment in Central Sulawesi, Indonesia. Clim. Chang. 2008, 86, 291. [Google Scholar] [CrossRef]
- Quandt, A. Measuring livelihood resilience: The Household Livelihood Resilience Approach (HLRA). World Dev. 2018, 107, 253–263. [Google Scholar] [CrossRef]
- Ashraf, M.; Routray, J.K.; Saeed, M. Determinants of farmers’ choice of coping and adaptation measures to the drought hazard in northwest Balochistan, Pakistan. Nat. Hazards 2014, 73, 1451–1473. [Google Scholar] [CrossRef]
- Iglesias, E.; Báez, K.; Diaz-Ambrona, C.H. Assessing drought risk in Mediterranean Dehesa grazing lands. Agric. Syst. 2016, 149, 65–74. [Google Scholar] [CrossRef]
- Khayyati, M.; Aazami, M. Drought impact assessment on rural livelihood systems in Iran. Ecol. Indic. 2016, 69, 850–858. [Google Scholar] [CrossRef]
- Ndamani, F.; Watanabe, T. Determinants of farmers’ adaptation to climate change: A micro level analysis in Ghana. Sci. Agricol. 2016, 73, 201–208. [Google Scholar] [CrossRef]
- Yin, X.; Olesen, J.E.; Wang, M.; Kersebaum, K.-C.; Chen, H.; Baby, S.; Öztürk, I.; Chen, F. Adapting maize production to drought in the Northeast Farming Region of China. Eur. J. Agron. 2016, 77, 47–58. [Google Scholar] [CrossRef]
- Abdul-Razak, M.; Kruse, S. The adaptive capacity of smallholder farmers to climate change in the Northern Region of Ghana. Clim. Risk Manag. 2017, 17, 104–122. [Google Scholar] [CrossRef]
- Simane, B.; Zaitchik, B.F.; Foltz, J.D. Agroecosystem specific climate vulnerability analysis: Application of the livelihood vulnerability index to a tropical highland region. Mitig. Adapt. Strateg. Glob. Chang. 2016, 21, 39–65. [Google Scholar] [CrossRef] [PubMed]
- Meze-Hausken, E. Migration caused by climate change: How vulnerable are people inn dryland areas? Mitig. Adapt. Strateg. Glob. Chang. 2000, 5, 379–406. [Google Scholar] [CrossRef]
- Speranza, C.I.; Wiesmann, U.; Rist, S. An indicator framework for assessing livelihood resilience in the context of social–ecological dynamics. Glob. Environ. Chang. 2014, 28, 109–119. [Google Scholar] [CrossRef]
- Tesfahunegn, G.B.; Mekonen, K.; Tekle, A. Farmers’ perception on causes, indicators and determinants of climate change in northern Ethiopia: Implication for developing adaptation strategies. Appl. Geogr. 2016, 73, 1–12. [Google Scholar] [CrossRef]
- Alam, K. Farmers’ adaptation to water scarcity in drought-prone environments: A case study of Rajshahi District, Bangladesh. Agric. Water Manag. 2015, 148, 196–206. [Google Scholar] [CrossRef]
- Below, T.B.; Mutabazi, K.D.; Kirschke, D.; Franke, C.; Sieber, S.; Siebert, R.; Tscherning, K. Can farmers’ adaptation to climate change be explained by socio-economic household-level variables? Glob. Environ. Chang. 2012, 22, 223–235. [Google Scholar] [CrossRef]
- McLeman, R.; Mayo, D.; Strebeck, E.; Smit, B. Drought adaptation in rural eastern Oklahoma in the 1930s: Lessons for climate change adaptation research. Mitig. Adapt. Strateg. Glob. Chang. 2008, 13, 379–400. [Google Scholar] [CrossRef]
- Bhatasara, S. Understanding adaptation to climate variability in smallholder farming systems in eastern Zimbabwe: A sociological perspective. Rev. Agric. Food Environ. Stud. 2018, 99, 1–18. [Google Scholar] [CrossRef]
- Fuchs, S.; Karagiorgos, K.; Kitikidou, K.; Maris, F.; Paparrizos, S.; Thaler, T. Flood risk perception and adaptation capacity: A contribution to the socio-hydrology debate. Hydrol. Earth Syst. Sci. 2017, 21, 3183–3198. [Google Scholar] [CrossRef]
- Abugri, S.A.; Amikuzuno, J.; Daadi, E.B. Looking out for a better mitigation strategy: Smallholder farmers’ willingness to pay for drought-index crop insurance premium in the Northern Region of Ghana. Agric. Food Secur. 2017, 6, 71. [Google Scholar] [CrossRef]
- Wang, M.; Liao, C.; Yang, S.; Zhao, W.; Liu, M.; Shi, P. Are people willing to buy natural disaster insurance in China? Risk awareness, insurance acceptance, and willingness to pay. Risk Anal. Int. J. 2012, 32, 1717–1740. [Google Scholar] [CrossRef]
- Xu, D.; Peng, L.; Liu, S.; Wang, X. Influences of Risk Perception and Sense of Place on Landslide Disaster Preparedness in Southwestern China. Int. J. Disaster Risk Sci. 2018, 9, 167–180. [Google Scholar] [CrossRef]
- Ye, T.; Wang, M. Exploring risk attitude by a comparative experimental approach and its implication to disaster insurance practice in China. J. Risk Res. 2013, 16, 861–878. [Google Scholar] [CrossRef]
- Wu, Z.; Li, B.; Hou, Y. Adaptive choice of livelihood patterns in rural households in a farm-pastoral zone: A case study in Jungar, Inner Mongolia. Land Use Policy 2017, 62, 361–375. [Google Scholar] [CrossRef]
- Liu, G.; Wang, H.; Cheng, Y.; Zheng, B.; Lu, Z. The impact of rural out-migration on arable land use intensity: Evidence from mountain areas in Guangdong, China. Land Use Policy 2016, 59, 569–579. [Google Scholar] [CrossRef]
- Ye, J. Land Transfer and the Pursuit of Agricultural Modernization in China. J. Agrar. Chang. 2015, 15, 314–337. [Google Scholar] [CrossRef]
- Zhang, M.; Zhang, L.; Zhang, Y.; Xu, Y.; Chen, J. Pastureland transfer as a livelihood adaptation strategy for herdsmen: A case study of Xilingol, Inner Mongolia. Rangel. J. 2017, 39, 179–187. [Google Scholar] [CrossRef]
- Acosta-Michlik, L.; Espaldon, V. Assessing vulnerability of selected farming communities in the Philippines based on a behavioural model of agent’s adaptation to global environmental change. Glob. Environ. Chang. 2008, 18, 554–563. [Google Scholar] [CrossRef]
- Huffman, W.E. Human capital: Education and agriculture. Handb. Agric. Econ. 2001, 1, 333–381. [Google Scholar]
- Lei, Y.; Zhang, H.; Chen, F.; Zhang, L. How rural land use management facilitates drought risk adaptation in a changing climate—A case study in arid northern China. Sci. Total. Environ. 2016, 550, 192–199. [Google Scholar] [CrossRef]
- Liu, Y.; Fang, F.; Li, Y. Key issues of land use in China and implications for policy making. Land Use Policy 2014, 40, 6–12. [Google Scholar] [CrossRef]
- Yuan, L.-P. Hybrid rice achievements, development and prospect in China. J. Integr. Agric. 2015, 14, 197–205. [Google Scholar]
- Willock, J.; Deary, I.J.; McGregor, M.M.; Sutherland, A.; Edwards-Jones, G.; Morgan, O.; Dent, B.; Grieve, R.; Gibson, G.; Austin, E. Farmers’ attitudes, objectives, behaviors, and personality traits: The Edinburgh study of decision making on farms. J. Vocat. Behav. 1999, 54, 5–36. [Google Scholar] [CrossRef]
- Cavatassi, R.; Lipper, L.; Narloch, U. Modern variety adoption and risk management in drought prone areas: Insights from the sorghum farmers of eastern Ethiopia. Agric. Econ. 2011, 42, 279–292. [Google Scholar] [CrossRef]
- Wang, T.-C.; Lee, H.-D. Developing a fuzzy TOPSIS approach based on subjective weights and objective weights. Expert Syst. Appl. 2009, 36, 8980–8985. [Google Scholar] [CrossRef]
- Xu, X. A note on the subjective and objective integrated approach to determine attribute weights. Eur. J. Oper. Res. 2004, 156, 530–532. [Google Scholar] [CrossRef]
- Chuansheng, X.; Dapeng, D.; Shengping, H.; Xin, X.; Yingjie, C. Safety evaluation of smart grid based on AHP-entropy method. Syst. Eng. Procedia 2012, 4, 203–209. [Google Scholar] [CrossRef]
- Deng, H.; Yeh, C.-H.; Willis, R.J. Inter-company comparison using modified TOPSIS with objective weights. Comput. Oper. Res. 2000, 27, 963–973. [Google Scholar] [CrossRef]
- Shemshadi, A.; Shirazi, H.; Toreihi, M.; Tarokh, M.J. A fuzzy VIKOR method for supplier selection based on entropy measure for objective weighting. Expert Syst. Appl. 2011, 38, 12160–12167. [Google Scholar] [CrossRef]
- Sangpenchan, R. Vulnerability of Thai Rice Production to Simultaneous Climate and Socioeconomic Change: A Double Exposure Analysis. Ph.D. Thesis, The Pennsylvania State University, State College, PA, USA, 2011. [Google Scholar]
- Ehsan, E.; Tehrani, R.; Eslami Bidgoli, G. Determining risk coefficient in risk management: A case of tomato growers in Dezfool. Agric. Econ. 2009, 16, 17–21. [Google Scholar]
- Ferdusi, R.; Koohpai, M. Wheat farmers’ attitude toward risk: A case of Golestan Province. Agric. Econ. Dev. 2007, 5, 11–86. [Google Scholar]
- Zarafshani, K.; Sharafi, L.; Azadi, H.; Hosseininia, G.; De Maeyer, P.; Witlox, F. Drought vulnerability assessment: The case of wheat farmers in western Iran. Glob. Planet. Chang. 2012, 98, 122–130. [Google Scholar] [CrossRef]
- Zougmoré, R.; Partey, S.; Ouédraogo, M.; Omitoyin, B.; Thomas, T.; Ayantunde, A.; Ericksen, P.; Said, M.; Jalloh, A. Toward climate-smart agriculture in West Africa: A review of climate change impacts, adaptation strategies and policy developments for the livestock, fishery and crop production sectors. Agric. Food Secur. 2016, 5, 26. [Google Scholar] [CrossRef]
- Zougmoré, R.B.; Traoré, A.S.; Mbodj, Y. Overview of the Scientific, Political and Financial Landscape of Climate-Smart Agriculture in West Africa; Working Paper No. 118; CGIAR Research Program on Climate Change, Agriculture and Food Security: Copenhagen, Denmark, 2015. [Google Scholar]
- Kamuanga, M.J.; Somda, J.; Sanon, Y.; Kagoné, H. Livestock and regional market in the Sahel and West Africa: Potentials and Challenges; OECD: Paris, France, 2008. [Google Scholar]
- Mortimore, M.J.; Adams, W.M. Farmer adaptation, change and ‘crisis’ in the Sahel. Glob. Environ. Chang. 2001, 11, 49–57. [Google Scholar] [CrossRef]
- Ates, S.; Cicek, H.; Bell, L.; Norman, H.; Mayberry, D.; Kassam, S.; Hannaway, D.B.; Louhaichi, M. Sustainable Development of Smallholder Crop-Livestock Farming in Developing Countries; IOP Conference Series: Earth and Environmental Science, 2018; IOP Publishing: Bristol, UK, 2018; p. 012076. [Google Scholar]
- Peters, P.; Hoffmann, V. Promotion and adoption of silage technologies in drought-constrained areas of Honduras. Trop. Grassl. 2010, 44, 231–245. [Google Scholar]
- Neylon, J.; Kung, L., Jr. Effects of cutting height and maturity on the nutritive value of corn silage for lactating cows. J. Dairy Sci. 2003, 86, 2163–2169. [Google Scholar] [CrossRef]
- Celebi, S.Z.; Demir, S.; Celebi, R.; Durak, E.D.; Yilmaz, I.H. The effect of Arbuscular Mycorrhizal Fungi (AMF) applications on the silage maize (Zea mays L.) yield in different irrigation regimes. Eur. J. Soil Biol. 2010, 46, 302–305. [Google Scholar] [CrossRef]
- Colombini, S.; Rapetti, L.; Colombo, D.; Galassi, G.; Crovetto, G.M. Brown midrib forage sorghum silage for the dairy cow: Nutritive value and comparison with corn silage in the diet. Ital. J. Anim. Sci. 2010, 9, e53. [Google Scholar]
- Prior, T.; Eriksen, C. Wildfire preparedness, community cohesion and social–ecological systems. Glob. Environ. Chang. 2013, 23, 1575–1586. [Google Scholar] [CrossRef]
- Chang, K. Community cohesion after a natural disaster: Insights from a Carlisle flood. Disasters 2010, 34, 289–302. [Google Scholar] [CrossRef]
- Hikichi, H.; Aida, J.; Tsuboya, T.; Kondo, K.; Kawachi, I. Can community social cohesion prevent posttraumatic stress disorder in the aftermath of a disaster? A natural experiment from the 2011 Tohoku earthquake and tsunami. Am. J. Epidemiol. 2016, 183, 902–910. [Google Scholar] [CrossRef] [PubMed]
- Levy, D.; Itzhaky, H.; Zanbar, L.; Schwartz, C. Sense of cohesion among community activists engaging in volunteer activity. J. Community Psychol. 2012, 40, 735–746. [Google Scholar] [CrossRef]
- Gao, Y.; Xie, Y.; Jiang, H.; Wu, B.; Niu, J. Soil water status and root distribution across the rooting zone in maize with plastic film mulching. Field Crops Res. 2014, 156, 40–47. [Google Scholar] [CrossRef]
- Tao, Z.; Li, C.; Li, J.; Ding, Z.; Xu, J.; Sun, X.; Zhou, P.; Zhao, M. Tillage and straw mulching impacts on grain yield and water use efficiency of spring maize in Northern Huang–Huai–Hai Valley. Crop J. 2015, 3, 445–450. [Google Scholar] [CrossRef]
- Jafari, M.; Haghighi, J.A.P.; Zare, H. Mulching impact on plant growth and production of rainfed fig orchards under drought conditions. J. Food Agric. Environ. 2012, 10, 428–433. [Google Scholar]
- Xue, L.-L.; Wang, L.-C.; Anjum, S.A.; Saleem, M.F.; Bao, M.-C.; Saeed, A.; Bilal, M.F. Gas exchange and morpho-physiological response of soybean to straw mulching under drought conditions. Afr. J. Biotechnol. 2013, 12, 2360–2365. [Google Scholar]
- Hamdy, A.; Ragab, R.; Scarascia-Mugnozza, E. Coping with water scarcity: Water saving and increasing water productivity. Irrig. Drain. 2003, 52, 3–20. [Google Scholar] [CrossRef]
- Raffelli, G.; Previati, M.; Canone, D.; Gisolo, D.; Bevilacqua, I.; Capello, G.; Biddoccu, M.; Cavallo, E.; Deiana, R.; Cassiani, G. Local-and Plot-Scale Measurements of Soil Moisture: Time and Spatially Resolved Field Techniques in Plain, Hill and Mountain Sites. Water 2017, 9, 706. [Google Scholar] [CrossRef]
- Qiuming, K.; Yandong, Z.; Chenxiang, B. Automatic monitor and control system of water saving irrigation. Trans. Chin. Soc. Agric. Eng. 2007, 2007. [Google Scholar] [CrossRef]
- UNISDR. Sendai framework for disaster risk reduction 2015–2030. In 3rd United Nations World Conference on DRR, 2015; UNISDR: Sendai, Japan, 2015. [Google Scholar]
- Hu, X.; Shi, P.; Wang, M.; Ye, T.; Leeson, M. Consilience degree—A new network property to evaluate system’s performance against disturbances. Sci. Sin. Inf. 2014, 44, 1467–1481. [Google Scholar]
- Shi, P.; Wang, M.; Hu, X.; Ye, T. Integrated risk governance consilience mode of social-ecological systems. Acta Geogr. Sin. 2014, 69, 863–876. [Google Scholar]
© 2019 by the authors. Licensee MDPI, Basel, Switzerland. This article is an open access article distributed under the terms and conditions of the Creative Commons Attribution (CC BY) license (http://creativecommons.org/licenses/by/4.0/).