Article

Spatial–Temporal Analysis of Urban Land-Use Efficiency: An Analytical Framework in Terms of Economic Transition and Spatiality

1
School of Public Affairs, Zhejiang University, Hangzhou 310058, China
2
Land Academy for National Development, Zhejiang University, Hangzhou 310058, China
3
Laboratory of Rural-Urban Construction Land Economical and Intensive Use, Beijing 100812, China
*
Author to whom correspondence should be addressed.
Sustainability 2019, 11(7), 1839; https://doi.org/10.3390/su11071839
Submission received: 30 December 2018 / Revised: 20 March 2019 / Accepted: 25 March 2019 / Published: 27 March 2019
(This article belongs to the Section Sustainable Urban and Rural Development)

Abstract

:
Rapid urban expansion may cause a decline in land-use efficiency and result in a series of social and ecological problems. Economic transition has significantly influenced urban land development, and provides a good perspective for analyzing changes in land-use efficiency. This paper primarily discusses the theoretical influence of economic transition on urban land-use efficiency. Using 126 cities in the Yangtze River Economic Zone as examples, we explore the spatial–temporal characteristics of changes in land-use efficiency, and estimate the relationship between land-use efficiency and economic transition with econometric models. The results show that the land-use efficiency of the Yangtze River Economic Zone has generally been improved over time, and presented significant clustering effects around urban agglomerations. Panel data analysis suggests that foreign direct investment in the globalization process and tax burdens, which were further aggravated by the reform of the responsibility and revenue assignment between local and central government, have had a significant negative effect on land-use efficiency. On the contrary, marketization, urbanization, and fiscal expenditure decentralization have exerted significant positive effects. We also found that agglomeration effects and location advantages did play a positive role in improving land-use efficiency, which accounted for the spatial inequality. This paper concludes with policy proposals to improve the intensification and economization level of urban land use.

1. Introduction

Land-use/cover change (LUCC) is one of the important research fields of global change [1]. The transformation of agricultural or natural land into urban construction land has become a significant feature of land-use change in many urbanized areas [2], especially in developing countries [3]. As the urban population grows, more construction land is needed to satisfy the construction demands for residential and public facilities. However, rapid land expansion has caused a large amount of cultivated land to be converted into non-agricultural use [4]. Urban expansion has also been identified to exert many negative impacts on our social life and ecology, such as urban heat island effects, biodiversity declines, and air pollution [5,6,7]. The inefficient land-use pattern may not only cause a decoupling of construction land from the urban economy and population, but also result in a decline in land-use efficiency inside cities [8]. Thus, it is crucial to control urban expansion effectively and promote intensive land use.
Land-use efficiency (LUE) reflects the interaction between human economic activities and natural subsystems. To facilitate the sustainable development of cities, scholars from different countries have conducted extensive studies on controlling urban scale and optimizing land-use patterns. Since the 1990s, some scholars have successively put forward the concept of “compact development” [9] and “smart growth” [10] to guide sustainable urban growth and the associated land use. In the United States, the policy of urban growth boundaries (UGB) is initiated to control urban land expansion. Under a series of land-use regulations, urban growth needs to be within the development boundaries, which effectively promotes the intensive use of land within a city [11]. Likewise, the Chinese government has also implemented strict land-use regulations. Typical examples are the general land-use plan and the policy of “increasing versus decreasing [the] balance of urban–rural built land”. The former controls the total amount of construction land and provides macro guidance on land development patterns and the hierarchical management of construction land. The latter is mainly to establish a quota system for urban–rural land use and achieve a quantitative balance between urban and rural land [12]. All of the policies are aimed at achieving effective control over urban space and intensifying land use within a city.
China is known to be the third largest country and the largest developing country in the world. Land is scarce relative to its large population. Under such circumstances, how to promote an intensive use of urban land and improve land-use efficiency has been a hot topic in the recent years. Since the early 1990s, Chinese cities have experienced dramatic urbanization and urban sprawl [13,14]. Along with the urban and rural demographic shift, an increasing number of cities have expanded their urban scale rapidly [8,15]. The scale of urban construction land increased from 26.8 km2 in 2002 to 52.7 km2 in 2016, indicating a rise of 96%. With the deepening of market-oriented reforms and the strengthening of policy initiatives related to land use in recent years, urban land-use efficiency in China has been improved to some extent. However, it does not mean that the obstacles affecting the improvement of land-use efficiency can be ignored. The impact of globalization and decentralization has deeply affected the pattern of urban land use. Especially after the tax-sharing reform in the early 1990s, local governments tend to be more property-oriented [16]. A land-centered development model may result in unordered land expansion. As a result, urban land efficiency may decline [17].
Although a number of studies have focused on evaluating land-use efficiency and its driving factors [18,19,20], more efforts are still needed. First, the existing studies have overlooked the relationship between economic transition and land-use efficiency (LUE), which causes difficulties in revealing the effects of macro forces and the underlying implications of LUE change. Second, although scholars have selected some key factors to analyze the driving forces of LUE, they failed to provide a systematic explanation for the driving mechanism of LUE. This results in a lack of theoretical support for analyzing the driving forces. The existing analysis on LUE only focuses on explanations from the selected quantitative variables. It cannot systematically and structurally illuminate the endogenous logic of the differences in LUE.
The primary goal of this paper is to establish an analytical framework for the analysis of LUE, and examine the LUE in response to economic transition, with the case of the Yangtze River Economic Zone (YREZ). We specifically attempted to: (1) reveal the relationship between LUE change and economic transition; and (2) provide policy initiatives to further improve the intensification and economization level of urban land use.

2. An Analytical Framework

Classical location theory emphasizes the importance of traffic conditions for location selection and land use. Some scholars have identified the influence of location conditions on urban development and land use [21,22]. Superior location and traffic conditions may facilitate the agglomeration of economic activities, which produce a series of positive externalities to improve land-use efficiency. Economic transition has released great vitality for socioeconomic activities, which further imposed a profound impact on land-use efficiency. The economic transition process involves an integration of different economies, an improvement of market mechanisms, and reconstruction of the administrative power system. Scholars refer to these processes as the globalization, marketization, and decentralization processes, and conceptualize them as the process of economic transition [23]. As Stiglitz noted, urbanization in China and high-tech advancement in the United States would become the two main factors affecting human society [24]. Urbanization may also have been viewed as a component part of the process of economic transition. As critical forces of economic transition, the globalization, marketization, decentralization, and urbanization processes have significantly influenced land development and land-use efficiency [25,26,27].

2.1. Economic Transition and Land-Use Efficiency

Land-use change has always been consistent with regional economic integration [28]. The globalization process involves political and economic interdependence among different countries, information sharing, the global flow of finance and capital, etc. Generally speaking, globalization has promoted an internationalization of the flow of production factors. The intervention and recombination of external resources have profoundly affected regional economic activities and land-use patterns, which further led to differences in LUE. The globalization process can be harnessed to enhance the LUE through flows of production factors such as labor, technics, and capitals. Trade liberalization also strengthens the regional economic specialization as well as market competition, which encourages land users to pay more attention to land-use efficiency. Neoclassical economics suggests that capital could substitute for land, and the theory of land rent seeking also indicates an alternative relationship between land and other factors, such as technic and knowledge [29]. Market competition in international trade will urge enterprises to seek ways to gain competitive advantages, such as intensified land use. However, globalization may become a critical thrust for the rapid expansion of construction land. A case in point is the rapid emergence of economic development zones. The excessive land expansion may not only result in "development zone fever", but also cause land waste and decline in LUE.
Globalization promotes openness and liberalization, which also helps promote the level of marketization. The market mechanism highlights the importance of land as an asset, and facilitates land marketization [30]. With the emergence of the economic value of land, policies of payment for land use and strategies of intensive land use have developed gradually [31]. Trade liberalization has also strengthened the specialization of the regional economy as well as market competition, which promotes land users to intensify land use. Given the cost of land use, enterprises tend to adopt intensive land-use strategies to reduce production costs. The inductive effect of cost advantage and the enhancement of labor productivity promote the level of an intensive land use. Correspondingly, efficiency and benefits from land use will increase. What’s more, the rise of high-tech and high value-added industries is beneficial for the improvement of LUE in that they have greater potential to produce more benefits with less construction land. Therefore, the advance of marketization helps enhance the LUE.
Decentralization includes the decentralization of power and interests. The assignment of administrative power may exert a significant effect on the power of decentralization. As city managers, local governments have an independent decision-making power in the allocation of land [32]. Land-use efficiency may be influenced by government intervention [33]. To attract capital and ease tax burdens, local governments may be land-centered, or even adopt below-cost land supply policies to attract enterprises [34]. The excessive reliance on land finance increases the risk of a decline in LUE. Fiscal decentralization sets the distribution pattern of revenue among governments. The imbalance between revenue assignment and expenditure responsibility may increase tax burdens on local governments, and lead them to adopt negative urban management strategies. For example, due to insufficient funds, local governments lack the ability to redevelop inefficient construction land, and it is difficult to improve land-use efficiency.
Urbanization has stimulated rapid economic growth and significantly influenced land use. However, the phenomenon where the urbanization of land is faster than demographic urbanization is very common [35]. The investment in construction land did not produce the expected economic benefits, which restrained the improvement of LUE. Fortunately, with the prevalence of the “New Urbanism” movement and smart growth of cities, the developing pattern of urbanization has gradually shifted from land-centered to people-centered, and the improvement in land-use efficiency has also been advocated widely [36,37]. In addition, the development of industry in the process of urbanization also influenced LUE significantly. Under the market mechanism, land use is subject to free competition and market pricing, and land-use efficiency is generally high. The inefficient industries may be gradually marginalized. Correspondingly, the industrial structure as well as land-use structure can be optimized, and land-use efficiency may also be improved.
Besides the above driving forces, agglomeration and location also have a significant influence on LUE. Agglomeration and location are important characteristics of spatiality [38]. The marketization process and global competition have strengthened the location advantages and accelerated the agglomeration of industries toward coastal cities [39]. The geographical concentration of talents and industries may effectively promote economic growth and facilitate intensive land use. Spatial agglomeration boosts the diversity and specialization in the production process, and further induces economies of scale [40]. The agglomeration of economic activities will lead to the centralization of land use. Instead of expanding outwards rapidly, the type and structure of land use inside clusters tend to be more diverse and functional. Additionally, the sharing of infrastructure, such as roads and factory buildings, also contributes to land saving.

2.2. Construction of the Conceptual Framework

Based on the analysis above, the conceptual framework for analyzing the driving forces of land-use efficiency was constructed (Figure 1). Integrating the analysis of LUE with economic transition may provide a new perspective for us to understand the underlying implication of LUE change. To further develop the analytical framework, we introduce another two factors that indicated the spatiality—agglomeration and location—to further explain the inequality of LUE in the YREZ.
As an external social and economic process, economic transition puts pressures on the land-use system, and significantly influences land-use patterns. Specifically, the inflow of foreign capital in the globalization process will affect the land-use structure, and the development of foreign capital may induce more demand for land, which further influences the LUE change. Besides, the market mechanism highlights the economic value of land, and strengthens the corresponding benefits, efficiency, and liberalization. Under the effect of price mechanism, land as a production factor is subject to cost constraints. The paid use of land and free pricing under the market mechanism can promote an intensive use of land, which helps improve LUE. In the context of decentralization, government intervention exerts a profound influence on LUE. The imbalance between revenue assignment and expenditure responsibility may not be conducive to the improvement of LUE. In the processes of decentralization and urbanization, land-use planning or land-use policies may facilitate urban development. For example, to ease tax burden, the local governments usually tend to be land-centered, and invest more land to accumulate revenue. Conversely, in order to further improve the quality of urban development and promote sustainable urbanization, local officials may prefer to adopt targeted planning and policies to enhance the local LUE, and focus more on compact development instead of rapid urban sprawl. As feedback, the LUE may reflect the intensification and economization level of land use in the transitional process, and thus provide better services for policy and management initiatives.
Spatiality also influences the LUE. The cumulative causation model suggests that production factors, such as labor and capital, tend to flow into specific areas where more incentive policies, more chances, and better returns are available [41]. To some extent, the agglomeration of talents and industries can produce positive externalities and optimize land-use patterns. The complementarity of industrial functions and spatial proximity of economic activities may form an efficient supply chain, which facilitates land saving and helps improve LUE.

3. Research Setting and Methods

3.1. Study Area and Data

Straddling the three major regions of eastern, central, and western China, the YREZ is comprised of two municipalities and nine provinces (Figure 2), and primarily contains three urban agglomerations (the Yangtze River Delta Urban Agglomerations, the Triangle of Central China, and the Chengdu-Chongqing City Group). This paper focuses on 126 prefectural and above-level cities in the YREZ. In 2015, the population of the YREZ accounted for 42.9% of the national population. As a significant economic development zone, the YREZ produced 42.2% of the national gross domestic product (GDP) in 2015. The area of construction land was 122,500 square kilometers, accounting for 5.97% of the total land area in the YREZ. The conflicts between the demand and supply of construction land may be further aggravated due to the need for the sustained growth of the economy and population.
Known as the “golden belt” of Chinese economy, the YREZ is an important foundation for the regional coordinated development. Also, the YREZ serves as a critical ecological security shelter zone in China [42]. An uncontrolled expansion of construction land will inevitably cause irreversible damage to the farmland as well as ecosystem. Thus, in the context of rapid urbanization and land expansion, it is essential to promote land-use efficiency and coordinate the relationship between economic growth and urban expansion.
In this study, the socioeconomic data of prefecture-level cities were derived from the statistical yearbooks for the corresponding provinces and the China City Statistical Yearbook from 2001 to 2016 [43]. The economic data were revised by the fixed price consumer index in 2000. Construction land data were collected from the national land updated survey database from 2002 to 2015. Here, we focus on the territory of cities and towns, as well as transportation space. It should be noted that the statistical measures of land-use classification were changed in 2009. Therefore, the land-use data is divided into two periods: 2002–2008 and 2009–2015.

3.2. Methods

3.2.1. Kernel Density Estimation (KDE)

Kernel density estimation (KDE), which can both smooth data and preserve the overall structure, is one of the nonparametric estimation methods in statistical analysis. Compared with econometric approaches, nonparametric methods are much more flexible and adaptive in modeling [44]. By estimating the probability density of variables, KDE can capture the distribution and dynamic evolution of economic variables. The principles of KDE can be found in the relative literature [45,46]. Using the value of LUE, we adopt KDE in this study to estimate changes in the distributions of LUE.

3.2.2. Exploratory Spatial Data Analysis

The exploratory spatial data analysis (ESDA) is applied to identify the spatial pattern and heterogeneity of LUE in this paper. ESDA mainly includes global statistics (such as the global Moran’s I, Getis–Ord index, etc.), as well as local statistics (such as the local Moran’s I, Getis–Ord Gi* index, etc.). Here, we adopt the global Moran’s I and Getis–Ord Gi* to analyze the spatial effects of LUE.
I = i = 1 N j = 1 N W i j ( X i X ¯ ) ( X j X ¯ ) ( i j W i j ) i ( X i X ¯ ) 2
where I denotes global Moran’s I statistics of LUE; N represents the number of study zones; and X i and X j are the LUEs in zones i and j, respectively. X ¯ is the mean value of LUE. W i j is the spatial weight matrix, denoting the spatial positional relationship between areas i and j. Furthermore, we use the Z-score to test Moran’s I statistics.
Z ( I ) = I E ( I ) V a r ( I )
Getis–Ord Gi* examines the spatial distribution and heterogeneity of LUE in local areas.
G i = i = 1 N j = 1 N W i j X j j = 1 n X j
Z ( G i ) = G i E ( G i ) V a r ( G i )
where Z ( G i ) represents the normalized value of G i . Z ( G i ) is positive and significant, indicating the spatial clustering of high value, i.e., hot spots; conversely, Z ( G i ) is negative and significant, indicating the spatial clustering of low value, i.e., cold spots. Other variables are similar to Equation (1).

3.2.3. Panel Data Regression Analysis

Here, we adopted panel data regression analysis to explore the driving mechanism of LUE under the framework of economic transition. In comparison with the only cross-sectional or time-series regression analysis, panel data analysis can, on the one hand, control individual heterogeneity and solve multicollinearity; on the other hand, it can also improve estimation accuracy with a larger sample size. The empirical model can be defined as:
Y i t = β 0 + β j X i t + μ i + θ t + ε i t
where i is the prefecture-level city, j is the number of independent variables, and t is the year. X i t , β i , μ i , θ t , and ε i t refer to a set of explanatory variables, the coefficient of explanatory variables, the individual effect, the time effect and the error, respectively.
The panel data model generally includes the mixed regression model, the fixed-effect model, and the random-effect model [47]. The F test can help us make a choice between the mixed regression model and the fixed-effect model. Then, the Hausman test can be used to decide whether the individual effects are random or fixed [48]. What’s more, since we use macro-level data, it is necessary to consider the endogenous problem that may be caused by omitted variable bias or reverse causality. Serious endogenous problems may lead to least squares (LS) bias and non-consistency [49]. To avoid estimation bias, we adopt the two-stage least squares method (TSLS) to re-estimate the above model with appropriate instrument variables.
We also set up the following dynamic panel data model to verify whether the relationship between LUE and the explanatory variables changes.
Y i t = m = 1 q α m Y i t m + β j X i t + θ t + ε i t
where Y i t m is the lag term of the dependent variable, and q is the maximum lag order. Other variables are similar to those in Equation (5).
We adopted the system generalized method of moments (GMM) estimation method to create the dynamic panel data model. The system GMM estimator may significantly improve the estimation efficiency [50,51], and effectively deal with the endogeneity and heteroscedasticity that may exist in the model. The system GMM estimator includes both a differential equation and a horizontal equation. What’s more, it uses the lagged levels of exogenous variables as instruments in the difference GMM estimation, and the lagged differences of exogenous variables as instruments for the regression in levels [52]. This avoids the problem of weak instrument variables.

3.2.4. Variables

As mentioned above, we regard the LUE, which is defined as the ratio between the non-agricultural output value and the area of cities, towns, and transportation space, as the independent variable. Based on the multi-mechanism, we select a set of explanatory variables to explore the driving forces of LUE under the framework of economic transition (Table 1).
Globalization: As a powerful driving force, globalization plays an important role in “land grab” [53]. Foreign direct investment (FDI) reflects the openness of a region. We use the proportion of FDI in gross domestic product (GDP) to represent the economic globalization level. As for marketization, due to data limitations, we cannot calculate the level of land marketization directly. Therefore, we use economic marketization to reflect the marketization level of a city. Labor efficiency, which is defined as the ratio of urban labor productivity to the average wages of staff and workers, is used to represent an approximate level of marketization. Besides, we use fiscal expenditure decentralization to measure the degree of fiscal decentralization. Based on the empirical approach to calculating fiscal expenditure decentralization in previous studies [54], the equation is as follows:
F E D E C = F E U / ( F E U + F E P + F E C )
where F E U ,   F E P ,   and   F E C refer to the per capita fiscal expenditure of prefecture-level cities, provinces, and the central government, respectively.
In addition, we introduce the tax burdens of local governments, which are calculated by the ratio of fiscal revenue to GDP, to measure the macro tax-burden level in fiscal decentralization. The industrialization level, which is measured by the ratio of the added value of secondary and tertiary industries, and the demographic urbanization are adopted to characterize the urbanization level. Employment density, which is defined as the number of non-agricultural employees per unit of construction land, reflects the industrial agglomeration level of a city. Location entropy is used to calculate the agglomeration levels of talents. The equation is as follows:
T L E i t = ( T P i t / N A E i t ) / ( T T P t / T N A E t )
where T L E i t is the location entropy, and T P i t   and   N A E i t respectively refer to the number of technical employees and urban non-agricultural employees in i city. Meanwhile, T T P t   and   T N A E t refer to the number of technical employees and urban non-agricultural employees in the whole study area, respectively.
Location: In the process of economic development, the relative location of a region is constantly changing. Since the natural location cannot reflect this dynamic, we use the economic location to represent location conditions. We use per-capita GDP to characterize the economic location of different areas. Population density is also introduced as a control variable.

4. Results

4.1. Distributional Dynamics of Land-Use Efficiency

Figure 3 shows the kernel density estimation results of LUE in the selected years. The horizontal axis represents the level of LUE, and the vertical axis represents the kernel density. Overall, the kernel density plots show a skewed distribution of LUE in the YREZ, and the shape of distribution has changed dramatically over time. Compared with 2002, the average level of LUE in subsequent years has been rising. Also, the degree of multi-polarization was alleviated, while the regional gap among different cities has been widening gradually. Specifically, the kernel density curve shows double peaks in 2002, and the density of the main peak is much higher than that of the second peak, indicating that the LUE has a significant multipolar differentiation. In subsequent years, the center of the kernel density curve continues to move to the right, and the kernel density of the main peaks decreases significantly, suggesting that the overall level of LUE increases and the degree of polarization weakens gradually. In addition, the kernel density curve is smoother in 2015 and characterized by a “long tail”, indicating a weaker polarization, but a greater regional disparity.
The spatial distribution of LUE in the YREZ is characterized by significant regional disparities and spatial agglomeration at the prefecture-level cities from 2002 to 2015 (Figure 4). From the perspective of geography, two main features are worth noticing. First, high values of LUE are chiefly concentrated in the Yangtze River Delta, and the LUE in Shanghai is the highest. Meanwhile, the LUE of certain cities in the upper reaches of the Yangtze River is generally lower than that of the central and eastern cities. Second, the high value of LUE is mainly located in provincial capital cities, presenting a significant agglomeration effect. Also, the agglomeration characteristic becomes increasingly obvious over time. Three clusters are formed gradually.
Macro forces, globalization, marketization, decentralization, and urbanization will in essence influence economic development and land use. To quantify the coupling relationship between economic growth and land development in the transitional era, we introduced the concept of resilience, which is defined as the ratio between the construction land expansion rate and the economic growth rate. In the meantime, we divide the study area into three major regions for comparison, i.e., the Yangtze River Delta (YRD), the Triangle of Central China (TCC), and the upper reaches of the Yangtze River (UYR), respectively.
Figure 5 shows the trends of construction land expansion, economic growth, and resilience in different regions. During the period of 2002–2008, the YRD witnessed a relatively faster expansion of construction land, but the economic growth rate was slightly lower than that of other areas. As a result, the YRD has a higher coefficient of resilience, showing that economic growth in the YRD had a greater dependence on construction land expansion in the early stage, and its LUE has greater potential for improvement. Partly due to the financial crisis in 2008, the economic growth rate of the whole region between 2009–2015 slowed down. The rate of construction land expansion in the YRD decreased during this period, while the rate in the other two regions appeared to increase. In terms of resilience, the level of an intensive use of land in the YRD has been improved. However, the TCC and the UYR need to further control the scale of construction land.
In order to further capture the influence of key factors of economic transition on the LUE, Figure 6 shows a detailed relationship between LUE and some key factors in 2015. It is clear that tax burdens and the proportion of FDI to GDP are negatively correlated with LUE on the whole. In the meantime, labor efficiency, urbanization, and the agglomeration of industry and talents exert positive effects on the improvement of LUE during economic transition. In essence, the relationship between these key variables and LUE reveals the mechanism of the spatial–temporal differentiation of LUE. In comparison with other areas, eastern cities have superior location conditions. They are often the forerunners of policy and economic development. Pilot-oriented policies such as coastal open cities are also taking the lead from the eastern cities. What’s more, the Yangtze River Delta urban agglomerations in the east provide an important platform for China to participate in international competition. According to the “Yangtze River Delta Urban Agglomerations Development Plan” approved by the State Council, the Yangtze River Delta Urban Agglomerations should be built into a world-class urban agglomeration that gears to the world and leads the whole country. In addition, frequent trades and technical exchanges provide them with more important positions in the international development framework. Coupled with a higher level of marketization, stronger capacity of agglomeration, and faster urbanization, these areas have greater economic development potential and land-use efficiency. They have abilities as well as incentives to promote an intensive use of land. However, there is no doubt that the influx of FDI and the increasing tax burdens due to rapid infrastructure construction further raise the possibility of land expansion and the risk of LUE reduction.

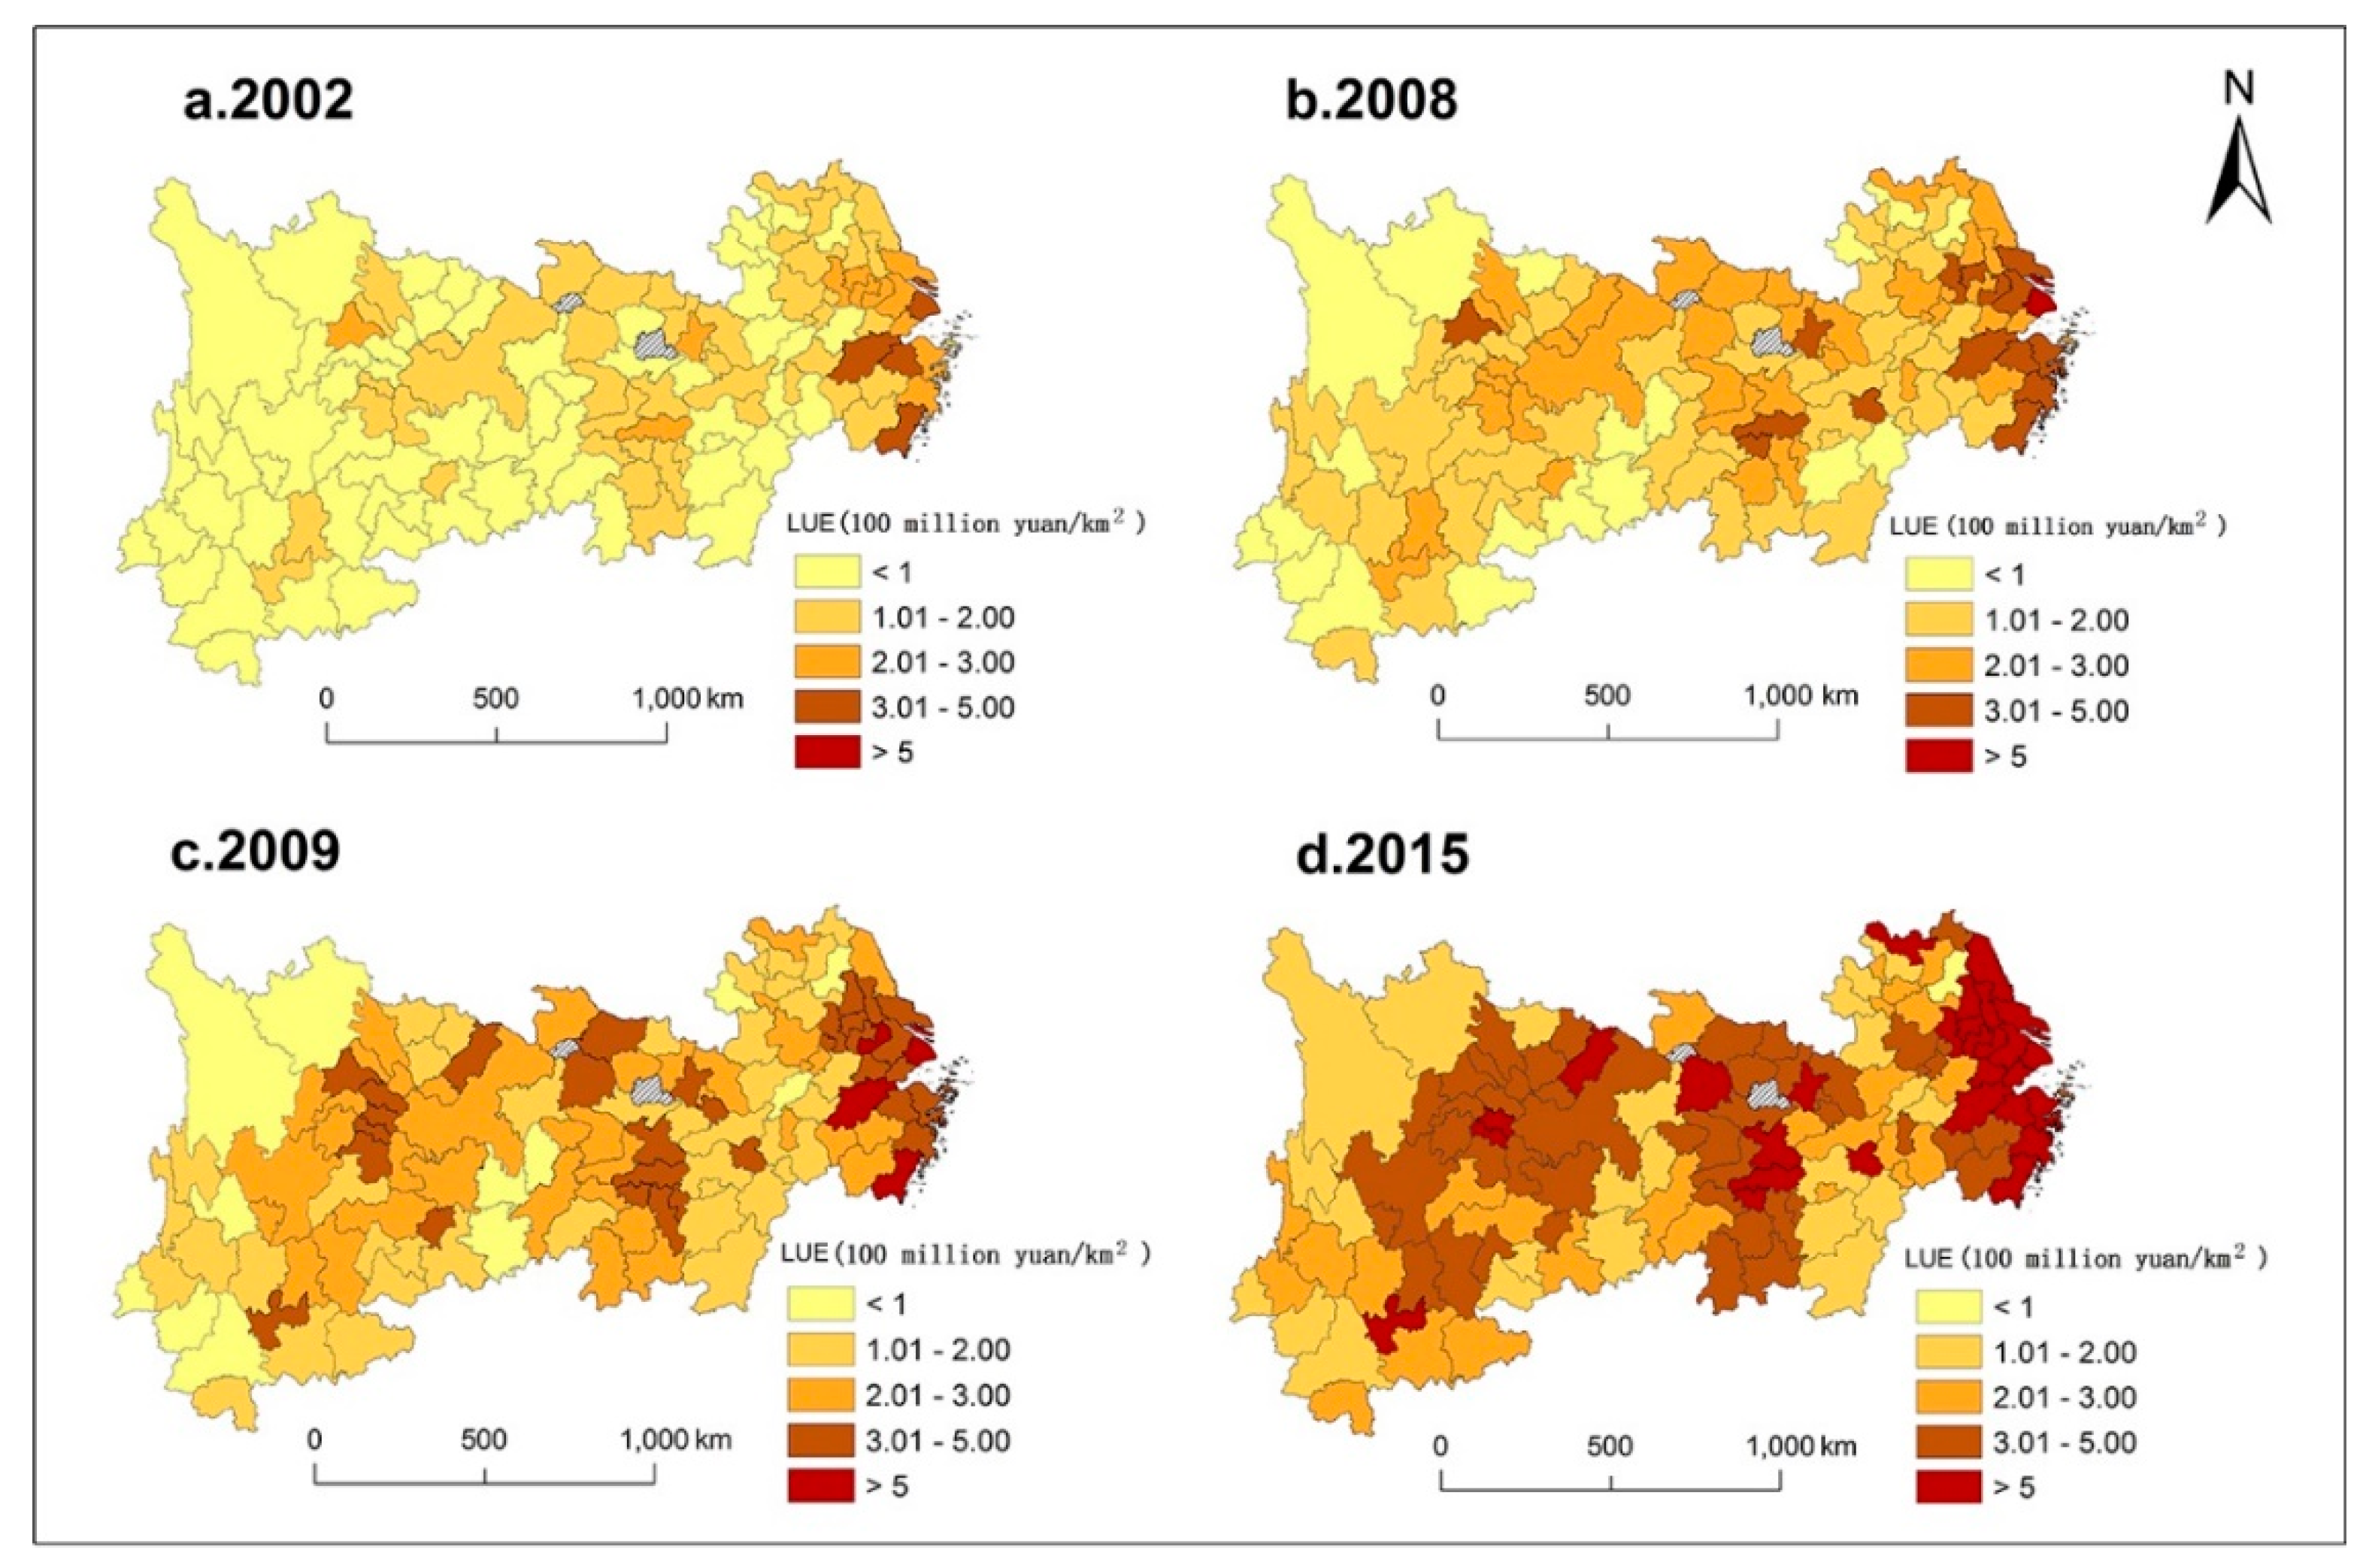
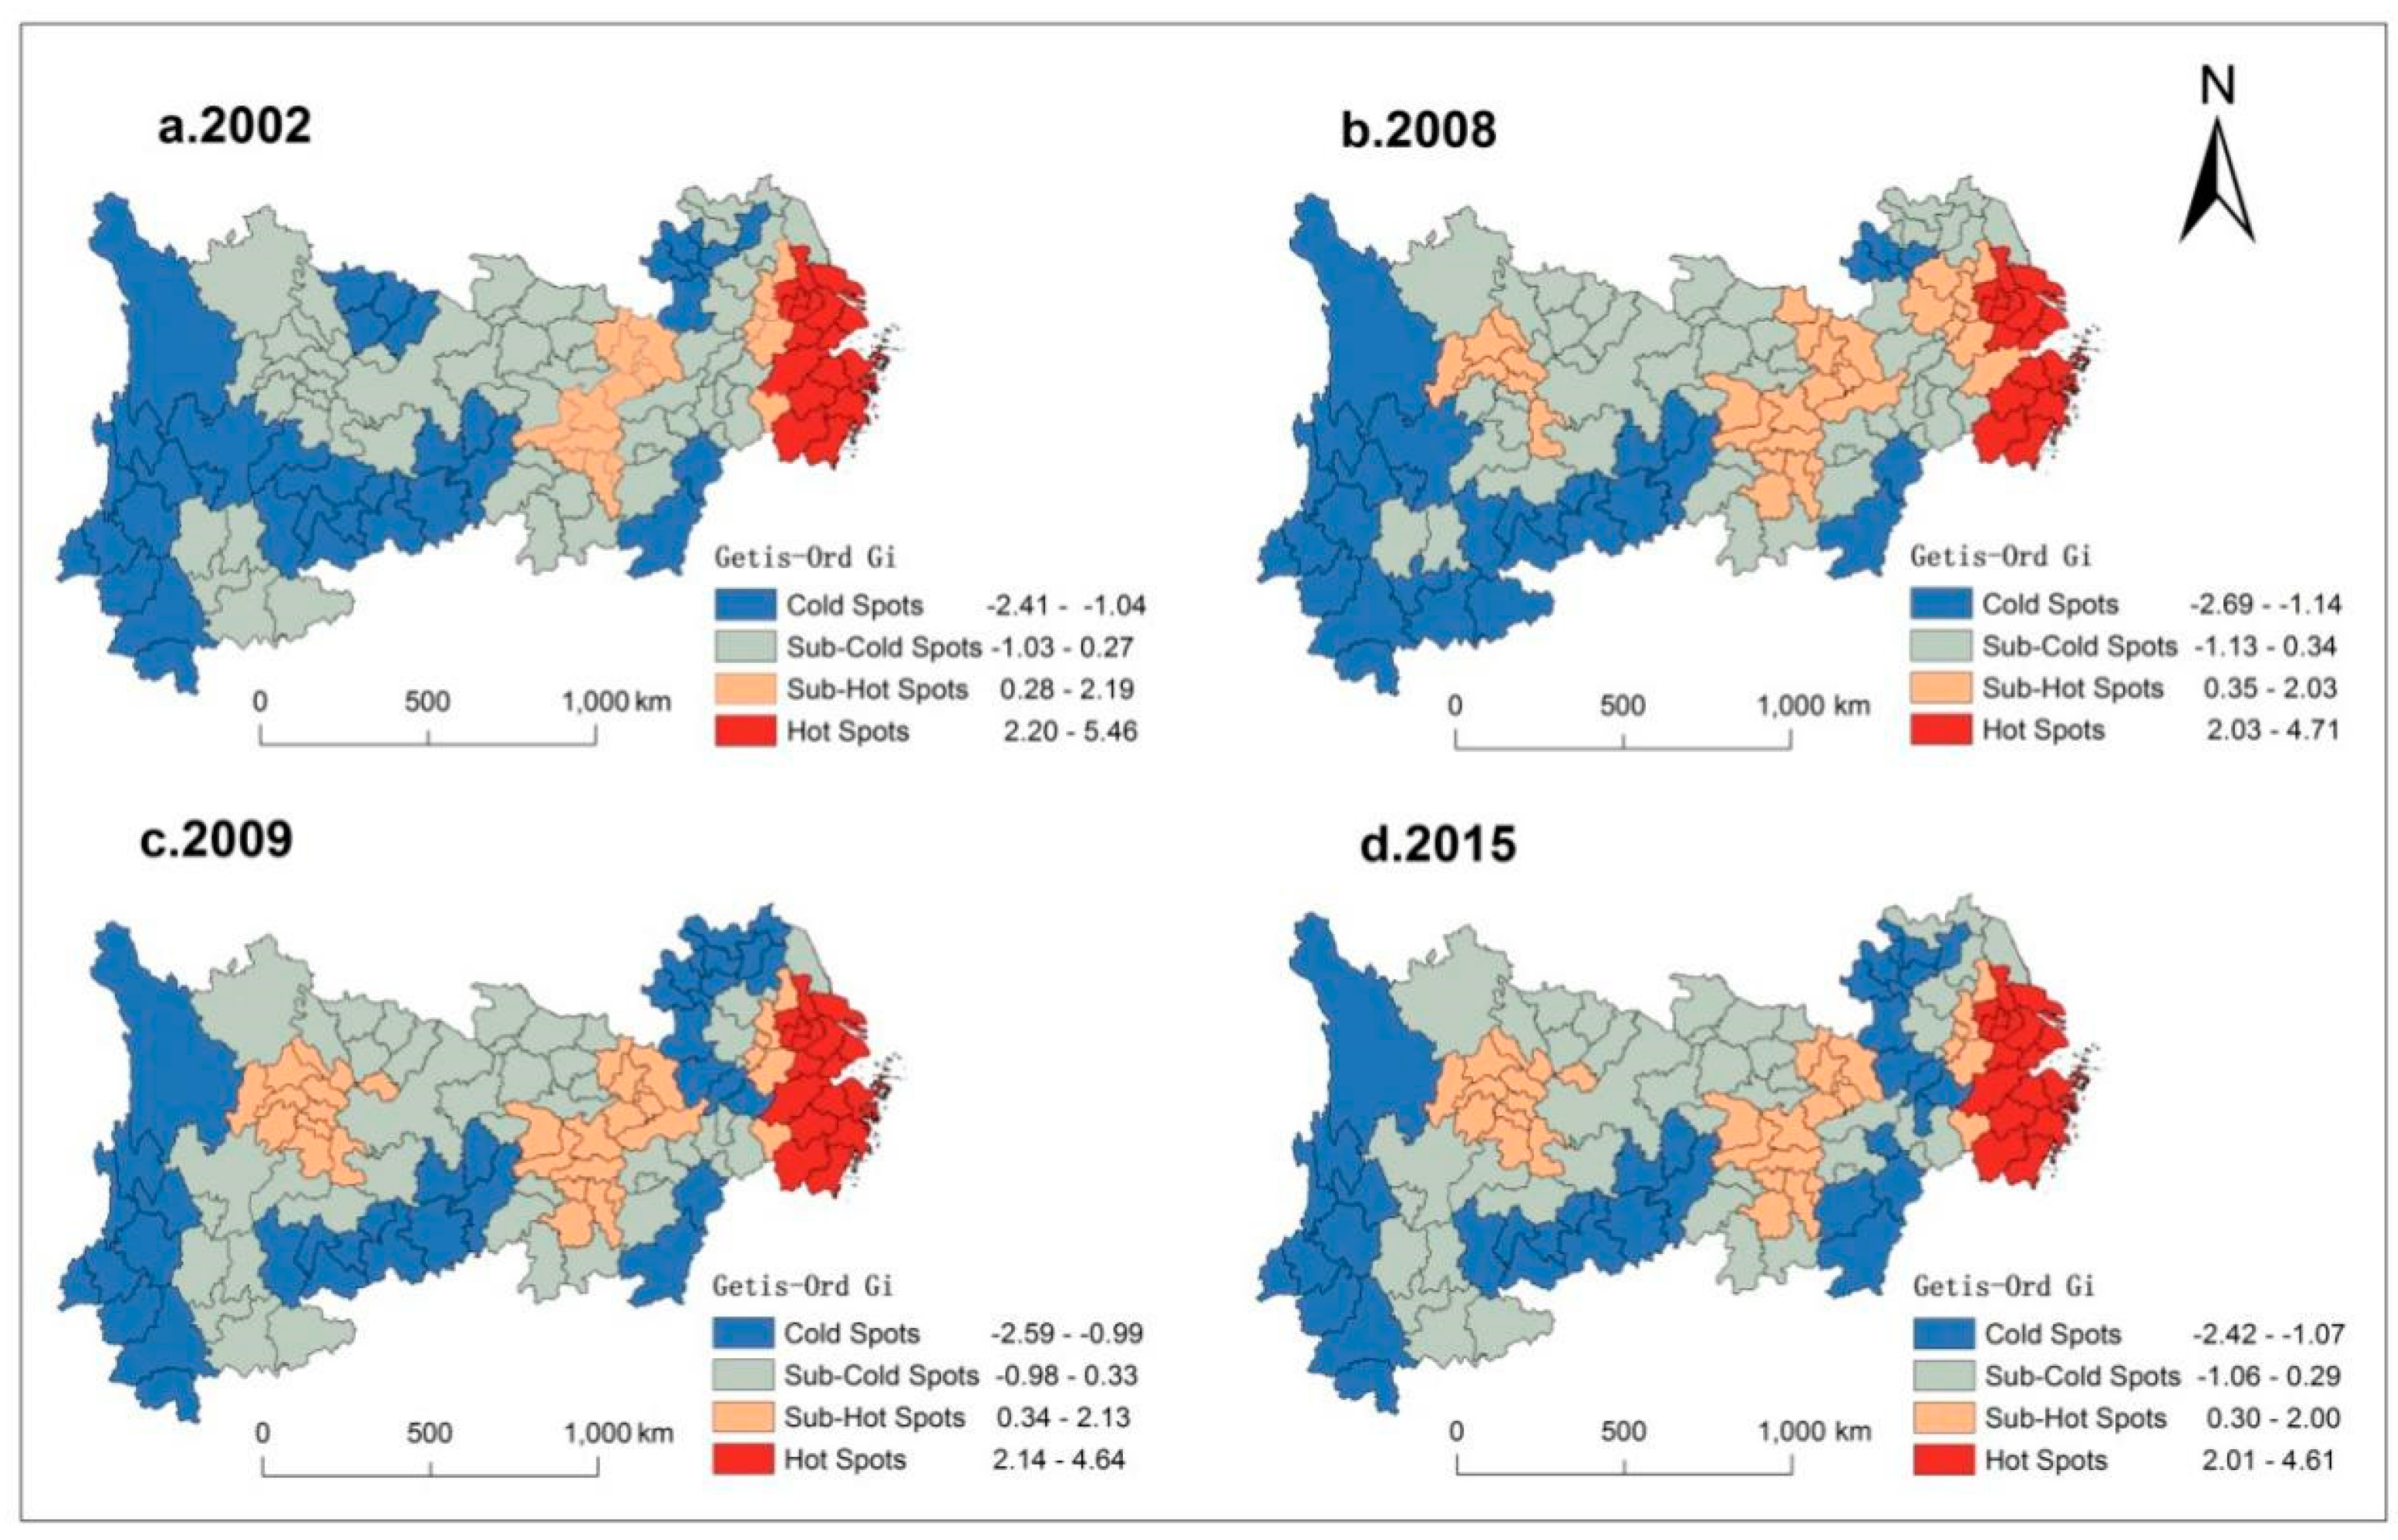
4.2. Spatial Heterogeneity of Land-Use Efficiency

According to Equations (1) and (2), we compute the global Moran’s I in ArcGIS 10.2 to explore the overall tendency of geographical concentration of LUE. Figure 7 shows the results of the global Moran’s I in the YREZ and three major regions from 2002 to 2015. All of the values of the global Moran’s I statistics are greater than 0.3 in the YREZ, and are significant at a 1% level. However, the statistics decreased from 0.561 in 2002 to 0.406 in 2015. This result indicates that there is significant spatial autocorrelation in the spatial distribution of LUE, and the levels of LUE in the adjacent areas show convergence. The heterogeneity characteristic of LUE largely reveals the spatial dependence and agglomeration. In addition, the agglomeration effect of LUE in the YREZ is gradually weakening as time advances.
From the perspective of urban agglomeration, the global Moran’s I statistics of the three major urban agglomerations are lower than that of the whole region. This result denotes that the spatial agglomeration effect of LUE at urban agglomerations is relatively poor. The evolving statistical values of LUE in the YRD are similar to that of the YREZ, presenting a downward trend. Conversely, the overall statistics of the TCC and the UYR keep rising. In comparison with the UYR, the spatial agglomeration characteristics of the YRD and the TCC are more significant before 2008, and the agglomeration effect of the YRD is the most significant. However, this pattern was changed after 2008. Especially after 2011, the agglomeration characteristic of the UYR was significantly enhanced.
To further capture the spatial distribution characteristics of high-value clusters and low-value clusters of LUE, we compute the Getis–Ord Gi* index in ArcGIS 10.2. Based on the Natural Breaks (Jenks), we divide the Z ( G i ) into four categories, i.e., hot spots, sub-hot spots, cold spots, and sub-cold spots (Figure 8). Overall, the spatial pattern of hot spots and cold spots remains stable. Hot spots and cold spots present point–axis interlaced distribution, and the regional disparity is significant. The number of cities in sub-cold spots decreased from 55 in 2002 to 42 in 2015, while the number of cities in sub-hot spots increased from 18 in 2002 to 32 in 2015, indicating a rise of 77.8%. Although there are some changes in the spatial pattern of hot spots and cold spots, the number of corresponding cities has little change. The local spatial distribution characteristics of LUE are mainly reflected in two aspects. First, LUE in coastal cities or cities along the river is higher than that of inland areas. Second, the average level in the east is higher than that in the west. In the process of economic reform and transition, coastal cities or cities along the river can better exert their comparative advantages in location and transportation, and attract external investment. Therefore, these regions have greater potential to become hot spots for LUE changes.
The agglomeration effect of LUE reflects the convergence or divergence in the relationship between construction land expansion and economic growth within urban agglomerations. Due to a higher level of marketization and urbanization, cities in the YRD have greater abilities to realize a higher efficiency and more land-use benefits. Correspondingly, LUE has a significant agglomeration effect. Besides, driven by the pilot reform of “resource-saving and environment-friendly society”, and coupled with the linkage advantage of the Poyang Lake City Group, the TCC has achieved rapid development [55]. As a result, the quality of economic advance as well as the efficiency and benefits of land use have been improved. However, cities in the UYR developed slowly in the early stage, and the economic and industrial advancement has not produced agglomeration effects. The transformation of the agglomeration effect in the UYR reflects that the decoupling relationship between economic growth and land expansion improved gradually in subsequent years, while the YRD needs to further facilitate industrial transformation to improve the regional agglomeration effects.

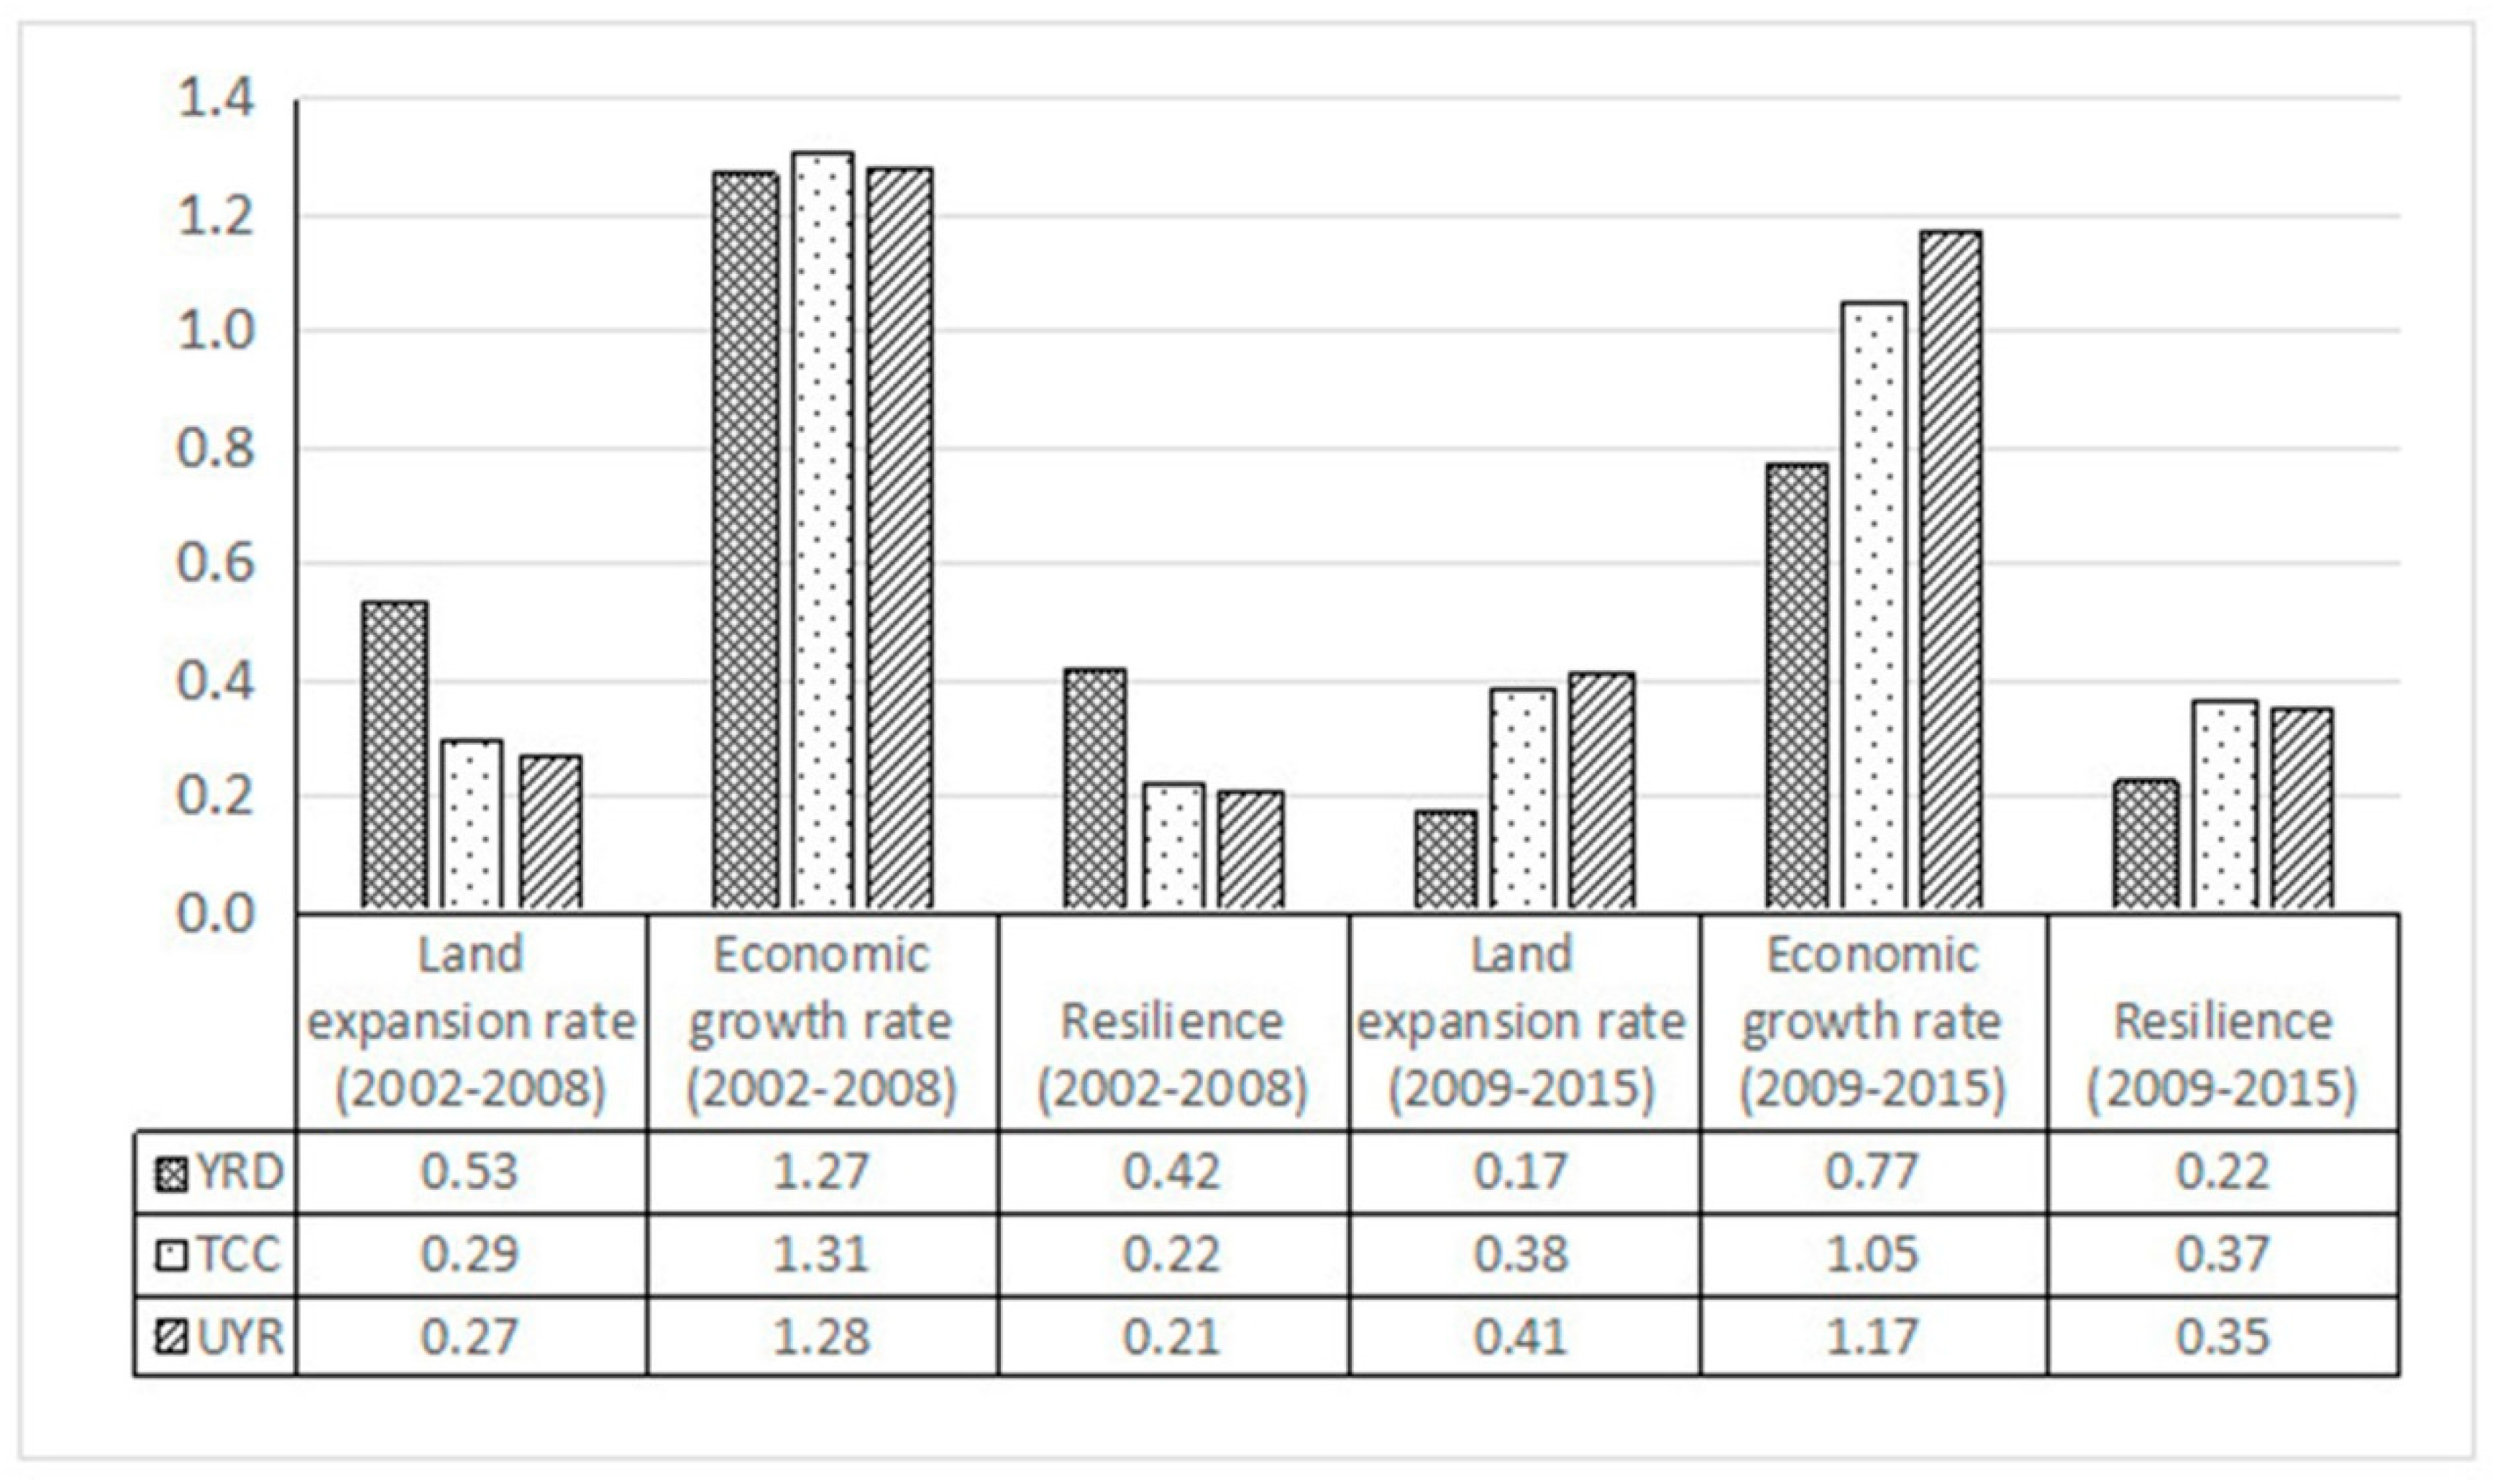
4.3. Economic Transition and Land-Use Efficiency: Evidence from Panel Data Analysis

To process the panel data, several key results need to be reported. First, to avoid pseudo-regression in subsequent regression analysis, we performed a panel unit root test to check the stability of data (Table 2). The results indicate that the stability of all the variables has passed the test at least on the 90% confidence level; that is, they are all I(0) processes without unit roots. Second, the result of the F test (Prob > F = 0.000) suggests significant fixed effects in the model. The Hausman test also indicates that the fixed-effect model is appropriate.

4.3.1. Results of Static Panel Data Analysis

First, we use the static panel data model to evaluate the impact of explanatory variables on LUE. Table 3 shows the results of ordinary least squares (OLS), the fixed-effect model, and the two-stage least squares estimation. The results of OLS show that the influencing direction of explanatory variables to the dependent variable is basically consistent with our theoretical assumption. When we control the individual effects in the model, the estimation results present significant changes. Next, we will report the results of the fixed-effect model in detail. The coefficient of RFDI is significantly negative, indicating that the increase in FDI may cause a decline in LUE in the context of globalization. This result does not seem to be in line with common sense. However, related research indicates that the large inflow of FDI did cause land expansion [56]. Based on our study area, we also found that FDI further aggravated the expansion of construction land. Although FDI may contribute to economic growth to some extent, it fails to bring optimal economic benefits regarding units of construction land. This causes a negative relationship between regional foreign direct investment (RFDI) and LUE.
In addition, labor efficiency produced a positive effect on LUE at a 99% confidence level, which confirms that the marketization process has promoted the LUE through technical advancement, labor productivity improvement, etc. As for decentralization, the fiscal expenditure decentralization positively influences the LUE at a 99% confidence level, while tax burden exerts a significant negative effect. Specifically, fiscal expenditure decentralization has released more incentives and autonomies to local governments, which further contributes to an improvement in the resource allocation efficiency. However, the macro tax burdens of local governments may in turn cause a greater input of construction land for economic growth. Thus, the LUE may decrease. Furthermore, there is a positive relationship between urbanization and LUE. To be specific, the industrialization, which is also known as peri-urbanization, plays a significant role in promoting LUE, while demographic urbanization only has a small positive impact. Additionally, the agglomeration of talents and industries has also imposed a positive impact on the LUE at different confidence levels. The coefficient of the logarithm of per-capita GDP is significantly positive, and the coefficient of population density is positive, but not significant.
However, the introduction of individual effects and time-fixed effects may not effectively solve endogenous problems. To avoid estimation bias, we adopt the two-stage least squares method (TSLS) to re-estimate our static panel data model. Based on the foregoing theoretical analysis, we deem that the indicators that are used to characterize economic transition are likely to be endogenous. To resolve this, we use the first and the second lags of endogenous variables as instruments to re-evaluate the relationship between explanatory variables and the LUE. Column 4 of Table 3 presents the results of TSLS estimation. The Kleibergen–Paap Lagrange multiplier (Kleibergen–Paap LM) and Hansen test indicate that there is no underidentification or overidentification problem in the TSLS estimation, suggesting that these instrumental variables are valid. Overall, the results of the TSLS estimation are basically consistent with the fixed-effects model. In detail, the influencing degree of FDI and labor productivity on land economic density has increased (indicated by an increase in the regression coefficients), while the coefficient of tax burdens suffers a decline. With the weakening of endogeneity, the model regresses better, and the regression coefficients of the variables are more reasonable.

4.3.2. Robustness Test

To further test the reliability of the above findings, we adjust the basic estimation model and introduce suitable lags of the dependent variable for estimation. The dynamic panel data model includes the first and the second lags of the dependent variable, all of the explanatory variables, and the time effects. To deal with the endogeneity of explanatory variables in the dynamic model, we adopt the two-step system GMM to estimate the relationship between LUE and explanatory variables. The dynamic panel data model is set as follows.
l n L U E i t = l n L U E i t 1 + l n L U E i t 2 + β j X i t + θ t + ε i t
Here, l n L U E i t 1 ,   l n L U E i t 2 ,   and   X i t represent the first and the second lags of the dependent variable, and a set of explanatory variables, respectively. θ t represents the time effects, and ε i t is the error.
As for instrumental variables, we use the suitably lagged values of variables as instruments to estimate the differential and horizontal equation of the system GMM estimator (all of the explanatory variables are treated as endogenous). The results of the system GMM are shown in Table 4. As a comparison and test, we also use OLS and the fixed-effect model to estimate the new model. Before reporting the regression results, it is necessary to analyze several test results in the system GMM estimator. The Arellano–Bond test for AR(1) and AR(2) suggests that the residual term in the model has significant first-order autocorrelation and non-significant second-order autocorrelation. The Hansen overidentification test shows that the instrumental variables are valid in the estimation. Overall, the results denote that the dynamic panel data model is set reasonably, and the system GMM estimator may be appropriate.
Columns 2–4 show the regression results of the OLS, fixed-effects, and system GMM models, respectively. Previous studies have shown that due to the existence of endogeneity, the regression coefficient of the first lag of the dependent variable should be between the OLS and the fixed-effect model [57]. As shown in Table 4, the coefficient of the first lag of the dependent variable is significantly positive, and between the results of the OLS and fixed-effect models. The coefficient of the second lag of the dependent variable is negative, but not significant. This result shows that the current LUE may be largely affected by the previous LUE, showing the existence of cumulative effects of LUE.
In detail, except for the demographic urbanization and talents agglomeration, the influencing direction of other variables is consistent with previous findings. The FDI and tax burden still have a significant negative impact on LUE, while the labor efficiency, agglomeration effect, and location conditions exert a significant positive impact. Although the regression coefficient of fiscal expenditure decentralization is still positive, it is not statistically significant.

5. Conclusions and Implications

Economic transition has influenced the LUE significantly. The process of economic transition can be conceptualized as a quadruple process of globalization, marketization, decentralization, and urbanization. Globalization promotes the openness and trade liberalization. The growth of FDI facilitates industrial agglomeration, and also accelerates land-use changes. A typical example is the construction of a development zone and industrial parks. The proportion of FDI to GDP does not play a positive role. Instead, it shows a restraining effect. A large inflow of FDI did not effectively improve the LUE, but might result in rapid land expansion in the globalization process. The development zone fever is a case in point.
Marketization helps improve LUE through increasing labor productivity and forming market competition. Given the land costs, land users tend to focus more on land-use benefits. Urbanization and fiscal expenditure decentralization exerted positive effects on the LUE. It should be noted that decentralization is a double-edged sword. The imbalance between revenue assignment and expenditure responsibility may also lead local governments to increase land investment to accumulate wealth, which is not conducive to the improvement in LUE. In addition, the agglomeration effects and location advantages play a positive role in improving LUE, although they also cause the spatial inequality of LUE.
Combined with economic transition and spatiality, we build an analytical framework for analyzing the LUE. The panel data of 108 prefecture-level cities in the YREZ quantitatively demonstrated that our analytical framework can better explain the evolution and spatial difference of the LUE. Under the background of rapid urbanization and economic growth, questions about how urban development and land use can be effectively transformed to promote a healthy land-use model—which is featured as structure optimization, quantity saving and land-use efficiency improvement—are becoming key issues for urban managers and land users. Especially in the context of economic transition, we need to consider the impact of marketization and decentralization on the LUE, when seeking guidance for an intensive use of land at the macro level.
Based on the analysis above, the following suggestions are made:
  • A rational use of foreign capital and strengthening of technological innovation. Capital flows from outside the country impose significant impacts on urban land expansion and land-use efficiency. Local governments should introduce FDI reasonably, and guide industrial agglomeration properly. The construction of industrial districts and development zones should avoid blind expansion, and satisfy the requirements of regional market development. Besides, strengthening technological innovation is important in the process of globalization. As urban managers, local officials need to seek innovative ways to stimulate economic growth, and improve LUE through the upgrading of technics, cultivation of talents, improvement in labor productivity promotion, and so on.
  • Further improvements to the land market mechanism and financial management mechanism. The paid use of land and free pricing under the market mechanism help improve LUE. For the future development of the land market, the land pricing mechanism needs to be gradually improved. The role of market regulation and price constraints should be fully utilized to explore the competitive land prices, especially the price of industrial land. In addition, a balance of the fiscal revenue power and expenditure responsibility between central and local governments needs to be realized through tax reforms. Meanwhile, the central government should increase fiscal transfer payments to poor regions, so as to alleviate their tax burdens in urban development.
  • Transformation of the developing concept of urbanization and the development of differentiated land-use policies. With the contradiction between more populations and less land, urban development should pursue smart growth. The process of urbanization should be built on a coordinated relationship between population and land. At the same time, the governments should focus on cultivating urban agglomerations and industrial belts, and gradually strengthen the spatial spillover effects of core cities. For developed cities, the land-use efficiency should be further improved through the transformation and upgrading of industries. For underdeveloped areas, it is necessary to cultivate bigger cities gradually to realize a spatial spillover effect. In addition, the government ought to further strengthen land reclamation, and continuously improve the utilization efficiency of urban land.

Author Contributions

S.L. and Y.Y. jointly conceived the analytical framework and econometric model. S.L. analyzed the data and wrote the paper. L.L. provided constructive suggestions for both the analysis and English writing of this paper. All of the authors had read and approved the final manuscript.

Acknowledgments

We would like to acknowledge the necessary support of the “School of Public Affairs, Zhejiang University”, the “Laboratory of Rural-Urban Construction Land Economical and Intensive Use”, and the “Land Academy for National Development, Zhejiang University”. This research was funded by the Major project of the National Social Science Fund of China (No.14ZDA039).

Conflicts of Interest

The authors declare no conflict of interest in this article.

References

  1. Turner, B.L.; Meyer, W.B.; Skole, D.L. Global land-use/land-cover change: Towards an integrated study. Ambio: A J. Hum. Environ. 1994, 23, 91–95. [Google Scholar]
  2. Michael, F.L.; Noor, Z.Z.; Figueroa, M.J. Review of urban sustainability indicators assessment - Case study between Asian countries. Habitat Int. 2014, 44, 491–500. [Google Scholar] [CrossRef]
  3. La Rosa, D.; Barbarossa, L.; Privitera, R.; Martinico, F. Agriculture and the city: A method for sustainable planning of new forms of agriculture in urban contexts. Land Use Pol. 2014, 41, 290–303. [Google Scholar] [CrossRef]
  4. Brown, L.R. Who Will Feed China? Wake-up Call for a Small Planet; Earthscan Publications: London, UK, 1995. [Google Scholar]
  5. Scolozzi, R.; Geneletti, D. A multi-scale qualitative approach to assess the impact of urbanization on natural habitats and their connectivity. Environ. Impact Assess. Rev. 2012, 36, 9–22. [Google Scholar] [CrossRef]
  6. Steeneveld, G.J.; Koopmans, S.; Heusinkveld, B.G.; van Hove, L.W.A.; Holtslag, A.A.M. Quantifying urban heat island effects and human comfort for cities of variable size and urban morphology in the Netherlands. J. Geophys. Res. 2011, 116. [Google Scholar] [CrossRef] [Green Version]
  7. Tan, P.; Chou, C.; Chou, C.C.K. Impact of urbanization on the air pollution “holiday effect” in Taiwan. Atmos. Environ. 2013, 70, 361–375. [Google Scholar] [CrossRef]
  8. Hui, E.C.M.; Wu, Y.; Deng, L.; Zheng, B. Analysis on coupling relationship of urban scale and intensive use of land in China. Cities 2015, 42, 63–69. [Google Scholar] [CrossRef]
  9. Burchell, R. Economic and fiscal costs (and benefits) of sprawl. Urban Lawyer. 1997, 29, 159–181. [Google Scholar]
  10. Gabriel, S.A.; Faria, J.A.; Moglen, G.E. A multiobjective optimization approach to smart growth in land development. Socio-Econ. Plan. Sci. 2006, 40, 212–248. [Google Scholar] [CrossRef]
  11. Hepinstall-Cymerman, J.; Coe, S.; Hutyra, L.R. Urban growth patterns and growth management boundaries in the Central Puget Sound, Washington, 1986–2007. Urban Ecosyst. 2013, 16, 109–129. [Google Scholar] [CrossRef]
  12. Long, H.; Li, Y.; Liu, Y.; Woods, M.; Zou, J. Accelerated restructuring in rural China fueled by “increasing vs. decreasing balance” land-use policy for dealing with hollowed villages. Land Use Pol. 2012, 29, 11–22. [Google Scholar] [CrossRef]
  13. Ding, C. Building height restrictions, land development and economic costs. Land Use Pol. 2013, 30, 485–495. [Google Scholar] [CrossRef]
  14. Li, H.; Wei, Y.D.; Liao, F.H.; Huang, Z. Administrative hierarchy and urban land expansion in transitional China. Appl. Geogr. 2015, 56, 177–186. [Google Scholar] [CrossRef]
  15. Zhang, Q.; Su, S. Determinants of urban expansion and their relative importance: A comparative analysis of 30 major metropolitans in China. Habitat Int. 2016, 58, 89–107. [Google Scholar] [CrossRef]
  16. Zhang, S. Land-centered urban politics in transitional China—Can they be explained by Growth Machine Theory? Cities 2014, 41, 179–186. [Google Scholar] [CrossRef]
  17. Zhong, T.; Huang, X.; Wang, B. On the degrees of decoupling and recoupling of economic growth and expansion of construction land in China from 2002–2007. J. Nat. Resour. 2010, 25, 18–31. [Google Scholar]
  18. Wang, L.J.; Li, H.; Shi, C. Urban land-use efficiency, spatial spillover, and determinants in China. Acta Geogr. Sin. 2015, 70, 1788–1799. [Google Scholar]
  19. Lu, X.H.; Chen, D.L.; Kuang, B. Coupling effect of industrial integration and urban land use effciency: Taking the urban agglomeration of the middle reaches of the Yangtze River as a case. China Land Sci. 2018, 32, 66–73. [Google Scholar]
  20. Feng, K.; Wu, C.F.; Lu, Z.W.; Bei, H.L. Discussions about spatial-temporal characters and the law of land use efficiency distribution—Evidence from provincial panel data in China. Econ. Geogr. 2008, 28, 817–820. [Google Scholar]
  21. Behan, K.; Maoh, H.; Kanaroglou, P. Simulating and evaluating smart growth strategies: Evidence from the CMA of Hamilton, Ontario. Can. Geogr. 2008, 52, 291–308. [Google Scholar] [CrossRef]
  22. Miller, E.J.; Douglas Hunt, J.; Abraham, J.E.; Salvini, P.A. Microsimulating urban systems. Comput. Environ. Urban Syst. 2004, 28, 9–44. [Google Scholar] [CrossRef]
  23. Wei, Y.H.D. Regional development in China: Transitional institutions, embedded globalization, and hybrid economies. Eurasian Geogr. Econ. 2007, 48, 16–36. [Google Scholar] [CrossRef]
  24. Wu, L.; Wu, W.; Wu, T. From the world urbanization trends to see China’s urbanization development. Sci. News. 2003, 17, 7–8. [Google Scholar]
  25. He, C.; Huang, Z.; Wang, R. Land use change and economic growth in urban China: A structural equation analysis. Urban Stud. 2014, 51, 2880–2898. [Google Scholar] [CrossRef]
  26. Ping, Y.C. Explaining land use change in a Guangdong county: The supply side of the story. China Q. 2011, 207, 626–648. [Google Scholar] [CrossRef]
  27. Skonhoft, A.; Solem, H. Economic growth and land-use changes: The declining amount of wilderness land in Norway. Ecol. Econ. 2001, 37, 289–301. [Google Scholar] [CrossRef]
  28. Lambin, E.F.; Geist, H.J. Global land-use and land-cover change: What have we learned so far? Glob. Chang. Newsl. 2001, 46, 27–30. [Google Scholar]
  29. Chen, W.; Yan, C.; Wu, Q.; Li, Y. Study on the contribution of land element to economic growth of development zones: Based on panel data estimation and measurement in Jiangsu province. Areal Res. Dev. 2011, 30, 146–149. [Google Scholar]
  30. Liu, T.; Cao, G.; Yan, Y.; Wang, R.Y. Urban land marketization in China: Central policy, local initiative, and market mechanism. Land Use Pol. 2016, 57, 265–276. [Google Scholar] [CrossRef]
  31. Du, J.F.; Thill, J.C.; Peiser, R.B.; Feng, C.C. Urban land market and land-use changes in post-reform China: A case study of Beijing. Landsc. Urban Plan. 2014, 124, 118–128. [Google Scholar] [CrossRef]
  32. Zeng, C.; Zhang, A.; Liu, L.; Liu, Y. Administrative restructuring and land-use intensity—A spatial explicit perspective. Land Use Pol. 2017, 67, 190–199. [Google Scholar] [CrossRef]
  33. Tu, F.; Yu, X.; Ruan, J. Industrial land use efficiency under government intervention: Evidence from Hangzhou, China. Habitat Int. 2014, 43, 1–10. [Google Scholar] [CrossRef]
  34. Liu, Y.; Fan, P.; Yue, W.; Song, Y. Impacts of land finance on urban sprawl in China: The case of Chongqing. Land Use Pol. 2018, 72, 420–432. [Google Scholar] [CrossRef]
  35. Pan, A.; Liu, Y. The degree of imbalance between population urbanization and land urbanization of Xiangjiang river basin. Econ. Geogr. 2014, 34, 63–68. [Google Scholar]
  36. Wey, W. Smart growth and transit-oriented development planning in site selection for a new metro transit station in Taipei, Taiwan. Habitat Int. 2015, 47, 158–168. [Google Scholar] [CrossRef]
  37. Zhou, D.; Xu, J.; Wang, L.; Lin, Z. Assessing urbanization quality using structure and function analyses: A case study of the urban agglomeration around Hangzhou Bay (UAHB), China. Habitat Int. 2015, 49, 165–176. [Google Scholar] [CrossRef]
  38. Wei, Y.D. Spatiality of regional inequality. Appl. Geogr. 2015, 61, 1–10. [Google Scholar] [CrossRef]
  39. He, C.; Liu, Z.; Wang, L. Economic transition and convergence of regional industrial structure in China. Acta Geogr. Sin. 2008, 63, 807–819. [Google Scholar]
  40. Zhu, H. The mechanism and course of economical activity spatial agglomeration of new economical geography and its significance. Econ. Geogr. 2005, 25, 753–756. [Google Scholar]
  41. Myrdal, G. Economic Theory and Under-Developed Regions; Ducksworth: London, UK, 1957. [Google Scholar]
  42. Yang, G.S.; Xu, X.B.; Li, P.X. Research on the construction of green ecological corridors in the Yangtze River Economic Belt. Progress Geogr. 2015, 34, 1356–1367. [Google Scholar]
  43. National Bureau of Statistics of China. Available online: http://www.yearbookchina.com (accessed on 25 March 2019).
  44. Botev, Z.I.; Grotowski, J.F.; Kroese, D.P. Kernel density estimation via diffusion. Ann. Stat. 2010, 38, 2916–2957. [Google Scholar] [CrossRef] [Green Version]
  45. Shi, Z.L.; Huang, Z.H. A dynamic analysis of the economic growth on the provincial level in China: Based on Kernel density estimation method. Econ. Surv. 2009, 4, 60–63. [Google Scholar]
  46. Sun, C.Z.; Li, X. Dynamic evolution analysis of China’s marine economy development based on Kernel density estimation. Econ. Geogr. 2015, 35, 96–103. [Google Scholar]
  47. Ni, P.; Kresl, P.; Li, X. China urban competitiveness in industrialization: Based on the panel data of 25 cities in China from 1990 to 2009. Urban Stud. 2014, 51, 2787–2805. [Google Scholar] [CrossRef]
  48. Baltagi, B.H. Testing for random individual and time effects using a Gauss-Newton regression. Econ. Lett. 1996, 50, 189–192. [Google Scholar] [CrossRef]
  49. Sun, X.H.; Li, M.S.; Wang, Y. Marketization process and regional economic development differences. J. Quant. Tech. Econ. 2015, 32, 39–55. [Google Scholar]
  50. Arellano, M.; Bond, S. Some tests of specification for panel data: Monte carlo evidence and an application to employment equations. Rev. Econ. Stud. 1991, 58, 277–297. [Google Scholar] [CrossRef]
  51. Blundell, R.; Bond, S. Initial conditions and moment restrictions in dynamic panel data models. J. Econom. 1998, 87, 115–143. [Google Scholar] [CrossRef] [Green Version]
  52. Zhang, W.; Wang, W.; Li, X.; Ye, F. Economic development and farmland protection: An assessment of rewarded land conversion quotas trading in Zhejiang, China. Land Use Pol. 2014, 38, 467–476. [Google Scholar] [CrossRef]
  53. Wei, Y.D.; Yuan, F.; Liao, H. Spatial mismatch and determinants of foreign and domestic ICT firms in China. Prof. Geogr. 2013, 65, 247–264. [Google Scholar] [CrossRef]
  54. Jia, J.; Guo, Q. The effects of intergovernmental assignment of public revenue and expenditure responsibility on the regional economic growth. Econ. Res. J. 2008, 6, 37–49. [Google Scholar]
  55. Huang, M.Y.; Yue, W.Z.; He, X. Decoupling relationship between urban expansion and economic growth and its spatial heterogeneity in the Yangtze Economic Belt. J. Nat. Resour. 2017, 33, 219–232. [Google Scholar]
  56. Li, H.; Wei, Y.D.; Zhou, Y. Spatiotemporal analysis of land development in transitional China. Habitat Int. 2017, 67, 79–95. [Google Scholar] [CrossRef]
  57. Guo, Q.W.; Jia, J.X. Fiscal decentralization, government structure and local government’s expenditure size. Econ. Res. J. 2010, 45, 59–72. [Google Scholar]
Figure 1. The conceptual framework for analyzing the driving forces of land-use efficiency.
Sustainability 11 01839 g001
Figure 2. Study area.
Sustainability 11 01839 g002
Figure 3. Kernel density estimation of land-use efficiency for selected years.
Sustainability 11 01839 g003
Figure 4. The spatial distribution of land-use efficiency in the Yangtze River Economic Zone (YREZ).
Sustainability 11 01839 g004
Figure 5. Land expansion rate, economic growth rate, and resilience.
Sustainability 11 01839 g005
Figure 6. The relationship between land-use efficiency and some key factors in 2015.
Sustainability 11 01839 g006
Figure 7. The global Moran’s I values in the YREZ, Yangtze River Delta (YRD), Triangle of Central China (TCC), and upper reaches of the Yangtze River (UYR), 2002–2015.
Sustainability 11 01839 g007
Figure 8. Evolution of the spatial pattern of land-use efficiency hot-spot areas for selected years.
Sustainability 11 01839 g008
Table 1. Definition of variables.
VariablesDefinitionAbbreviation
Land-use efficiencyNon-agricultural output value/the area of cities, towns, and transportation space [108 Yuan/km2 (log)]LUE
GlobalizationRegional foreign direct investment/gross domestic production (%)RFDI
Marketization(The number of non-agricultural employees/non-agricultural output value)/average wages of staff and workers (%)LE
DecentralizationPer-capita fiscal expenditure of prefecture-level cities/the sum of per-capita fiscal expenditure of prefecture-level cities, provinces, and the central government (%)FEDEC
Tax revenue/gross domestic production (%)TAXB
UrbanizationAdded value of the secondary industry/added value of the tertiary industry (%)IDU
Number of population in cities and towns/total number of population (%)URB
AgglomerationThe number of non-agricultural employees/construction land area [person/km2 (log)]EMD
(Technical employees/urban non-agricultural employees)/(total technical employees/total urban non-agricultural employees in the whole region) (%)TLE
LocationPer-capita gross domestic production [Yuan/person (log)]AGDP
Control variablePopulation density (person/km2)POPD
Note: Log is the natural logarithm.
Table 2. Panel data unit root test.
VariablesLLCIPSADFPP
RFDI−24.737 ***−7.734 ***4.366 ***17.228 ***
LE−42.2237 ***−34.874 ***5.979 ***1.938 **
FEDEC−19.099 ***−12.783 ***6.606 ***38.017 ***
TAXB−6.517 ***−2.186 **5.677 ***2.614 ***
IDU−28.081 ***−3.573 ***24.986 ***5.451 ***
URB−41.108 ***−5.517 ***33.189 ***11.367 ***
TLE−30.425 ***−38.496 ***6.873 ***17.473 ***
EMD−2.224 **−19.524 ***7.486 ***2.162 **
AGDP−19.469 ***−8.029 ***30.816 ***9.481 ***
POPD−18.871 ***−4.253 ***9.909 ***10.253 ***
Note: *, **, and *** indicate that the coefficients of variables are significant at 90%, 95%, and 99% confidence level respectively. LLC, IPS, ADF and PP refer to four methods of unit root test: Levin, Lin and Chu test; Im, Pesearn and Shin test; Augmented Dickey—Fuller test; and Phillips and Perron test.
Table 3. Regression results of ordinary least squares (OLS), the fixed-effect model, and the two-stage least squares (TSLS).
MethodOLSFixed effectsTSLS
RFDI−1.8147 ***
(−2.74)
−0.6408 ***
(−2.94)
−0.8455 **
(−2.70)
LE0.0796 ***
(11.12)
0.0568 ***
(10.39)
0.0605 ***
(9.09)
FEDEC0.4051
(1.54)
0.3252 ***
(3.42)
0.5577 ***
(3.62)
TAXB−1.8204 ***
(−2.73)
−0.9455 ***
(−4.76)
−0.7557 ***
(−3.16)
IDU0.0037
(0.18)
0.1401 ***
(6.71)
0.0831 ***
(3.37)
URB−0.0030
(−1.24)
0.0037 *
(1.67)
0.0012
(0.47)
TLE0.0701 **
(2.44)
0.0207 **
(1.95)
0.0222 **
(2.14)
EMD0.6746 ***
(14.65)
0.5397 ***
(18.15)
0.4936 ***
(13.49)
AGDP0.3947 ***
(8.54)
0.2091 ***
(4.31)
0.1783 ***
(3.52)
POPD0.0204 ***
(4.79)
0.0031
(0.14)
0.0004
(0.02)
Constant−8.6946 ***
(−18.58)
−6.2149 ***
(−12.82)
Time effectsYesYesYes
R2 (overall)0.84860.79750.9534
Kleibergen–Paap LM 29.959 ***
Hansen J 10.350
Observations10801080864
Note: *, **, and *** indicate that the coefficients of variables are significant at 90%, 95%, and 99% confidence levels, respectively. The t-statistics are in parentheses. The Kleibergen–Paap Lagrange multiplier (Kleibergen–Paap LM) and Hansen J-statistics are used to check whether there are underidentification and overidentification in the TSLS estimation. Multiply the coefficients of POPD by 100.
Table 4. Regression results of OLS, the fixed-effect model, and the two-step system generalized method of moments (GMM) estimator.
MethodOLSFixed-effectsSys-GMM
(lnLUE)t-10.9358 ***
(19.84)
0.3360 ***
(10.07)
0.8197 ***
(11.44)
(lnLUE)t-20.0010
(0.04)
−0.0081
(−0.38)
−0.0099
(−0.40)
RFDI−0.2242 *
(−1.88)
−0.3086 *
(−1.89)
−0.5620 *
(−1.68)
LE0.0077 **
(2.04)
0.0398 ***
(8.58)
0.0151 **
(2.38)
FEDEC−0.0086
(−0.38)
0.1242
(1.41)
0.0194
(0.17)
TAXB−0.0018
(−0.02)
−0.3408 **
(−2.30)
−0.2945 *
(−1.75)
IDU0.0041
(1.3)
0.0459 **
(2.47)
0.0140
(1.58)
URB−0.0011 ***
(−2.70)
0.0028
(1.48)
−0.0027
(−1.22)
TLE0.0118 ***
(2.87)
0.0186 **
(2.47)
−0.0048
(−0.38)
EMD0.0759 **
(2.53)
0.3732 ***
(12.33)
0.1485 ***
(3.0)
AGDP0.0278
(1.41)
0.1280 ***
(3.51)
0.1010 *
(1.92)
POPD0.001
(0.78)
−0.0003
(−0.02)
0.01 *
(1.94)
Constant−0.6994 **
(−1.92)
−3.8966 ***
(−9.92)
R20.98610.9141
Time-fixed effectsYesYesYes
Hansen OverID test(p-value) 0.141
Number of instruments 91
Arellano–Bond test for AR(1) 0.000
Arellano–Bond test for AR(2) 0.168
Observations864864864
Note: *, **, and *** indicate that the coefficients of variables are significant at 90%, 95%, and 99% confidence levels, respectively. The t-statistics are in parentheses. Multiply the coefficients of POPD by 100.

