Storing E-waste in Green Infrastructure to Reduce Perceived Value Loss through Landfill Siting and Landscaping: A Case Study in Nanjing, China


Abstract
1. Introduction
2. Methodology and Data Collection
2.1. Landfill Siting Considering Public Perception
2.1.1. Overall Technique Flow
2.1.2. Survey on Public Perception
2.2. Criteria for Developing the E-waste Landfill as Landscape Infrastructure
2.3. Application Case and Data Resource
3. Results and Discussion
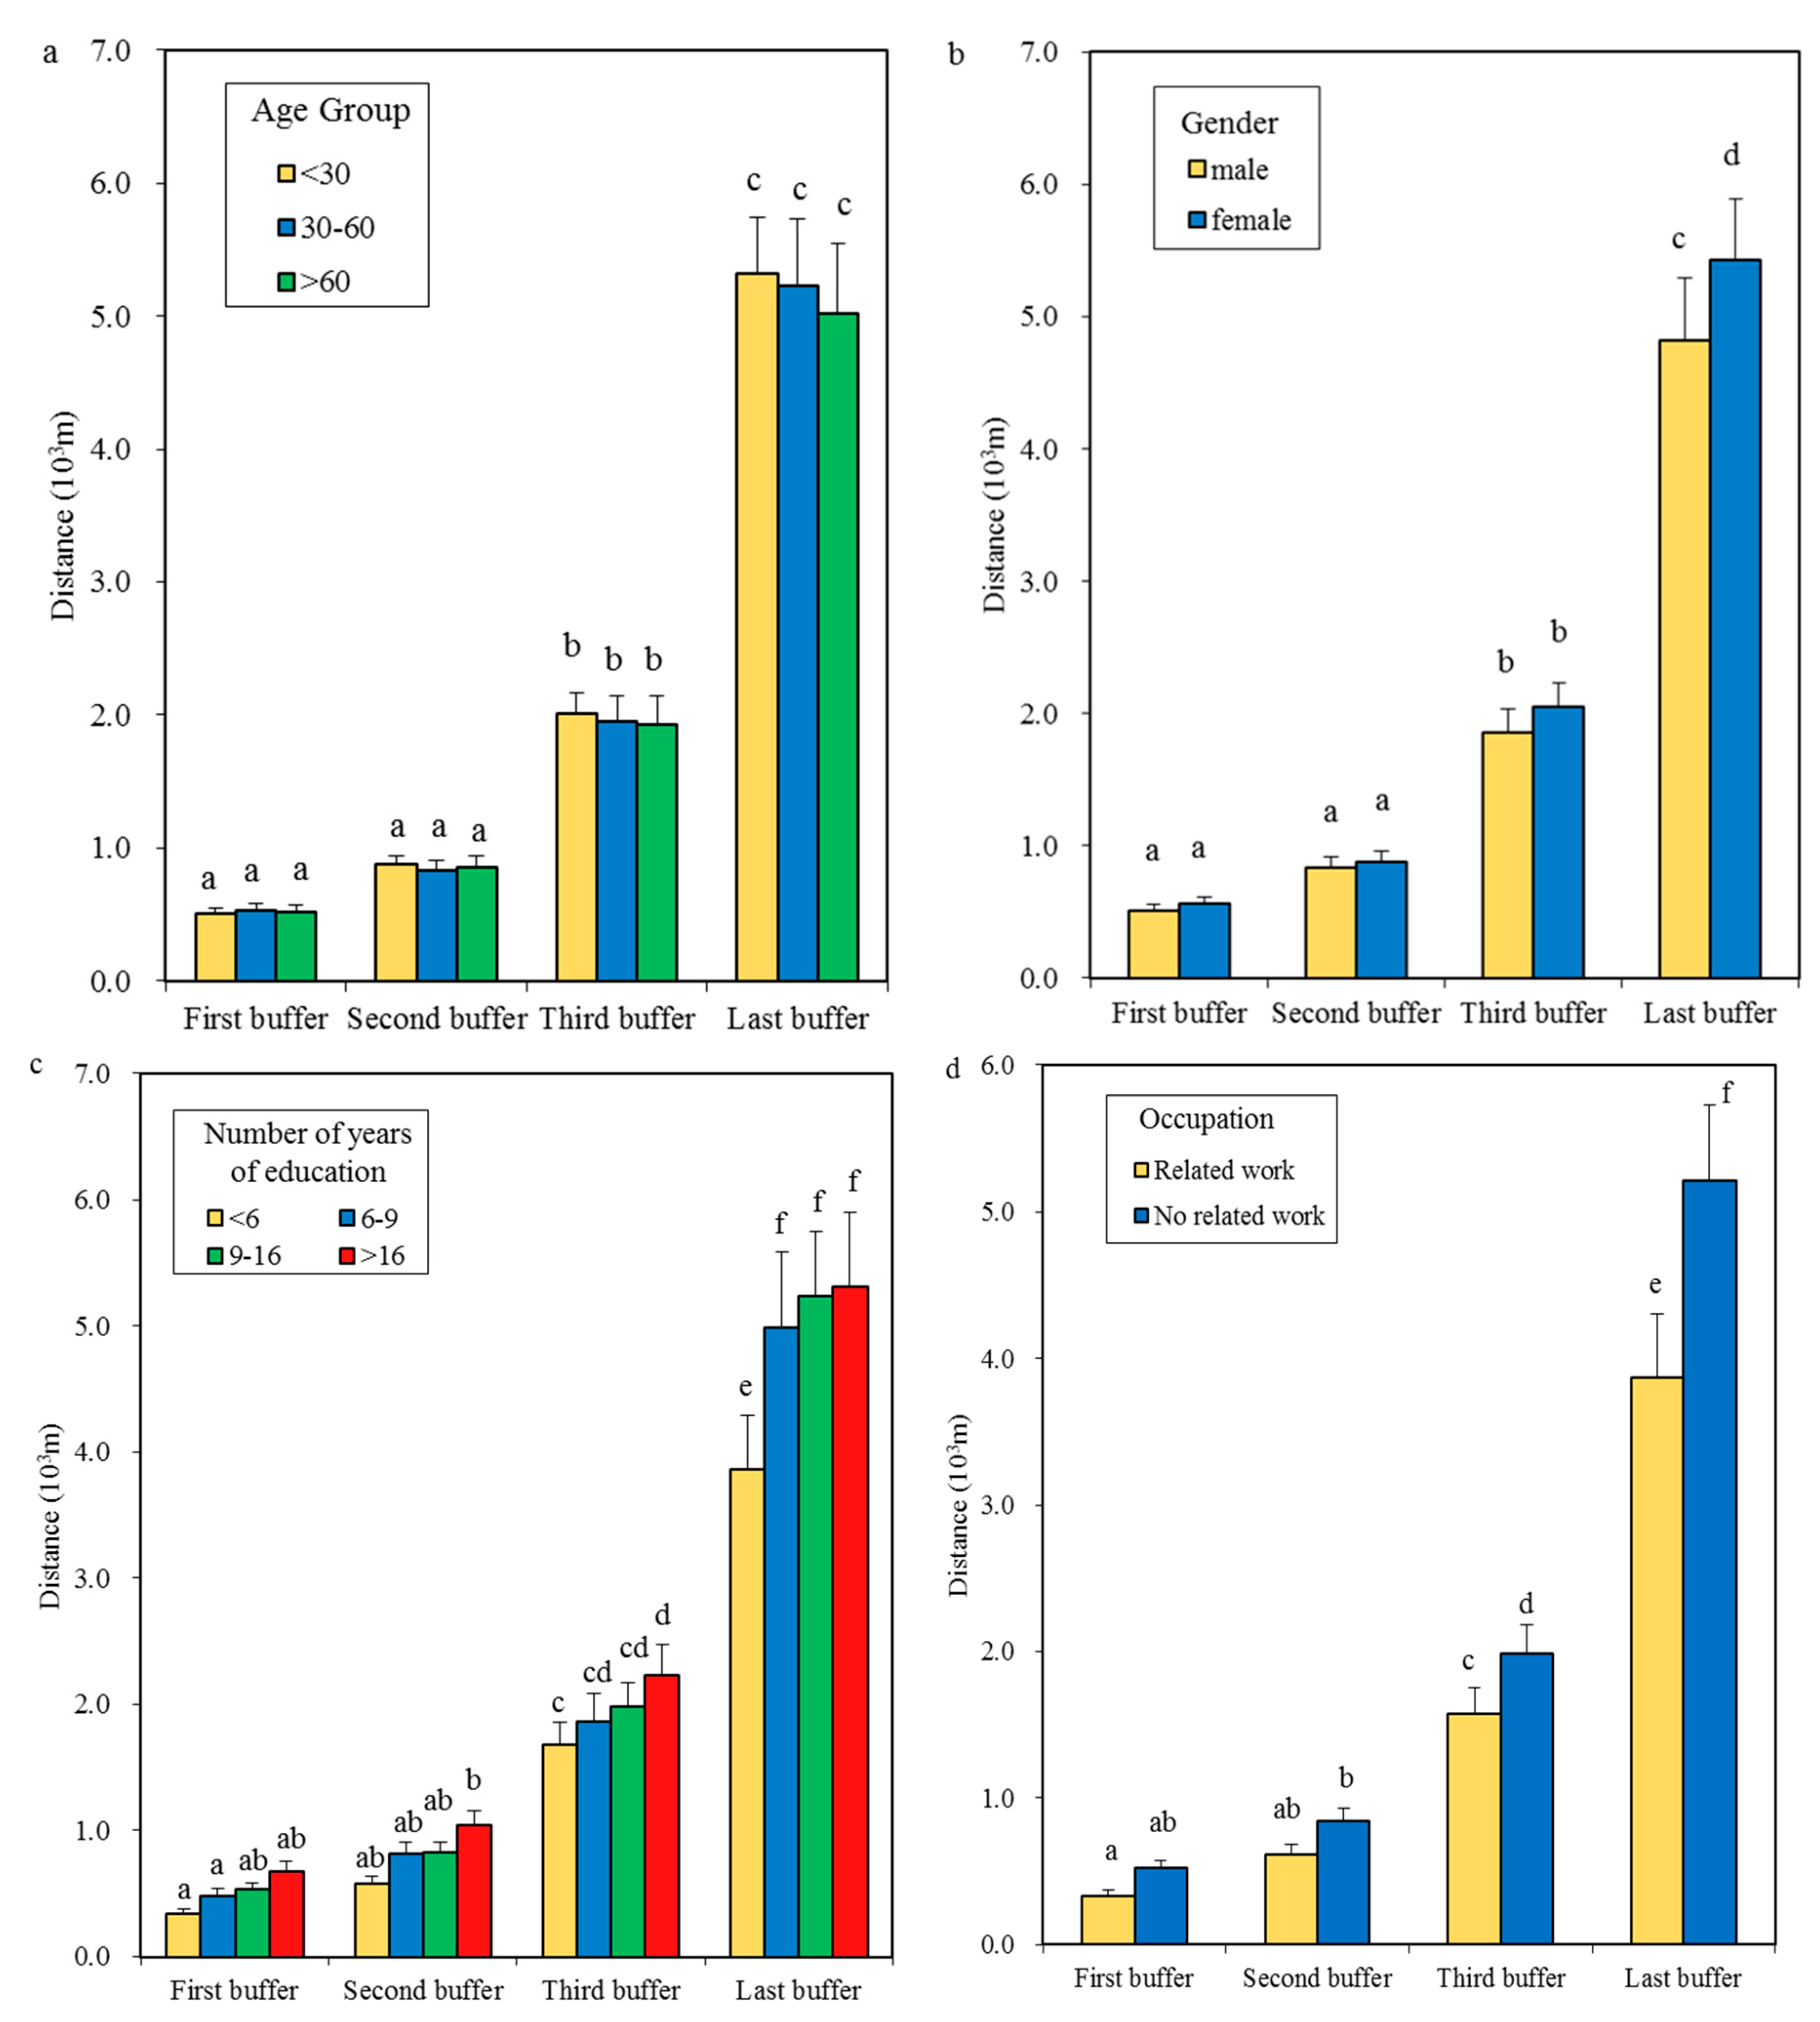
3.1. Variety in Public Perception Regarding Spatial Distance from the Landfill
3.2. Landfill Site with Minimal Perceived Value Loss
3.3. Landscape Infrastructure of E-waste Landfills
4. Discussion
4.1. Influence of Individual Characteristics on Landfill Siting
4.2. Advantages and Disadvantages of the Design of a Sealed Box
4.3. E-waste Landfill for a Green Future
5. Conclusions
Author Contributions
Funding
Acknowledgments
Conflicts of Interest
References
- Wood, L. Datapoint: The Lost Story of the Texans Who Invented the Personal Computer Revolution; Hugo House Publishers, Ltd.: Austin, TX, USA, 2013. [Google Scholar]
- Jang, S.; Chung, J. How do interaction activities among customers and between customers and firms influence market performance and continuous product innovation? An empirical investigation of the mobile application market. J. Prod. Innova. Manag. 2015, 32, 183–191. [Google Scholar] [CrossRef]
- Culver, J. The life cycle of a cpu: Www. Cpushack. Net/life-cycle-of-cpu. Html. Zugriff am 2005, 9, 2009. [Google Scholar]
- Cordova-Pizarro, D.; Aguilar-Barajas, I.; Romero, D.; Rodriguez, C.A. Circular economy in the electronic products sector: Material flow analysis and economic impact of cellphone e-waste in Mexico. Sustainability 2019, 11, 1361. [Google Scholar] [CrossRef]
- Li, B.; Yang, J.; Lu, B.; Song, X. Estimation of retired mobile phones generation in china: A comparative study on methodology. Waste Manag. 2015, 35, 247–254. [Google Scholar] [CrossRef] [PubMed]
- European Union (EU). Directive 2002/96/EC of the European Parliament and of the Council of 27 January 2003 on Waste Electrical and Electronic Equipment (WEEE)—Joint Declaration of the European Parliament, the Council and the Commission Relating to Article 9; EU: Brussels, Belgium, 2002; Available online: http://europa.eu.int/eur-lex/en/ (accessed on 15 January 2019).
- BUWAL. Ordinance on the Return, the Taking Back and the Disposal of Electrical and Electronic Equipment (ORDEE) of 14 January 1998. 2005. Available online: http://raee.org.co/nuevo/wp-content/uploads/2014/06/VREG_engl.pdf (accessed on 15 January 2019).
- Yu, X.; Gao, Y.; Wu, S.; Zhang, H.; Cheung, K.; Wong, M. Distribution of polycyclic aromatic hydrocarbons in soils at guiyu area of china, affected by recycling of electronic waste using primitive technologies. Chemosphere 2006, 65, 1500–1509. [Google Scholar] [CrossRef] [PubMed]
- Chen, F.; Yang, B.; Ma, J.; Qu, J.; Liu, G. Decontamination of electronic waste-polluted soil by ultrasound-assisted soil washing. Environ. Sci. Pollut. Res. 2016, 23, 20331–20340. [Google Scholar] [CrossRef] [PubMed]
- Samara, C.; Kouimtzis, T.; Katsoulos, G. Characterization of airborne particulate matter in Thessaloniki, greece: Part III: Comparison of two multivariate modeling approaches for the source apportionment of heavy metal concentrations within total suspended particles. Toxicol. Environ. Chem. 1994, 44, 147–160. [Google Scholar] [CrossRef]
- Cadle, S.H.; Mulawa, P.A.; Hunsanger, E.C.; Nelson, K.; Ragazzi, R.A.; Barrett, R.; Gallagher, G.L.; Lawson, D.R.; Knapp, K.T.; Snow, R. Composition of light-duty motor vehicle exhaust particulate matter in the Denver, Colorado area. Environ. Sci. Technol. 1999, 33, 2328–2339. [Google Scholar] [CrossRef]
- NSBC. China Statistical Yearbook. 2016. Available online: http://www.stats.gov.cn/tjsj/ndsj/2016/indexch.htm (accessed on 15 January 2019).
- European Environment Agency (EEA). Waste Electrical and Electronic Equipment (WEEE); European Environment Agency: Copenhagen, Denmark, 2003. [Google Scholar]
- UNEP. Basel Convention on the Control of Transboundary Movements of Hazardous Wastes and Their Disposal; United Nations Environment Programme/Secretariat of the Basel Convention: Nairobi, Kenya, 1989; Available online: http://www.basel.int/text/documents.html (accessed on 15 January 2019).
- Pan, A.; Yu, L.; Yang, Q. Characteristics and forecasting of municipal solid waste generation in china. Sustainability 2019, 11, 1433. [Google Scholar] [CrossRef]
- Lepawsky, J. The changing geography of global trade in electronic discards: Time to rethink the e-waste problem. Geogr. J. 2015, 181, 147–159. [Google Scholar] [CrossRef]
- Leung, A.; Cai, Z.W.; Wong, M.H. Environmental contamination from electronic waste recycling at guiyu, southeast China. J. Mater. Cycles Waste Manag. 2006, 8, 21–33. [Google Scholar] [CrossRef]
- Wong, M.; Wu, S.; Deng, W.J.; Yu, X.; Luo, Q.; Leung, A.; Wong, C.; Luksemburg, W.; Wong, A. Export of toxic chemicals–a review of the case of uncontrolled electronic-waste recycling. Environ. Pollut. 2007, 149, 131–140. [Google Scholar] [CrossRef]
- Lu, C.; Zhang, L.; Zhong, Y.; Ren, W.; Tobias, M.; Mu, Z.; Ma, Z.; Geng, Y.; Xue, B. An overview of e-waste management in china. J. Mater. Cycles Waste Manag. 2015, 17, 1–12. [Google Scholar] [CrossRef]
- Fang, G.-C.; Wu, Y.-S.; Huang, S.-H.; Rau, J.-Y. Review of atmospheric metallic elements in Asia during 2000–2004. Atmos. Environ. 2005, 39, 3003–3013. [Google Scholar] [CrossRef]
- Deng, W.; Louie, P.; Liu, W.; Bi, X.; Fu, J.; Wong, M. Atmospheric levels and cytotoxicity of pahs and heavy metals in tsp and pm2. 5 at an electronic waste recycling site in southeast china. Atmos. Environ. 2006, 40, 6945–6955. [Google Scholar] [CrossRef]
- Hicks, C.; Dietmar, R.; Eugster, M. The recycling and disposal of electrical and electronic waste in china—legislative and market responses. Environ. Impact Assess. Rev. 2005, 25, 459–471. [Google Scholar] [CrossRef]
- Zeng, X.; Li, J.; Stevels, A.; Liu, L. Perspective of electronic waste management in china based on a legislation comparison between China and the EU. J. Clean Prod. 2013, 51, 80–87. [Google Scholar] [CrossRef]
- Ali, M. Urban waste management as if people matter. Habitat Int. 2006, 4, 729–730. [Google Scholar] [CrossRef]
- Zaman, A.U.; Lehmann, S. Urban growth and waste management optimization towards ‘zero waste city’. City Cult. Soc. 2011, 2, 177–187. [Google Scholar] [CrossRef]
- Mutluturk, M.; Karaguzel, R. The landfill area quality (laq) classification approach and its application in Isparta, Turkey. Environ. Eng. Geosci. 2007, 13, 229–240. [Google Scholar] [CrossRef]
- Rada, E.C.; Ragazzi, M.; Stefani, P.; Schiavon, M.; Torretta, V. Modelling the potential biogas productivity range from a msw landfill for its sustainable exploitation. Sustainability 2015, 7, 482–495. [Google Scholar] [CrossRef]
- Al-Jarrah, O.; Abu-Qdais, H. Municipal solid waste landfill siting using intelligent system. Waste Manag. 2006, 26, 299–306. [Google Scholar] [CrossRef] [PubMed]
- Chang, N.-B.; Parvathinathan, G.; Breeden, J.B. Combining gis with fuzzy multicriteria decision-making for landfill siting in a fast-growing urban region. J. Environ. Manag. 2008, 87, 139–153. [Google Scholar] [CrossRef] [PubMed]
- (Environmental Protection Agency) EPA. Manual on Site Selection. In Draft for Consultation; EPA: Washington, DC, USA, 2006. Available online: http://refhub.elsevier.com/S0169-2046(14)00185-6/sbref0055 (accessed on 15 January 2019).
- Nas, B.; Cay, T.; Iscan, F.; Berktay, A. Selection of MSW landfill site for Konya, Turkey using GIS and multi-criteria evaluation. Environ. Monit. Assess. 2010, 160, 491. [Google Scholar] [CrossRef] [PubMed]
- Schreck, P. Environmental impact of uncontrolled waste disposal in mining and industrial areas in central germany. Environ. Geol. 1998, 35, 66–72. [Google Scholar] [CrossRef]
- Sumathi, V.; Natesan, U.; Sarkar, C. Gis-based approach for optimized siting of municipal solid waste landfill. Waste Manag. 2008, 28, 2146–2160. [Google Scholar] [CrossRef] [PubMed]
- Simsek, C.; Elci, A.; Gunduz, O.; Taskin, N. An improved landfill site screening procedure under nimby syndrome constraints. Landsc. Urban Plan. 2014, 132, 1–15. [Google Scholar] [CrossRef]
- Ekmekçioğlu, M.; Kaya, T.; Kahraman, C. Fuzzy multicriteria disposal method and site selection for municipal solid waste. Waste Manag. 2010, 30, 1729–1736. [Google Scholar] [CrossRef] [PubMed]
- Shen, H.-W.; Yu, Y.-H. Social and economic factors in the spread of the nimby syndrome against waste disposal sites in Taiwan. J. Environ. Plan. Manag. 1997, 40, 273–282. [Google Scholar] [CrossRef]
- Huang, R.; Yip, N.-m. Internet and activism in urban china: A case study of protests in Xiamen and Panyu. J. Comp. Asian Dev. 2012, 11, 201–223. [Google Scholar] [CrossRef]
- Zhang, X.; Matsuto, T. Assessment of internal condition of waste in a roofed landfill. Waste Manag. 2013, 33, 102–108. [Google Scholar] [CrossRef] [PubMed]
- Reichert, A.; Small, M.; Mohanty, S. The impact of landfills on residential property values. J. Real Estate Res. 1992, 7, 297–314. [Google Scholar]
- Wilson, D.C. Development drivers for waste management. Waste Manag. Res. 2007, 25, 198–207. [Google Scholar] [CrossRef]
- Chan, J.K.H. The ethics of working with wicked urban waste problems: The case of Singapore’s Semakau landfill. Landsc. Urban Plan. 2016, 154, 123–131. [Google Scholar] [CrossRef]
- Kao, J.-J.; Lin, H.-Y. Multifactor spatial analysis for landfill siting. J. Environ. Eng. 1996, 122, 902–908. [Google Scholar] [CrossRef]
- Rahman, S.; Rahman, M. Impact of land fragmentation and resource ownership on productivity and efficiency: The case of rice producers in Bangladesh. Land Use Policy 2009, 26, 95–103. [Google Scholar] [CrossRef]
- Pampel, F.C. Support for nuclear energy in the context of climate change: Evidence from the European Union. Organ. Environ. 2011, 24, 249–268. [Google Scholar] [CrossRef]
- Greenberg, M.; Truelove, H.B. Energy choices and risk beliefs: Is it just global warming and fear of a nuclear power plant accident? Risk Anal. 2011, 31, 819–831. [Google Scholar] [CrossRef]
- Sun, L.; Zhu, D.; Chan, E.H. Public participation impact on environment nimby conflict and environmental conflict management: Comparative analysis in shanghai and Hong Kong. Land Use Policy 2016, 58, 208–217. [Google Scholar] [CrossRef]
- Pramanik, M.K. Site suitability analysis for agricultural land use of darjeeling district using AHP and GIS techniques. Modeling Earth Syst. Environ. 2016, 2, 56. [Google Scholar] [CrossRef]
- Şener, Ş.; Şener, E.; Nas, B.; Karagüzel, R. Combining ahp with gis for landfill site selection: A case study in the lake bey? Ehir catchment area (Konya, Turkey). Waste Manag. 2010, 30, 2037–2046. [Google Scholar] [CrossRef]
- Man, M.; Naidu, R.; Wong, M.H. Persistent toxic substances released from uncontrolled e-waste recycling and actions for the future. Sci. Total Environ. 2013, 463, 1133–1137. [Google Scholar] [CrossRef] [PubMed]
- Chen, F.; Li, X.; Ma, J.; Yang, Y.; Liu, G.-J. An exploration of the impacts of compulsory source-separated policy in improving household solid waste-sorting in pilot megacities, china: A case study of Nanjing. Sustainability 2018, 10, 1327. [Google Scholar] [CrossRef]
- Chen, F.; Luo, Z.; Yang, Y.; Liu, G.-J.; Ma, J. Enhancing municipal solid waste recycling through reorganizing waste pickers: A case study in Nanjing, China. Waste Manag. Res. 2018, 36, 767–778. [Google Scholar] [CrossRef]
- EPA (Environmental Protection Agency). Standard for Pollution Control on the Landfill Site of Municipal Solid Waste (GB 16889–2008); EPA: Washington, DC, USA, 2008.
- NEPB. Solid Waste Pollution Prevention Information Bulletin of Nanjing in 2015. 2016. Available online: http://www.njhb.gov.cn/43322/43328/201606/t20160606_3970612.html (accessed on 15 January 2019).
- Yang, R.; Cui, Y. Landscape as infrastructure: Ecological integration of e-waste landfills at Nanjing’s peri-urban areas. Chin. Landscape Architec. 2012, 28, 101–106. [Google Scholar]
- Greenberg, M.R. Nimby, clamp, and the location of new nuclear-related facilities: Us national and 11 site-specific surveys. Risk Anal. 2009, 29, 1242–1254. [Google Scholar] [CrossRef]
- Havukainen, J.; Zhan, M.; Dong, J.; Liikanen, M.; Deviatkin, I.; Li, X.; Horttanainen, M. Environmental impact assessment of municipal solid waste management incorporating mechanical treatment of waste and incineration in Hangzhou, China. J. Clean Prod. 2017, 141, 453–461. [Google Scholar] [CrossRef]
- Kiddee, P.; Naidu, R.; Wong, M.H. Electronic waste management approaches: An overview. Waste Manag. 2013, 33, 1237–1250. [Google Scholar] [CrossRef] [PubMed]
- Danthurebandara, M.; Van Passel, S.; Vanderreydt, I.; Van Acker, K. Assessment of environmental and economic feasibility of enhanced landfill mining. Waste Manag. 2015, 45, 434–447. [Google Scholar] [CrossRef] [PubMed]
- Engler, M. Waste landscapes: Permissible metaphors in landscape architecture. Landsc. J. 1995, 14, 11–25. [Google Scholar] [CrossRef]


| Buffer Zone | First Buffer Zone | Second Buffer Zone | Third Buffer Zone | Fourth Buffer Zone |
|---|---|---|---|---|
| Evaluation criteria | All activities except greening | All activities except greening and agriculture | All activities except greening, agriculture, and industry | Only affects housing |
| Scoring rules | 5 | 3 | 2 | 1 |
 | E-waste landfill |  | Distance (m) | |||
| Do you Know? | ||||||
| E-waste mainly includes household appliances, entertainment electronics, office equipment, communication equipment, and other electronic waste products. | The improper disposal of e-waste poses a significant threat to water resources, soil, air, and public health. | |||||
| Gender | Age | |||||
| Number of years of education | Is your job related to waste disposal? | |||||
| What do you think is the best way to dispose of e-waste? (√) | Incineration | Dump | Recycling | |||
| What are main hazards of an e-waste landfill? (√) | Landscape | Noise | Odor | Menticide | ||
| What is the best solution for e-waste disposal in a landfill? (√) | Absolute physical isolation | Anti-seepage treatment | Fixing agent | |||
| 1 | What should be the minimal distance from the landfill? From which distance will you leave your current residential place or work? | First buffer zone | ||||
| 2 | What is the maximal distance that the odor from landfill can spread? | Second buffer zone | ||||
| 3 | What is the distance at which the landfill fades to invisibility from your residential or working place? | Third buffer zone | ||||
| 4 | What is the landfill distance at which no impact will be produced on your daily life? | Fourth buffer zone | ||||
| Variable | First Buffer Zone | Second Buffer Zone | Third Buffer Zone | Fourth Buffer Zone |
|---|---|---|---|---|
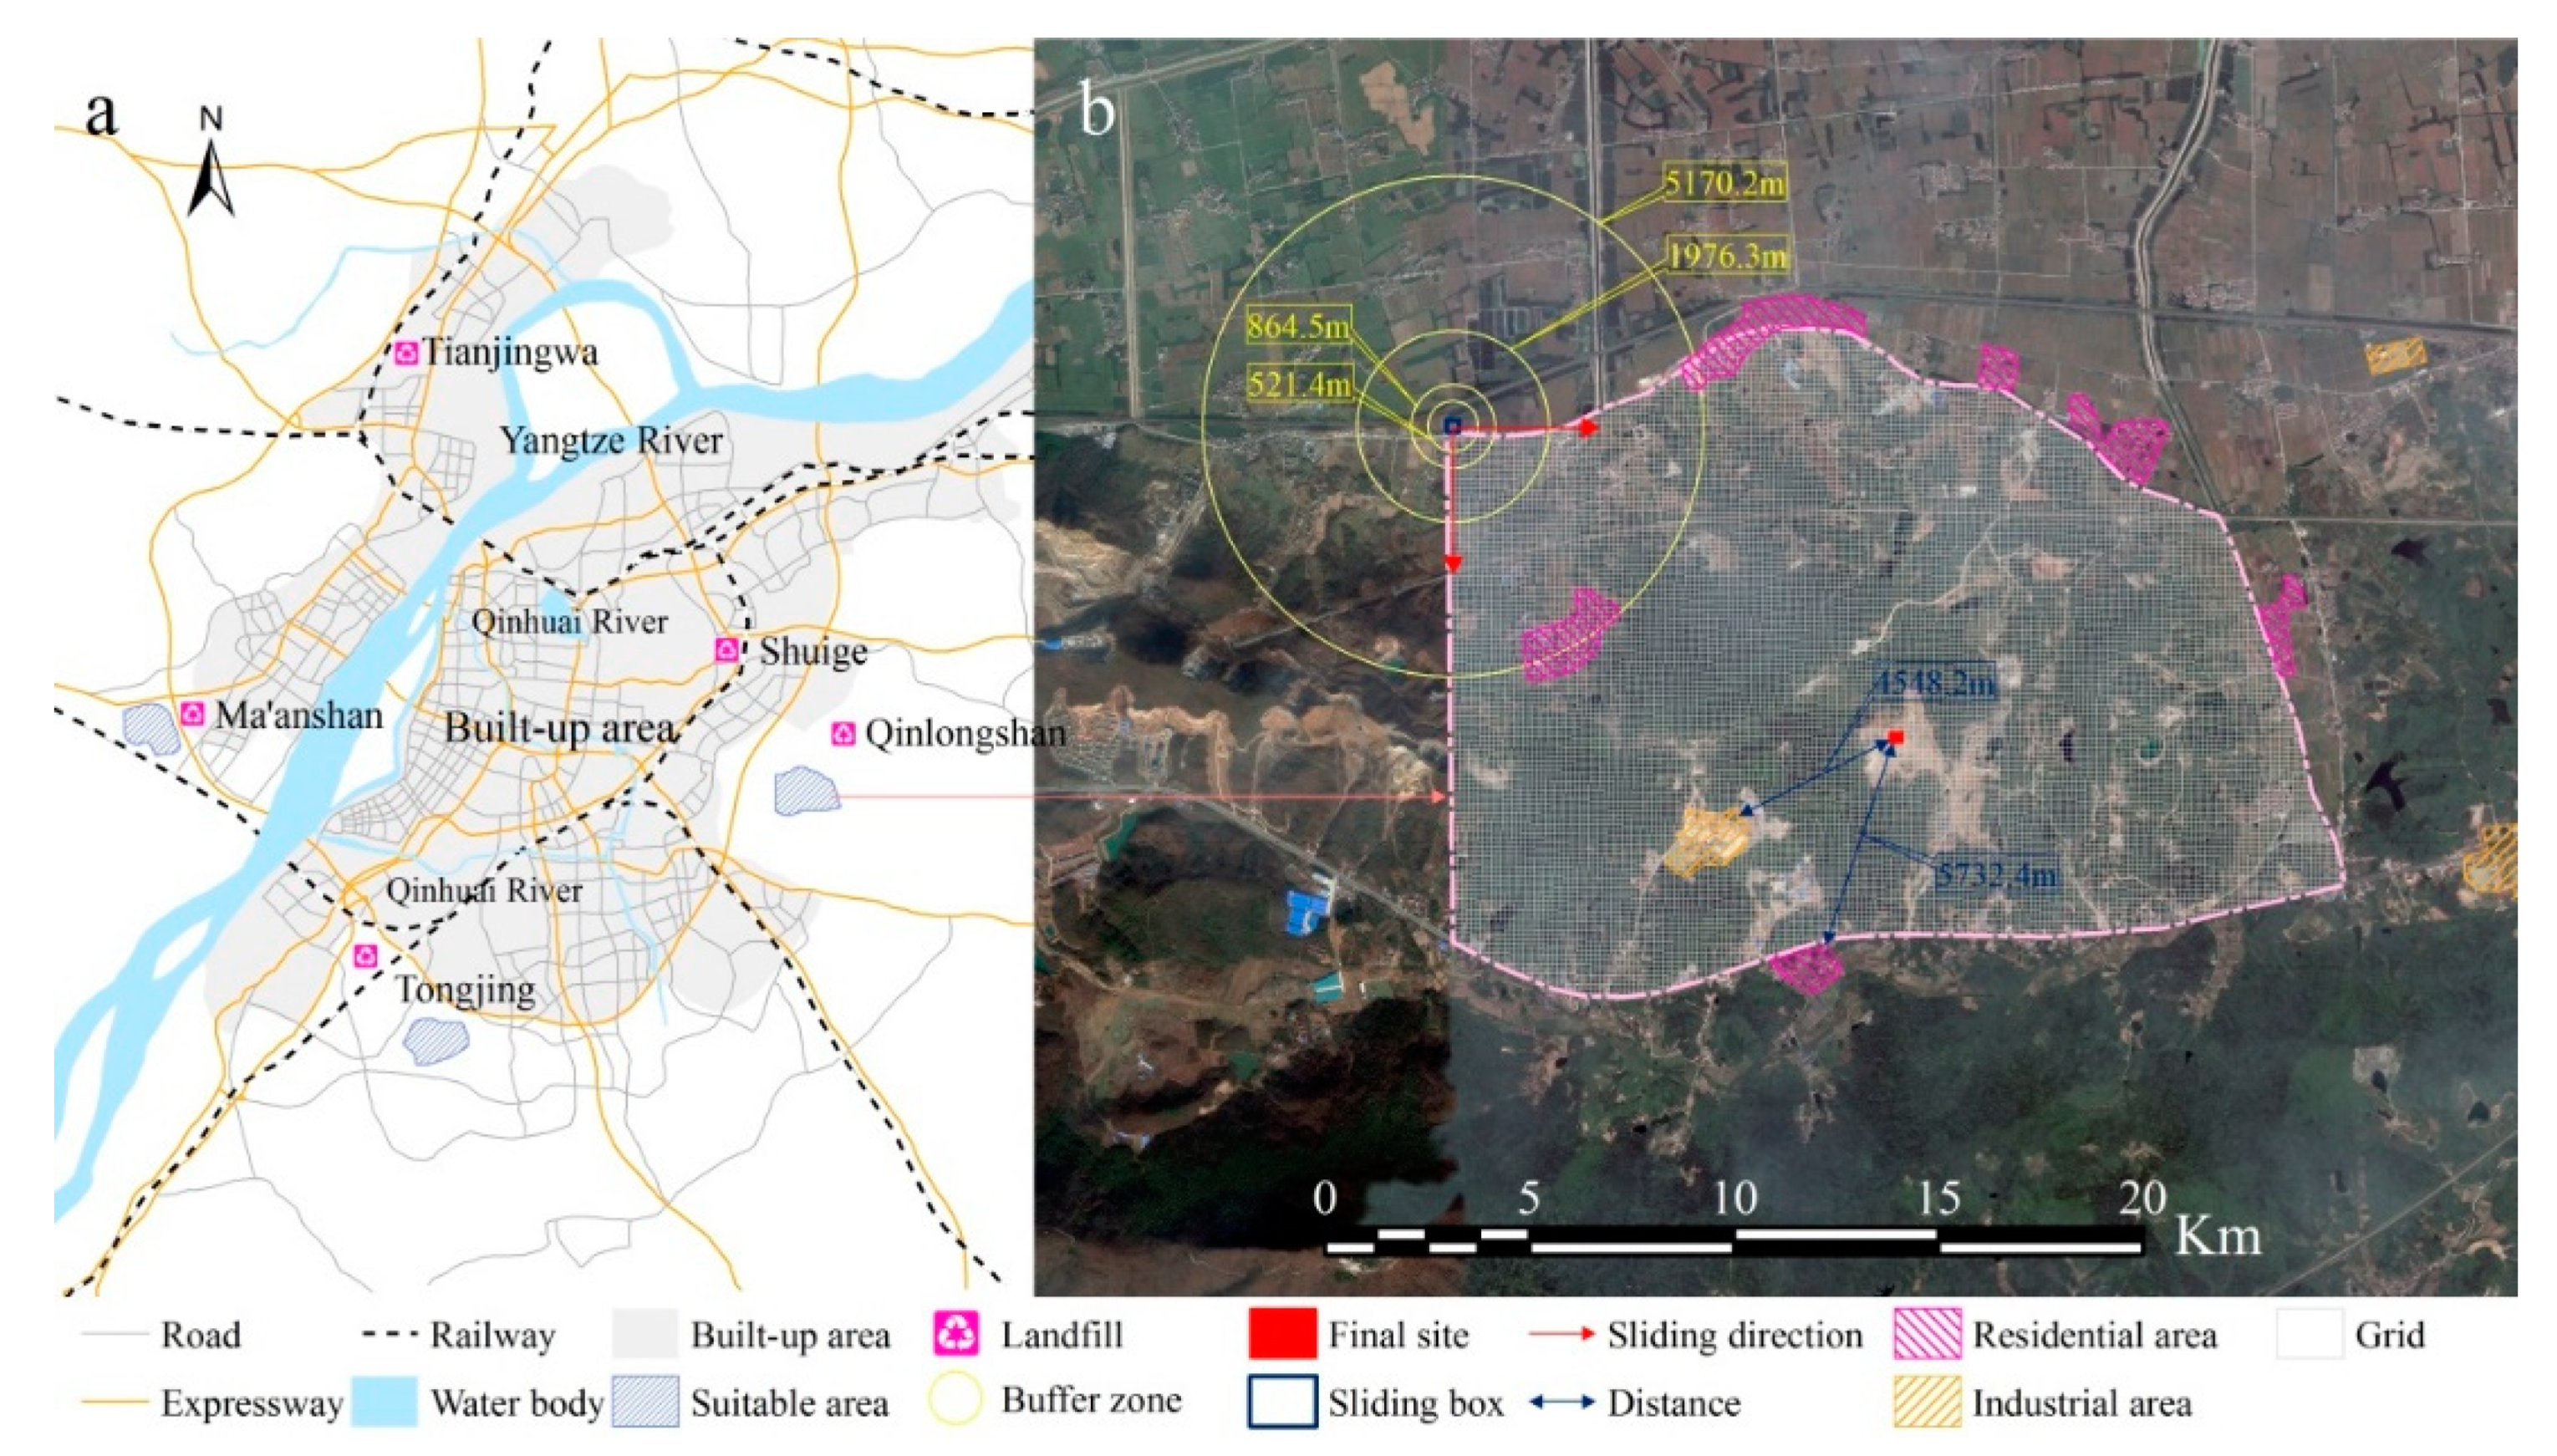
| Mean (m) | 521.4 | 864.5 | 1976.3 | 5170.2 |
| Standard deviation | 171.6 | 576.8 | 478.9 | 916.3 |
| Effective samples | 579.0 | 571.0 | 573.0 | 546.0 |
© 2019 by the authors. Licensee MDPI, Basel, Switzerland. This article is an open access article distributed under the terms and conditions of the Creative Commons Attribution (CC BY) license (http://creativecommons.org/licenses/by/4.0/).
Share and Cite
Chen, F.; Li, X.; Yang, Y.; Hou, H.; Liu, G.-J.; Zhang, S. Storing E-waste in Green Infrastructure to Reduce Perceived Value Loss through Landfill Siting and Landscaping: A Case Study in Nanjing, China. Sustainability 2019, 11, 1829. https://doi.org/10.3390/su11071829
Chen F, Li X, Yang Y, Hou H, Liu G-J, Zhang S. Storing E-waste in Green Infrastructure to Reduce Perceived Value Loss through Landfill Siting and Landscaping: A Case Study in Nanjing, China. Sustainability. 2019; 11(7):1829. https://doi.org/10.3390/su11071829
Chicago/Turabian StyleChen, Fu, Xiaoxiao Li, Yongjun Yang, Huping Hou, Gang-Jun Liu, and Shaoliang Zhang. 2019. "Storing E-waste in Green Infrastructure to Reduce Perceived Value Loss through Landfill Siting and Landscaping: A Case Study in Nanjing, China" Sustainability 11, no. 7: 1829. https://doi.org/10.3390/su11071829
APA StyleChen, F., Li, X., Yang, Y., Hou, H., Liu, G.-J., & Zhang, S. (2019). Storing E-waste in Green Infrastructure to Reduce Perceived Value Loss through Landfill Siting and Landscaping: A Case Study in Nanjing, China. Sustainability, 11(7), 1829. https://doi.org/10.3390/su11071829