Article

Residential Greenery: State of the Art and Health-Related Ecosystem Services and Disservices in the City of Berlin

1
Department of Agricultural, Forest and Food Sciences, University of Turin, Largo Paolo Braccini 2, 10095 Grugliasco (TO), Italy
2
Integrative Research Institute THESys Transformation of Human-Environment-Systems Humboldt-Universität zu Berlin, Unter den Linden 6, 10117 Berlin, Germany
*
Author to whom correspondence should be addressed.
Sustainability 2019, 11(6), 1815; https://doi.org/10.3390/su11061815
Submission received: 18 February 2019 / Revised: 20 March 2019 / Accepted: 23 March 2019 / Published: 26 March 2019

Abstract

:
Inclusively accessible green areas are essential for livable cities. The residential greenery on a door’s step of urban dwellers has rarely been the subject of research. Here we provide insights into the state of the art of residential greenery in Berlin, Germany. We focus on socially disadvantaged neighborhoods exposed to high loads of environmental stressors and belonging to four relevant building types of Central European cities. 32 plots in eight sample areas were randomly chosen and surveyed during 2017 and 2018. We surveyed the presence of structural elements, the presence and abundance of woody species and the health-related ecosystem (dis-)services (i.e., species’ air filtration and allergenic potential). We analysed the similarity among tree species to assess plant use patterns. The air cleaning and allergenic potential of woody species were assigned based on literature. In order to discuss strategies to improve residential greenery, we performed an analysis of strengths, weaknesses, opportunities and threats of these green spaces. We revealed a high dissimilarity of woody species assemblages across sites and within different building types, indicating no common plant use fashion. Recorded species provide moderate to high air filtering capacity. One to two third of all trees have a high allergenic potential that has to be addressed in future plant use decisions. Bike racks, benches, lights and playgrounds are common elements, whereas bioswales, facade-bound greening, atrium, fountains or ponds are rare. Their implementation can enhance the health and wellbeing of local residents. Building-attached greenery can improve densely built up areas of the Wilhelminian period, whereas space-intensive measures can be implemented in the spacious greenery of row–buildings settlements of the 1920s–1970s and of large housing estates of the 1970s–1980s. We revealed a high motivation for (co-)design and care by residents and discussed strategies on transformation towards multi-functional, healthy and biodiversity-friendly residential greeneries.

1. Introduction

The quality of the living environment, especially in urban areas, has become an important issue for residents and a fundamental theme in spatial planning [1]. Low quality of air, water, climate and the decreasing availability of green space per capita affect the physical and mental health of urban residents [2,3,4,5]. Consequently, urban planners and policymakers have to address easy access and high quality green areas as a part of common health promotion [5].
Contact with urban nature such as public parks fosters wellbeing and human health in cities [6,7]. Access to green space is associated with a greater probability of being physically active [5]. Moreover, species richness present in a green area and perceived by local people is positively linked to a greater connection with nature and a better site satisfaction [8]. If the environment is aesthetically appealing and space allows opportunities for gardening and for recreation, people are encouraged to visit it, improving social cohesion within the neighborhood, which in turn can generate beneficial effects on wellbeing [9,10]. In addition, trees provide several ecosystem services that contribute to increase human wellbeing and can mitigate the negative impacts of urbanization, e.g., [11,12]. Citizens seem to have a greater sense of community when more commonly shared green space is around their house [13]. Up to now urban planning has not taken the development of a city as a socio-ecological and macroeconomic system into proper consideration [14].
Urban greenery research generally focuses more on parks and public gardens [15,16,17], whereas the residential greenery has not been investigated. We defined residential greenery as mainly semi-public green spaces with direct connection to residential buildings, regularly created during the construction of the buildings with great importance for less-mobile people, for children and for after-work recreation [18].
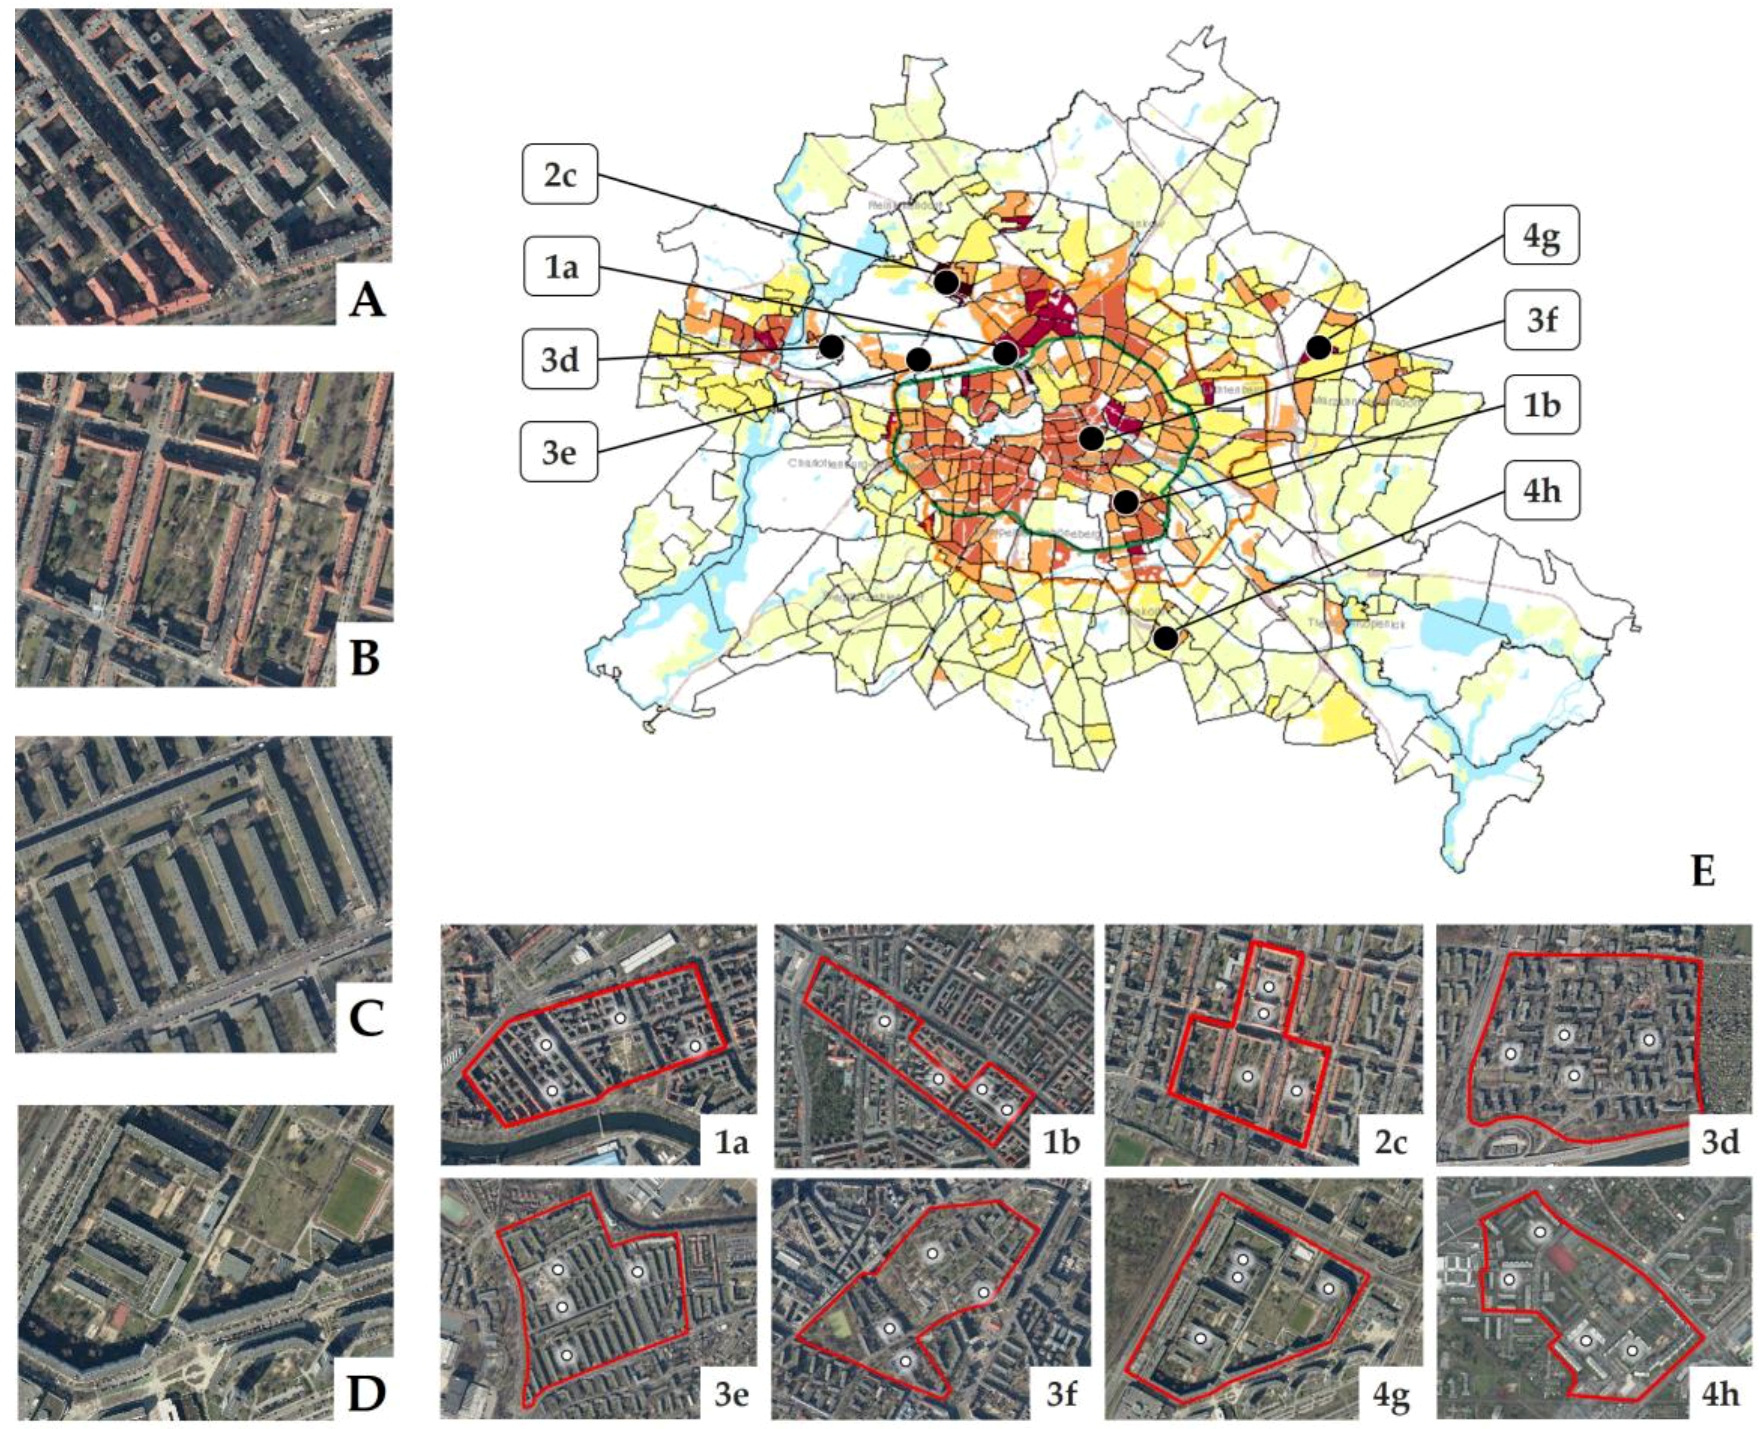
To close this research gap, our study focused on the residential greenery of the four most relevant building types in Berlin, which are also representative of other Central European cities. As quality of and access to local green affects mainly low-income people [19], we focused our analysis on disadvantaged neighborhoods in Berlin. Our objective was to provide a description of the status quo of the residential greenery. We focused on tree and shrub composition and the structural elements (e.g., benches, paths, parking areas) that determine health-related ecosystem services such as cooling and air filtering and foster physical activity and the wellbeing of residents. We also included the allergenic potential of the plants as a health-relevant disservice [20,21,22,23]. We explored the strengths, weaknesses, opportunities and threats (SWOT analysis) of residential greenery to develop general strategies to enhance health-relevant ecosystem services and social cohesion.

2. Materials and Methods

2.1. Study Area

Berlin, the capital of Germany, is the largest city in the country, with 3.65 million inhabitants [24]. It covers an area of approximately 892 km2, resulting in a population density of 4170 people/km2. Two thirds of the population are living in housing complexes of modernism of four different eras: 1. Five story block-edge development with cross buildings enclosing several courtyards (the classical Wilheminian tenements of the 1870s to 1920s, Figure 1A); 2. five story block-edge development with green courtyards (the reformed block edge developments of the 1920s to 1940s, Figure 1B); 3. up to five story row-buildings settlements of the 1920s to 1970s (Figure 1C); and 4. large multi-storied housing estates of the 1960s to 1980s (Figure 1D).
Berlin is widely acknowledged as a green city and meets the planning target of 6m2 of green space per inhabitant [25]. The city administration aims to face the increasing demand of affordable housing by intensified internal development and consolidation, leading to greater pressure towards urban green spaces within the city namely towards the semi-public residential greenery.

2.2. Study Design and Data Analysis

Firstly, we analysed the map of different building structures and selected all areas of the housing complexes of the four main construction eras in Berlin. Then, using the Berlin map on environmental justice [26], we assigned the health-relevant characteristics (i.e., air and noise pollution, bioclimatic stress, access to green space and social status) to these areas. The noise indicator estimates the average noise load. Bioclimatic stress is estimated by the thermal index PET (Physiologically Equivalent Temperature). Air pollution was determined by considering the highest level of PM2.5 or NO2. The access to green areas describes the availability of green spaces for a given housing block. The social status index is based on unpublished data from the Berlin monitoring on social urban development in 2013 and is calculated from the status indicators (i.e., unemployment and child poverty). Finally, we selected and characterized eight study areas with a low social status index, high levels of environmental stressors and low access to public green (Table 1 and Figure 1).
Single houses or flats within houses of the classical Wilheminian tenements are partially owned by natural persons, whereas the other areas are commonly owned and managed by different real estate companies. In contrast to other European countries, 86% of all apartments in Berlin are rented and not owned by the residents [27].
After defining eight study areas in Berlin, four sample plots were randomly chosen within those sites (Figure 1E). To exclude edge effects of neighboring public green spaces, we excluded sites where there are public green spaces situated at a distance of less than 500 m from the center of the housing blocks, which corresponds to five to ten minutes walking, and are, therefore, easily accessible to local residents. The sample plots correspond to the central space between two or more communicating building rows. The geometric shape of each sample was kept as simple as possible, following building edges, fences and paths. In each plot we accounted the structural elements of the residential greenery by field surveys: Number of green balconies, bioswales, laundry drying areas, ground-based and façade-bound greenery, atrium, fountains, ponds, parking areas, paths, playgrounds, bike racks, lights and benches.
We recorded the presence and abundance of tree species in each sample plot. Mature and newly transplanted trees were considered. We analyzed the degree of similarity among the tree species present in the eight sample areas, performing the Jaccard and the Bray-Curtis indexes, two widely used abundance-based similarity indexes [28]. For calculation we used the software Past 3.14 [29]. The Jaccard index (dJ) is related to the total number of species (presence/absence) that the sample areas have in common. For binary data, the absence is coded as 0 and the presence is coded as 1. When comparing two rows, a match is counted for all columns with presences in both rows. Past 3.14 uses M for the number of matches and N for the total number of columns with a presence in just one row; so that we have:
dJ = M/(M + N)
The Bray-Curtis index (dBC) is based on the abundance of species:
d B C = 1   i | x j i x k i | i ( x j i + x k i )
where xji represents the entry in the ith row and jth column of the data matrix. Similarly, xki is the count for the ith species in the kth sample.
The presence/absence of shrub species was also surveyed. The abundance was not calculated because shrubs were often found in large and dense planting areas with mixed species. The woody species seedlings (born spontaneously) were not considered as they are subjected to maintenance operations, such as the mowing of lawns. Lawns were always present in the sample plots, except for Sprengelkiez and Ideal-Passage Neukölln, as the general matrix of residential greenery. The field data collection was carried out from April to August 2017 and 2018.
We evaluated health-related ecosystem services of woody species based on a literature evidences analysis. Reference selection was carried out using the PRISMA Protocol [30]. Three search engines were used: PubMed, Web of Science and JSTOR. The keywords used were: “Tree” AND “Ecosystem Services” AND “City” AND “Health”. Taking into consideration the papers published in English in the last 20 years, 1466 titles and abstracts were analyzed. In total, 17 scientific papers have been selected to cover three categories of benefits provided by woody species in urban environments. Trees, depending on species, considerably remove air pollution (e.g., [4,8,14,31,32,33]). The main difference is between conifers (high capacity of air pollution removal) and broadleaf trees. The latter are divided into deciduous (moderate capacity) and evergreen (high capacity) trees (e.g., [31,32]). Bioclimatic stress is reduced by the shading and cooling of trees (e.g., [12,34,35,36]). In addition, trees provide a wide set of social benefits such as building a stronger sense of community, improving overall wellbeing and providing opportunities for residents to experience nature [11,37,38,39,40,41]. Ecosystem disservices, such as those related to the allergenic potential of trees, cannot be neglected [42,43,44,45].
Consequently, the surveyed woody species in the 32 sample plots were analyzed, assigning a level of allergenic and air pollution removal potential, based on the published literature.
In order to discuss the strengths, weaknesses, opportunities and threats of residential greenery and to point out the strategies to improve it, a SWOT/TOWS analysis was performed [18,46].

3. Results

3.1. Structural Elements and Woody Species Composition

Block-edge developments of the Wilhelminian era (Figure 1A) have the highest population density and lowest percentage of pervious surface compared with other types (Table 2). This results in the lowest availability of residentially greenery for local residents. In the following construction period of block-edge developments with large green backyards in the 1920s to 1940s (Figure 1B), half of the areas are unsealed. The percentage of pervious surface of the other building types is similar or higher than in this type (Table 1). Population density depends on the floor numbers and is higher in the large estates of Marzahn and in the row-building settlements of Mitte (Figure 1: 3f, 4g) than the other same-aged building types considered.
Green spaces are an integral part of a town and have characterized residential greenery since the 1920s (Table 2). Lawns were always present as the general matrix of residential greenery (except in Sprengelkiez and Ideal-Passage, both from the Wilhelminian era). We identified a set of elements almost present in the residential greenery of all construction periods including bike racks, benches, lights and playgrounds. The number of benches, bike racks and lights varied largely between the areas and depended on the average size of the sample plots (Table 2). The laundry drying areas, often present in Germany, were found in the study areas of Alte Jakob Str., Mitte and Marzahn. Bioswales were only located in the sampling area of Haselhorst. Some elements were not detected: Façade-bound greening, atriums, fountains and ponds.
The tree and shrub species richness was similar in all building types (Table 3). In the 32 sample plots, 60 species of plants were identified, with 523 trees sampled (Appendix A). The most common species were: Acer platanoides L., Betula pendula Roth, Quercus robur L. and Tilia cordata Mill. The rare species were: Corylus colurna L., Fagus sylvatica L., Alnus glutinosa (L.) Gaertn. and Celtis australis L. Considering the number of trees of each species in each sample plot, we could determine the most frequent tree species. In some cases, the presence of one common species (the number of individuals is at least double compared with the other species) was detected, such as Aesculus hippocastanum L. in one of the block-edge developments of the Wilhelminian era (i.e., Sprengelkiez Wedding) and Pinus sylvestris L. in the green spaces around the large housing estates of Gropiusstadt (Neukölln).
Regarding shrubs, the species richness varies between 6 and 10 among all building types (Table 3). The presence of the shrub species in the study areas is reported in Appendix B. In some cases, such as Carpinus betulus L., some species have been considered as shrubs for the function performed and the growing habit and dimensions. The most frequent species in the areas are Mahonia aquifolium (Pursh) Nutt. and Syringa vulgaris L. Table 4 reports the results of the Jaccard and Bray-Curtis indexes. The matrix similarity of abundance and presence of woody/tree species across different building types shows that there is no similarity, because the values are lower than 0.5 (0 means no similarity; 1 means full similarity). Even within the same building type (e.g., 1a and 1b), similarity is not detectable. Therefore, planting patterns of residential greenery do not follow common design lines, unlike the built parts.

3.2. Ecosystem Services and Disservices Provided by Trees in the Sample Areas

Starting from the census of all trees in the residential greenery, the air pollution removal potential and allergenic potential were calculated for each sample area and building type (see Appendix A for potential value for air removal and allergy found in literature for each species in the sample areas, and Table 5 for a general summary of those data). The air pollution removal potential and the allergenic potential have been attributed to each tree species of the 32 sample plots (93% of the species are represented, no specific data were found in the literature for the remaining 7%).
Of the tree species sampled, 79% had a moderate potential to remove air pollution (i.e., deciduous trees, which represented 75% of all individual trees). Paul-Hertz-Siedlung and Marzahn had the lowest percentage of species with a high potential to remove pollution. Over all sampled areas, all trees had a moderate to high potential to remove pollution (Table 5). Tree composition in the study area of Gropiusstadt was ranked best as 60% of the plants showed a high value due to the frequent use of conifers (Table 5). Air pollution in Gropiusstadt was considerably lower compared to other study areas also due to the position outside the inner city of Berlin (Table 1).
Regarding the allergenic potential of plants (i.e., an ecosystem disservice) in the 32 sample plots, 18 species had a high allergenic potential while 6 species had a very high allergenic potential (Table 5). Over all sampled areas, two thirds of all species and three quarters of all trees had a moderate to very high allergic potential (Table 5). Considering the number of plants, 31% had a moderate allergenic potential while 45% had a high or very high allergenic potential value. Analyzing the percentages of trees, it was noticeable that in areas of Sprengelkiez, Ideal-Passage in Neukölln and Marzahn, nearly half or more of the trees (48%, 63%, and 62% respectively) had a high or very high allergenic potential. Lower allergenic potential was detected in General Barby Siedlung, Haselhorst and Marzahn (34%, 30% and 30% respectively).

3.3. Results of the SWOT Analysis

We detected the following strategies to address the strengths, opportunities, weaknesses and threats of the residential greenery across all our sample plots. Up to now green spaces have been designed and maintained in top down approaches by planners and gardeners of the real estate companies. Thus, green spaces invite residents to stay and use, but not to participate in the design and maintenance processes. Here, co-creation of the ongoing optimization processes is a helpful strategy to involve local citizens, foster the responsibilities of local residents to enhance welcoming qualities and care for the adaptations of greenery to changed needs (Table 6).
We identified strategies to improve the residential greenery (Table 6) considering external (threats and opportunities) and internal (weaknesses and strengths) factors of the residential greenery of our study areas, resulting in a strategy based on four different combinations [47].

4. Discussion

The residential greenery in the past has often been considered as the empty space between buildings or an area for ornamental purposes, rather than a green area with multiple functions serving the wellbeing of local residents. 
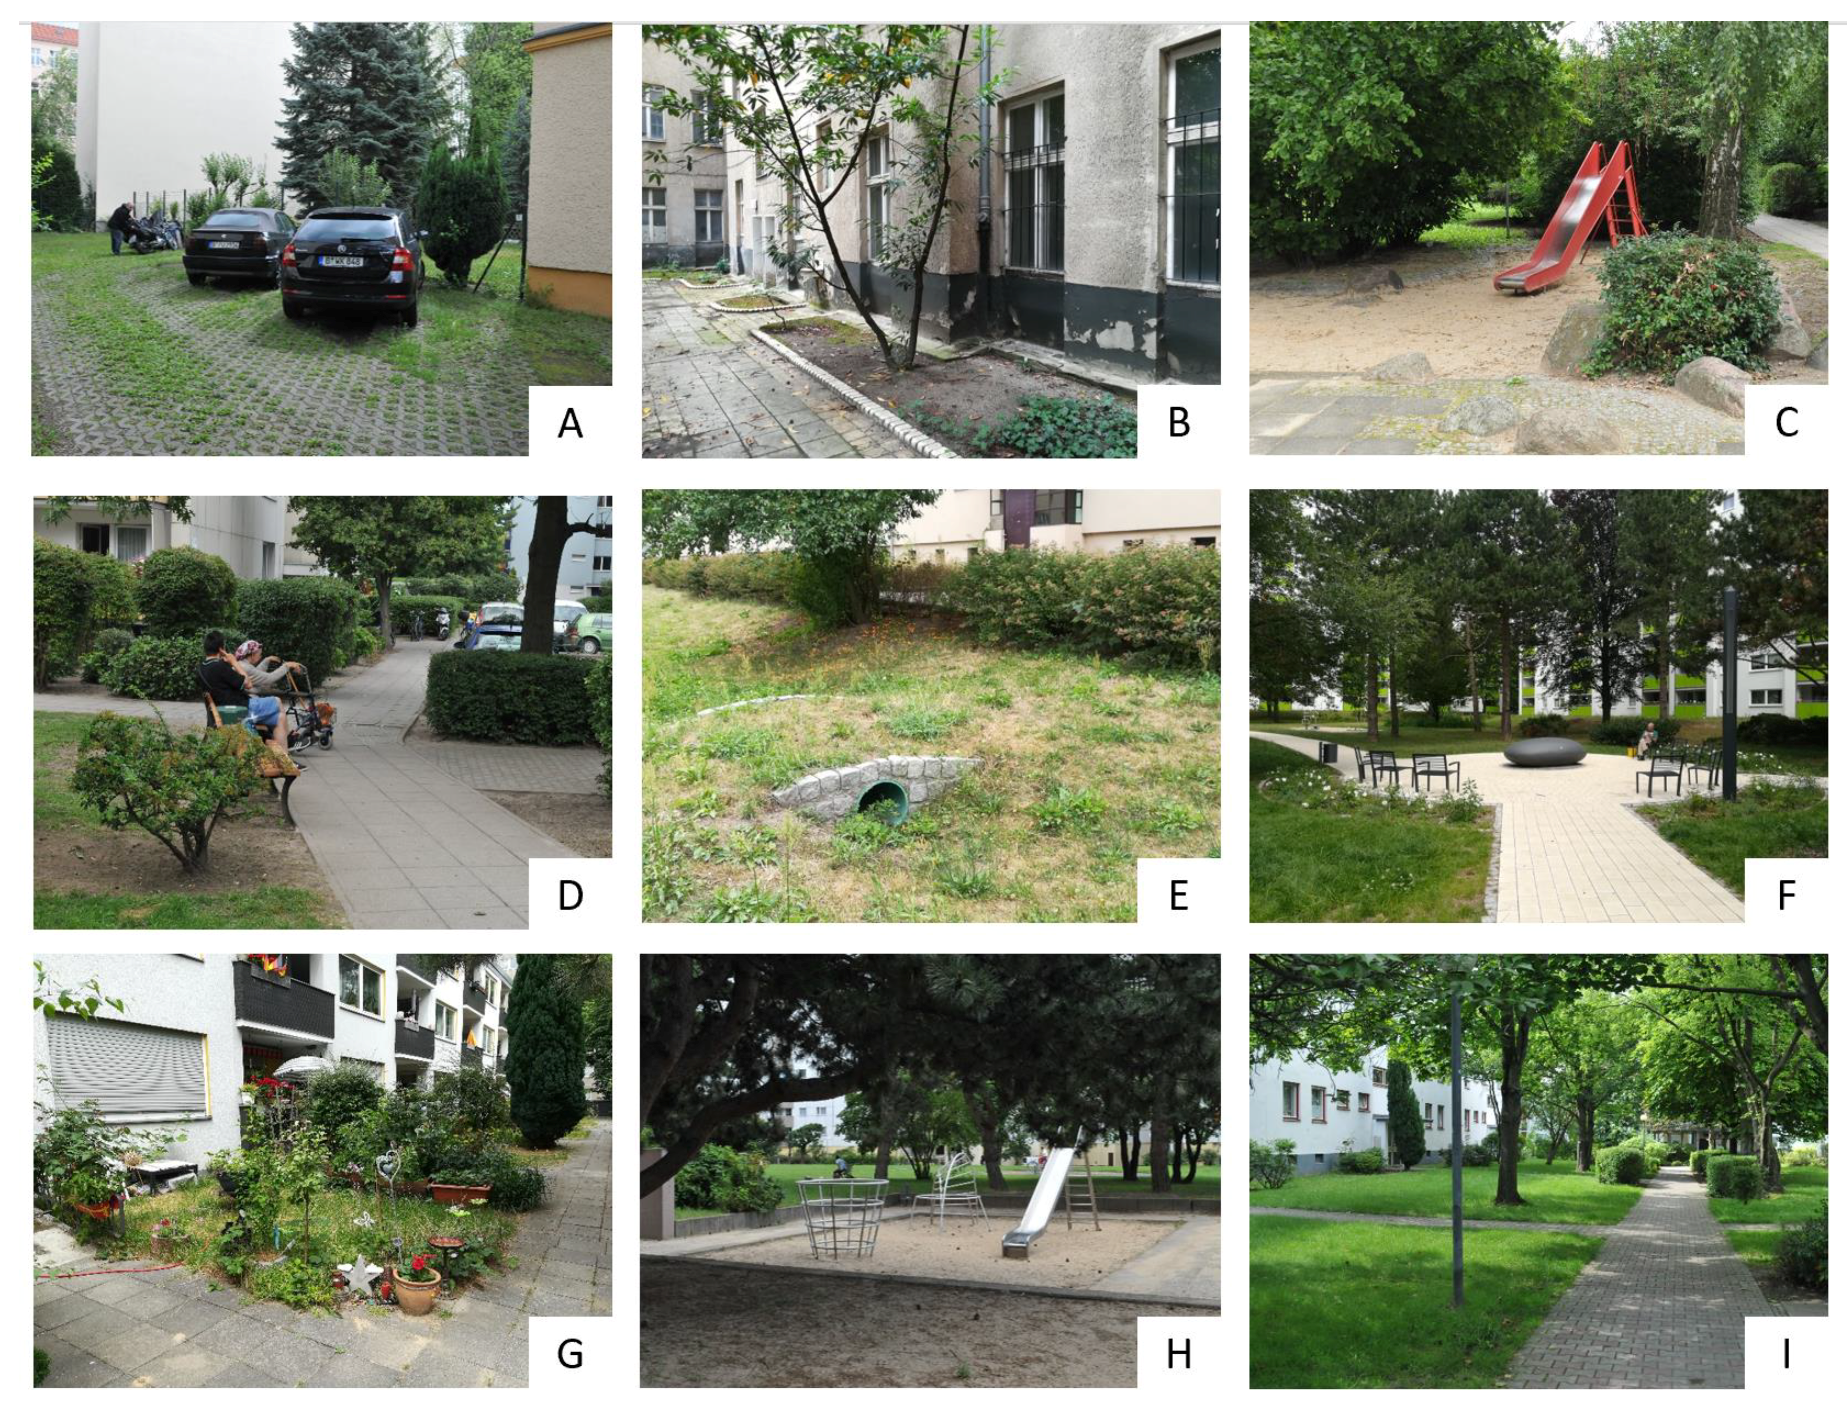
Figure 2 shows the main elements of the residential greenery in the study areas. It is mainly determined by design and plant use choices. Interestingly, we found no similarity in terms of abundance and presence of woody species within residential greenery (Table 3). Even within the same building type, similarity i low. The planting patterns of residential greenery do not follow common design guidelines or maintenance practices when individual trees or shrubs are replaced. We detected a largely unused potential to enhance health effects of residential greenery by a predominant use of woody species that provide health-relevant ecosystem services.
In general, urban trees in our study areas provide moderate to high benefits by absorbing air pollution. Evergreens and conifers play an important role in this regard [31,32]. Across all sampling sites, we revealed that one to two thirds of all trees have a high to very high allergenic potential (Table 5). Their presence, growth and management must be considered at the planning phase to maximize the provision of ecosystem services and to reduce potential disservices [23,42,43,44]. Instead of an increasing body of literature on health impacts of allergenic plants in urban areas [48,49,50], this topic has been scarcely considered in public or semi-public green area design. A plant use guide for residential greenery will assist real estate companies and managers of residential greenery to address this issue. High allergenic species such as Alnus glutinosa (L.) Gaertn., Betula pendula Roth, Carpinus betulus L., Corylus colurna L., Cupressus sempervirens L., Fagus sylvatica L., Fraxinus excelsior L., Morus alba L., Quercus robur L. and Ulmus laevis Pall. have to be avoided in these green spaces.
In the classic buildings of the Wilhelminian period in Germany (1870s to 1920s), different building laws and economic factors led to a perimeter block development without a noteworthy open-space structure and almost no living environment. The typical late 19th century courtyards in Berlin, with several backyards, used as traffic and storage areas, formed an almost complete overbuilding of the inner city. The residential greenery in the block-edge developments of the Wilhelminian area is smaller than in the other areas studied. Over 500 inhabitants are living in these areas per hectare with low access to public greenery, high air pollution and high bioclimatic stress. Eighty per cent of the surface is sealed (Table 1). The main elements of this era were street trees and some trees and shrubs in the small backyards. Commonly, the presence of plants is limited to a few individuals, however the number of trees per area is not significantly different from the other areas. Only a few benches, lights, playgrounds or paths were found mainly due to the small size of greenery (Table 2); however, the number of bike racks demonstrates that the use of bicycles and related physical activity is very common in Berlin’s inner city districts. The number of balconies is low compared to other areas and 43% of them are greened by residents. Due to the lack of open space, we identified the need for the implementation of building-attached green (e.g., green wall measures, green roof or pervious parking areas, Figure 2B). Installing some more benches could provide meeting points in the small green realms of these densely over-built areas.
Occasionally socio-political cooperatives implemented reform ideas of green block courtyards at the beginning of the 20th Century (e.g., study area in Reinickendorf and Figure 1A). At the end of the First World War, there was a lack of housing and a promotion of small residential complexes with gardens (1924). In that historical period there was the need to ensure ‘air and light’ for all residents, creating a free space in the housing area and pouring into the building of row constructions. The quantity and the quality depended on whether the land for the settlement was owned by the city or not, and on the level of involvement of builders and planners in the surrounding green spaces [18]. The residential greenery in these modernist settlements of the 1920s contrasts sharply with the Wilhelminian period. The percentage of unsealed surface increased (e.g., 49% in Reinickendorf, Table 1). Both the tenants’ gardens and the shared lawns were present, along with different structural elements such as laundry areas, playgrounds, paths and seating areas. Our study area in Reinickendorf presents a great diversity of woody species; real estate companies there pay particular attention to the maintenance of residential greenery. The number of balconies and number of benches increased manifold in this building type (Table 2). Seventy-five per cent of the balconies are greened by the residents. Due to the large size of the greenery, elements such as bioswales or ponds can be implemented, enhancing biodiversity, providing cooling effects and functioning for effective stormwater management.
The construction of multi-storey housing in the 1920s–1970s (e.g., sample areas of Paul Hertz Siedlung, Haselhorst and Mitte) was linked to modernist settlement ideas [18]. The row-building settlements were built loosely and criss-crossed by green spaces, where the inhabitants could walk and enjoy greenery on different paths. More than the half of the areas remain unsealed and the number of inhabitants per hectare is low (Table 1). The design of open spaces followed mainly two different ideas of parceling as tenants or the design of the area as a “park landscape”. Tenant gardens were seen as a way to save costs of land care, a way of self-sufficiency of the inhabitants (especially after the Second World War) and as recreational areas [18]. The buildings have a high number of balconies often greened by residents (Table 2). The residential greenery in the study areas of Haselhorst and Mitte does not present particular plant composition, but offers ample space to spend pleasant moments, especially during the summer. Paul Hertz Siedlung holds a greater diversity of plant species compared to the other two study areas of this era (Table 2). Bioswales are implemented in one of our sample plots in Haselhorst.
The largest areas of residential greenery with integrated gardens, playgrounds and benches are typical for large housing estate of the 1960s to 1980s; however, welcoming qualities have been questioned as they were mostly designed from the perspective of architects and not of local residents [10]. Real estate companies in Berlin Hellersdorf and Hohenschönhausen (both neighboring quarters of Marzahn) addressed this with the successful implementation of gardens attached to the buildings, where local residents can co-design their private planting lot within the semi-public green spaces [51]. Recently the companies of Gropiusstadt invested money in the reconstruction of some gardens.
In general, the residential greenery has an easy access for residents and invites to relate and communicate with neighbors. It is possible to enjoy the benefits of urban nature directly on the doorstep. Almost all residential greeneries examined in this study have a high diversity of tree and shrub composition. Parking lots and garages are rarely present, leaving space for lawns and ornamental plants. Up to now, only a few ground-based greening and bioswales were implemented (i.e., Haselhorst, Table 2). The laundry-drying areas, elements historically present in the residential greenery in Germany, unfortunately disappeared with the technical development of washing machines with dryers and today can be found as relicts in the study areas of Mitte/Alte Jakob Str. and Marzahn. The playgrounds are fairly distributed in the sites and are generally in good condition.
Paths especially designed to enhance physical activities, such as bare foot paths or devices for sport and physical exercises beyond classical play grounds are missing. Bike racks are common elements of all sample areas, but residents’ demands in the sample plots are often higher. This leads to an accumulation of bicycles on the corners of the green areas, especially in the block-edge developments of the Wilhelminian area. To enhance the adaptability of residential greenery to changing residents’ needs, multifunctionality of these areas has to be fostered also including the organization of social and sport activities with the aim to improve the fruition of those spaces.
The current state in residential greeneries, however, demonstrates the (partially) small size and high fragmentation of these green areas. Sometimes, if not designed and managed with care, the residential greenery does not have high welcoming qualities (i.e., Marzahn, Haselhorst). Usage conflicts (e.g., parking and dumpsters versus leisure and pleasure) are also evident for the residential greenery. Finally, these green spaces are perceived predominantly as a functional space for parking and waste management rather than as a space for recreation, physical activities, education or to come together with neighbors. Thus, our field survey highlighted these conflicts within usage among local citizens. As an example, while some enjoy using the residential greenery with their children, older neighbors complain about the noise generated.
The possibility of implementing residential greenery, enhancing the supply of ecosystem services and improving the wellbeing of the inhabitants are many. Among the elements that can be implemented, worthy of note are the green walls, which can help to increase the level of biodiversity and reduce the urban heat island effect [52,53]. This improves the aesthetic quality of the residential greenery, encouraging residents to stay longer in the area.
Residential greenery has a high re-naturation potential (i.e., using nature-based solutions) and there is a current trend that invites urban gardening activities. All this means it is useful to have new urban realms for urban biodiversity and to respond to the need to create resilient neighborhoods by increasing the identity of the place and its security, while creating a strong sense of community. The image of the residential greenery will change by visible transformations that are more accepted and used and better maintained when residents are invited to co-create their green spaces on their door steps in bottom-up processes, rather than in top down designs. There is the fear of contact with neighbors or an initial difficulty in relationships due to social and cultural barriers. Moreover, the poor maintenance and care of the residential greenery can return as a negative image of the place, which can lead to an increase in vandalism. The responsibilities and especially the initial costs of building and managing such green areas are high, potentially implying the green gentrification [54,55]. We also revealed evidence for a high motivation for (co-)design and care by residents with reimbursement effects also for the housing estate companies (i.e., General-Barby Str.).

5. Conclusions

Residential greenery is an essential and low cost tool to enhance sustainable social cohesion and the health and wellbeing of local residents. Here, we analyzed the state of the art of residential greenery in disadvantaged neighborhoods of Berlin considering structural elements, woody species and its health-related ecosystem services and disservices. These green areas are impressively significant within the city, both for their accessibility to the local population and for their contribution to the biodiversity of Berlin’s greening. Our results highlight the extremely differentiated character of residential greenery among different neighborhoods and within the same neighborhood. We identified strategies to foster health relevant ecosystem services, physical activity and wellbeing of residents. Health-adapted plant use guidelines have to consider the allergenic potential of ornamental plants and the enhancement of cooling and air-filtering effects. Moreover, it is crucial to enhance welcoming qualities and the motivation to be physically active (e.g., by implementation of structural elements such as bike racks, barefoot paths or sport devices). The multifunctionality of residential greenery has to be fostered to maximize the adaptability to diverse and changing residents’ needs across different cultures and generations. Moreover, there is a high motivation for co-creation of inclusive green spaces and care by residents on their door-step with long-term reimbursement effects also for the housing estate companies. The same approach can be used in other cities, focusing on wellbeing and the willingness of residents to improve the state of green areas. Design and management of residential greenery requires an inclusive multi-stakeholder approach, a cross-sectoral integration of existing knowledge from sociology, planning, ecology, agronomy, landscape architecture and urban planning, among others. These needs, which can no longer be postponed, must be addressed from a socio-ecological point of view in order to increase urban wellbeing conditions for the future generations.

Author Contributions

Conceptualization, I.S.; methodology, I.S., L.B. and L.P.; software, L.B. and L.P.; validation, I.S., T.W. and F.L.; formal analysis, L.B.; investigation, L.B., L.P. and T.W.; resources, I.S.; data curation, L.B. and L.P.; writing—original draft preparation, L.B. and L.P.; writing—review and editing, I.S., F.L., T.W. and L.B.; visualization, F.L.; supervision, I.S. and F.L.; project administration, I.S.; funding acquisition, I.S.

Funding

This research was funded by Fritz and Hildegard Berg Stiftung in the Deutscher Stifterverband, “HealthyLiving-Strategie und Planungsinstrument für gesundheitsförderndes Wohnumfeldgrün in der Stadt der Zukunft”.

Acknowledgments

We thank our Healthy Living research team members Sylvia Butenschön, Frederike Büttner, Ewelina Skulimowska, Sonja Mohr Stockinger, Jan Hogrefe, Hannah-Lea Schmid and Lea Matscheroth for field assistance and fruitful discussion on health-related ecosystem services of residential greenery. We thank the reviewers for their helpful suggestions to improve the manuscript.

Conflicts of Interest

The authors declare no conflict of interest. The funders had no role in the design of the study, in the collection, analysis or interpretation of data, in the writing of the manuscript or in the decision to publish the results.

Appendix A

Table A1. List, number, air pollution removal potential (modified by [31,32]) and allergenic potential (modified by [42,43,45,48], 93% of tree species are represented) of all woody and tree species sampled in the 32 sample plots divided by building type. Building types: Block-edge developments (Type I: Without large green backyards of the 1870s–1920s; Type II: With large green backyards of the 1920s–1940s); row-building settlements of the 1920s–1970s; and large housing estates of the 1970s–1980s. Neighborhood codes: 1a, Sprengelkiez, Wedding; 1b, Ideal-Passage, Neukölln; 2c, General Barby Siedlung, Reinickendorf; 3d, Paul-Hertz-Siedlung, Charlottenburg; 3e, Haselhorst, Spandau; 3f, Alte-Jakobstrasse, Mitte; 4g, Marzahn; and 4h, Gropiusstadt, Neukölln.
Number of Trees per Sample AreaTotal Number of Trees Across Sampled Areas
Building TypesBlock-Edge DevelopmentsRow-Building SettlementsLarge housing ESTATESAllergenic PotentialAir Pollution Removal Potential
Type IType II
Species1a1b2c3d3e3f4g4h
Abies alba Mill.1040021311lowhigh
Acer campestre L.101003005moderatemoderate
Acer negundo L.0022314012moderatemoderate
Acer platanoides L.306244121041highmoderate
Acer platanoides ‘Crimson King’000100001highmoderate
Acer pseudoplatanus L.0200008313highmoderate
Acer saccharinum L.000100001moderatemoderate
Aesculus hippocastanum L.6110124318moderatemoderate
Ailanthus altissima (Mill.) Swingle000300003highmoderate
Alnus glutinosa (L.) Gaertn.010000102highmoderate
Betula pendula Roth022046022357very highmoderate
Betula utilis D.Don001000001highmoderate
Carpinus betulus L.0001129215very highmoderate
Carpinus betulus ‘pyramidalis’000000606-moderate
Castanea sativa Mill.002000002moderatemoderate
Catalpa bignonioides Walter010000124highmoderate
Celtis australis L.000002002highmoderate
Citrus spp.010000001lowhigh
Corylus colurna L.000100001very highmoderate
Crataegus monogyna Jacq.008000008lowmoderate
Cupressus sempervirens L.003000003very highhigh
Eriobotrya japonica (Thunb.) Lindl.000000303lowhigh
Fagus sylvatica L.010000001very highmoderate
Fagus sylvatica ‘atropurpurea’000000033-moderate
Fraxinus excelsior L.200000103very highmoderate
Ginkgo biloba L.000200002moderatemoderate
Gleditsia triacanthos L.000000202lowmoderate
Ilex aquifolium ‘J.C. van Tol’00150000015-high
Juglans regia L.211000105highmoderate
Malus domestica (Borkh.) Borkh.001500006lowmoderate
Morus alba L.000100001highmoderate
Picea glauca (Moench) Voss000100102lowhigh
Pinus nigra J.F. Arnold000030003moderatehigh
Pinus sylvestris L.20000424654moderatehigh
Pinus strobus L.0080600014moderatehigh
Populus alba L.000004004moderatemoderate
Populus nigra ‘Italica’001000001highmoderate
Populus tremula L.000000404-moderate
Prunus avium L.2133501116lowmoderate
Prunus cerasifera Ehrh.002040107lowmoderate
Prunus domestica L.010000001lowmoderate
Prunus persica (L.) Batsch000010001lowmoderate
Prunus cerasifera ‘pissardii nigra’001013308lowmoderate
Prunus serotina Ehrh.00000014014lowmoderate
Pseudotsuga menziesii (Mirb.) Franco000100506lowhigh
Quercus robur L.30210235245highmoderate
Quercus robur ‘fastigiata’000110002highmoderate
Quercus rubra L.000000101highmoderate
Rhus typhina L.000000101lowmoderate
Robinia pseudoacacia L.01130253024moderatemoderate
Salix caprea L.000000101highmoderate
Salix matsudana ‘contorta’100002003highmoderate
Sorbus aucuparia L.001000001lowmoderate
Sorbus intermedia (Ehrh.) Pers.000000202lowmoderate
Styphnolobium japonicum (L.) Schott 0008000513moderatemoderate
Taxus baccata L.1220051213highhigh
Thuja orientalis (L.) Franco100000001lowhigh
Tilia americana L.010000001lowmoderate
Tilia cordata Mill.001301511030lowmoderate
Ulmus laevis Pall.000010102highmoderate
Mean ± SD
Tree species richness121323171515311317±6

Appendix B

Table A2. Presence/absence of shrub species and shrub species richness in the study areas. N: Number of sample areas with species presence. Building types: Block-edge developments (Type I: Without large green backyards of the 1870s–1920s; Type II: With large green backyards of the 1920s–1940s); row-building settlements of the 1920s-1970s and large housing estates of the 1970s–1980s. Neighborhood codes: 1a, Sprengelkiez, Wedding; 1b, Ideal-Passage, Neukölln; 2c, General Barby Siedlung, Reinickendorf; 3d, Paul-Hertz-Siedlung, Charlottenburg; 3e, Haselhorst, Spandau; 3f, Alte-Jakobstrasse, Mitte; 4g, Marzahn; and 4h, Gropiusstadt, Neukölln.
Presence (+) of Shrubs Species
Building TypesBlock-Edge DevelopmentsRow-Building SettlementsLarge Housing Estates
Type IType II
Shrub Species1a1b2c3d3e3f4g4hN
Berberis darwinii Hook. + 1
Berberis thunbergii ‘atropurpurea’ + 1
Camelia japonica L. + 1
Carpinus betulus L. +1
Cornus alba ‘elegantissima’ + 1
Cornus kousa Buerger ex Miq. + 1
Cornus mas L. + 1
Ligustrum ovalifolium Hassk. +1
Photinia x fraseri + 1
Spiraea japinoca L. + 1
Cotoneaster dammeri C.K. Schneid + 1
Cupressocyparis leylandii (Dallim. & A.B. Jacks.) Dallim. + 1
Wisteria sinensis (Sims) Sweet + 1
Hibiscus spp. +1
Ilex aquifolium L. + 1
Pittosporum tobira Thunb.) W.T. Aiton+ 1
Lonicera nitida E.H. Wilson + + 2
Partenocissus quinquefolia (L.) Planch. ++ 2
Rhododendron spp.+ +2
Corylus avellana L. + + + 3
Berberis thunbergii DC. + + +3
Kerria japonica (L.) DC. + ++ 3
Parthenocissus tricuspidata (Siebold & Zucc.) Planch. + + +3
Juniperus spp. + +++4
Crataegus oxyacantha L. +++ +4
Hedera helix L.++ + + 4
Sambucus nigra L. + + ++ 5
Prunus laurocaerasus L.++ +++ 5
Mahonia aquifolium (Pursh) Nutt.+ ++++++7
Syringa vulgaris L.+ ++++++7
Mean ± SD
Shrub species richness68988109109±1

References

  1. De Vries, S.; Verheij, R.A.; Groenewegen, P.P.; Spreeuwenberg, P. Natural Environments—Healthy Environments? An Exploratory Analysis of the Relationship between Greenspace and Health. Environ. Plan. A Econ. Space 2003, 35, 1717–1731. [Google Scholar] [CrossRef] [Green Version]
  2. Klompmaker, J.O.; Hoek, G.; Bloemsma, L.D.; Gehring, U.; Strak, M.; Wijga, A.H.; van den Brink, C.; Brunekreef, B.; Lebret, E.; Janssen, N.A.H. Green space definition affects associations of green space with overweight and physical activity. Environ. Res. 2018, 160, 531–540. [Google Scholar] [CrossRef]
  3. Villeneuve, P.J.; Jerrett, M.; Su, J.G.; Weichenthal, S.; Sandler, D.P. Association of residential greenness with obesity and physical activity in a US cohort of women. Environ. Res. 2018, 160, 372–384. [Google Scholar] [CrossRef] [PubMed]
  4. Nowak, D.J.; Hirabayashi, S.; Doyle, M.; McGovern, M.; Pasher, J. Air pollution removal by urban forests in Canada and its effect on air quality and human health. Urban For. Urban Green. 2018, 29, 40–48. [Google Scholar] [CrossRef]
  5. Picavet, H.S.J.; Milder, I.; Kruize, H.; de Vries, S.; Hermans, T.; Wendel-Vos, W. Greener living environment healthier people? Prev. Med. 2016, 89, 7–14. [Google Scholar] [CrossRef] [PubMed]
  6. Aerts, R.; Honnay, O.; Van Nieuwenhuyse, A. Biodiversity and human health: Mechanisms and evidence of the positive health effects of diversity in nature and green spaces. Br. Med. Bull. 2018, 127, 5–22. [Google Scholar] [CrossRef] [PubMed]
  7. Kowarik, I.; Bartz, R.; Brenck, M. (Eds.) Ökosystemleistungen in der Stadt—Gesundheit Schützen und Lebensqualität Erhöhen; TEEB.de—Naturkapital Deutschland. Technische Universität Berlin, Helmholtz-Zentrum für Umweltforschung—UFZ: Berlin/Leipzig, Germany, 2016; Available online: https://www.ufz.de/export/data/global/190508_TEEB_DE_Stadtbericht_Langfassung.pdf (accessed on 15 April 2018).
  8. Sicard, P.; Agathokleous, E.; Araminiene, V.; Carrari, E.; Hoshika, Y.; De Marco, A.; Paoletti, E. Should we see urban trees as effective solutions to reduce increasing ozone levels in cities? Environ. Pollut. 2018, 243, 163–176. [Google Scholar] [CrossRef] [PubMed]
  9. Ekkel, E.D.; de Vries, S. Nearby green space and human health: Evaluating accessibility metrics. Landsc. Urban Plan. 2017, 157, 214–220. [Google Scholar] [CrossRef]
  10. Gehl, J. Cities for People; Island Press: Washington, DC, USA, 2010; ISBN 978-1597265737. [Google Scholar]
  11. Roy, S.; Byrne, J.; Pickering, C. A systematic quantitative review of urban tree benefits, costs, and assessment methods across cities in different climatic zones. Urban For. Urban Green. 2012, 11, 351–363. [Google Scholar] [CrossRef] [Green Version]
  12. Russo, A.; J Escobedo, F.; Zerbe, S. Quantifying the local-scale ecosystem services provided by urban treed streetscapes in Bolzano, Italy. AIMS Environ. Sci. 2016, 3, 58–76. [Google Scholar] [CrossRef]
  13. Cox, D.T.C.; Shanahan, D.F.; Hudson, H.L.; Fuller, R.A.; Gaston, K.J. The impact of urbanisation on nature dose and the implications for human health. Landsc. Urban Plan. 2018, 179, 72–80. [Google Scholar] [CrossRef]
  14. Kroeger, T.; McDonald, R.I.; Boucher, T.; Zhang, P.; Wang, L. Where the people are: Current trends and future potential targeted investments in urban trees for PM 10 and temperature mitigation in 27 U.S. Cities. Landsc. Urban Plan. 2018, 177, 227–240. [Google Scholar] [CrossRef]
  15. Bowler, D.E.; Buyung-Ali, L.; Knight, T.M.; Pullin, A.S. Urban greening to cool towns and cities: A systematic review of the empirical evidence. Landsc. Urban Plan. 2010, 97, 147–155. [Google Scholar] [CrossRef]
  16. Haase, D.; Larondelle, N.; Andersson, E.; Artmann, M.; Borgström, S.; Breuste, J.; Gomez-Baggethun, E.; Gren, Å.; Hamstead, Z.; Hansen, R.; et al. A Quantitative Review of Urban Ecosystem Service Assessments: Concepts, Models, and Implementation. AMBIO 2014, 43, 413–433. [Google Scholar] [CrossRef] [Green Version]
  17. Hegetschweiler, K.T.; de Vries, S.; Arnberger, A.; Bell, S.; Brennan, M.; Siter, N.; Olafsson, A.S.; Voigt, A.; Hunziker, M. Linking demand and supply factors in identifying cultural ecosystem services of urban green infrastructures: A review of European studies. Urban For. Urban Green. 2017, 21, 48–59. [Google Scholar] [CrossRef] [Green Version]
  18. Säumel, I.; Butenschön, S. HealthyLiving: Strategie und Planungsinstrument für Gesundheitsförderndes Wohnumfeldgrün in der Stadt der Zukunft; Edition Nachhaltige Gesundheit in Stadt und Region/Sustainable Urban & Regional Health Bd.1: “Stadt der Zukunft—Nachhaltig und gesund” Hg.; Oekom: München, Germany, 2018. [Google Scholar]
  19. Apparicio, P.; Pham, T.-T.-H.; Séguin, A.-M.; Dubé, J. Spatial distribution of vegetation in and around city blocks on the Island of Montreal: A double environmental inequity? Appl. Geogr. 2016, 76, 128–136. [Google Scholar] [CrossRef]
  20. D’Amato, G.; Cecchi, L.; Bonini, S.; Nunes, C.; Annesi-Maesano, I.; Behrendt, H.; Liccardi, G.; Popov, T.; van Cauwenberge, P. Allergenic pollen and pollen allergy in Europe. Allergy 2007, 62, 976–990. [Google Scholar] [CrossRef] [PubMed] [Green Version]
  21. Gidlöf-Gunnarsson, A.; Öhrström, E. Noise and well-being in urban residential environments: The potential role of perceived availability to nearby green areas. Landsc. Urban Plan. 2007, 83, 115–126. [Google Scholar] [CrossRef]
  22. Grote, R.; Samson, R.; Alonso, R.; Amorim, J.H.; Cariñanos, P.; Churkina, G.; Fares, S.; Thiec, D.L.; Niinemets, Ü.; Mikkelsen, T.N.; et al. Functional traits of urban trees: Air pollution mitigation potential. Front. Ecol. Environ. 2016, 14, 543–550. [Google Scholar] [CrossRef]
  23. Thompson, J.L.; Thompson, J.E. The urban jungle and allergy. Immunol. Allergy Clin. N. Am. 2003, 23, 371–387. [Google Scholar] [CrossRef]
  24. Statistik Berlin-Brandenburg, Zeitschrift für Amtliche Statistik. 2017. Available online: https://www.statistik-berlin-brandenburg.de/produkte/produkte-zeitschrift.asp (accessed on 15 April 2018).
  25. Senatsverwaltung für Stadtentwicklung und Umwelt. (Atlas of the Environment) Umweltatlas. 2015. Available online: https://www.stadtentwicklung.berlin.de/umwelt/umweltatlas/i901.htm (accessed on 15 April 2018).
  26. Senatsverwaltung für Stadtentwicklung und Umwelt. (Availability of Public, Near-Residential Green Space) Erreichbarkeit von Öffentlichen und Wohnungsnahen Grünflächen. 2013. Available online: http://www.stadtentwicklung.berlin.de/umwelt/umweltatlas/eda605 01.htm (accessed on 15 April 2018).
  27. Senatsverwaltung für Stadtentwicklung und Umwelt. Berlin—Wohnenswerte Stadt. 2011. Available online: https://www.stadtentwicklung.berlin.de/wohnen/wohnungsbau/download/ausstellung_wohnenswerte_stadt.pdf (accessed on 15 April 2018).
  28. Chao, A.; Chazdon, R.L.; Colwell, R.K.; Shen, T. Abundance-Based Similarity Indices and Their Estimation When There Are Unseen Species in Samples. Biometrics 2006, 62, 361–371. [Google Scholar] [CrossRef] [Green Version]
  29. Hammer, O.; Harper, D.A.T.; Ryan, P.D. PAST: Paleontological Statistics Software Package for Education and Data Analysis. Palaeontol. Electron. 2001, 4, 1–9. [Google Scholar]
  30. PRISMA Protocol. Available online: http://www.prisma-statement.org/ (accessed on 22 October 2018).
  31. Marando, F.; Salvatori, E.; Fusaro, L.; Manes, F. Removal of PM10 by Forests as a Nature-Based Solution for Air Quality Improvement in the Metropolitan City of Rome. Forests 2016, 7, 150. [Google Scholar] [CrossRef]
  32. Fusaro, L.; Marando, F.; Sebastiani, A.; Capotorti, G.; Blasi, C.; Copiz, R.; Congedo, L.; Munafò, M.; Ciancarella, L.; Manes, F. Mapping and Assessment of PM10 and O3 Removal by Woody Vegetation at Urban and Regional Level. Remote Sens. 2017, 9, 791. [Google Scholar] [CrossRef]
  33. Kim, G.; Coseo, P. Urban Park Systems to Support Sustainability: The Role of Urban Park Systems in Hot Arid Urban Climates. Forests 2018, 9, 439. [Google Scholar] [CrossRef]
  34. Norton, B.A.; Coutts, A.M.; Livesley, S.J.; Harris, R.J.; Hunter, A.M.; Williams, N.S.G. Planning for cooler cities: A framework to prioritise green infrastructure to mitigate high temperatures in urban landscapes. Landsc. Urban Plan. 2015, 134, 127–138. [Google Scholar] [CrossRef]
  35. Salmond, J.A.; Tadaki, M.; Vardoulakis, S.; Arbuthnott, K.; Coutts, A.; Demuzere, M.; Dirks, K.N.; Heaviside, C.; Lim, S.; Macintyre, H.; et al. Health and climate related ecosystem services provided by street trees in the urban environment. Environ. Health 2016, 15 (Suppl. 1). [Google Scholar] [CrossRef]
  36. Zardo, L.; Geneletti, D.; Pérez-Soba, M.; Van Eupen, M. Estimating the cooling capacity of green infrastructures to support urban planning. Ecosyst. Serv. 2017, 26, 225–235. [Google Scholar] [CrossRef] [Green Version]
  37. Holtan, M.T.; Dieterlen, S.L.; Sullivan, W.C. Social Life Under Cover: Tree Canopy and Social Capital in Baltimore, Maryland. Environ. Behav. 2015, 47, 502–525. [Google Scholar] [CrossRef]
  38. Chuang, W.-C.; Boone, C.G.; Locke, D.H.; Grove, J.M.; Whitmer, A.; Buckley, G.; Zhang, S. Tree canopy change and neighborhood stability: A comparative analysis of Washington, D.C. and Baltimore, MD. Urban For. Urban Green. 2017, 27, 363–372. [Google Scholar] [CrossRef]
  39. Nesbitt, L.; Hotte, N.; Barron, S.; Cowan, J.; Sheppard, S.R.J. The social and economic value of cultural ecosystem services provided by urban forests in North America: A review and suggestions for future research. Urban For. Urban Green. 2017, 25, 103–111. [Google Scholar] [CrossRef]
  40. Watkins, S.L.; Mincey, S.K.; Vogt, J.; Sweeney, S.P. Is Planting Equitable? An Examination of the Spatial Distribution of Nonprofit Urban Tree-Planting Programs by Canopy Cover, Income, Race, and Ethnicity. Environ. Behav. 2017, 49, 452–482. [Google Scholar] [CrossRef]
  41. Church, S.P. From street trees to natural areas: Retrofitting cities for human connectedness to nature. J. Environ. Plan. Manag. 2018, 61, 878–903. [Google Scholar] [CrossRef]
  42. Cariñanos, P.; Adinolfi, C.; Díaz de la Guardia, C.; De Linares, C.; Casares-Porcel, M. Characterization of Allergen Emission Sources in Urban Areas. J. Environ. Qual. 2016, 45, 244. [Google Scholar] [CrossRef]
  43. Cariñanos, P.; Casares-Porcel, M.; Quesada-Rubio, J.-M. Estimating the allergenic potential of urban green spaces: A case-study in Granada, Spain. Landsc. Urban Plan. 2014, 123, 134–144. [Google Scholar] [CrossRef]
  44. Jianan, X.; Zhiyun, O.; Hua, Z.; Xiaoke, W.; Hong, M. Allergenic pollen plants and their influential factors in urban areas. Acta Ecol. Sin. 2007, 27, 3820–3827. [Google Scholar] [CrossRef]
  45. PollenLibrary. Available online: http://www.pollenlibrary.com/ (accessed on 17 December 2018).
  46. Helms, M.; Nixon, J. Exploring SWOT analysis—Where are we now? A review of academic research from the last decade. J. Strategy Manag. 2010, 3, 215–251. [Google Scholar] [CrossRef]
  47. Jibai, B.; Alaaraj, H.; Issa, A. Developing SWOT/TOWS Strategic Matrix for E-Banking in Lebanon. Int. Bus. Account. Res. J. 2017, 2. [Google Scholar] [CrossRef]
  48. Cariñanos, P.; Casares-Porcel, M. Urban green zones and related pollen allergy: A review. Some guidelines for designing spaces with low allergy impact. Landsc. Urban Plan. 2011, 101, 205–214. [Google Scholar] [CrossRef]
  49. McInnes, R.N.; Hemming, D.; Burgess, P.; Lyndsay, D.; Osborne, N.J.; Skjøth, C.A.; Thomas, S.; Vardoulakis, S. Mapping allergenic pollen vegetation in UK to study environmental exposure and human health. Sci. Total Environ. 2017, 599–600, 483–499. [Google Scholar] [CrossRef]
  50. Maya Manzano, J.M.; Tormo Molina, R.; Fernández Rodríguez, S.; Silva Palacios, I.; Gonzalo Garijo, Á. Distribution of ornamental urban trees and their influence on airborne pollen in the SW of Iberian Peninsula. Landsc. Urban Plan. 2017, 157, 434–446. [Google Scholar] [CrossRef]
  51. Bezirksamt Marzahn-Hellersdorf von Berlin. Berlin Marzahn-Hellersdorf: Ein Bezirk Blüht Auf. 2016. Available online: http://anders-als-erwartet.eu/wp-content/uploads/2016/08/grueneseiten_inh_10.pdf (accessed on 15 December 2018).
  52. Bianco, L.; Serra, V.; Larcher, F.; Perino, M. Thermal behaviour assessment of a novel vertical greenery module system: First results of a long-term monitoring campaign in an outdoor test cell. Energy Effic. 2017, 10, 625–638. [Google Scholar] [CrossRef]
  53. Serra, V.; Bianco, L.; Candelari, E.; Giordano, R.; Montacchini, E.; Tedesco, S.; Larcher, F.; Schiavi, A. A novel vertical greenery module system for building envelopes: The results and outcomes of a multidisciplinary research project. Energy Build. 2017, 146, 333–352. [Google Scholar] [CrossRef]
  54. Cole, H.V.S.; Garcia Lamarca, M.; Connolly, J.J.T.; Anguelovski, I. Are green cities healthy and equitable? Unpacking the relationship between health, green space and gentrification. J. Epidemiol. Community Health 2017. [Google Scholar] [CrossRef] [PubMed]
  55. Rigolon, A.; Németh, J. “We’re not in the business of housing”: Environmental gentrification and the nonprofitization of green infrastructure projects. Cities 2018, 81, 71–80. [Google Scholar] [CrossRef]
Figure 1. (AD) Overview of typical building structures of Berlin ((A) dense and closed block-edge development from 1870s to 1920s; (B) block-edge development with large green backyards from 1920s to 1940s; (C) parallel and free row development with a landscaped residential greenery from 1920s to 1970s; (D) large housing estates with towers and high rise buildings from 1960s to 1980s). (E) Study areas in Berlin in residential areas with low social status and high level of environmental stressors, based on Berlin’s Map of Environmental Justice [26]. For indicator values of each study area see Table 1. Red lines indicate the study areas (1a, Sprengelkiez, Wedding; 1b, Ideal-Passage, Neukölln; 2c, General Barby Siedlung, Reinickendorf; 3d, Paul-Hertz-Siedlung, Charlottenburg; 3e, Haselhorst, Spandau; 3f, Alte-Jakobstrasse, Mitte; 4g, Marzahn; and 4h, Gropiusstadt, Neukölln). White spots indicate the sample plots. Adapted from Fisbroker/Umweltatlas Maps of Berlin [26].
Sustainability 11 01815 g001
Figure 2. Residential greenery of the study areas (A, pervious parking in a courtyard in Sprengelkiez; B, courtyard in Neukölln with big improvement potential; C, playground in Haselhorst; D, disabled old lady with young adult sitting on a bench in the residential green area of Paul-Hertz-Siedlung; E, swale in Haselhosrt; F, newly-built greenery in Gropiusstadt; G, self-made garden in Gropiustadt; H, playground in Gropiusstadt; I, green alley between buildings, Gropiusstadt; photos: Pille).
Sustainability 11 01815 g002
Table 1. General characterization of study areas regarding building type and period, study area, code used in this study (see Figure 1), health relevant characteristics (i.e., air and noise pollution, bioclimatic stress, access to green space and social status), total sample area, population density and percentage of pervious and impervious surface (adapted from [26]). For details on relative environmental justice indicators see the Materials and Methods section. We surveyed two types of block-edge development (Type I: Dense and closed block-edge development from the 1870s to 1920s; and Type II: Block-edge development with large green backyards from the 1920s to 1940s, see Chapter Study Area and Figure 1A,B).
Building Type (Construction Period)Study AreaCodeNoiseAir PollutionAccess to Public Green SpacesBioclimatic StressorsSocial Status IndexTotal Sample Area (ha)Number of Residents Per ha% of Pervious Mean Surface% of Impervious Mean Surface
Lock-edge developments (Type I, 1870s–1920s)Sprengelkiez, Wedding1aLowHighLowHighLow16.55172278
Ideal-Passage, Neukölln1bMediumHighLowHighLow12.65331783
(Type II, 1920s–1940s)General Barby Strasse, Reinickendorf2cHighHighLowHighLow9.62015149
Row-building settlements (1920s–1970s)Paul-Hertz Siedlung, Charlottenburg3dMediumHighMediumHighLow35.52085743
Haselhorst, Spandau3eHighMediumHighHighLow33.82325248
Settlements along Alte-Jakobstr., Mitte3fHighHighMediumHighMedium28.73156139
Large housing estates (1970s–1980s)Marzahn4gMediumHighLowHighLow303375545
Gropiusstadt, Neukölln4hMediumMediumMediumHighLow23.63125545
Table 2. Number of the structural elements of the residential greenery recorded in the sampling areas of this study (for details see the Materials and Methods sections, Table 3 for most frequent species and Appendix A and Appendix B). We surveyed two types of block-edge development (Type I: Dense and closed block-edge development from the 1870s to 1920s; and Type II: Block-edge development with large green backyards from the 1920s to 1940s, see Chapter Study Area and Figure 1A,B).
Building Type (Construction Period)NeighborhoodCodeMean Sample Plot Size (m2)Green Balconies/All Balconies (%)BioswalesLaundry Drying AreasGround-Based GreeningParking AreasPathsPlaygroundsLightsBike RacksBenches
Block-edge developments (Type I, 1870s–1920s)Sprengelkiez, Wedding1a62017/40 (43%)001101382
Ideal-Passage, Neukölln1b44000000210133
(Type II, 1920s–1940s)General Barby Strasse, Reinickendorf2c8430123/163 (75%)0000329821
Row-building settlements (1920s–1970s)Paul-Hertz Siedlung, Charlottenburg3d150093/128 (73%)00003210103
Haselhorst, Spandau3e3330114/208 (55%)400200731
Settlements along Alte-Jakobstr., Mitte3f3030127/200 (64%)023323181210
Large housing estates (1970s–1980s)Marzahn4g5700199/428 (46%)0102021911
Gropiusstadt, Neukölln4h3000157/313 (50%)000114858
Table 3. Shrub and tree species richness and frequent trees species of the residential greenery mapped in the sample plots. Species were considered frequent if their presence was more than 10% of the total number of trees sampled. Bold species dominated tree composition, as the number of individuals was at least double compared with the number of individuals of other tree species (for details see Appendix A and Appendix B). Neighborhood codes: 1a, Sprengelkiez, Wedding; 1b, Ideal-Passage, Neukölln; 2c, General Barby Siedlung, Reinickendorf; 3d, Paul-Hertz-Siedlung, Charlottenburg; 3e, Haselhorst, Spandau; 3f, Alte-Jakobstrasse, Mitte; 4g, Marzahn; and 4h, Gropiusstadt, Neukölln. Bold characters indicate the most frequent species.
Building Type (Construction Period)CodeSpecies RichnessFrequent Tree Species
TreesShrubs
Block-edge developments (Type I, 1870s–1920s)1a126Aesculus hippocastanum L.; Acer platanoides L.; Fraxinus excelsior L.; Juglans regia L.; Pinus sylvestris L.; Prunus avium L.; Quercus robur L.
1b138Betula pendula Roth; Acer pseudoplatanus L.; Taxus baccata L.
Block-edge development with large green backyards (Type II, 1920s–1940s) 2c239Betula pendula Roth; Abies alba Mill.; Acer platanoides L.; Crataegus monogyna Jacq.; Ilex aquifolium ‘J.C. van Tol’; Pinus strobus L.; Robinia pseudoacacia L.
Row-building settlements (1920s–1970s)3d178Styphnolobium japonicum (L.) Schott; Acer negundo L.; Acer platanoides L.; Ailanthus altissima (Mill.) Swingle; Betula pendula Roth; Ginkgo biloba L.; Malus domestica Borkh.; Prunus avium L.
3e158Betula pendula Roth; Pinus strobus L.; Acer negundo L.; Acer platanoides L.; Pinus nigra J.F. Arnold; Prunus avium L.; Prunus cerasifera Ehrh.; Robinia pseudoacacia L.
3f1510Acer campestre L.; Acer platanoides L.; Pinus sylvestris L.; Populus alba L.; Prunus cerasifera ‘pissardii nigra’; Robinia pseudoacacia L.; Taxus baccata L.; Tilia cordata Mill.
Large housing estates (1970s–1980s)4g329Quercus robur L.; Acer platanoides L.; Betula pendula Roth; Carpinus betulus L.; Prunus serotina Ehrh.; Tilia cordata Mill.
4h1310Pinus sylvestris L.; Acer platanoides L.; Styphnolobium japonicum (L.) Schott
Table 4. Matrix similarity of abundance of woody or tree species across different building types using Jaccard and Bray-Curtis (italic) indexes. Building types: Block-edge developments (Type I: Without large green backyards of the 1870s–1920s; Type II: With large green backyards of the 1920s–1940s); row-building settlements of the 1920s–1970s and large housing estates of the 1970s–1980s. Neighborhood codes: 1a, Sprengelkiez, Wedding; 1b, Ideal-Passage, Neukölln; 2c, General Barby Siedlung, Reinickendorf; 3d, Paul-Hertz-Siedlung, Charlottenburg; 3e, Haselhorst, Spandau; 3f, Alte-Jakobstrasse, Mitte; 4g, Marzahn; and 4h, Gropiusstadt, Neukölln.
Jaccard Index
Building TypesBlock-Edge DevelopmentsRow-Building SettlementsLarge Housing Estates
Type IType II
1a1b2c3d3e3f4g4h
Bray-Curtis Index1a10.190.300.120.130.420.260.39
1b0.2010.200.070.170.120.250.30
2c0.180.1310.180.360.360.310.24
3d0.160.110.1710.230.140.170.25
3e0.180.180.370.3310.320.310.23
3f0.370.130.310.120.2710.310.33
4g0.180.120.370.120.220.2510.32
4h0.240.180.180.210.160.270.231
Table 5. Tree composition in the study areas according to air pollution removal potential (modified by [13,23]) and allergenic potential (modified by [42,43,44,45], 93% of tree species are represented). Building types: Block-edge developments (Type I: Without large green backyards of the 1870s–1920s; Type II: With large green backyards of the 1920s–1940s); row-building settlements of the 1920s–1970s and large housing estates of the 1970s-1980s. Neighborhood codes: 1a, Sprengelkiez, Wedding; 1b, Ideal-Passage, Neukölln; 2c, General Barby Siedlung, Reinickendorf; 3d, Paul-Hertz-Siedlung, Charlottenburg; 3e, Haselhorst, Spandau; 3f, Alte-Jakobstrasse, Mitte; 4g, Marzahn; and 4h, Gropiusstadt, Neukölln.
All Sampling AreasBuilding Type
Block-Edge DevelopmentsRow-Building SettlementsLarge Housing Estates
Type IType II
SpeciesIndividuals1a1b2c3d3e3f4g4h
(n)(%)(n)(%)(% of trees per area)
Air pollution removal potential
moderate4979395758088829578769440
high13211132220131852324660
Allergenic potential
low223812225162534263022305
moderate122115231361328343841966
high1831141294044142415334123
very high61080168192416184216
Table 6. Examples for strategies to improve residential greenery by SWOT/TOWS matrix (see Methods).
OPPORTUNITIESTHREATS
STRENGTHSSO-Strategies
  • Co-design and Co-implementation (e.g., nature based solutions for health risks, biodiversity friendly playgrounds and experience trails)
  • Transfer of responsibilities for design, care and maintenance to residents
  • Implementation of missing residential greenery elements to foster cooling and filtering and biodiversity effects
ST-Strategies
  • Organisation of initial meetings and communication events to overcome barriers
  • Financial benefits with appropriate management
  • Plant use guide to reduce disservices of ornamental plants and enhance cooling and air filtering effects
WEAKNESSESWO-Strategies
  • Transformation to multi-functional, healthy and biodiversity-friendly areas
  • Enhance welcoming qualities and motivation to be physically active (e.g., by implementation of barefoot paths and sport devices)
  • Empower integration friendly places for resilient neighborhoods
WT-Strategies
  • Foster easy-to-implement and low-cost solutions to avoid hard-to-transfer “lighthouse projects” or green gentrification
  • Information campaigns and workshops

