Article

Assessment of Aesthetic Preferences in Relation to Vegetation-Created Enclosure in Chinese Urban Parks: A Case Study of Shenzhen Litchi Park

1
Section of Landscape Architecture, Department of Urbanism, Delft University of Technology, 2628 BL Delft, The Netherlands
2
Landscape Informatics, Faculty of Landscape Architecture, Weihenstephan-Triesdorf University of Applied Sciences, 85354 Freising, Germany
*
Author to whom correspondence should be addressed.
Sustainability 2019, 11(6), 1809; https://doi.org/10.3390/su11061809
Submission received: 12 March 2019 / Accepted: 21 March 2019 / Published: 26 March 2019
(This article belongs to the Section Sustainable Urban and Rural Development)

Abstract

:
Building on the mystery/complexity/legibility/coherence model of Kaplan and Kaplan (1989) and up-to-date landscape visualization techniques, this paper presents a case study analyzing people’s aesthetic preferences for scenes with varying levels of enclosure created through vegetation. Participants were asked to view 48 computer-generated urban park scenes with different levels of enclosure and to rate them for three aesthetic preference factors: coherence, complexity, and legibility. The results are as follows: (1) If the visual and/or physical setting is enclosed, participants will give lower ratings for legibility than in open scenes. (2) Physically open scenes are rated as more coherent than physically enclosed scenes. (3) Participants rate complexity for physically enclosed scenes lower than for physically open scenes. It is concluded that enclosure as a predictor variable for landscape preference has a practical significance for future urban landscape research and designs.

1. Introduction

1.1. Enclosure in the Context of Urban Parks

From a global perspective, enclosure in urban settings plays an essential role in people’s neural responses and environmental perception. As a fundamental physical component, enclosure indicates whether a specific region is safe, refuge-provided, visible, or legible [1]. Van den Berg, Jorgenson, and Wilson (2014) described four ways of defining Sheffield’s spatial enclosure in urban streets, parks, and urban woodland to evaluate different restoration experiences [2]. Spatial elements and compositions used to form enclosure are diverse. Thwaites, Helleur, and Simkins (2005) proposed that indicators like facade continuity and sky exposure could enhance the sensation of complexity and the enclosure of urban open spaces [3]. In addition, considering the big pressure from large populations and limited open areas in Asian cities, Xue, Gou, and Lau (2017) conducted research on the relationship between the level of enclosure in urban green spaces and microclimate issues. In China, people are beginning to have a higher usage and aesthetic demand for public spaces [4]. Thus, the design of different activity spaces has been increasingly emphasized in order to meet new requirements of the urban landscape.
The characteristic appearances of Chinese gardens have been developed over more than two thousand years through “learning from nature”. This intuitive approach has created spaces that reflect the harmony between nature and human beings. Chinese traditional courtyards are usually fully enclosed by walls and/or architecture to keep the associated properties private. Stepping into such a garden, one finds multiple small spaces are used to create layers of enclosure, which are constructed and physically enclosed by porches, walkways, vegetation, water, rockeries, and pavilions to present various poetic scenes and to reflect seasonal differences. However, contemporary Chinese gardens are no longer restricted to a particular class of people but rather have changed their functions to become public and accessible landscapes. Therefore, instead of constructing built components, vegetation has become increasingly important and is now frequently used in the shaping of open spaces.
An increasing number of contemporary scholars have tested the correlations between human perception, activity organization, and the attributes of vegetation in modern Chinese landscapes. Wang (2000); Zhao, Li, and Hu et al. (2004); and Li (2009) studied how to enclose spaces with plant materials [5,6,7]. Tao and Liu (2002) and Zang (2003) have considered the relationship between human feelings and the shape, colour, and volume of vegetation [8,9]. Moreover, Yao, Zhu, and Yang et al. (2012) have proposed, through case studies in Guangzhou residential areas, that people’s preferences regarding visual quality are positively influenced by the composition of vegetation and the enclosure of green spaces [10]. Zhang, Chen, and Sun et al. (2013) concluded that the characteristics of vegetation are one of the most effective predictors of perceived recreational appropriateness in Chinese urban landscapes [11]. Later, Wang, Rodiek, and Wu et al. (2016) conducted studies on how different degrees of openness or the sense of enclosure created by plant materials would affect people’s perceptions of overall perceived restorativeness, i.e., promoting health and well-being, in urban parks in Shanghai [12]. As comprehensive as these approaches have been, there remains a lack of studies dealing with the relationship between specific vegetation-created spatial compositions and aesthetic preferences, which could contribute to the development of landscape perception approaches and design strategies for contemporary Chinese urban parks.

1.2. Characterization of Enclosure

As a landscape architect, Greenbie (1981) presented the idea that an opening in a wall can make the difference between an enclosure and a prison because such an opening can connect the visual and physical permeability [13]. In the seminal book The Experience of Nature, Kaplan and Kaplan (1989) concluded that the layout of the elements in visual scenes determines the spatial composition and how people perceive the landscape and classified spatial types into three categories, namely open-undefined space (flat and lacking spatial definition), spacious-structured space (containing vegetation and landmarks), and enclosed space (hidden and screened areas) [14]. Furthermore, Kaplan, Kaplan, and Brown (1989) noted that there are four kinds of variables that can be used to explore people’s environmental preferences: physical attributes, land-cover types, information variables, and perception-based variables [15]. Amongst these, perception-based variables, with predictor variables such as openness/enclosure and smoothness, are more powerful than the other variables. Herzog’s (1992) study of urban spaces indicated that enclosure affects the relative preferences between the categories: open-undefined, well-structured, enclosed settings, and blocked views [16].
In the recent urban context, the enclosure of open spaces can often define the perception of a city. Wall and Waterman (2010) pointed out that the ratios between the width of the street, the heights of the buildings, and the length of the view along the street can create different senses of enclosure and can, thus, affect experience [17]. In urban parks, vegetation is one of the most important means of creating enclosure and shaping different functional spaces. Open or enclosed spaces create different visual effects and induce different aesthetic experiences. In relation to the diversity and multifunctionality of vegetation, Robinson (2004) has shown that, from a visual and a physical perspective, there are several kinds of enclosure [18]. He names this the Permeability of Enclosure, which has five main types: visually and physically enclosed, partly visually enclosed and visually enclosed, partly visually enclosed but physically open, visually open but physically enclosed, and both visually and physically open.
Robinson’s framework has been the foundation for other studies, e.g., the development of space syntax techniques to assess the effects of schematic planting designs on pedestrian behavior [19]. In our research, Robinson’s classification was adopted as the basis of distinguishing different degrees of enclosure (as defined in Table 1). However, the five classes were simplified and reduced to four classes after test interviews showed that the partly open/enclosed conditions were not distinct enough for lay people to distinguish from the other classes.

1.3. Cognition and Preference

Chen, Adimo, and Bao et al. (2009) demonstrated that visual stimuli such as enclosure are amongst the most effective elements in the perception of aesthetic quality [20]. The visual characteristics of a landscape help us understand the nature of the surrounding landscape, either through our evolutionary history or by cultural experience [21,22,23,24]. At the beginning, preference studies evaluated scenic beauty through empirical models [25,26,27]. Stamps (2004) reviewed the correlation between natural environmental preferences and the variables of coherence, complexity and legibility, and mystery [28]. Tveit, Ode, and Fry (2006) suggested nine visual concepts including coherence, complexity, stewardship, disturbance, historicity, visual scale, imageability, naturalness, and ephemera [29]. However, an increasing number of quantitative measurements have been developed to assess people’s landscape preferences via various new methods, techniques, and devices [30].
Variables such as coherence, complexity, disturbance, visual scale, imageability, or naturalness overlap with aesthetic quality, which could be used to identify the users’ aesthetic preferences for outdoor settings. In this study, coherence, complexity, and legibility are used as dependent variables for the assessment of aesthetic preference. According to the mystery/complexity/legibility/coherence model by Kaplan and Kaplan (1989), the coherence of a scene can be affected by textures, easily identifiable organizations, and well-maintained plants and objects. Complexity is used to discuss the capacity, richness, and diversity of a scene, whilst legibility refers to the readability of a scene and whether people’s movements might be affected by distinctive elements within the park [14]. In summary, the following definitions were derived for this study. Coherence: How well integrated is a setting, and how easy is it to organize and structure the scene? Legibility: How easy is it to find your way within the depicted environment, to determine where you are at any given moment, or to find your way back to any given point? Complexity: How much is going on in the scene, how much is there to look at, and does “the scene contain a lot of elements of different kinds”?

1.4. Landscape Visualization

The idea of using experimental approaches in perception studies and landscape aesthetic quality assessments goes back to the early 1980s, for example, by Daniel and Boster (1976) [31]. However, the available technologies at the time were not yet ready to allow for valid and rigorous experiments. Since the 1990s though, newly developed landscape visualization technologies allowed the construction of visual scenarios, keeping all factors constant while only changing specific factors, i.e., the fundamental requirement for a controlled experiment. The new possibilities for landscape perception studies were intensively discussed in a special issue of Landscape and Urban Planning in 2001. Daniel (2001) reviewed numerous representational validity studies of computer visualizations and concluded that high-resolution, high-realism visualizations could support landscape aesthetic quality assessments that correlated highly with photographic representations and by implication with direct observations of landscapes [32]. Lange (2001) pointed out the importance of foreground detail in order to receive valid responses. In the following years, Bishop continued studying the validity of computer-generated landscape visualizations in perception research and further highlighted issues of detail, sound, animation, and day/night time (Bishop and Karadaglis, 2001; Bishop and Rohrmann, 2003) [33,34,35]. In 2011, Lange concluded that most technological issues were now solved and that we needed to focus more on the content, application, and multisensory presentation of landscape visualizations in assessments [33]. Lovett et al. (2015) provided guidance on how the three main visualization options rendering still images, animations, and real-time models compared and how these visualization options met the criteria of credibility, salience, and legitimacy [36]. Kuper (2017) was one of the first researchers, who designed an experimental perception study using computer-generated landscape visualizations to compare the impacts of three different methods of plant organization on respondents’ preference ratings of complexity and coherence [37].
Ervin and Hasbrouck (2001) suggested that computer-generated landscape visualizations were built from six elements: landform, vegetation, water, structures, animals (including humans), and meteorological atmosphere [38]. Vegetation, such as trees, shrubs, and groundcover, was generally treated as the most visible element of a landscape and is particularly important for this study. Thus, how to create realistic plant models has become an important issue. Nowadays, an increasing number of botanically realistic 3-D vegetation models is available for modelling software, such as the plant libraries Laubwerk and Xfrog, and all types of vegetation can be rendered in high resolution [39].
This study is similar to Kuper as it is also based on the controlled manipulation of vegetation elements that, in this case, define enclosure. Using computer-generated landscape visualization, it was possible to set up an experiment, where all scenes had exactly the same viewpoint, weather, lighting, etc. but only enclosure changed according to the four classes adopted from Robinson.

2. Materials and Methods

2.1. Research Questions and Hypothesis

The research question was “How do park users perceive different degrees of enclosure formed by vegetation in modern Chinese urban parks?” The corresponding hypotheses were (1) park users rated coherence higher for visually open scenes; (2) park users rated legibility higher for physically open scenes; and (3) park users rated complexity higher for physically enclosed scenes.

2.2. Research Design

The study used an experimental approach applying computer-generated landscape visualizations to construct controlled scenarios of different levels of enclosure. The different scenarios were based on the four combinations of visual and physical enclosure by Robinson (Table 1) [18]. The resulting scenarios were presented to the respondents as stimuli in an online questionnaire. The three variables, i.e., coherence, complexity, and legibility, were tested as independent variables with aesthetic preference as the dependent variable. In the questionnaire, respondents were also asked for their basic demographic information and their potential uses of the urban park.
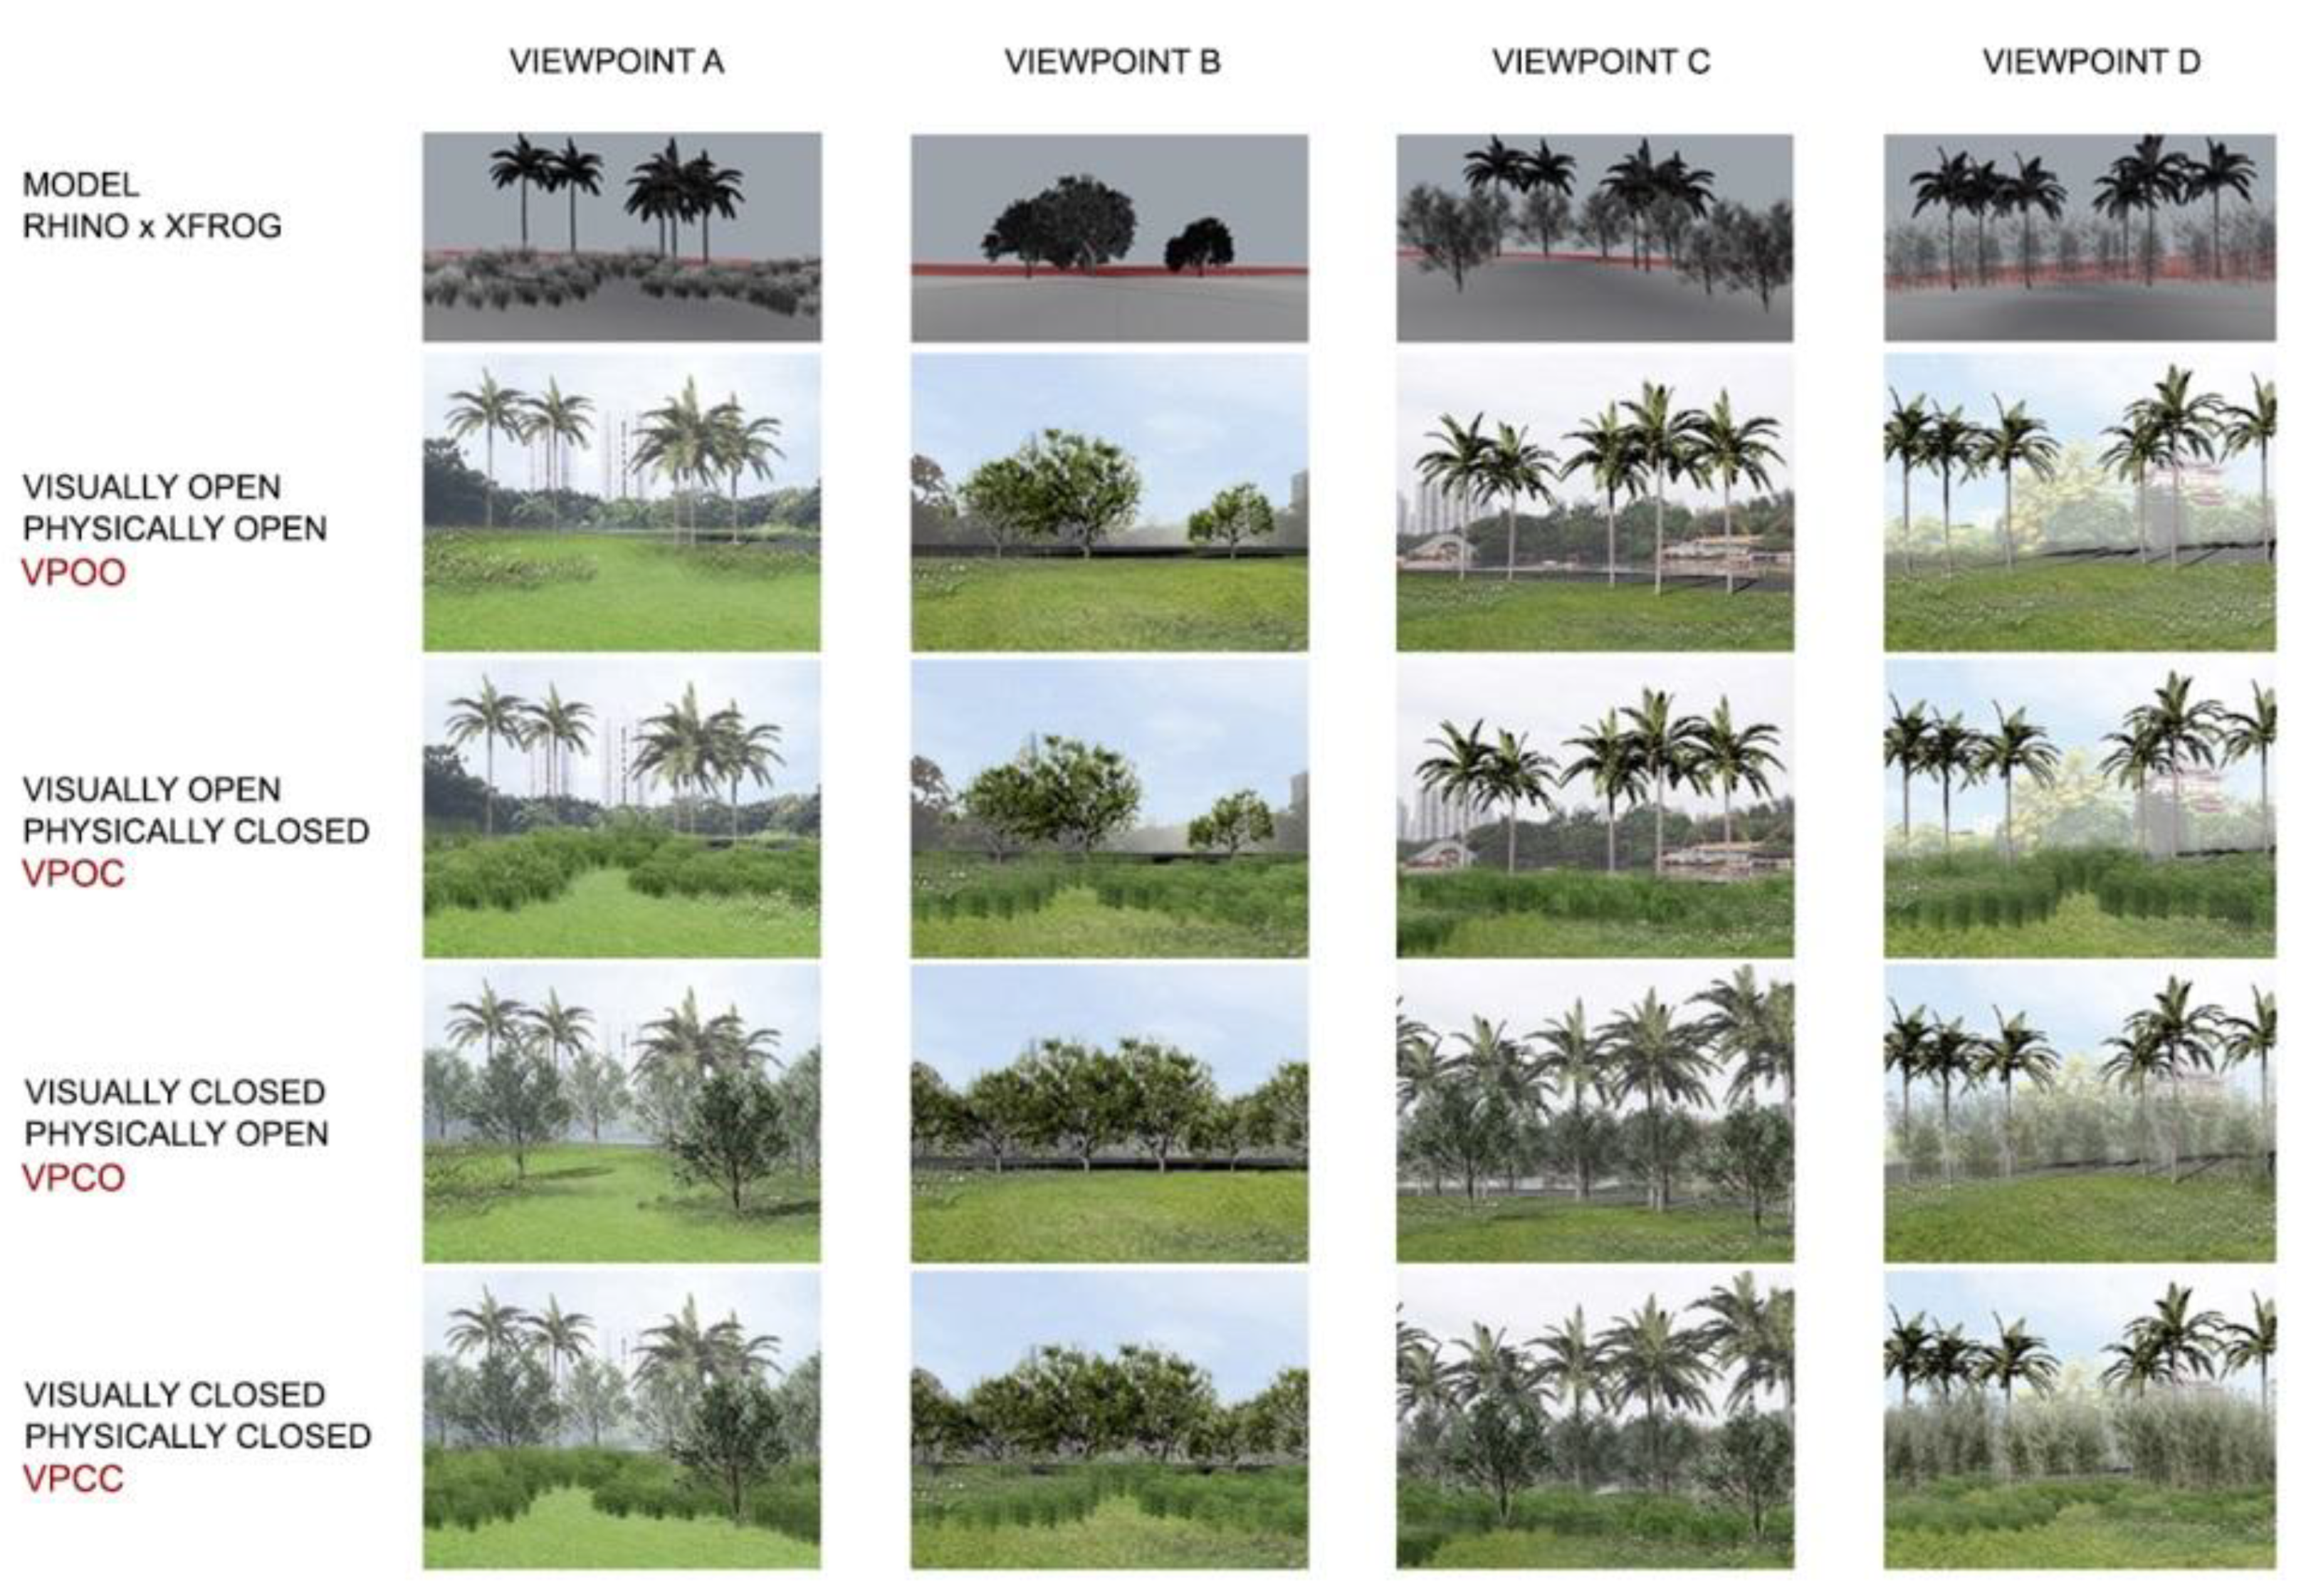
  • Four viewpoints (A, B, C, and D) in Shenzhen Litchi Park with fields of view and different levels of enclosure were chosen (Figure 1);
  • Using species which already exist in the park, four configurations of visual and physical enclosure (scenes) were designed;
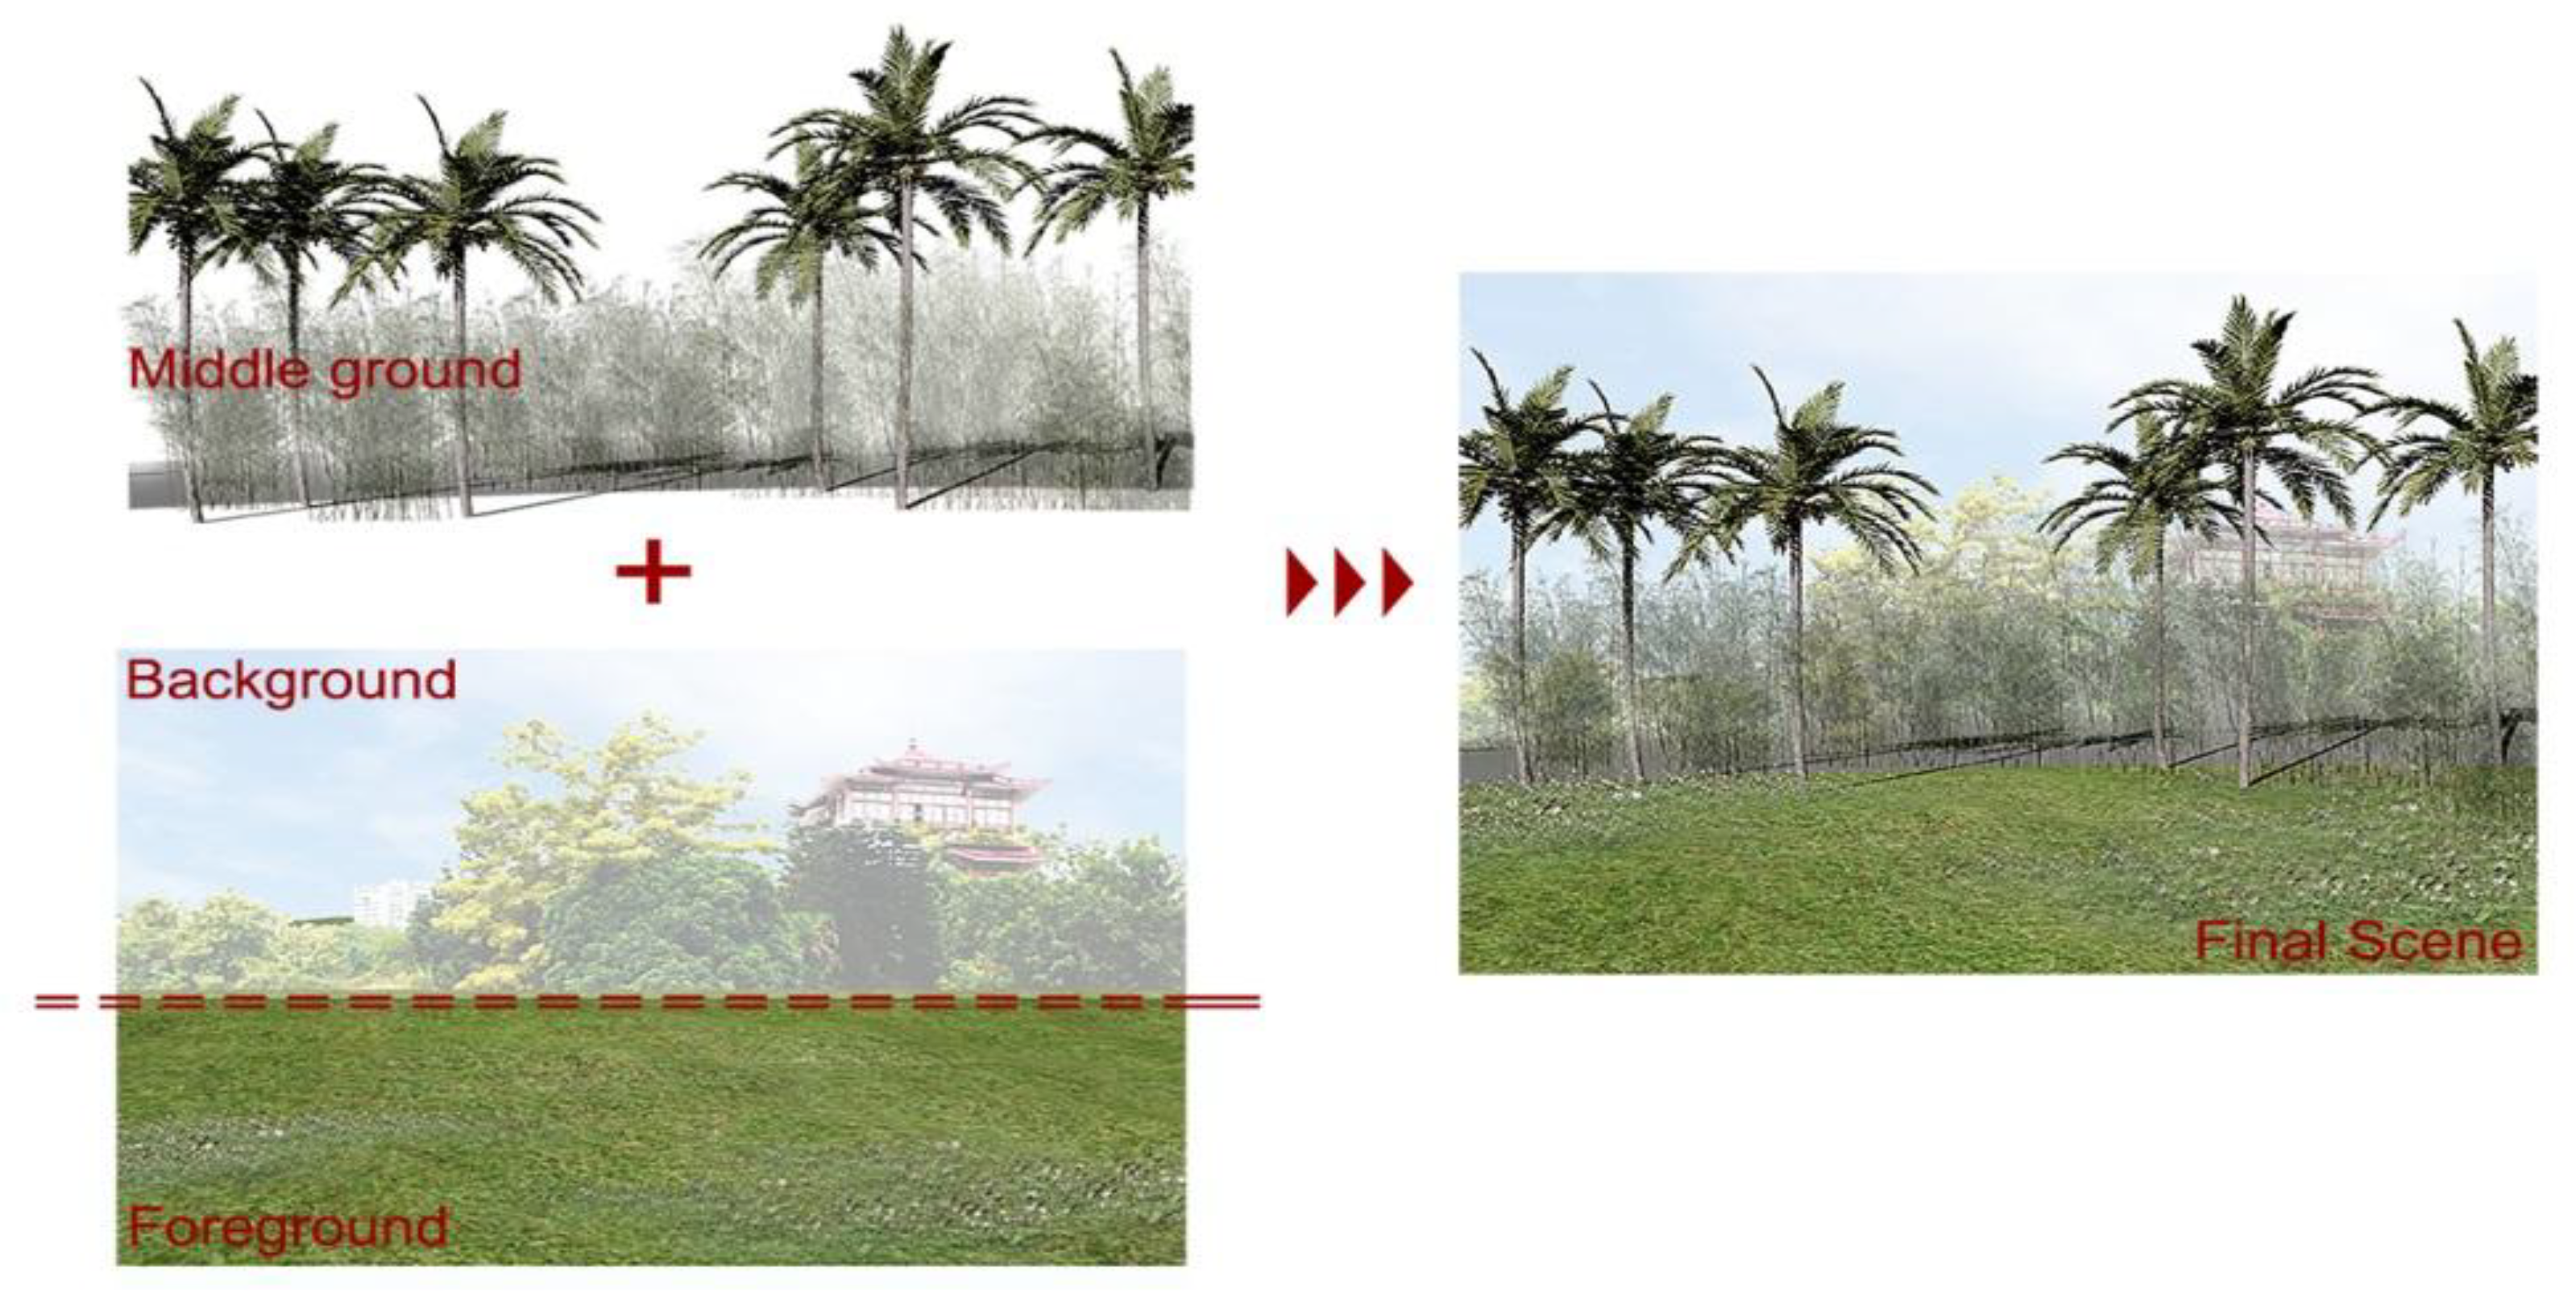
  • Autodesk Rhinoceros3D and Xfrog 3-D plant models were used to create middle-ground views from eye-level perspectives with four different levels of enclosure;
  • Adobe Photoshop was used to match the corresponding photographs for the background and foreground details and to ensure the validity of the visualizations;
  • The online questionnaire was piloted with the preference study using 48 images to test the aesthetic preferences in terms of enclosure, complexity, legibility, and coherence;
  • Participants were recruited through WeChat and Weibo, two social networking platforms in China;
  • The online questionnaire was conducted with 303 participants (n = 303);
  • The statistical analysis of the survey data was performed in IBM SPSS 22.

2.3. Case Study—Litchi Park, Shenzhen, China

Since its establishment as a special administrative region, Shenzhen’s population has quickly grown due to immigration (the population natural growth rate was 17.48% in 2014) [40]. Litchi Park covers an area of 28 acres. More than 10 acres of water features and 20 South Asian tropical ornamental plant species are used, which have created a rather naturalistic environment and have turned the park into one of the most popular public green spaces in Shenzhen’s high-density city centre [41]. Litchi Park was chosen as being a typical and representative Shenzhen urban park because of its strong cultural and regional characteristics. The park has been designed with Chinese traditional garden features such as mountains and rivers, multiple layers, and abundant plant species.

2.4. Selection of Viewpoints According to Scale, Distance, and Field of View

Viewpoints: Viewpoint A was located in the northern part of the park. It was in a quiet space in which people like to have picnics. Viewpoint B was located at the east entrance of the park, where a number of Litchi chinensis trees grow. People at viewpoint B could see KK100, the highest skyscraper in Shenzhen, as a particular landmark in the background outside the park. Viewpoint C was near the lake in the park, which is also a quiet area for people to sit on the benches provided to view the water or to talk with friends. Viewpoint D was located in the centre of the park. People gather in this space and can see the highest point in the park, Lixiang Pavilion (Figure 1).
Distance from viewpoint to scene: The viewpoints at which the camera was set were intended to provide visible vegetation arrangements with the foreground, middle ground, and background, with a 25-m distance between the viewpoints and the potential modeled scenes [33].
Field of vision and size of scene: According to Panero and Zelnik (1979), the clear horizontal and vertical ranges of people’s eyesight both have an angle of about 60° [42]. Considering the distance (25 m) between the viewpoint and the scene, the field of vision within each scene was around 29 m.
Display size, resolution, and viewing distance: With respect to the online survey, the images were exported to a screen resolution of 1024 × 768 pixels (4:3) at a 72 dpi resolution, which is the most common resolution in general usage [43]. Taking the limited size (108 kb) of images permitted by Survey Monkey (the online survey website) into consideration, the JPG format with a high compression rate was selected to compress the file size whilst minimizing the loss in quality [44,45]. The participants were instructed to view the images whilst holding them at arm’s length [46].
Foreground, middle ground, and background: The foreground and background elements in the visualization play important roles in determining the visual preferences, but it is the middle ground that is key [33]. Plant species, which can already be found in the park, were used to simulate four different combinations of visual and physical enclosure. In order to reduce the effects of confounding factors in the experiment, the foreground and background scenes were kept the same. It has to be considered that the background scene with buildings and other easily recognizable landmarks was likely to influence the readability of the space by providing people with a sense of direction [28,33] (Figure 2).

2.5. Approaches to Landscape Visualization

To control the experiment and to keep the foreground and background constant while changing the variables in the middle ground, 3-D models (e.g., vegetation and topography) and 2-D images (foreground and background) were used together. The Rhinoceros3D modelling software was chosen to model the small-scale urban green spaces. The Xfrog Plants library provided 2-D and parametric 3-D plant models. The topographic data was derived from Google Maps. Based on the thesis by Ren and Shen (2012), who gave a detailed description of the planting design in Litchi Park, the vegetation species were chosen [41] (Table 2).
Considering the spatial and visual characteristics of the selected vegetation, different levels of enclosure were composed in each scene. Roystonea regia (Kunth) (O.F.Cook) was used as tall trees, creating visually and physically open spaces. Litchi chinensis Sonn. and Lagerstroemia speciosa (L.) Pers. formed dense canopies which could block visibility but could provide physically open scenes. Ficus microcarpa L. f. cv. Golden Leaves was used as a low shrub, which allowed open views. The texture of Rhapis gracilis Burret supported the enclosed views and unpassable edges of the landscape. The resulting 16 scenes are shown in Figure 3.

2.6. Survey Design

Four different versions of each scene were shown to the respondents in order to test their aesthetic preferences. Roth (2006) reviewed the studies by Bishop (1997) and Wherrett (1999), concluding that online surveys were legitimate tools for landscape preference studies [43,44,45]. The 52-page online survey with 60 ratings and questions was designed in Survey Monkey and complied with European Union data privacy laws in order to guarantee data protection. It is a fundamental principle of landscape preference studies that respondents have to rate a large number of images (visual stimuli) in a very short time to receive spontaneous preferences. In consequence, the number of survey pages is rather high, but the time for completing such a survey is still reasonable. The questionnaire consisted of a cover consent letter (1 page), demographic questions (2 pages, 7 questions), questions about park use (1 page, 5 questions), and 48 image-based preference questions (4 viewpoints × 3 aesthetic preference variables × 4 levels of enclosure = 48 pages). Today, social media are widely used to recruit respondents [47,48]. The two most popular Chinese social media sites, WeChat and Weibo, were selected as platforms to recruit local Chinese respondents (see the detailed online questionnaire in the Supplementary Materials).
Demographic factors: Lyons (1983) noted that demographic and social factors (i.e., age, gender, socioeconomic status, and residency) can play a significant part in shaping environmental preferences [49,50]. Evolutionary theories stated that human profiles are irrelevant to the preference of beauty, while cultural theories showed that characteristics of respondents prominently influence the judgements of functional preference [29,51,52]. Also, several studies pointed out that expert and public respondents showed differences in their landscape aesthetic preferences [53]. Seven demographic questions were regarding gender, age, occupation, professional design education, and whether participants were familiar with urban parks in Southern China.
Park uses: Personal and social situational activities or concerns can affect landscape aesthetic preferences [54]. This part of the questionnaire included questions about peoples’ use of the park, the frequency of use, how much time they spend in the park, how they accessed the park, and the purpose of their visit to the urban park.
Aesthetic preference: The image-based section of the questionnaire was comprised of 48 computer-generated images and 48 preference questions in a one-to-one image-to-question structure. For each viewpoint (A, B, C, and D), four different images were presented, showing different visual and physical enclosure typologies. After viewing each image, participants were asked to answer three questions, which were used to investigate the three variables of human aesthetic preference: coherence, complexity, and legibility. Since Echelberger (1979), researchers have used semantic differential methods to evaluate the physical environment [55]. In this study, a five-point Likert scale from the highest (1) to the lowest (5) rating was used for preference [56]. That means that low scores indicate a strong preference. Coherence was rated on a 5-point scale from pleasant to unpleasant, and complexity was rated as “appropriate to support a lot of functions” to “inappropriate to bear a lot of functions” [57]. In addition, legibility was rated from legible to illegible [30]. The data from the questionnaires were collected in Survey Monkey automatically and then exported as numeric data to SPSS Statistics Version 22 for Mac OS X. A Univariate Analysis in SPSS was used to analyze the relationship between the enclosure created by the vegetation and the three aesthetic preference variables. A two-way ANOVA was applied to examine the effects of more than one independent variable and how these variables interacted [58].

3. Results

3.1. Respondents

A total of 303 responses were collected (n = 303). Excluding incomplete data, 188 valid responses were used in the statistical analysis (observed power = 1.000). Analyses of normality for the basic sociodemographic characteristics show normal distributions (0.00 < p < 0.05). However, the number of females (n = 105, 55.85%) was higher than the number of males (n = 83, 44.15%). It is likely that the use of online media for recruitment influenced the participating demographic; for instance, the proportion of young and well-educated participants was significantly higher than within the general population. Most participants were in the 25–34 (42.02%) and 18–24 (20.74%) age groups. In addition, office workers formed the largest occupational group taking part in this research, accounting for 54.79%, whilst students were the next largest at 32.98%. Furthermore, the number of professionals (47.87%) who had received an arts or design-related education, such as drawing, sculpture, landscape, architecture, and planning, was nearly equal to the number of nonprofessionals (52.13%).

3.2. Evaluation of Enclosure and Coherence, Complexity, and Legibility

As the two diagrams (Table 3 and Figure 4) show, the ANOVA analyses show trends for the three aesthetic preference variables that they were influenced by visual and physical enclosure. Starting with hypothesis (1), park users rated coherence higher for visually open scenes; the mean square deviation of coherence influenced by visual enclosure was 40.03. The F value for visual enclosure was 46.178, and the significance level was 0.000 (p < 0.05), thereby indicating significant differences in the perceived coherence of the scenes in terms of visual enclosure. The mean square deviation of coherence affected by physical enclosure was 12.383. The F value was 14.285, i.e., much lower than it was for visual enclosure, and the significance level was 0.000 (p < 0.05), i.e., significant differences were shown for the perceived coherence of the scenes depending on the level of physical enclosure. The mean square deviation of combinations of visual enclosure and physical enclosure was also 12.383, and the F value was 14.283. The significance level was 0.000 (p < 0.05), which partly demonstrated significant differences for the perceived coherences of the scenes for combinations of visual and physical enclosure and partly supports the first hypothesis.

3.3. Physical Enclosure and Coherence, Complexity, and Legibility

The Paired-Samples T-Test can demonstrate whether visual and physical enclosure are correlated with the participants’ aesthetic preferences represented through complexity, legibility, and coherence. As shown below in Table 4, comparing A1 A2, A3, and A4 in the scene Visual open, Physical open (VPOO) (A1), the average score of coherence was 2.94. However, in the scene Visual open, Physical enclosed (VPOC) (A2), the mean coherence rating was 3.15. The correlation coefficient of the two scenes was r = 0.527, 0.00 < p < 0.05, so the results were correlated. In addition, the Paired-Samples T-Test results showed that p < 0.05, which indicated that, in these two scenes, there were significant differences in the participants’ assessments of coherence. When the two scenes were in visually open conditions, it seemed that, within the physically enclosed scene, the assessment of coherence was lower than in the physically open scene. Similarly, complexity and legibility could be correlated with physical enclosure as suggested in the second and third hypotheses: (2) park users rated legibility higher for physically open scenes, and (3) park users rated complexity higher for physically enclosed scenes. Physically enclosed scenes indicated a lower complexity and legibility than physically open scenes. Comparing Viewpoint A with the other 12 images, the results for Viewpoints B, C, and D were similar to those obtained for Viewpoint A. The Paired-Samples T-Test results showed that the samples were significantly different (p < 0.05), i.e., that physically enclosed scenes received ratings of lower complexity and legibility than physically open scenes. Consistent with the above, if visual enclosure was constant, physically enclosed scenes resulted in lower ratings for complexity and legibility, supporting the second and third hypotheses (Table 5).

3.4. Visual Enclosure and Aesthetic Preference Variables

The Paired-Sample T-Test was also used to analyze the relationship between visual enclosure and the aesthetic preference variables coherence, complexity, and legibility. For Viewpoint A, pairs 1 to 5 did not show significant differences (p > 0.05) (Table 6). However, comparing the means, Visual enclosed and Physical enclosed (VPCC) and VPOC (pairs 2, 4, and 6) conditions suggested the coherence, complexity, and legibility of visually enclosed and physically enclosed scenarios were rated lower than visually enclosed and physically open scenarios. As Table 7 shows, Viewpoints C and D indicated that coherence/complexity and visual enclosure were correlated (p < 0.05). Keeping physical enclosure consistent, the mean scores showed lower coherence assessment ratings in the visually enclosed scenes than in the visually open scenes. Analyzing the means of every paired sample under the same conditions of physical enclosure revealed that the open scenes (VPOC or VPOO) were more legible than the enclosed scenes (VPCC or VPCO).

3.5. Summary

The results of the Paired-Samples T-Test and two-way ANOVA were consistent. The two-way ANOVA highlighted the relationship between enclosure created by vegetation and the aesthetic preference variables. Through pairwise comparisons, the Paired-Samples T-Test allowed for the control of the dependent variables and then for the analysis of the internal correlations between visual or physical enclosure and aesthetic preference. The conclusions from these two methods complemented and supported each other effectively. In terms of the relationship between enclosure and the three variables influencing aesthetic preferences (coherence, complexity, and legibility), the main results can be summarized as follows:
  • Complexity/legibility and enclosure are significantly correlated. The results for all 16 scenes show that if the visual and/or physical setting is/are enclosed, the participants’ legibility ratings are lower than in the open scenes, supporting the second and third hypotheses.
  • Not all correlations between coherence and enclosure are significant, i.e., the ANOVA test does not fully support the first hypothesis. In visually open situations, there are no obvious differences in the participants’ ratings of coherence if the scene is changed to a physically enclosed one. In visually enclosed situations, physically open scenes show a higher coherence than physically enclosed scenes.
  • Physical enclosure and complexity are significantly correlated, supporting hypothesis (3). Complexity is rated lower for physically enclosed scenes than physically open scenes. In physically open scenes, there are no clear correlations between visual enclosure and complexity. In physically enclosed scenes, the participants rate complexity higher for visually open scenes than for visually enclosed scenes.

4. Discussion

With reference to Kaplan and Kaplan (1989), it can be argued that coherence helps to provide a sense of order and allows attention to be directed. From an environmental psychology perspective, the results suggest that trade-offs exist between complexity and coherence. One such trade-off is that if the scenes were visually complex, they lacked coherence [14]. The survey supports Kaplan and Kaplan´s model and suggests that at least the predictor variables complexity, legibility, and, to a lesser degree, coherence also apply to Chinese urban parks.
Lynch (1960) pointed out in his book The Image of the City that legibility is focused on visual quality and an understanding of the cityscape and way-finding abilities [59]. More recently, Shi, Gou, and Chen et al. (2014) noted that if spatial enclosure is increased, the assessment ratings of coherence and legibility will correspondingly decrease [60]. This suggests that people tend to evaluate spaces as more coherent and legible if the space is open and simple. If background scenes contain important landmarks, these landmarks help people in terms of orientation, whereas enclosed scenes result in lower legibility ratings.

4.1. Recommendations

In the Chinese context, urban parks can be classified as green space-dominant parks or architecture-dominant parks [61]. Li (2007) noted that the green space-dominant parks in China were mainly built to enrich the urban environment through various functions such as entertainment, ornamental functions, cultural protection, and habitat provision [62]. However, the literature lacks recommendations on how to incorporate public preferences into planting design, and this research may partly fill this gap. At the urban park scale, taking peoples’ assessments of landscape composition into consideration, natural factors seem to influence peoples’ perception of the environment more than artificial elements [63]. In addition, Herzog and Miller (1998) noted that preference is positively correlated with openness [64]. Therefore, the results could be used to inform urban park design strategies. Improving visually open and easily legible spaces, which are suitable for different functions, and enhancing the legibility of these spaces could improve urban park design. Regarding the aesthetic preference variables first defined by Kaplan and Kaplan (1989), the participants’ evaluations of coherence (pleasantness of the views), complexity (functional setting), and legibility (orientation) are also helpful at the planting design stage [14]. Furthermore, at the city scale, considering urban parks as one of the most important components of urban green networks, high ratings of legibility could create visually integrated green corridors for the whole city. If the edges of urban parks are also designed as vegetation-created scenes, the relationship between enclosure and aesthetic preference could be realized. The visual and physical enclosure of such boundaries would help to clarify and enhance the relationship between parks and their urban surroundings in order to better integrate these types of open public green spaces into the planning of the wider region.

4.2. Methodological Limitations

The relationship between enclosure and coherence does not show a clear trend in this experiment. Although there are 600 plant species available in Xfrog libraries, some specific indigenous plant species, such as Litchi chinensis Sonn. and Lagerstroemia speciosae (L.) Pers., were not available in this database, which made it necessary to replace these models with species of a similar shape and height. Litchi chinensis Sonn. was replaced by Indian Sandalwood, and Lagerstroemia speciosae (L.) Pers. was replaced by Persian Ironwood. In terms of methodology, Wherrett (2000) suggested that it is essential for the assessment of visual preference to present multiple landscape components together [43]. In order to obtain results on coherence, it may be suggested that more diverse forms of vegetation, displaying more vibrant colours and textures, should be tested.
Li, Liu, and Hao (2010) analyzed descriptive data stratified by age and found that the main users of Chinese urban parks are either the older (older than 46 years old) or the younger age groups (younger than 15 years old) [65]. However, the majority of participants in this online questionnaire were 25–34 years old and generally highly educated. This might be because the questionnaires were distributed online through social media, and one might expect young and middle-aged people to be more likely to use social media sites. It would be beneficial to include a more diverse sample of older and younger participants to improve the representativeness of the data.

5. Conclusions

This study answers the question “How does enclosure created by vegetation affect aesthetic preferences in Chinese urban parks?”. There are significant differences in peoples’ aesthetic preferences with regards to enclosure created by vegetation in Chinese urban parks: (1) If the visual and/or physical scene(s) is/are enclosed, people perceive legibility as lower than in open scenes. (2) In visually open scenes, there are no significant differences in the participants’ sense of coherence if the physical enclosure is changed. Under visually enclosed situations, physically open scenes are perceived as more coherent than physically enclosed scenes. (3) The participants’ ratings of complexity were lower in physically enclosed scenes compared to physically open scenes. In contrast, in physically open scenes, there are no significant correlations between visual enclosure and complexity. However, in physically enclosed scenes, the participants gave higher ratings for complexity in visually open scenes than in visually enclosed scenes. (4) According to the analysis of demographic factors, age and other demographic factors did not seem to make a difference.
Comparing the findings of this research to previous studies, it may be concluded that landscape visualization techniques using 3-D vegetation models are reliable techniques to research aesthetic preferences in small-scale urban parks. The visualization section verified the feasibility of using parameterized 3-D vegetation plugins in preference studies. Based on the Litchi Park case study, this research has demonstrated its practical importance in providing design recommendations and that the well-established environmental preference model by Kaplan and Kaplan (1989) also applies to Chinese urban parks [14]. In conclusion, the results on enclosure and aesthetic preference are of practical use to future urban park design, and the framework of the research can be used as guidance for future research on the urban landscape in China.

Supplementary Materials

The following are available online at https://www.mdpi.com/2071-1050/11/6/1809/s1.

Author Contributions

The first and corresponding author M.L. made substantial contributions to conceive the ideas, to perform the research design, to carry out the experiment, to collect and analyze the data, and to write the manuscript. Coauthor O.S. supervised the project, provided critical feedback, and helped guide the research and the revision and proofreading of the manuscript.

Funding

This research received no external funding.

Acknowledgments

This work was funded by the Department of Landscape in the University of Sheffield, UK, which provided digital modelling materials, and supported by the Chair of Landscape Architecture in Delft University of Technology, The Netherlands.

Conflicts of Interest

The authors declare no conflicts of interest.

References

  1. Stamps, A.E.; Smith, S. Environmental enclosure in urban settings. Environ. Behav. 2002, 34, 781–794. [Google Scholar] [CrossRef]
  2. Van den Berg, A.E.; Jorgensen, A.; Wilson, E.R. Evaluating restoration in urban green spaces: Does setting type make a difference? Landscape Urban Plan. 2014, 127, 173–181. [Google Scholar] [CrossRef] [Green Version]
  3. Thwaites, K.; Helleur, E.; Simkins, I.M. Restorative urban open space: Exploring the spatial configuration of human emotional fulfilment in urban open space. Landsc. Res. 2005, 30, 525–547. [Google Scholar] [CrossRef] [Green Version]
  4. Xue, F.; Gou, Z.; Lau, S.S. Green open space in high-dense Asian cities: Site configurations, microclimates and users’ perceptions. Sustain. Cities Soc. 2017, 34, 114–125. [Google Scholar] [CrossRef]
  5. Wang, Y.X. Primary Exploration of Landscape Spatial Design. Ph.D. Thesis, Huazhong Agricultural University, Wuhan, China, 2000. [Google Scholar]
  6. Zhao, A.H.; Li, D.M.; Hu, H.Y.; Fan, J.X. Studies on Constructing Garden Space with Landscape Plants. J. Northwest For. Univ. 2004, 19, 136–138. [Google Scholar]
  7. Li, X. The Arrangement Model of Landscape Plants in Guangzhou City Parks and Build of Information System. Master’s Thesis, Northeast Forestry University, Harbin, China, 2009. [Google Scholar]
  8. Tao, J.; Liu, Y. Analyses of Psychological Feeling of Colour. J. Southwest Univ. Natl. 2002, 23, 76–77. [Google Scholar]
  9. Zang, D.K. Chosen and Configuration of Colourful Tree Species; Chinese Forestry Press: Beijing, China, 2003. (In Chinese) [Google Scholar]
  10. Yao, Y.; Zhu, X.; Xu, Y.; Yang, H.; Wu, X.; Li, Y.; Zhang, Y. Assessing the Visual Quality of Green Landscaping in Rural Residential Areas: The Case of Changzhou, China. Environ. Monit. Assess. 2012, 184, 951. [Google Scholar] [CrossRef]
  11. Zhang, H.; Chen, B.; Sun, Z.; Bao, Z. Landscape perception and recreation needs in urban green space in Fuyang, Hangzhou, China. Urban For. Urban Green. 2013, 12, 44–52. [Google Scholar] [CrossRef]
  12. Wang, X.; Rodiek, S.; Wu, C.; Chen, Y.; Li, Y. Stress Recovery and Restorative Effects of Viewing Different Urban Park Scenes in Shanghai, China. Urban For. Urban Green. 2016, 15, 112–122. [Google Scholar] [CrossRef]
  13. Greenbie, B. Spaces: Dimension of the Human Landscape; Yale University Press: New Haven, CT, USA, 1981; ISBN 0300025491. [Google Scholar]
  14. Kaplan, R.; Kaplan, S. The Experience of Nature: A Psychological Perspective; Cambridge University Press: New York, NY, USA, 1989; ISBN 0521341396. [Google Scholar]
  15. Kaplan, R.; Kaplan, S.; Brown, T. Environmental Preference. Environ. Behav. 1989, 5, 509–530. [Google Scholar] [CrossRef]
  16. Herzog, T.R. A Cognitive Analysis of Preference for Urban Spaces. J. Environ. Psychol. 1992, 12, 237–248. [Google Scholar] [CrossRef]
  17. Wall, E.; Waterman, T. Basics Landscape Architecture 01: Urban Design (Vol. 1); AVA Publishing: Worthing, UK, 2010; ISBN 978-2940411122. [Google Scholar]
  18. Robinson, N. The Planting Design Handbook, 2nd ed.; Ashgate Publishing Limited: Farnham, UK, 2004; ISBN 978-0754677161. [Google Scholar]
  19. Mahmoud, A.H.; Omar, R.H. Planting design for urban parks: Space syntax as a landscape design assessment tool. Front. Archit. Res. 2015, 4, 35–45. [Google Scholar] [CrossRef] [Green Version]
  20. Chen, B.; Adimo, O.A.; Bao, Z. Assessment of Aesthetic Quality and Multiple Functions of Urban Green Space from the Users’ Perspective: The Case of Hangzhou Flower Garden, China. Landsc. Urban Plan. 2009, 93, 76–82. [Google Scholar] [CrossRef]
  21. Appleton, J. The Experience of Landscape; Wiley: Chichester, UK, 1996; ISBN 978-0471962359. [Google Scholar]
  22. Bourassa, S.C. The Aesthetics of Landscape; Belhaven Press: London, UK, 1991; ISBN 978-1852930714. [Google Scholar]
  23. Carlson, A. Aesthetic Preferences for Sustainable Landscapes: Seeing and Knowing. Forests and Landscapes-linking Ecology, Sustainability and Aesthetics. IUFRO Res. Ser. 2001, 31–41. [Google Scholar] [CrossRef]
  24. Fry, G.; Tveit, M.S.; Ode, Å.; Velarde, M.D. The ecology of visual landscapes: Exploring the conceptual common ground of visual and ecological landscape indicators. Ecol. Indic. 2009, 9, 933–947. [Google Scholar] [CrossRef]
  25. Yu, K. Landscape Preference: BIB-LCJ Procedure and Comparison of Landscape Preference among Different Groups. J. Beijing For. Univ. 1988, 10, 1–11. [Google Scholar]
  26. Zhou, C.L.; Zhang, Q.X.; Sun, Y.K. Scenic Beauty Estimation of Residential Quarter Green Area. Chin. Landsc. Archit. 2006, 4, 014. [Google Scholar]
  27. Zheng, Y. Characteristics of Vegetation Community and Landscape Evaluation in the Urban Parks in Harbin. Master’s Thesis, Northeast Forestry University, Harbin, China, 2007. [Google Scholar]
  28. Stamps, A.E. Mystery, Complexity, Legibility and Coherence: A Meta-analysis. J. Environ. Psychol. 2004, 24, 1–16. [Google Scholar] [CrossRef]
  29. Tveit, M.; Ode, Å.; Fry, G. Key concepts in a framework for analysing visual landscape character. Landsc. Res. 2006, 31, 229–255. [Google Scholar] [CrossRef]
  30. Sevenant, M.; Antrop, M. Cognitive Attributes and Aesthetic Preferences in Assessment and Differentiation of Landscapes. J. Environ. Manag. 2009, 90, 2889–2899. [Google Scholar] [CrossRef]
  31. Daniel, T.C.; Boster, R. Measuring Landscape Esthetics: The Scenic Beauty Estimation Method; USDA Forest Service Research Paper RM-167. Available online: https://www.fs.usda.gov/treesearch/pubs/20911 (accessed on 10 October 2018).
  32. Daniel, T.C. Whither scenic beauty? Visual landscape quality assessment in the 21st century. Landsc. Urban Plan. 2001, 54, 267–281. [Google Scholar] [CrossRef]
  33. Lange, E. The limits of realism: Perceptions of virtual landscapes. Landsc. Urban Plan. 2001, 54, 163–182. [Google Scholar] [CrossRef]
  34. Bishop, I.D.; Ye, W.-S.; Karadaglis, C. Experiential approaches to perception response in virtual worlds. Landsc. Urban Plan. 2001, 54, 117–125. [Google Scholar] [CrossRef]
  35. Bishop, I.D.; Rohrmann, B. Subjective responses to simulated and real environments: A comparison. Landsc. Urban Plan. 2003, 65, 261–277. [Google Scholar] [CrossRef]
  36. Lovett, A.; Appleton, K.; Warren-Kretzschmar, B.; Von Haaren, C. Using 3D visualization methods in landscape planning: An evaluation of options and practical issues. Landsc. Urban Plan. 2015, 142, 85–94. [Google Scholar] [CrossRef]
  37. Kuper, R. Evaluations of landscape preference, complexity, and coherence for designed digital landscape models. Landsc. Urban Plan. 2017, 157, 407–421. [Google Scholar] [CrossRef]
  38. Ervin, S.M.; Hasbrouck, H.H. Landscape Modeling: Digital Techniques for Landscape Visualization; McGraw-Hill: New York, NY, USA, 2001; ISBN 978-0071357456. [Google Scholar]
  39. Gill, L.R. A 3D Landscape Information Model: Using Real-time 3D Graphics for Site-based Landscape Design. Ph.D. Thesis, The University of Sheffield, Sheffield, UK, 2013. Available online: http://etheses.whiterose.ac.uk/id/eprint/4879 (accessed on 15 March 2018).
  40. Shenzhen Statistics Bureau; NBS Survey Office. Shenzhen Statistical Yearbook 2015 (Report No. 25); China Statistics Press: Beijing, China, 2015.
  41. Ren, Y.Y.; Shen, S.Y. Analysis on the Landscape Planning of Litchi Park in Shenzhen. North. Hortic. 2012, 8, 040. [Google Scholar]
  42. Panero, J.; Zelnik, M. Human Dimension & Interior Space; Whitney Library of Design: New York, NY, USA, 1979; ISBN 978-0823072712. [Google Scholar]
  43. Roth, M. Validating the Use of Internet Survey Techniques in Visual Landscape AssessmentAn Empirical Study from Germany. Landsc. Urban Plan. 2006, 78, 179–192. [Google Scholar] [CrossRef]
  44. Bishop, I.D. Testing Perceived Landscape Colour Difference Using the Internet. Landsc. Urban Plan. 1997, 37, 187–196. [Google Scholar] [CrossRef]
  45. Wherrett, J.R. Issues in Using the Internet as a Medium for Landscape Preference Research. Landsc. Urban Plan. 1999, 45, 209–217. [Google Scholar] [CrossRef]
  46. MacDonald, A.M. Windfarm Visualization: Perspective or Perception? Whittles Publishing: Scotland, UK, 2012; ISBN 978-1849950534. [Google Scholar]
  47. Nicholas, D.; Rowlands, I. Social media use in the research workflow. Inf. Serv. Use 2011, 31, 61–83. [Google Scholar] [CrossRef] [Green Version]
  48. Eyrich, N.; Padman, M.L.; Sweetser, K.D. PR practitioners’ use of social media tools and communication technology. Public Relat. Rev. 2008, 34, 412–414. [Google Scholar] [CrossRef]
  49. Lyons, E. Demographic Correlates of Landscape Preference. Environ. Behav. 1983, 15, 487–511. [Google Scholar] [CrossRef]
  50. Modica, G.; Zoccali, P.; Di Fazio, S. The e-participation in tranquility areas identification as a key factor for sustainable landscape planning. In Proceedings of the International Conference on Computational Science and Its Applications, Ho Chi Minh City, Vietnam, 24–27 June 2013; pp. 550–565. [Google Scholar] [CrossRef]
  51. Sklenicka, P.; Molnarova, K. Visual perception of habitats adopted for post-mining landscape rehabilitation. Environ. Manag. 2010, 46, 424–435. [Google Scholar] [CrossRef]
  52. Kaplan, S. Perception and Landscape: Conceptions and Misconceptions. Proceedings of Our National Landscape: A Conference on Applied Techniques for Analysis and Management of the Visual Resource, 1979. Available online: https://www.fs.usda.gov/treesearch/pubs/27585 (accessed on 19th Oct 2018).
  53. Rogge, E.; Nevens, F.; Gulinck, H. Perception of rural landscapes in Flanders: Looking beyond aesthetics. Landsc. Urban Plan. 2007, 82, 159–174. [Google Scholar] [CrossRef] [Green Version]
  54. Gobster, P.H.; Nassauer, J.I.; Daniel, T.C.; Fry, G. The Shared Landscape: What does Aesthetics have to do with Ecology? Landscape Ecology 2007, 22, 959–972. [Google Scholar] [CrossRef]
  55. Echelberger, H.E. The Semantic Differential in Landscape Research. In Proc. Our National Landscape: A Conference on Applied Technique for Analysis and Management of the Visual Resource, USDA Forest Service General Tech., 1979. Available online: http://www.treesearch.fs.fed.us/pubs/27623 (accessed on 18th Sept 2018).
  56. Wherrett, J.R. Creating Landscape Preference Models using Internet Survey Techniques. Landsc. Res. 2000, 25, 79–96. [Google Scholar] [CrossRef]
  57. Nyhus, E.; Curran, T. Semantic and Perceptual Effects on Recognition Memory: Evidence from ERP. Brain Res. 2009, 1283, 102–114. [Google Scholar] [CrossRef]
  58. Field, A. Discovering Statistics Using SPSS: Book Plus Code for E version of Text; SAGE Publications Ltd.: New York, NY, USA, 2009; ISBN 978-1849204088. [Google Scholar]
  59. Lynch, K. The Image of the City; MIT Press: London, UK, 1960; ISBN 9780262620017. [Google Scholar]
  60. Shi, S.; Gou, Z.; Chen, L.H.C. How does Enclosure Influence Environmental Preferences? A Cognitive Study on Urban Public Open Spaces in Hong Kong. Sustain. Cities Society 2014, 13, 148–156. [Google Scholar] [CrossRef]
  61. Li, W.; Ouyang, Z.; Meng, X.; Wang, X. Plant Species Composition in Relation to Green Cover Configuration and Function of Urban Parks in Beijing, China. Ecol. Res. 2006, 21, 221–237. [Google Scholar] [CrossRef]
  62. Li, W. Study on Designing of Landscape Plant Space: A Case of the West Lake Green Space in Hangzhou. Master’s Thesis, Zhejiang University, Hangzhou, China, 2007. [Google Scholar]
  63. Lü, H. Research on the Relationship between Recreation Activity and Space of the City Park. Ph.D. Thesis, Shandong Agricultural University, Jinan, China, 2013. [Google Scholar]
  64. Herzog, T.R.; Miller, E.J. The Role of Mystery in Perceived Danger and Environmental Preference. Environ. Behav. 1998, 30, 429–444. [Google Scholar] [CrossRef]
  65. Li, D.; Liu, G.; Hao, F. Study on the Use of Function of Urban Parks: Two Cases of Shijiazhuang Chang’ an Park and Shuishang Park. Chin. Agric. Sci. Bull. 2010, 26, 210–2014. [Google Scholar]
Figure 1. Maps showing the overall view of Litchi Park and the four viewpoints.
Sustainability 11 01809 g001
Figure 2. Schemes showing the foreground, middle ground, and background in a scene.
Sustainability 11 01809 g002
Figure 3. The 16 computer-simulated scenes showing different vegetation-created levels of enclosure.
Sustainability 11 01809 g003
Figure 4. The estimated marginal means showing the relationship between enclosure and the aesthetic preference.
Sustainability 11 01809 g004
Table 1. The classification and description of the Permeability of Enclosure according to Robinson [18].
Permeability of EnclosureDescriptionTypology
Visually open,
physically open
Planting at knee height or below allows complete visibility and movement, or having branches above eye level allows physical movement. Sustainability 11 01809 i001
Visually enclosed,
physically enclosed
Trees forming canopies block visibility, or there are big shrub canopies at eye level, with knee-height shrubs or ground cover to stop movement. Sustainability 11 01809 i002
Visually open,
physically enclosed
Full visibility is provided by planting below eye level; shrubs are planted at knee height to hinder movement. Sustainability 11 01809 i003
Visually enclosed,
physically open
Trees forming canopies block visibility, but the trunks still allow movement. Sustainability 11 01809 i004
Table 2. The vegetation species used in each viewpoint [41].
ViewpointVegetation Species
Viewpoint A and CRoystonea regia (Kunth) O.F.Cook,
Lagerstroemia speciosa (L.) Pers.,
Ficus microcarpa L. f. cv. Golden Leaves, and
Wedelia chinensis (Osbeck) Merr.
Viewpoint BLitchi chinensis Sonn.,
Ficus microcarpa L. f. cv. Golden Leaves, and
Wedelia chinensis (Osbeck) Merr.
Viewpoint DRoystonea regia (Kunth) O.F.Cook,
Rhapis gracilis Burret,
Ficus microcarpa L. f. cv. Golden Leaves, and
Wedelia chinensis (Osbeck) Merr.
Table 3. The overall ANOVA results of enclosure and aesthetic preference.
FactorsCoherenceComplexityLegibility
Visual enclosureF = 46.178, p < 0.001F = 51.271, p < 0.001F = 245.558, p < 0.001
Physical enclosureF = 14.285, p < 0.001F = 490.543, p < 0.001F = 286.573, p < 0.001
Visual enclosure and Physical enclosureF = 14.285, p < 0.001F = 1.081, p = 0.299, NSF = 13.961, p < 0.001
Table 4. The Paired-Samples T-Test of aesthetic preference and physical enclosure of Viewpoint A.
Pair No.Aesthetic Preference for ScenesSig.Mean
Pair 1CoVPOO_A1 vs. CoVPOC_A20.000 ***2.94 vs. 3.15
Pair 2CoVPCO_A3 vs. CoVPCC_A40.000 ***2.84 vs. 3.14
Pair 3CVPOO_A1 vs. CVPOC_A20.000 ***2.96 vs. 3.44
Pair 4CVPCO_A3 vs. CVPCC_A40.000 ***3.01 vs. 3.53
Pair 5LVPOO_A1 vs. LVPOC_A20.000 ***2.97 vs. 3.30
Pair 6LVPCO_A3 vs. LVPCC_A40.000 ***2.99 vs. 3.53
Note: Co—coherence, C—complexity, and L—legibility; VPOO—Visual open, Physical open; VPCO—Visual enclosed, Physical open; VPOC—Visual open, Physical enclosed; and VPCC—Visual enclosed, Physical enclosed; ***means significantly correlated.
Table 5. Paired-Samples T-Test of complexity, legibility, and physical enclosure of Viewpoints B, C, and D.
Pair No.Aesthetic Preference for ScenesMeanSig.Pair No.Aesthetic Preference for ScenesMeanSig.
Pair 1LVPCO_B1
LVPCC_B4
2.69
3.41
0.000 ***Pair 7CVPCO_B1
CVPCC_B4
2.48
3.47
0.000 ***
Pair 2LVPOO_B3
LVPOC_B2
2.53
3.20
0.000 ***Pair 8CVPOO_B3
CVPOC_B2
2.5
63.42
0.000 ***
Pair 3LVPOO_C2
LVPOC_C1
1.99
2.24
0.000 ***Pair 9CVPOO_C2
CVPOC_C1
2.2
62.89
0.000 ***
Pair 4LVPCO_C4
LVPCC_C3
2.97
3.80
0.000 ***Pair 10CVPCO_C4
CVPCC_C3
2.85
3.76
0.000 ***
Pair 5LVPCO_D3
LVPCC_D1
2.98
3.74
0.000 ***Pair 11CVPCO_D3
CVPCC_D1
2.83
3.56
0.000 ***
Pair 6LVPOO_D4
LVPOC_D2
2.52
3.06
0.000 ***Pair 12CVPOO_D4
CVPOC_D2
2.61
3.44
0.000 ***
Note: Co—coherence, C—complexity, and L—legibility; VPOO—Visual open, Physical open; VPCO—Visual enclosed, Physical open; VPOC—Visual open, Physical enclosed; and VPCC—Visual enclosed, Physical enclosed; ***means significantly correlated.
Table 6. The Paired-Samples T-Test of aesthetic preference and visual enclosure of Viewpoints A, B, C, and D.
Pair No.Aesthetic Preference
for Scenes
MeanSig.Pair No.Aesthetic Preference
for Scenes
MeanSig.
Pair 1CoVPOO_A12.940.090Pair 7CoVPOC_B23.061.000
CoVPCO_A32.84CoVPCC_B43.06
Pair 2CoVPOC_A23.130.474Pair 8CoVPOO_B33.050.000 ***
CoVPCC_A43.17CoVPCO_B12.83
Pair 3CVPOO_A12.970.404Pair 9CoVPOC_C12.290.000 ***
CVPCO_A33.02CoVPCC_C33.40
Pair 4CVPOC_A23.470.160Pair 10CoVPOO_C22.430.000 ***
CVPCC_A43.55CoVPCO_C42.96
Pair 5LVPOO_A13.000.946Pair 11CoVPOC_D22.840.000 ***
LVPCO_A33.01CoVPCC_D13.19
Pair 6LVPOC_A23.330.001***Pair 12CoVPOO_D42.910.008 ***
LVPCC_A43.52CoVPCO_D33.09
Note: Co—coherence, C—complexity, and L—legibility; VPOO—Visual open, Physical open; VPCO—Visual enclosed, Physical open; VPOC—Visual open, Physical enclosed; and VPCC—Visual enclosed, Physical enclosed; ***means significantly correlated.
Table 7. The Paired-Samples T-Test of complexity, legibility, and visual enclosure of Viewpoints B, C, and D.
Pair No.Aesthetic Preference
for Scenes
MeanSig.Pair No.Aesthetic Preference
for Scenes
MeanSig.
Pair 13CVPOO_B32.560.194Pair 19LVPOO_B32.530.000 ***
CVPCO_B12.49LVPOC_B23.20
Pair 14CVPOC_B23.410.301Pair 20LVPCO_B12.690.000 ***
CVPCC_B43.47LVPCC_B43.41
Pair 15CVPOO_C22.240.000 ***Pair 21LVPOO_C21.960.000 ***
CVPCO_C42.85LVPCO_C42.97
Pair 16CVPOC_C12.890.000 ***Pair 22LVPOC_C12.250.000 ***
CVPCC_C33.76LVPCC_C33.80
Pair 17CVPOO_D42.610.001 ***Pair 23LVPOO_D42.520.000 ***
CVPCO_D32.82LVPCO_D32.98
Pair 18CVPOC_D23.450.063Pair 24LVPOC_D23.070.000 ***
CVPCC_D13.57LVPCC_D13.73
Note: Co—coherence, C—complexity, and L—legibility; VPOO—Visual open, Physical open; VPCO—Visual enclosed, Physical open; VPOC—Visual open, Physical enclosed; and VPCC—Visual enclosed, Physical enclosed; ***means significantly correlated.

