Article

Uncovering Variations, Determinants, and Disparities of Multisector-Level Final Energy Use of Industries Across Cities

College of New Energy and Environment, Jilin University, Changchun 130012, China
*
Author to whom correspondence should be addressed.
Sustainability 2019, 11(6), 1806; https://doi.org/10.3390/su11061806
Submission received: 3 March 2019 / Revised: 21 March 2019 / Accepted: 22 March 2019 / Published: 25 March 2019
(This article belongs to the Section Energy Sustainability)

Abstract

:
With continuous industrialization and urbanization, cities have become the dominator of energy consumption, to which industry is making leading contribution among all sectors. Given the insufficiency in comparative study on the drivers of energy use across cities at multisector level, this study selected seven representative cities in China to quantify and analyze the contributions of factors to changes in final energy use (FEU) in industrial aggregate and sectoral levels by using Logarithmic Mean Divisia Index method. Disparities in the drivers of industrial FEU across cities were explicitly revealed within two stages (2005–2010 and 2010–2015). Some key findings are presented as follows. Alongside the increase in industrial output of seven cities within two stages, the variation trends in industrial FEU are different. Industrial output effect (contribution rate 16.7% ~ 184.0%) and energy intensity effect (contribution rate −8.6% ~ −76.5%) contributed to the increase in aggregate FEU positively and negatively, respectively. Beijing had the largest contribution share of industrial structure effect (−24.4% and −12.8%), followed by Shenyang and Xi’an. Contributions of energy intensity effect and industrial output effect for Chemicals, Nonmetals, Metals, and Manufacture of equipment were much larger than those of other sectors. The results revealed that production technological innovations, phase-out of outdated capacities of energy intensive industries, and industrial restructuring are crucial for reduction in industrial FEU of cities. This study also provided reference to reasonable industrial layout among cities and exertion of technological advantages from a national perspective.

1. Introduction

Industrialization, urbanization, and economic growth are accompanied by continuously increasing energy demand and consumption, which lead to progressively serious greenhouse gases (GHGs) and atmospheric pollutant emissions, especially in developing countries [1,2,3]. Experiencing a rapid growth stage of economy, China, a middle-income country, has become the world’s leading energy consumer (since 2009) and carbon dioxide (CO2) emitter (since 2006) [4,5]. China consumed 23.2% of the world’s primary energy in 2017, among which fossil energy accounted for 86.4% of total [6]. Emphatically, China consumed (50.7%) as much coal as the rest of world integrated in 2017. Coal consumption dominated the total primary energy consumption, accounting for 60.4% [6], which has induced the largest emission amount of CO2 and air pollutants. Meanwhile, China is still in the progress of rapid urbanization (projected to rise to 60% by 2020) and industrialization, which makes China confronted with challenges of increasing energy demand and related environmental issues [4]. Thus, it is urgent and significant to clarify the characteristics of energy demand and explore factors that influence energy demand [7]. Further, cities dominate the energy consumption, and industrial sectors with higher energy intensity make leading contributions to economic growth and energy consumption in China [8,9]. Investigation of factors influencing energy consumption of cities’ industrial activities will help China formulate policies on the sustainable development of economy and energy.
Decomposition analysis, as one of the most widely used approaches, performs well on quantifying the determinants of changes in energy consumption and related emissions [10]. The index decomposition analysis (IDA) approach, categorized into Laspeyres index decomposition and Divisia index decomposition [11,12], is more broadly used due to its advantages in relatively less data requirements, diverse decomposition forms, and suitability for time-series analysis [11,13,14]. However, the existences of zero values and a residual in previous IDA approaches were noticed by Ang and Choi [15]. Then, Ang developed the Logarithmic Mean Divisia Index (LMDI) approach which can be used in either multiplicative or additive forms to overcome the above two problems [16]. Given the merits of the LMDI approach over other IDA approaches with regards to the capability to successfully handle zero values and residuals and the computational simplicity, the LMDI approach is considered as the most accurate and practical IDA approach [13,17,18]. Therefore, it has been wildly used in measurement of the driving factors of changes in energy use and emissions at international, national, regional, provincial, city, and industrial levels [5,19,20].
Analysis of the evolution of energy consumption and energy efficiency by using the LMDI method has been conducted across countries, with important contributions, such as analysis of changes in aggregate energy consumption of EU-27 [21], measurement of drivers of energy intensity in 40 major economies [22] and 20 European countries [23], and investigation of changes in energy efficiency of four countries (Brazil, China, Portugal, and UK), with different energy mix and economic background [24]. Studies with focus on individual nations were also conducted, such as decomposition analysis of sectoral energy consumption in Turkey [25], changes in aggregate energy intensity in Australia [26] and Lithuania [27], decomposition of energy efficiency in South Africa [28], analysis of energy efficiency policies launched in Russia [29], and a more recent study focusing on clarifying the contributions of energy efficiency measures through analysis the changes in 11 industrial subsectors’ final fuel use in Andalusia of Spain [30]. Further, some studies used LMDI to quantify the contributions of drivers of changes in energy use and efficiency for some specific sectors, including monitoring of European industry’ energy efficiency [31], decomposition of Thai industry’s energy intensity [32], analyses of manufacturing energy use in Greece and South Korea [33,34], the electricity sector in South Africa [35], and the services sector in France [36]. As climate changes and air pollution become more concerning, analyses of drivers of energy-related emissions using LMDI approach have subsequently emerged, as in the following contributions: comparative analysis of GHGs or CO2 emissions among nations [37,38,39,40], analysis of driving forces for some developed countries [3,41,42], developing countries [43] or focus on manufacturing sectors [44,45,46].
For the case of China, there has been a proliferation of studies regarding analysis of energy consumption and related emissions based on the LMDI approach. Three outstanding studies used LMDI methods to identify the factors (production effect, structural effect, and efficiency effect) that induced China’s energy intensity to fluctuate and quantify the contribution of each factor within three stages: 1980–2003 [47], 1998–2006 [48], and 2000–2009 [49]. Then, energy intensity in China’s energy intensive industries was investigated by Tan and Lin to discover the factors leading its changes at regional and provincial scales during 2000–2013 [50]. As coal is dominating the energy structure of China, Chong et al. illustrated the factors inducing coal use growth using the LMDI method [51]. From the specific perspective of economic sectors, contributions of factors to changes in energy consumption in China’s transportation and residential commercial sectors were successfully revealed [52,53].
Studies focusing on China’s energy-related emissions using an LMDI approach have surged in recent years. At the national level, changes in GHGs or CO2 emissions from energy use driven by factors were conducted based on several groups of sectors [5,10,54,55,56]. Some contributions were concentrated on decomposing China’s industrial CO2 emission, which dominated the total energy-related carbon emissions of economic activities [9,57,58]. Further, the range of industrial sectors was narrowed to six energy intensive industrial sectors [19,59]. China was also divided into three regions and 30 provinces with different classification of sectors to analyze the spatial and sectoral disparities in driving forces of emissions [8,14,60,61,62,63]. Apart from them, the LMDI approach has been applied to decompose emissions at provincial or city levels and measure the factors’ contributions [64,65,66,67], and to clarify the changes in emissions of some specific sectors [68,69,70]. More recently, Shi et al. conducted a valuable comparison work for decomposing per capita urban carbon emissions for Shanghai, Beijing, Chongqing, and Tianjin, providing insights into emission reduction ways [4].
As reviewed above, based on LMDI models, most studies focused on exploring the drivers of changes in aggregate or sectoral energy use, energy intensity, and related emissions across nations, regions, and provinces, or at the level of individual country, province, and city. Some scholars began to characterize provincial differences in driving factors and uncover the underlying reasons that induced the disparities in China. However, few studies have comparatively analyzed the drivers of energy use and related emissions across cities (with different characteristics of economic development, industrial structure, and energy consumption) at the multisector level. To fill such gaps, considering cities and industrial sectors’ leading role in economy and energy use, the main goal of this research is to quantify and analyze the contributions of factors to changes in final energy use (FEU) of industrial sectors in multiple Chinese cities, characterized with different economic development level, industrial structure, and resource endowments. The originality of this research lies in the initial clarification of the disparities in the drivers of industrial FEU (Industrial FEU refers to the total final energy use of all the industrial sectors, the same in the following context) across cities and the identification of inducers of these differences. This study contributes to providing insights into the effects on FEU of economic and energy policies/measures implemented in cities, as well as into future city development strategies related to industrial layout and technology transfer among cities.

2. Methodology and Data
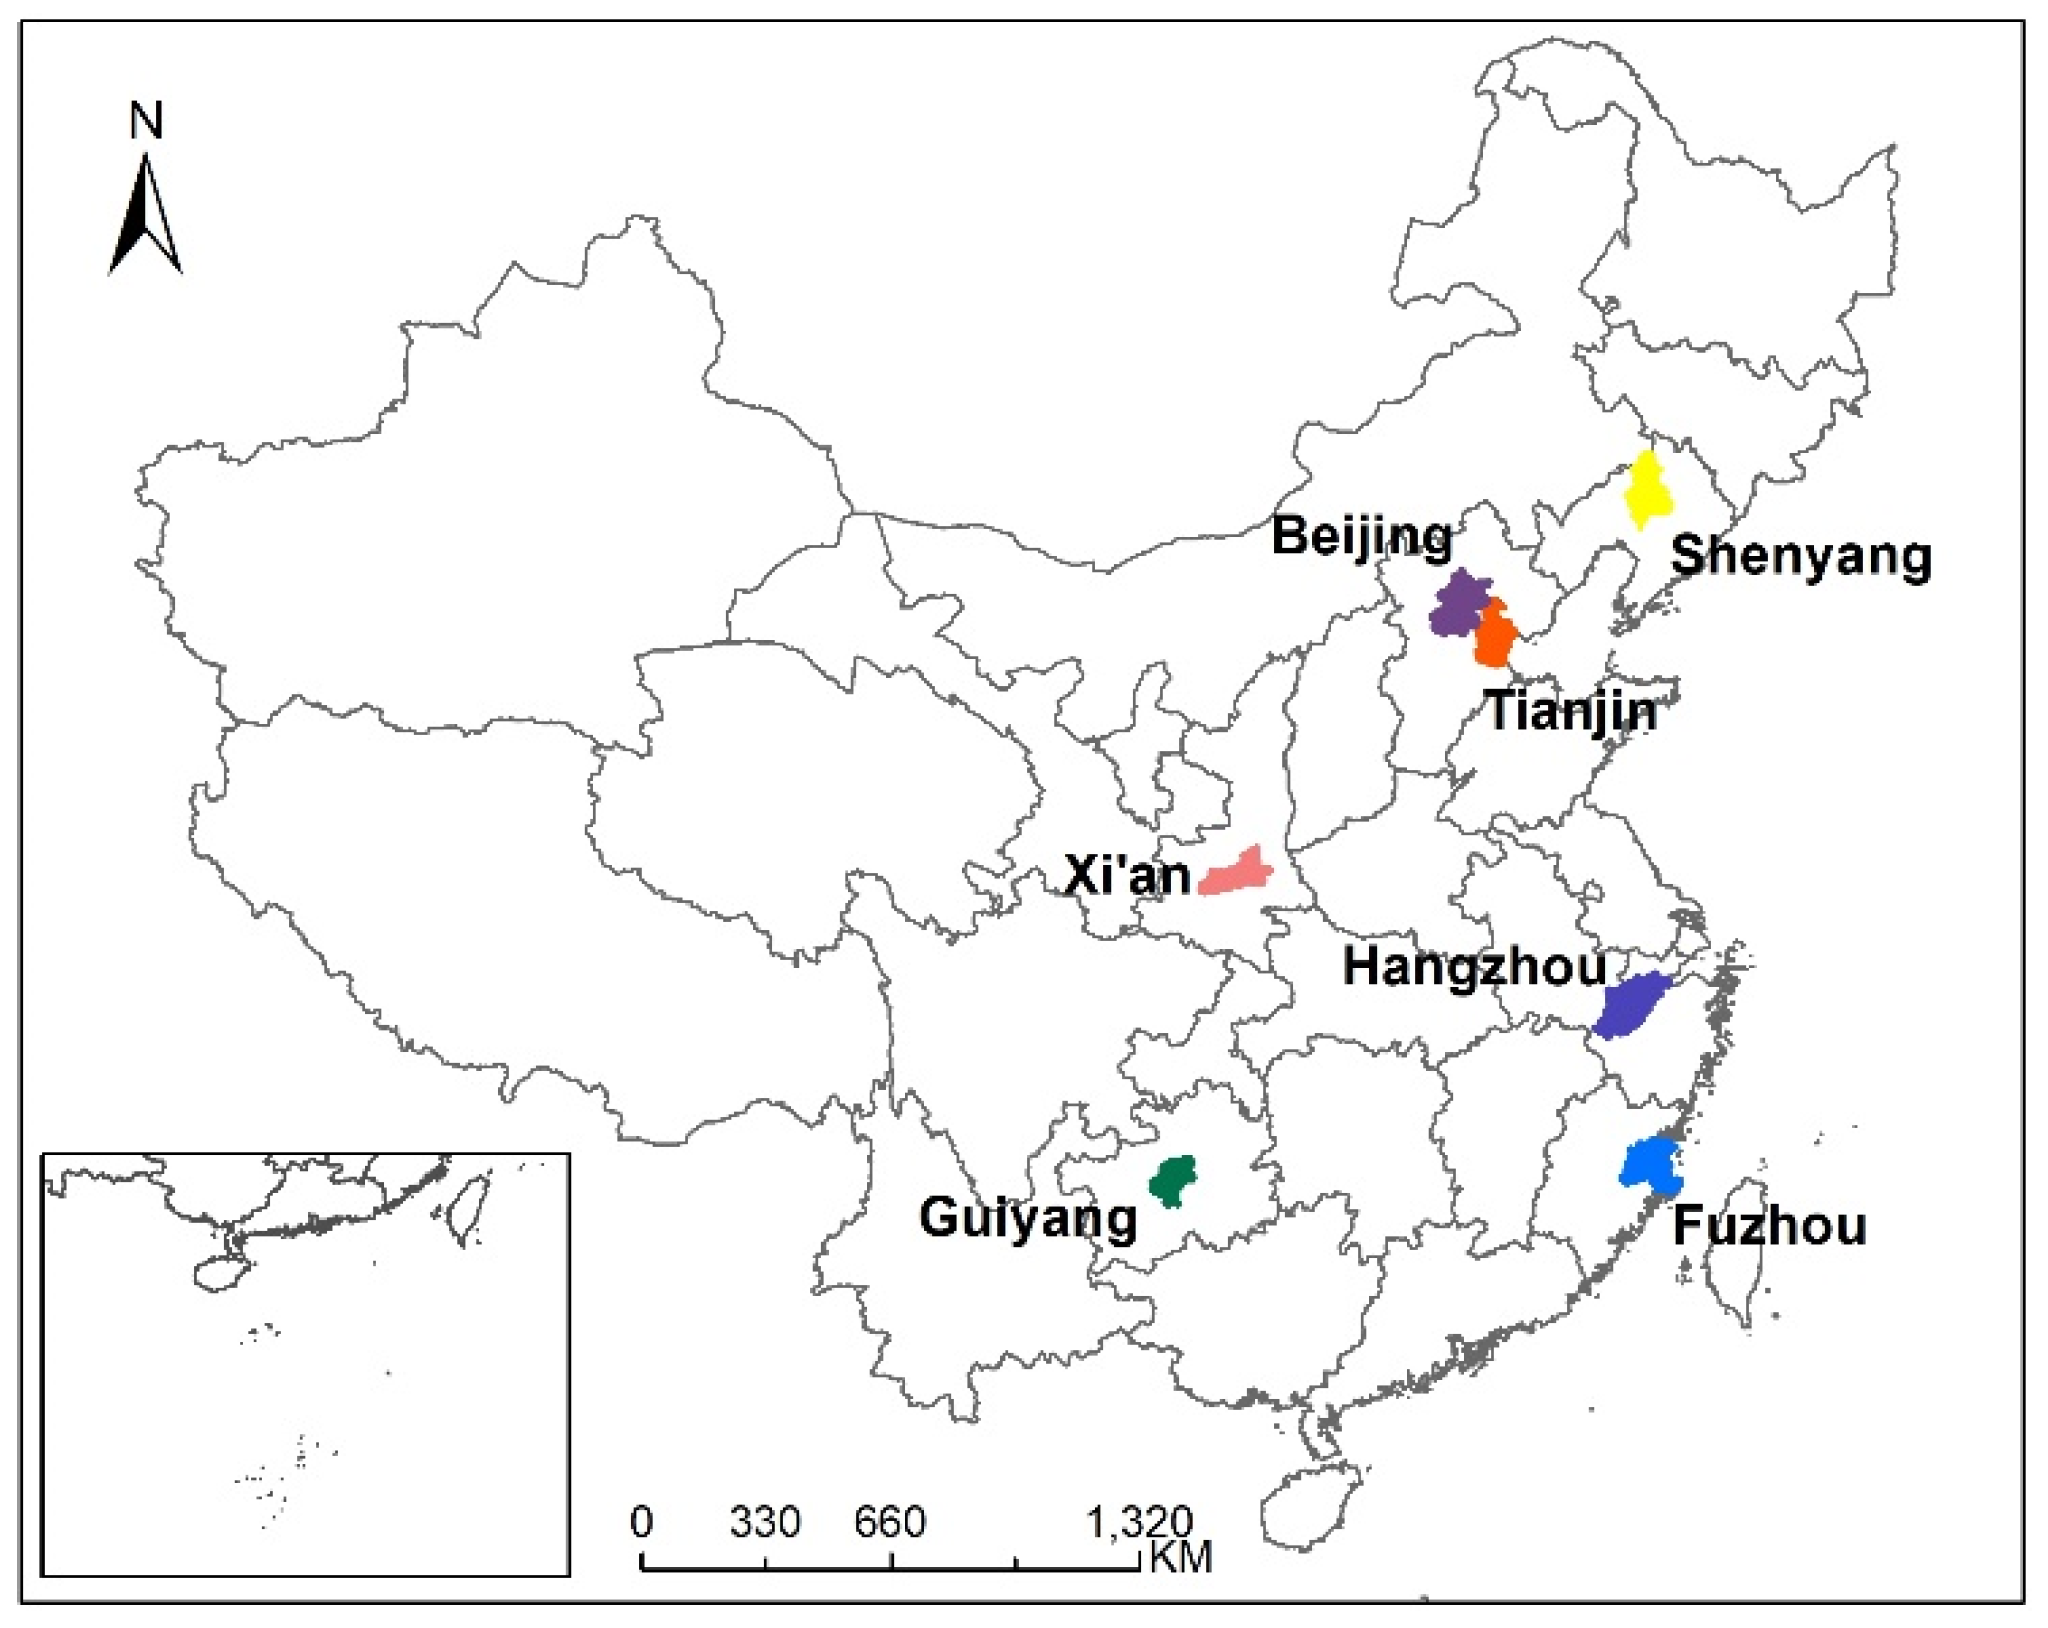
2.1. Target Cities

Decomposition analysis of industrial FEU on city level in China during 2005–2010 and 2010–2015 was carried out. Seven representative Chinese cities, namely Beijing, Tianjin, Hangzhou, Shenyang, Xi’an, Fuzhou, and Guiyang were targeted considering disparities of spatial distribution (see Figure 1), Gross Domestic Production (GDP), GDP ranking, the percentage of industrial added value in GDP (see Table 1), industrial structure, and industrial FEU structure (see Figure 2). Shenyang and Tianjin are typical cities located in the Northeast old industrial base and the Jing-Jin-Ji agglomerations, respectively, with industrial added value accounting for more than 40% of its total GDP in 2015. Beijing, as the capital and political and cultural center of China, is experiencing remarkable change in its industrial structure, with tertiary industry accounting for 79.7% of its total GDP in 2015 (see Table S1 in Supporting Information). Xi’an as a central city in the West China is a renowned cultural and tourist city and an important core link of “One Belt-One Road” region, with industrial added value accounting for 23.7% of its total GDP in 2015. Hangzhou is a core city of Yangtze River Delta agglomerations and an important manufacturing base with staggering development speed. Guiyang is a relatively less developed city located in the Southwest China and is the Big Data Center of China with resource utilization industry as one of its pillars. Fuzhou is a central city in the Southeast China, with industrial added value accounting for 33.4% of its total GDP in 2015.
In this study, the total 41 subdivided industrial sectors (corresponding to the statistics) were aggregated into ten sectors for unified consideration (see Table 2 and Table S2 in Supporting Information). Among the seven cities, Manufacture of equipment (IS9) is the dominant contributor to industrial total output in 2015, except in Fuzhou and Guiyang, with the percentage of added value of IS9 in total in Beijing, Shenyang and Xi’an accounting for over 64.0% (see Figure 2). For Fuzhou and Guiyang, the dominant contributor is Light industry (31.8%) and Chemicals (30.1%), respectively. As for energy consumption, Production and supply of electricity, heat, gas, and water, Metals, and Light industry are the largest contributors for Beijing (29.1%), Tianjin (44.2%), and Hangzhou (26.7%), respectively. Shenyang’s and Xi’an’s largest industrial energy consumption contributor is IS9 (34.3% and 24.3%, respectively). More detailed information regarding industrial FEU and output is illustrated in Figure 2.

2.2. LMDI Model Formulation

In this study, a city’s industrial FEU and the influencing factors, including industrial output, industrial structure, energy intensity, and energy structure, can be formulated according to the Kaya identity:
E k = i E i k = i j E i j k E i k E i k Q i k Q i k Q k Q k
where superscript k denotes the k-th city. Subscripts i and j denote the i-th sector and j-th fuel type, respectively. E denotes industrial FEU. Q represents industrial output.
Equation (1) can be symbolized as follows:
E k = i j E S i j k E I i k I S i k Q k
Where E S i j k = E i j k / E i k denotes the share of fuel j in total industrial FEU of sector i in city k. E I i k = E i k / Q i k is energy intensity of sector i in city k. I S i k = Q i k / Q k is the share of sector i ‘s output in total industrial output in city k.
Based on the LMDI approach, the additive decomposition was applied to decompose the changes in industrial FEU ( Δ E t o t k ) in city k from year t − 1 to t into consequences of four effects: energy structure effect ( E E S k ), energy intensity effect ( Δ E E I k ), industrial structure effect ( Δ E I S k ), and industrial output effect ( Δ E Q k ).
Δ E t o t k = Δ E t k Δ E t 1 k = Δ E E S k + Δ E E I k + Δ E I S k + Δ E Q k
where Δ E t k and Δ E t 1 k denote industrial FEU in year t and t − 1 in city k. According to the LMDI approach, each effect can be formulated as follows:
Δ E E S k = i j L ( E i j , t k , E i j , t 1 k ) l n ( E S i j , t k E S i j , t 1 k )
Δ E E I k = i j L ( E i j , t k , E i j , t 1 k ) l n ( E I i , t k E I i , t 1 k )
Δ E I S k = i j L ( E i j , t k , E i j , t 1 k ) l n ( I S i , t k I S i , t 1 k )
Δ E Q k = i j L ( E i j , t k , E i j , t 1 k ) l n ( Q t k Q t 1 k )
where L ( E i j , t k , E i j , t 1 k ) is the logarithmic mean weight, and is defined as:
L ( E i j , t k , E i j , t 1 k ) = { ( E i j , t k E i j , t 1 k ) / ( l n E i j , t k l n E i j , t 1 k ) , E i j , t k E i j , t 1 k E i j , t k   o r   E i j , t 1 k , E i j , t k = E i j , t 1 k

2.3. Data

Considering the accessibility of the time-series data of the seven representative cities, this study focused on decomposing the changes in industrial FEU within two stages: “the eleventh five-year period” (2005–2010) and “the twelfth five-year period” (2010–2015). Two sets of data for the ten industrial sectors (Table 2) of the seven cities were required, including output values and industrial FEU. All kinds of time-series statistical yearbooks where the data were collected are listed in Table S3 in the Supporting Information.
Sectoral output data: The output of the ten industrial sectors in the seven cities in 2005, 2010, and 2015 were obtained from statistical yearbooks of the cities (see Table S3 in Supporting Information). The output in 2010 and 2015 were deflated to 2005 prices using the producer price data for the industrial sectors during 2006–2015 collected from statistical yearbooks of the cities or corresponding provinces (see Table S3).
Industrial FEU data: Data on various types of FEU (including electricity and heat) were obtained from statistical yearbooks of the cities (Table S3). All final energy types for each industrial sector were aggregated into coal products, oil products, natural gas, and electricity and heat. All types of energy were converted into standard coal-equivalent for unified summation and comparison by using the coefficients of caloric values for different energy types collected from China Energy Statistical Yearbook (see Table S3).

3. Results

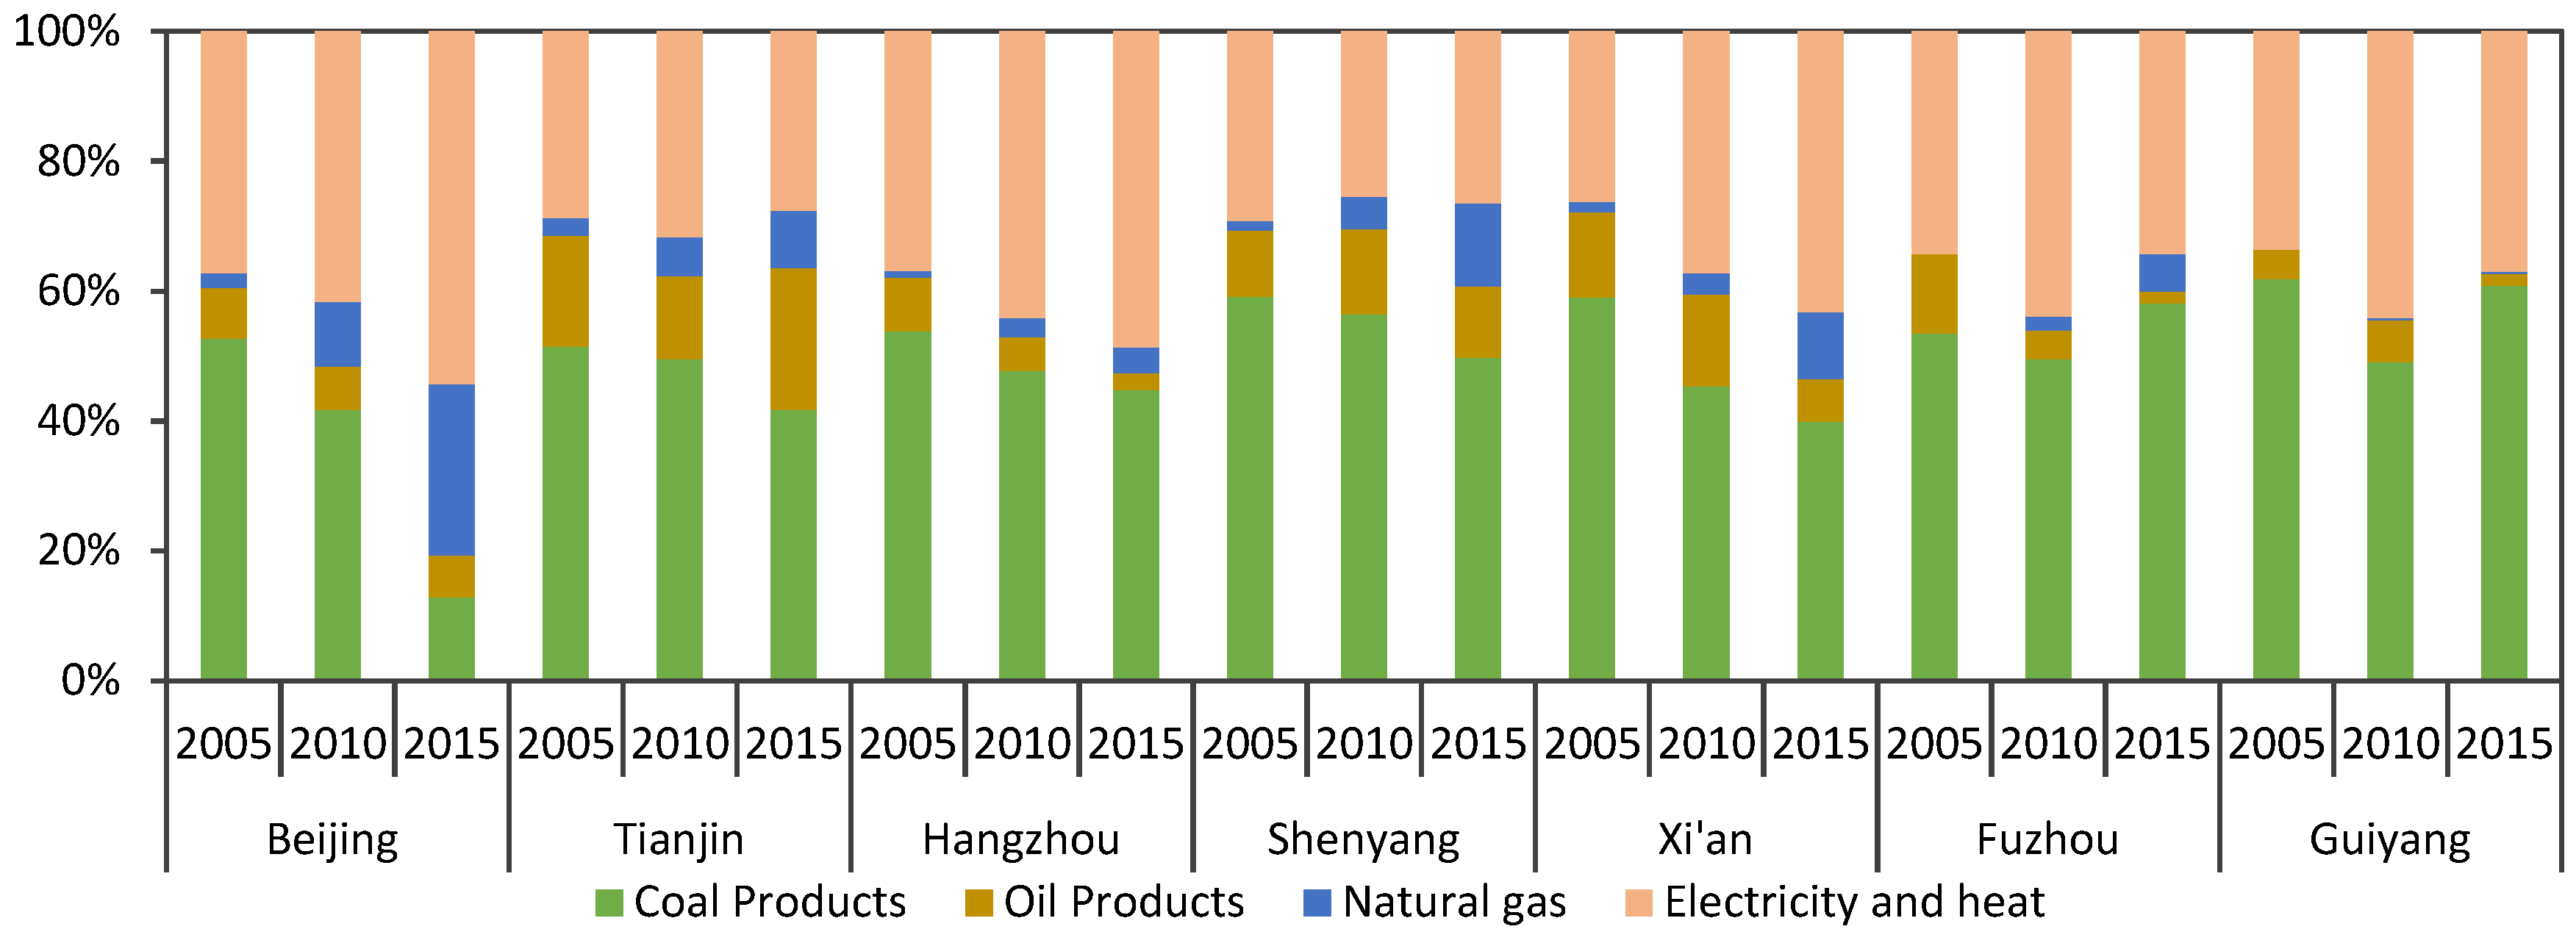
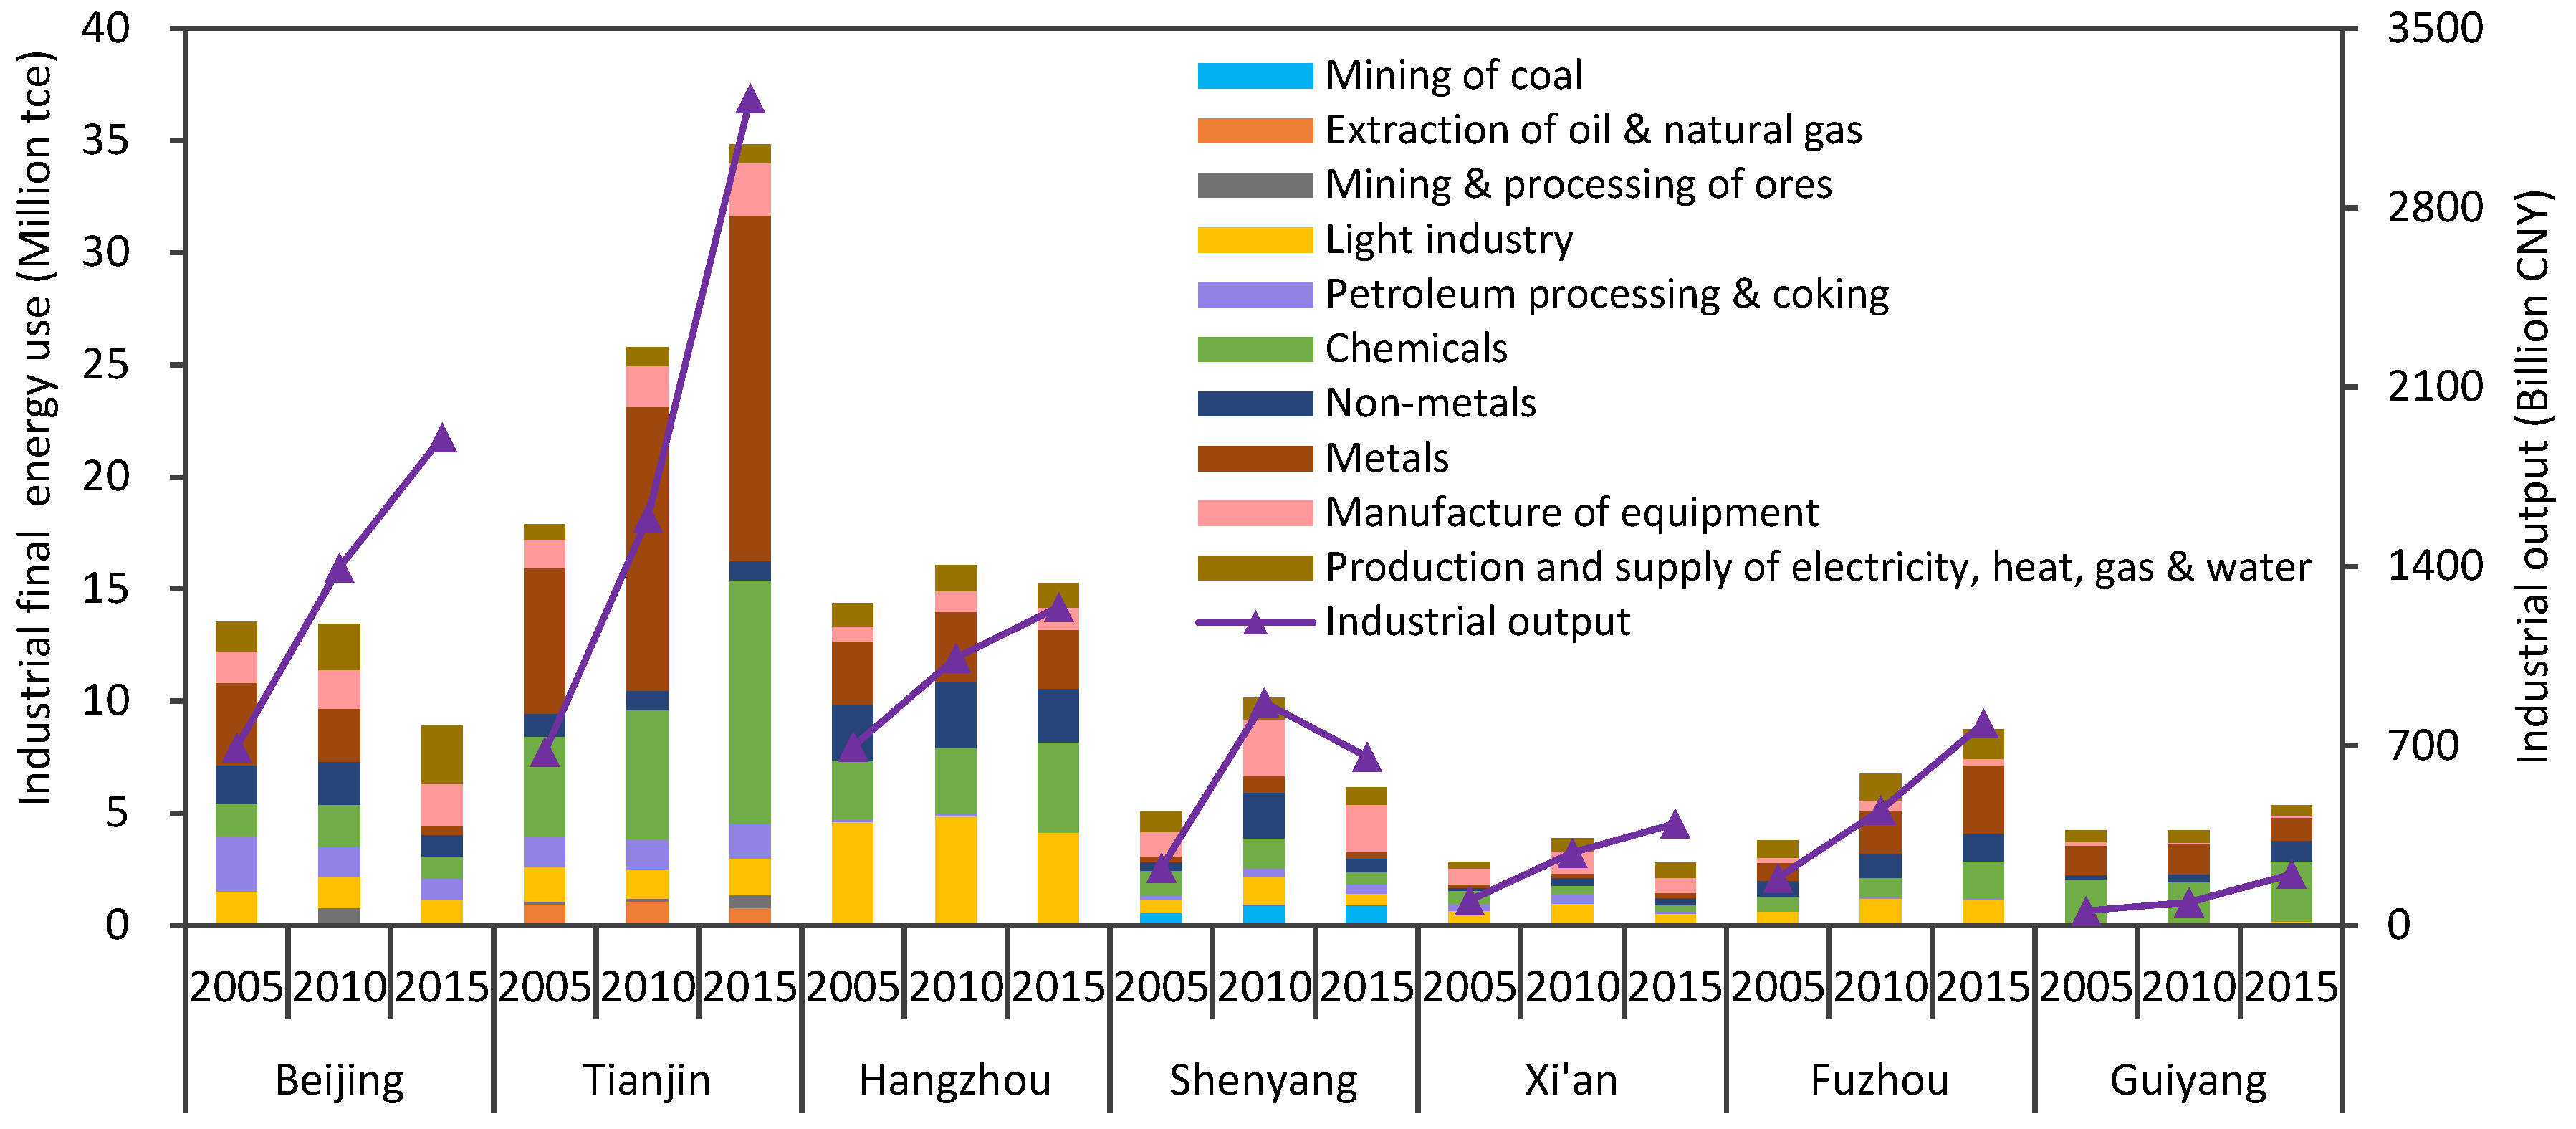
3.1. Changes in Industrial Final Energy Use

The core of this study is to trace and analyze the effects of production activities of the industrial sectors on energy demand. Hence, we focused on the final use of the three major fossil energies (coal, oil, and natural gas) and electricity, without differentiating whether the electricity was produced through fossil energy or renewable energy. Among the seven cities, only total industrial output in Shenyang presented a trend as first increasing (during 2005–2010) and then decreasing (during 2010–2015), which was similar to the trend in industrial FEU. Total industrial output in all the other cities presented continuously increasing trends (see Figure 3), while the trends in industrial FEU were diverse. Beijing’s industrial FEU experienced a first slight and then dramatic decrease, with a 34.1% decrease rate during the second period. Hangzhou’s and Xi’an’s industrial FEU first increased and then decreased. Industrial FEU of Tianjin and Fuzhou kept increasing substantially during 2005–2015.
Shares of FEU of subdivided sectors in total industrial FEU appeared to be divergent among cities and during two periods. Metals (IS8) and Chemicals (IS6) were the top two contributors to industrial FEU in Tianjin and Fuzhou, and the FEU of these two sectors increased continuously. Manufacture of equipment (IS9) was the top contributor to industrial FEU in Shenyang and Xi’an, as these two cities had large proportions of IS9’s output in the total (over 44.5% and 55.6%, respectively, during 2005–2015, see Figure S2 in Supporting Information). While trends in FEU of IS9 in these two cities were different. FEU of Petroleum processing & coking (IS5) and Production and supply of electricity, heat, gas, and water (IS10) in Beijing kept decreasing and increasing, respectively. Guiyang’s top industrial FEU contributor was IS6, with a continuously increasing trend.
The share of natural gas in industrial FEU kept increasing in all cities (Figure 4), whereas the share of coal kept decreasing, except in Fuzhou and Guiyang. The decrease in coal consumption was most substantial in Beijing, with the share decreasing from 52.7% (2005) to 12.8% (2015). Meanwhile, the share of natural gas increased significantly to 26.3% (2015). As a typical petrochemical city, Tianjin had the largest share of oil consumption (21.8% in 2015), followed by Shenyang and Xi’an.

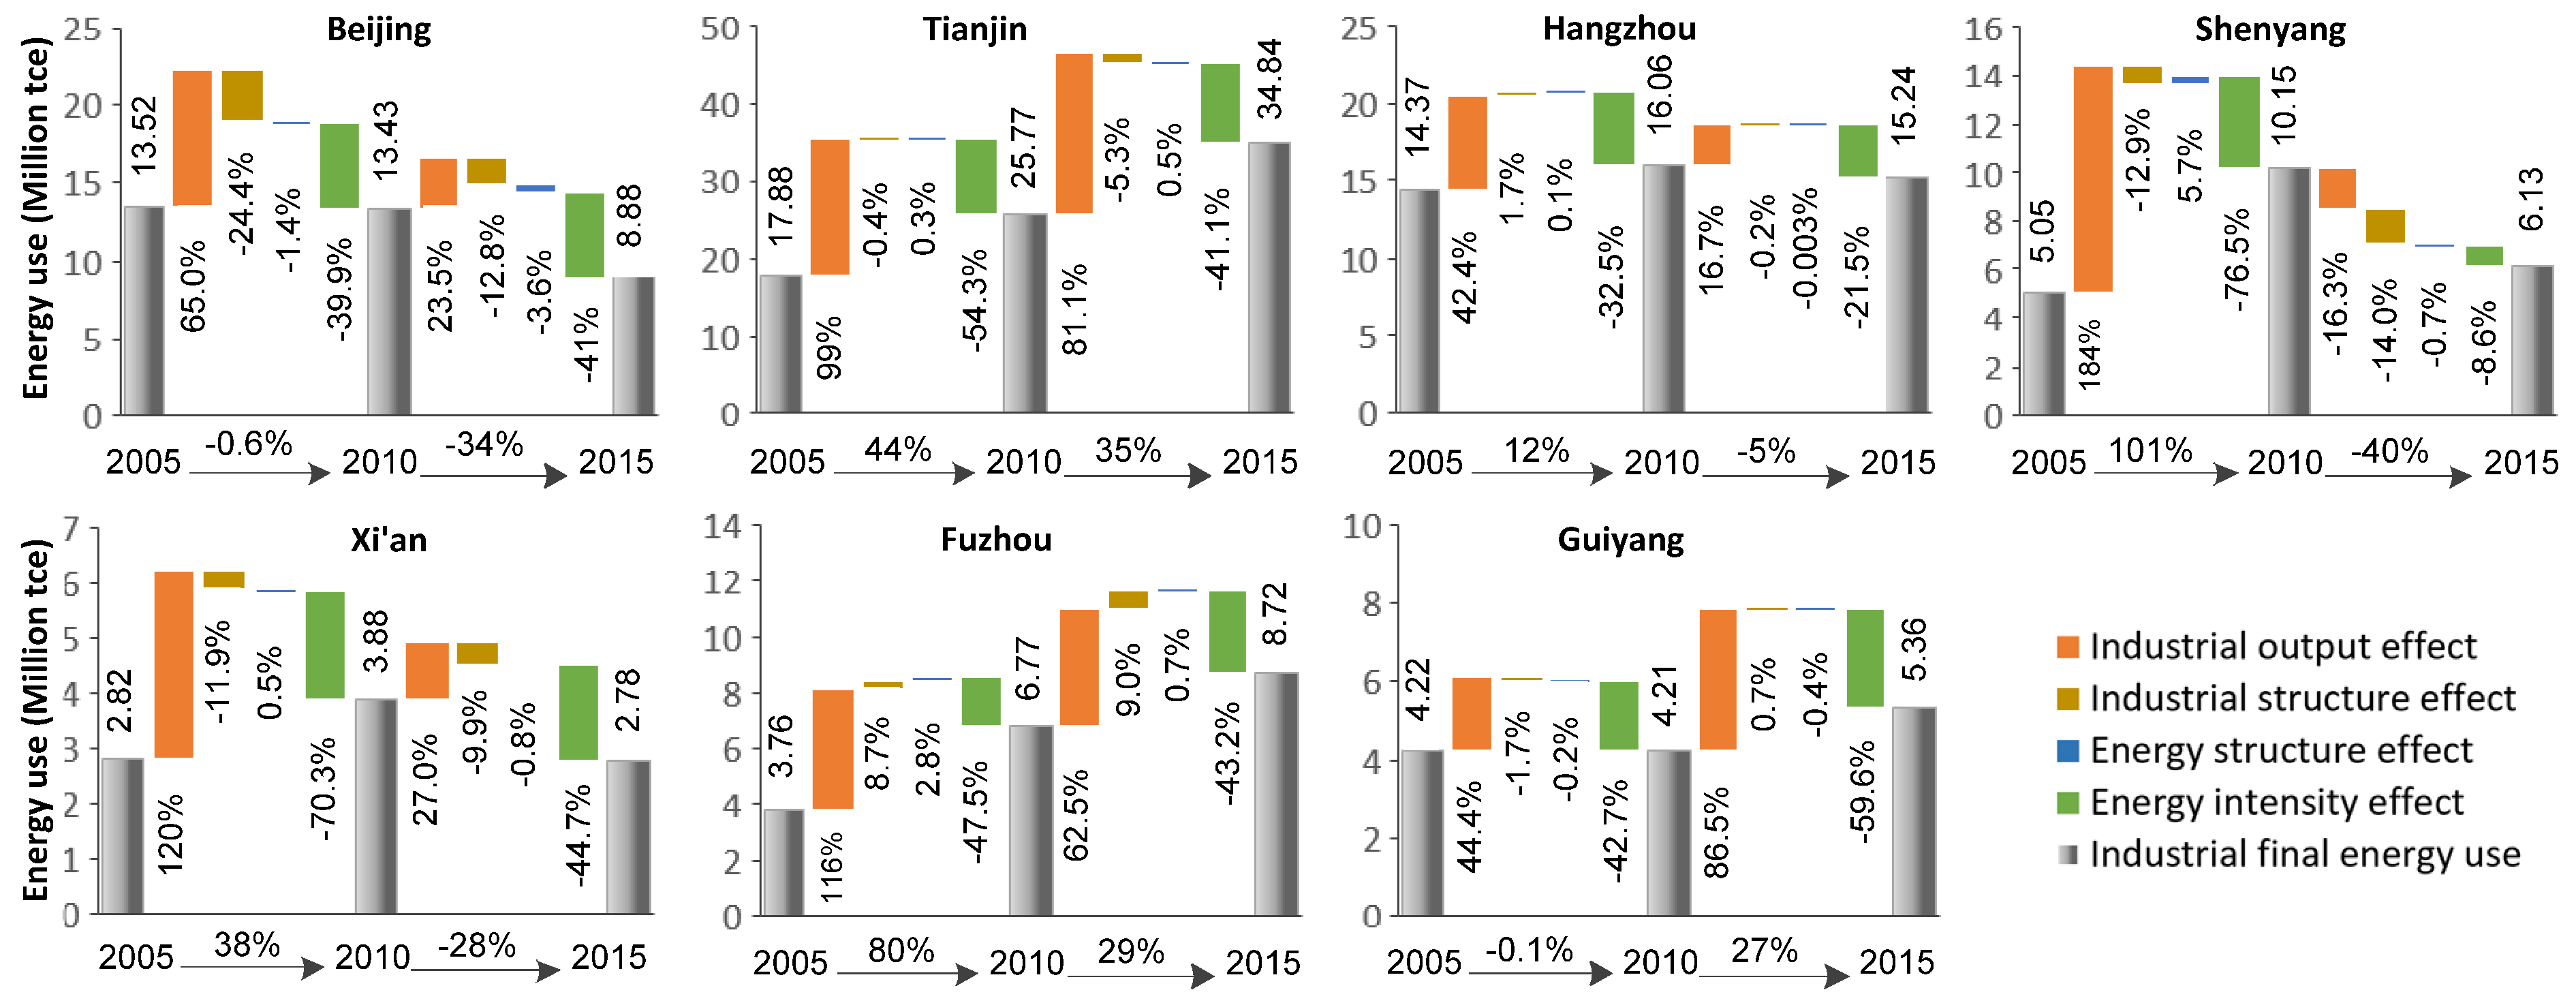
3.2. Determinants of Changes in Aggregate Final Energy Use

Changes in aggregate FEU were decomposed based on the LMDI model to quantify the four factors’ contributions. The decomposition results for seven cities within two stages are illustrated in Figure 5. Industrial output effect was the dominant factor driving the industrial FEU increase in all cities during both stages (with only Shenyang as an exception whose industrial output shrunk during 2010–2015), which is coincidence with the results identified in the previous studies [21,34,71]. During the first stage, the industrial output effect drove a 42.4% ~ 184.0% increase (compared with the value of FEU in 2005) in industrial FEU in all cities, with largest increasing rate appeared in Shenyang. During the second stage, a 16.7% ~ 86.5% increase (compared with the value of FEU in 2010) was driven by the industrial output effect, and Guiyang has the largest increasing rate, followed by Tianjin and Fuzhou. Except in Tianjin and Guiyang, the contribution of the industrial output effect was larger during 2005–2010 than during 2010–2015.
The energy intensity effect was the principal contributor to offsetting the increase in industrial FEU within the two stages in all cities. This implied the decrease in industrial FEU of unit output in all cities, and this result is different from total energy intensity change of China, which fluctuated during 2000–2009 [49] and decreased during 2010–2011 [72]. The contribution rates were −32.5% ~ −70.3%, and −8.6% ~ −59.6% within two stages, respectively. In most cities except Guiyang, the contributions were larger during the second stage, suggesting that the decreasing rate of industrial energy intensity was slowing down compared with that during the first stage. The largest contribution share of the energy intensity effect appeared for Shenyang (76.5%) during 2005–2010. The industrial structure effect was another contributor to decreasing industrial FEU, but with a relatively small contribution compared with the energy intensity effect. Beijing had the largest contribution share of the industrial structure effect (−24.4% and −12.8%) within both stages, followed by Shenyang and Xi’an. Among these cities, output of sectors with smaller energy intensity increased (see Figures S2–S9 in Supporting Information). The contributions of the energy structure effect were tiny compared with those of the other effects, which is consistent with the results of Tan and Lin [50], Cunha et al. [24], and Zhang and Guo [53].

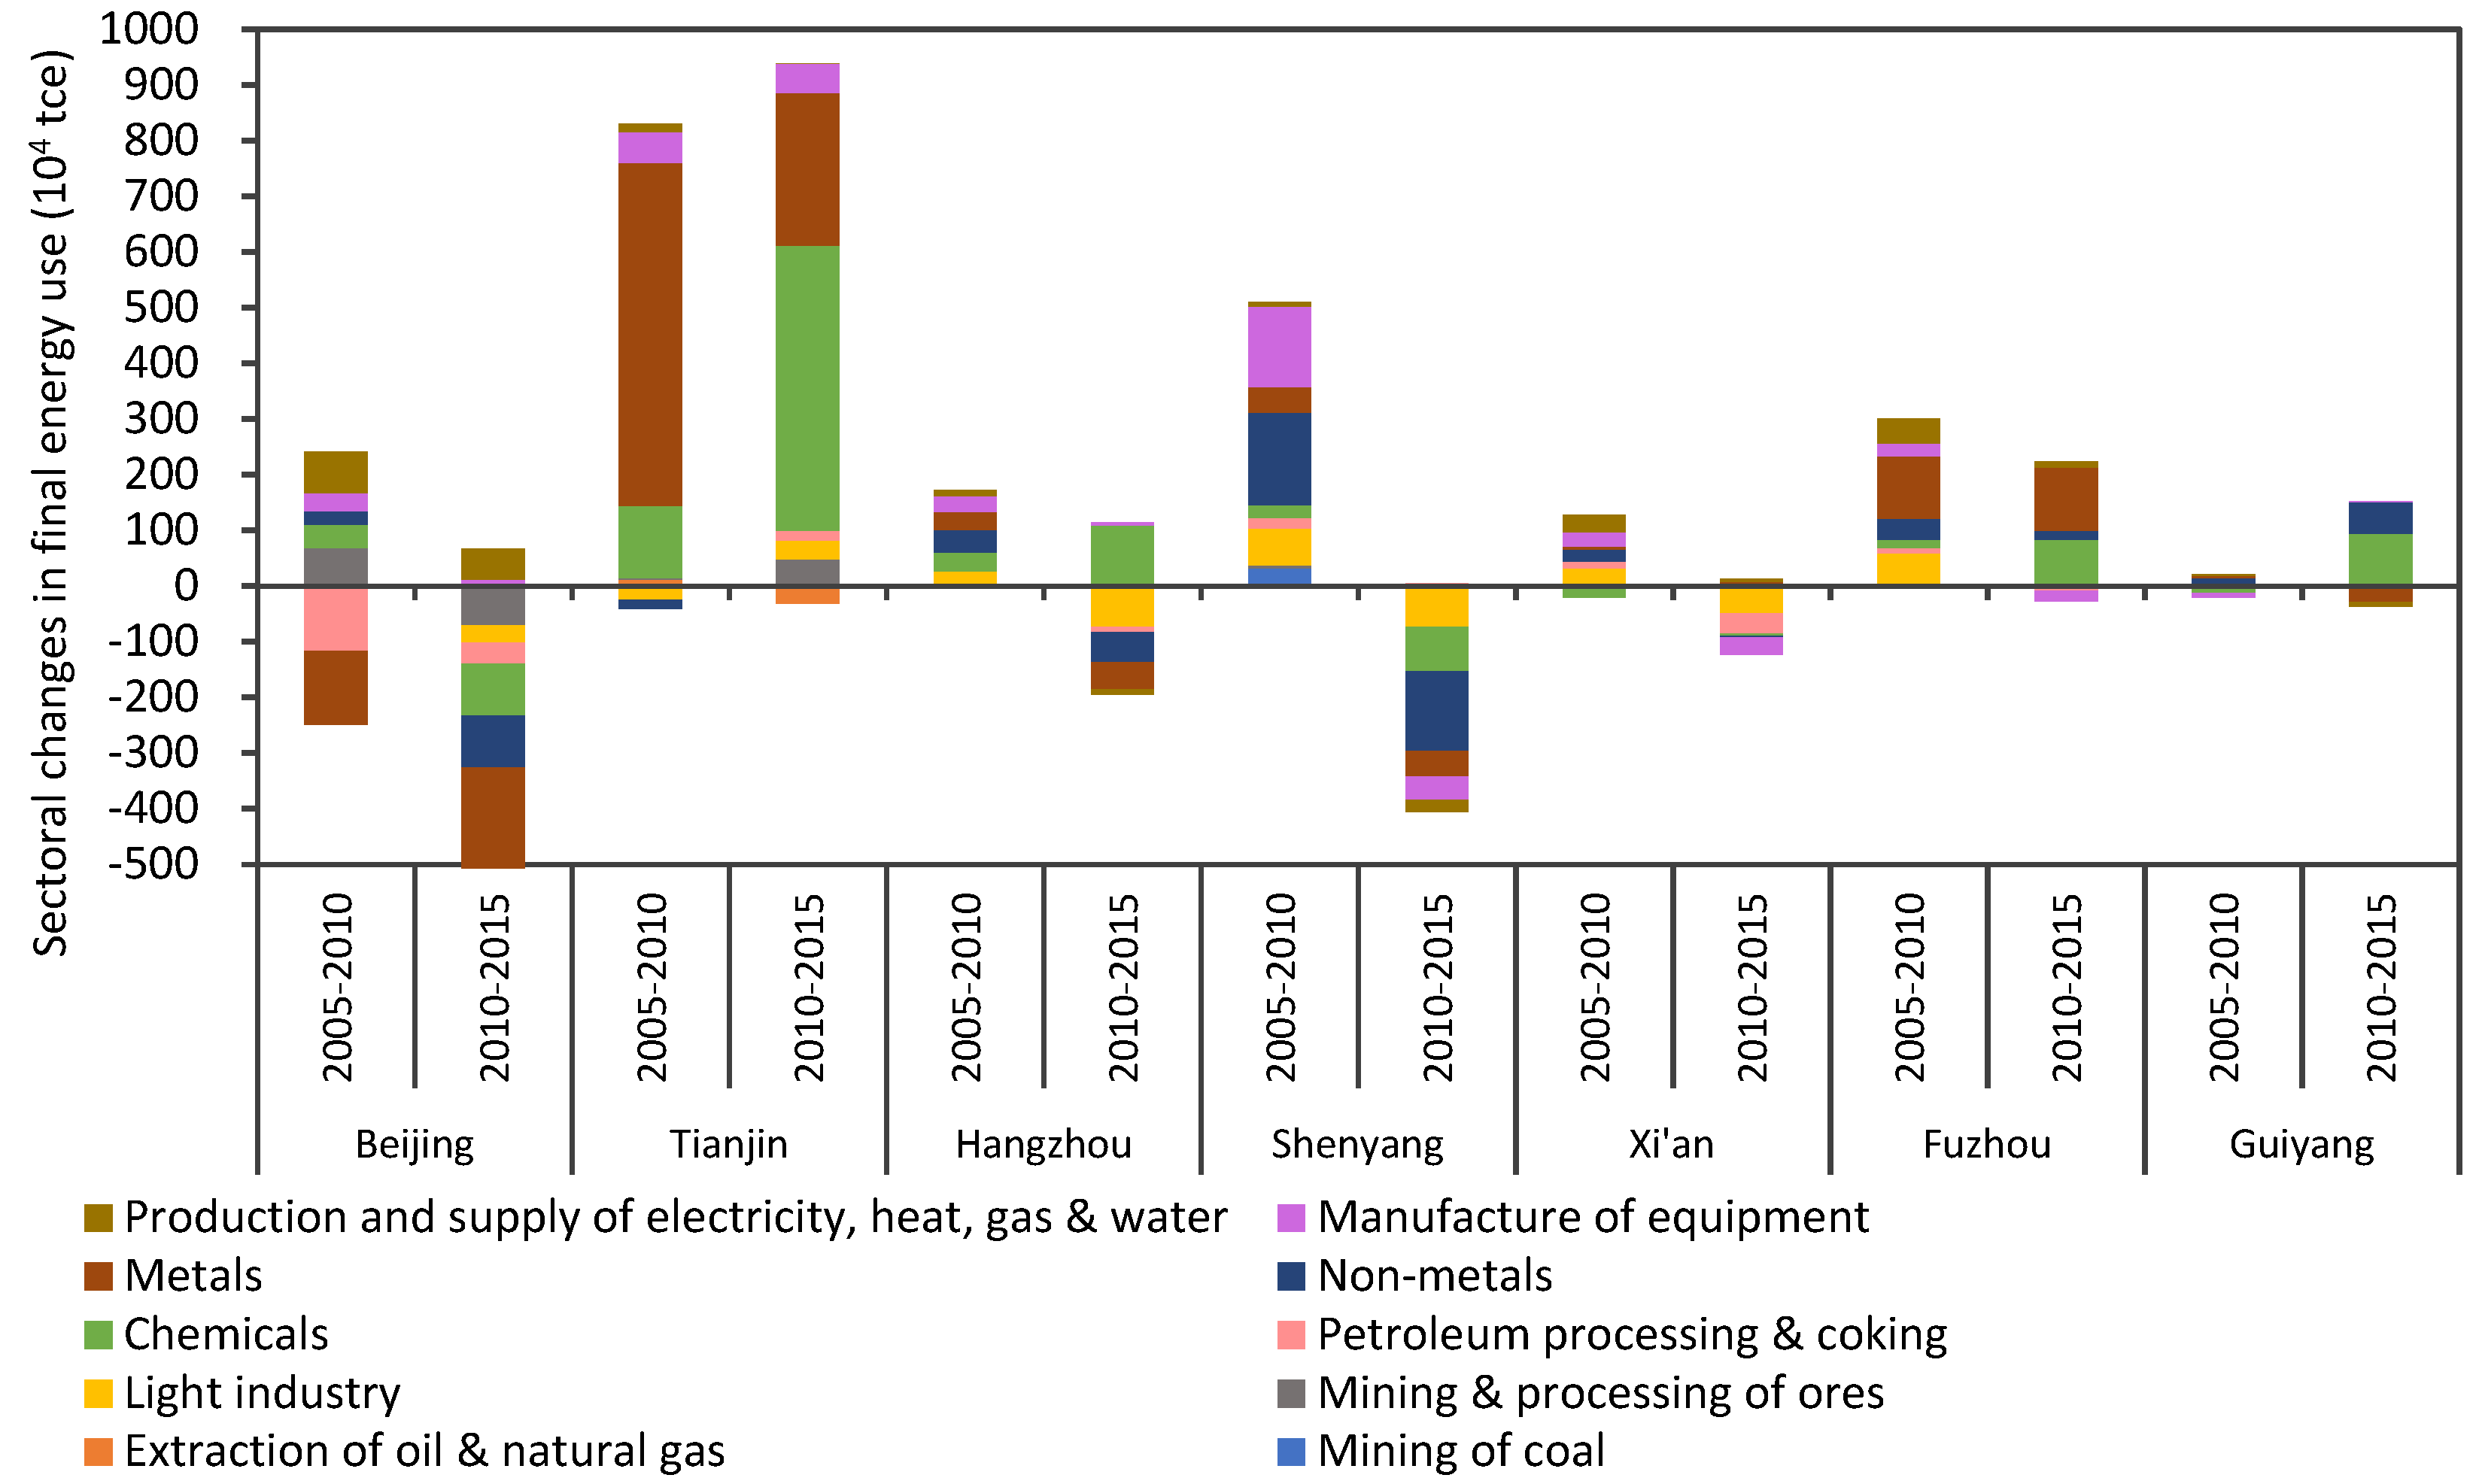
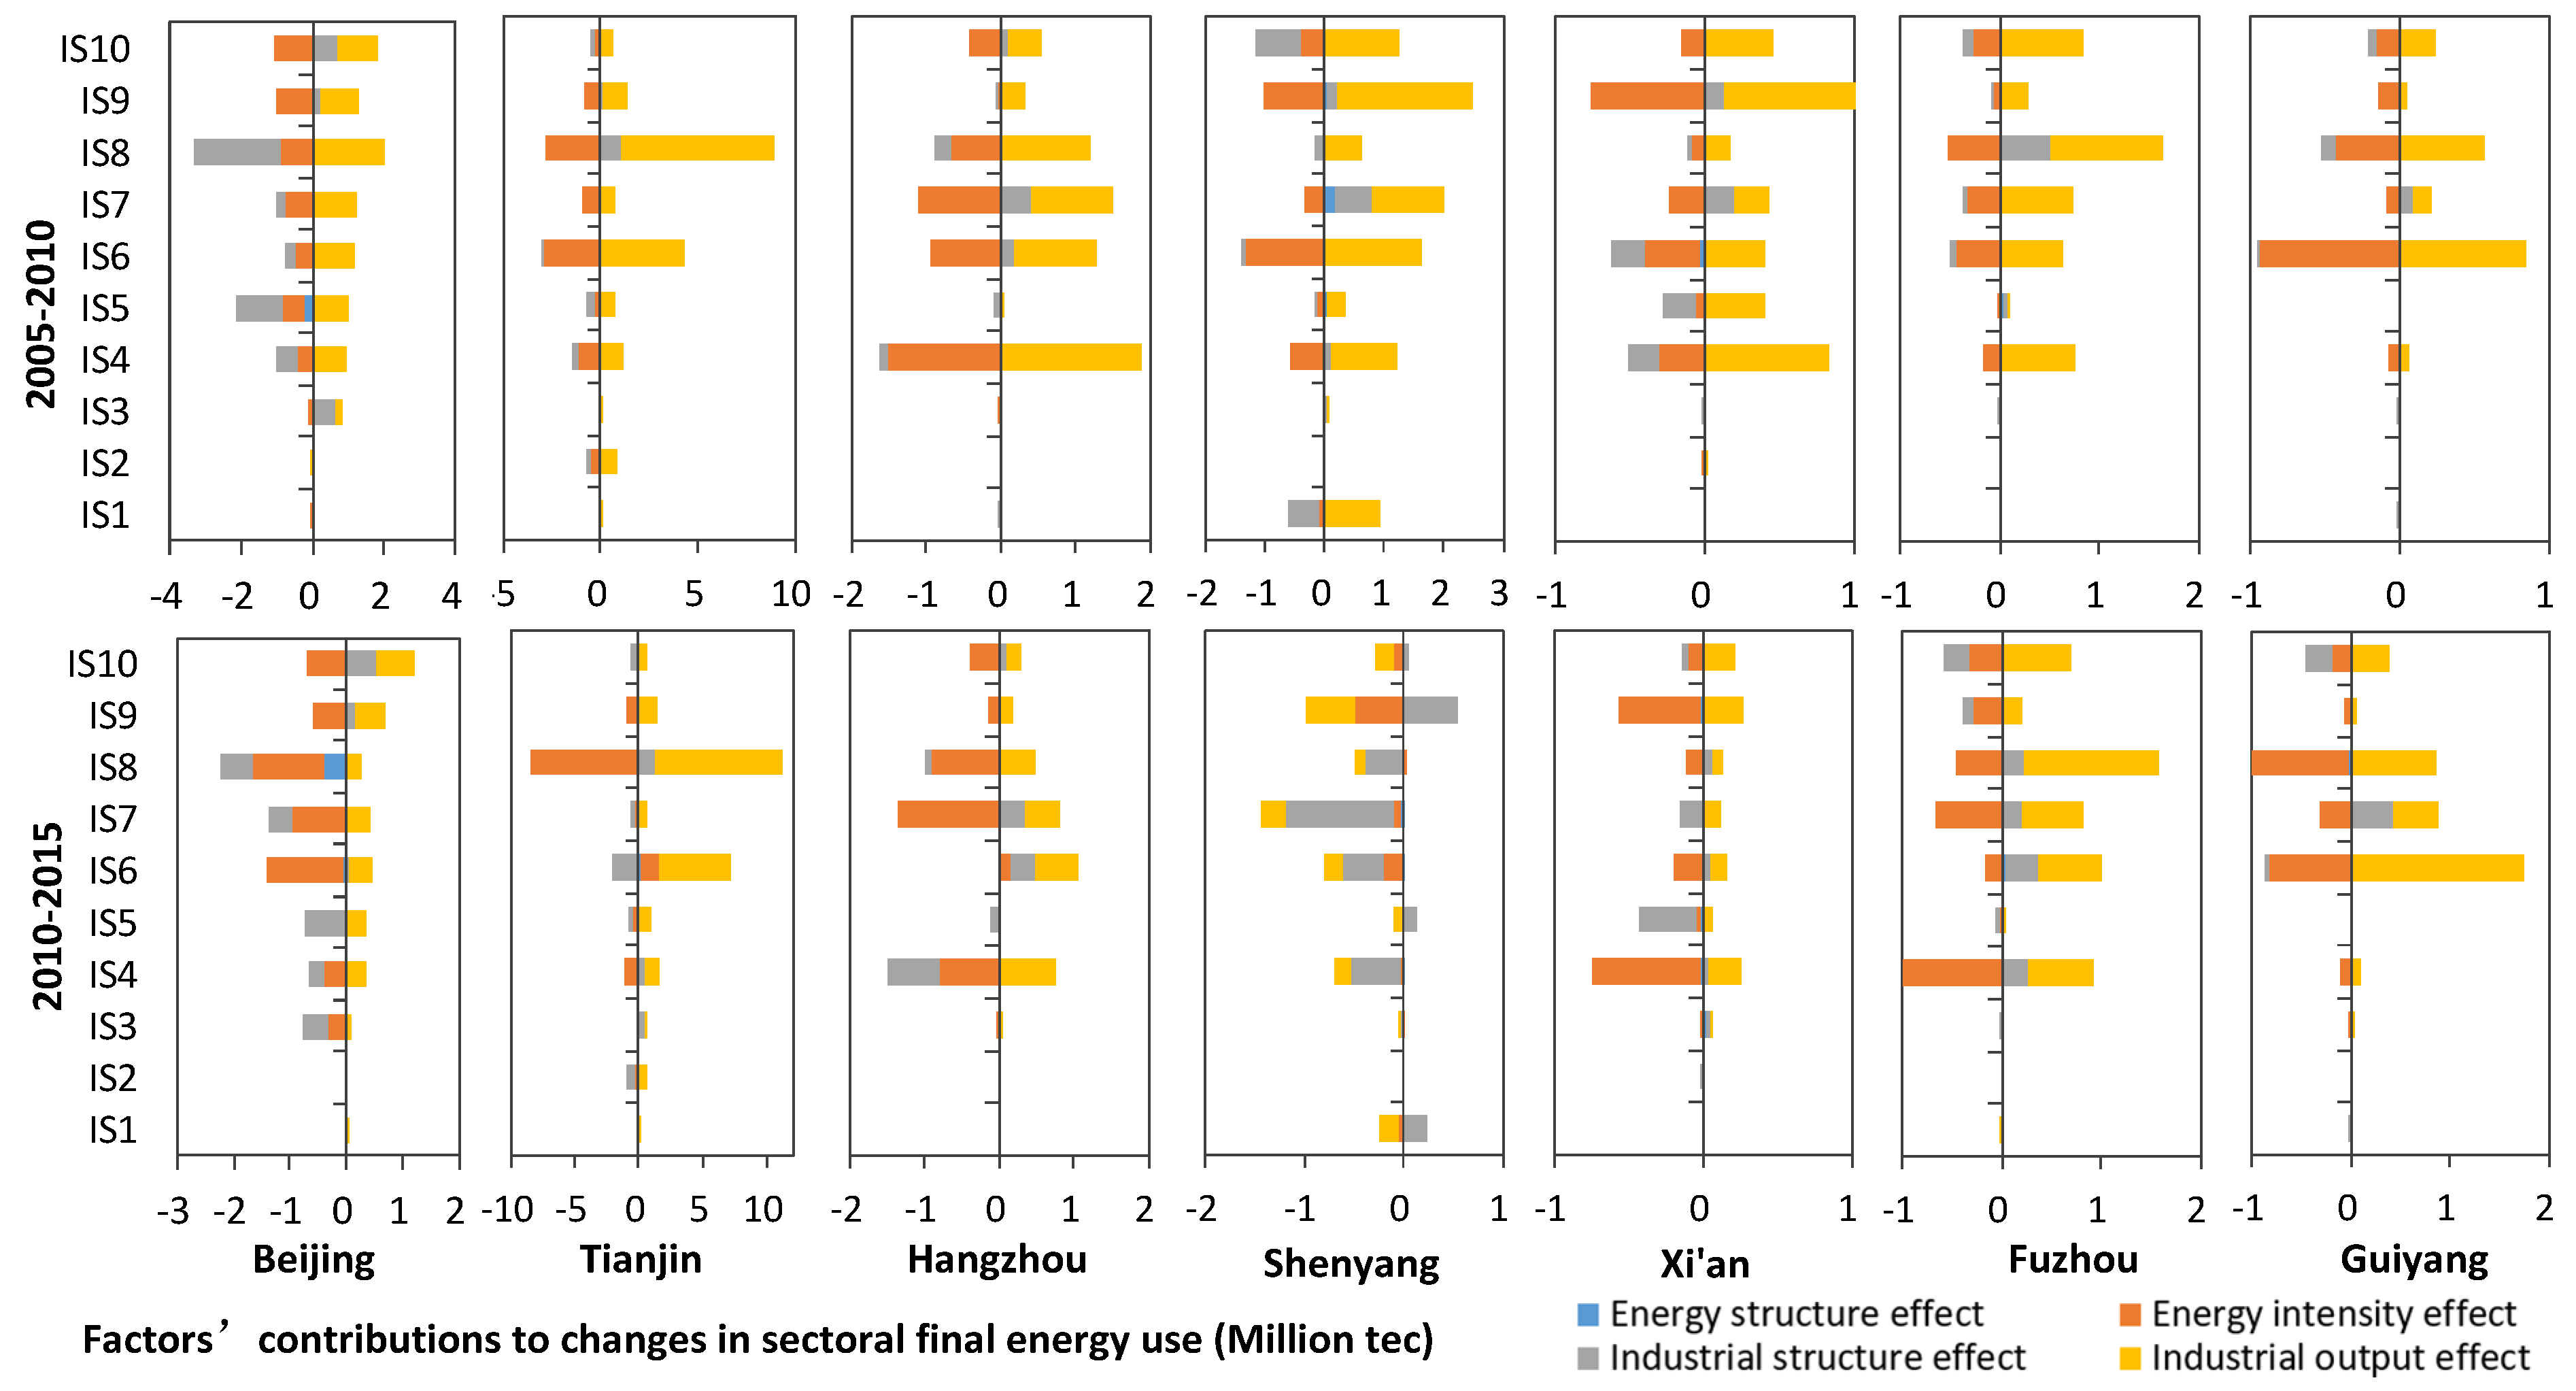
3.3. Determinants of Changes in Sectoral Final Energy Use

Analysis of contribution of each sector to total changes in industrial FEU were conducted to provide more insights into the clarification of the changes in a city’s industrial FEU. Overall, Light industry (IS4), IS6, Nonmetals (IS7), IS8, and IS9 were major contributors to a city’s industrial FEU. The energy-intensive industries, including IS6, IS7, and IS8, should be the hot spots [19,50,59]. For Beijing, IS8 and IS10 induced changes in industrial FEU most positively and negatively, respectively (see Figure 6). Increase in FEU of IS6 and IS8 in Tianjin caused an increase in its total industrial FEU. All sectors contributed positively to changes in industrial FEU in Hangzhou during 2005–2010. IS4, IS7, and IS8 contributed negatively during 2010–2015. IS7 and IS4 were the top two contributors to changes in industrial FEU in Shenyang and Xi’an. IS8 contributed the most to overall FEU growth in Fuzhou, followed by IS6 and IS4. In Guiyang, IS6 and IS8 were the most outstandingly positive and negative contributors to changes in industrial FEU, respectively.
Next, we present analyses of the contributions of different factors to changes in FEU of the sectors, with focus on the sectors that had more significant contributions to industrial FEU of a city. Overall, industrial output and energy intensity were primary drivers to changes in FEU of various sectors (see Figure 7), which is consistent with the results related to industry obtained by Ediger and Huvaz [25,57]. While for Beijing during 2005–2010 and Shenyang during 2010–2015, the industrial structure effect played a decisive role in decreasing sectoral FEU, which was also proved in a case study of Beijing by Shi et al. [4]. Due to disparities in industrial structure, industrial development, and energy intensity in various cities, the effects of the four drivers on sectors of the cities were diverse. The industrial output effect positively augmented sectoral FEU in Beijing, especially the FEU of IS8, IS7, and IS10. During 2005–2010, the industrial structure effect mainly induced a decrease in FEU of IS5 and IS8. During 2010–2015, the energy intensity effect mainly induced a decrease in FEU of IS6, IS7, and IS8. The industrial output effect and energy intensity effect incurred greater changes in FEU of IS6 and IS8 in Tianjin compared with other sectors. Increase in FEU of IS4 caused by the industrial output effect and decrease caused by the energy intensity effect were the most prominent in Hangzhou during 2005–2010. As the share of IS4 in total industrial output during 2010–2015 decreased, a substantial decrease in FEU was aroused by the industrial structure effect in Hangzhou.
During 2005–2010, the industrial output effect led to an increase in FEU, especially for IS6 and IS8, in Shenyang. While, during 2010–2015, the industrial structure effect induced a decrease in FEU of IS7, IS6, and IS4 primarily (see Figure 7). Xi’an’s IS9 experienced a dramatic increase in output and output share as well as a decrease in energy intensity during 2005–2010, resulting in considerable contributions of the industrial output effect, energy intensity effect, and industrial structure effect. During 2010–2015, the energy intensity effect and industrial structure effect primarily caused a decrease in IS4 and IS5, respectively. The industrial output effect mainly contributed to the increase in FEU of IS4, IS6, IS7, and IS8 in Fuzhou. While, the energy intensity effect prompted a substantial decrease in the FEU of IS4 during 2010–2015. The industrial output effect and energy intensity effect had mutually offset consequences on FEU of IS8 and IS6 in Guiyang, leading to a nonsignificant change in industrial FEU of the city. Whereas, during 2010–2015, the industrial output effect was leading contributions to changes in FEU of IS6, IS7, and IS8, leading to vigorous increase in industrial FEU of the city.

4. Discussion and Policy Implications

This study selected seven typical cities with different economic levels, development orientations, industrial structures, technological levels, and energy consumption to explore the drivers of urban industrial final energy use (FEU). The study period covered two stages—2005–2010 and 2010–2015—corresponding to the 11th and 12th five-year planning periods. Relying on the LMDI decomposition method, the contributions of the energy structure effect, energy intensity effect, industrial structure effect, and industrial output effect were explicitly revealed. Observed from the overall level of the whole industry, total industrial output of most cities kept increasing during the two stages, but with distinct augments. This led to the fact that the increases in industrial FEU induced by industrial output were diverse among various cities. Technological innovations promoted the decrease in energy intensity of cities’ industry, making the energy intensity effect arouse negative changes in industrial FEU of cities, which is consistent with the findings (case study of China) of Liu et al. [57] and Wang and Feng [68].
The Chinese government is vigorously boosting industrial restructuring to reduce the share of energy-intensive industrial sectors and increase that of the emerging high-tech industrial sectors [51]. Meanwhile, the energy-intensive sectors are being promoted to transit from the east to the west [8]. Such policies have enabled the industrial structure effect to be an important contributor to the decrease in industrial FEU in some cities. The decrease in industrial FEU in Beijing was attributed to the decrease in the proportion of the energy-intensive industries’ (Metals, IS8, Nonmetals, IS7, and Petroleum processing & coking, IS5) output. The contribution of the industrial structure effect in Beijing was much larger than that in the other six cities and at the national level [72]. In Shenyang and Xi’an, the increase in proportion (over 65.1% in 2015) of Manufacture of equipment (IS9) whose energy intensity was small facilitated to a significant contribution of the industrial structure effect to industrial FEU decrease. Hence, it necessitates further promotion of industrial restructuring and technological innovations on both national and city levels to maintain the momentum of FEU reduction. Even though the contribution of the energy structure effect was relatively small, the proportion of coal consumption in total industrial FEU decreased during 2005–2015, which played a vital role in reducing emission of GHGs, sulfur dioxide, nitrogen oxide, and particulate matter of unit FEU [51].
Further analyses at the subdivided sectoral level are required to uncover what directed the disparities in industrial FEU among cities. FEU of a sector was determined by output and energy intensity of the sector. Owing to the differences in the above two variables, there were disparities in a sector’s FEU and the proportion of a sector’s FEU in total industrial FEU among cities. Observed temporally, changes in sectoral output, proportion of sectoral output in the total, absolute value of energy intensity, and the changing magnitude of one sector collectively determined the proportion of FEU change of this sector in total industrial FEU change. The proportion among the seven cities presented distinct levels (see Figure 6). For example, the proportion of IS9’s output increased from 50.1% to 58.6% during 2005–2010 in Beijing (see Figures S2 and S3), while its energy intensity was decreasing. It ultimately resulted in a tiny proportion of FEU change of IS9 in the total industrial FEU change. The proportion of IS8’s output decreased from 4.4% to 2.4% during 2010–2015, while its energy intensity was relatively large (see Figures S2 and S3). It ultimately resulted in large proportion of FEU change of IS8 in the total industrial FEU change (see Figure 6).
This study accomplished the following two goals: (1) determination of the driving factors of changes in aggregate and sectoral FEU, as well as the contribution values of the factors; (2) identification of the disparities in the contributions of the factors to changes in FEU of certain sectors in different cities, as well as changes in FEU of different sectors in a certain city. The decomposition results for the two stages 2005–2010 and 2020–2015 provide a sound basis for manifesting the disparities in changes in FEU of a certain sector within different stages. The energy intensity effect was the most important driver to decrease FEU of sectors. This again verified that prompting technological innovations is the principle task against industrial energy conservation, especially for the sectors with larger energy intensity, such as IS5, Chemicals (IS6), IS7, and IS8, which was also proved (case study of China) by Ouyang and Lin [9] and Wang et al. [72]. Energy intensity of Guiyang and Fuzhou was relatively larger than that of other cities, implying larger potential for decreasing FEU through lowering energy intensity in these two cities. The effect of industrial restructuring on industrial FEU offset the increase of industrial FEU induced by economic growth during 2010–2015 in Beijing. Shenyang and Xi’an achieved overall industrial FEU reduction by elevating the proportion of IS9’s output in the total, the energy intensity of which was smaller. There remains huge potential for other cities to accomplish energy conservation goals through industrial restructuring.
The presented results are of significance to formulate pertinent policies and measures targeting FEU reduction:
(1) Reducing energy intensity is a principle way for industrial FEU reduction in cities. Firstly, improvement of production technology or energy-saving technologies can effectively improve the efficiency of industrial FEU, especially for energy-intensive industrial sectors [73]. A larger amount of heat is needed during the process of producing raw chemical materials and chemical products. However, traditional heating systems (electric heating, lamp heating, steam heating, etc.) are inefficient compared with microwave heating, which greatly reduces the energy consumption and improves the heat transfer rate [59]. Coal-fired power generation dominates electricity production, accounting for over 70% in China, with lower average energy efficiency compared with the advanced level in the world [51]. Clean coal power generation technologies (i.e., integrated gasification combined cycle) makes it possible to improve the power generation efficiency to a large extent. For the steel industry, it is urgent to use advanced production technologies, such as efficient electric furnace smelting. Secondly, the outdated capacities are still massive in some cities’ energy-intensive industries, such as chemical, nonmetal, and iron and steel industries. Phase-out of production capacity with low efficiency should also help cities reduce industrial FEU. Thirdly, scientific and effective management systems for industries should not be absent for reducing energy intensity [74]. The national, provincial, and local governments should also formulate effective policies (i.e., tax, subsidies) to facilitate the application of those advanced technologies that are suitable for different cities. From the national perspective, decision makers are supposed to exert the national-wide technological advantages, instead of only at the city level. Western and central China are relatively less developed and do not possess advanced technologies. It is more urgent and necessary to promote transition of advanced technologies from the east to the west cities (Guiyang), rather than only the transition of energy-intensive industries.
(2) Optimization of industrial structure for reducing industrial FEU should be accelerated, especially for the less-developed cities (Guiyang and Fuzhou). Seen from the city level, production of energy-intensive industrial sectors (IS5, IS6, IS7, and IS8) should be decreased. Meanwhile, efforts should be made to promote the development of industries with new technologies as well as the service industries, considering cities’ characteristics and advantages [14]. For example, development of the tourism industry should be enhanced based on Xi’an’s cultural advantage. However, seen from the national level, decision makers are supposed to focus on reasonable industrial layout among cities based on overall consideration of multiple factors.
(3) Industrial FEU structure is expected to be adjusted and optimized step by step for each city. Beijing succeeded in reducing the proportion coal consumption to 12.8% of its total industrial FEU in 2015. However, other cities are still on the way to reducing their coal consumption. Considering the richer reserve of coal and poorer reserve of oil and naturel gas in China, efforts should be made to improve the efficiency of industrial coal consumption using clean coal technologies [60]. Meanwhile, continuously increasing the proportion of natural gas and non-fossil energy (i.e., hydropower, biomass energy, wind power, solar power, and geothermal power) consumption in industrial FEU should be prompted based on the endowment of natural resources in each city.

5. Conclusions

In order to uncover the drivers of energy consumption of industries at the city level, seven representative Chinese cities—Beijing, Tianjin, Hangzhou, Shenyang, Xi’an, Fuzhou, and Guiyang—were selected as the targets. The variations in industrial final energy use (FEU) and the determinants of changes in aggregate and sectoral FEU during 2005–2010 and 2010–2015 were investigated by using the Logarithmic Mean Divisia Index (LMDI) approach. Disparities in contributions of the influencing factors, which consisted of industrial output effect, industrial structure effect, energy intensity effect, and energy structure effect, were explicitly revealed throughout the seven cities. The main findings can be summarized as follows:
(1) Alongside the increase in industrial output of seven cities within two stages (except Shenyang), the variation trends in industrial FEU are different: continuously increasing (in Tianjin, Fuzhou and Guiyang), continuously decreasing (in Beijing), and first increasing then decreasing (in Hangzhou and Shenyang). Even though the proportion of coal consumption in industrial FEU of cities decreased during 2005–2015, coal consumption still dominates industrial FEU, except in Beijing.
(2) Summaries from the LMDI decomposition results clarified that the industrial output effect (contribution rate 16.7% ~ 184.0%) and the energy intensity effect (contribution rate −8.6% ~ −76.5%) were the dominantly positive and negative contributors to the increase in aggregate FEU, respectively, for all cities except Shenyang.
(3) The major sectors leading to changes in total industrial FEU in the seven cities were different. Overall, Light industry (IS4), Chemicals (IS6), Nonmetals (IS7), Metals (IS8), and Manufacture of equipment (IS9) were major contributors to the changes in industrial FEU of cities. The sectoral decomposition results helped to identify the drivers of changes in sectoral FEU in more detail. The energy intensity effect and industrial output effect were primary drivers to changes in FEU of most sectors within the two stages. These two effects’ contribution values for IS4, IS6, IS7, IS8, and IS9 were much larger than those of the other sectors.
(4) Based on the results obtained, some policy implications can be provided. The decrease in industrial energy intensity induced by production technology improvement and innovations played a significant role in reducing industrial FEU for the seven cities. Hence, technological innovations and transitions (from eastern China to the west) should be encouraged, especially for the less developed cities (Guiyang) or the energy-intensive industrial sectors (IS6, IS7, and IS8). It is urgent to decrease production of energy-intensive industries and promote the development of high-tech industries and service industries under industrial layouts formulated by central and provincial governments, especially for Fuzhou and Guiyang. For optimizing the energy structure, the core mission is to reduce the proportion of coal consumption through substitution with non-fossil energy.
This study only focused on industrial FEU of seven cities. Future work can be extended to clarify the energy consumption of all economic sectors and households, to focus on more cities with different characteristics regarding economy, natural resources, and environment, to explore the influence of changing development patterns of cities on energy consumption and energy structure.

Supplementary Materials

The following are available online at https://www.mdpi.com/2071-1050/11/6/1806/s1, Figure S1: title, Table S1: title, Video S1: title.

Author Contributions

Wei Yang conceived of and designed this study, carried out the analysis of results and wrote the paper. Xianrui Liao and Yichen Wang conducted the data collection and calculation. Junnian Song preformed language modification. All four authors revised, read and approved the final manuscript.

Funding

This research was funded by National Natural Science Foundation of China, grant number 41701628.

Acknowledgments

We gratefully thank the three anonymous reviewers for their comments and suggestions, which have substantially improved the quality of the paper.

Conflicts of Interest

The authors declare no conflict of interest.

References

  1. Li, F.; Dong, S.C.; Li, X.; Liang, Q.X.; Yang, W.Z. Energy consumption-economic growth relationship and carbon dioxide emissions in China. Energy Policy 2011, 39, 568–574. [Google Scholar]
  2. Cantore, N.; Clara, M.; Lavopa, A.; Soare, C. Manufacturing as an engine of growth: Which is the best fuel? Struct. Chang. Econ. Dyn. 2017, 42, 56–66. [Google Scholar] [CrossRef]
  3. Cansino, J.M.; Sanchez-Braza, A.; Rodriguez-Arevalo, M.L. Driving forces of Spain’s CO2 emissions: A LMDI decomposition approach. Renew. Sustain. Energy Rev. 2015, 48, 749–759. [Google Scholar] [CrossRef]
  4. Shi, L.; Sun, J.; Lin, J.; Zhao, Y. Factor decomposition of carbon emissions in Chinese megacities. J. Environ. Sci. 2019, 75, 209–215. [Google Scholar] [CrossRef] [PubMed]
  5. Ma, X.; Wang, C.; Dong, B.; Gu, G.; Chen, R.; Li, Y.; Zou, H.; Zhang, W.; Li, Q. Carbon emissions from energy consumption in China: Its measurement and driving factors. Sci. Total Environ. 2019, 648, 1411–1420. [Google Scholar] [CrossRef] [PubMed]
  6. British Petroleum. British Petroleum Statistical Review of World Energy. 2018. Available online: https://www.bp.com/ zh_cn/china/reports-and-publications/_bp_2018-_.html (accessed on 6 February 2019).
  7. Lin, B.; Ouyang, X. Energy demand in China: Comparison of characteristics between the US and China in rapid urbanization stage. Energy Convers. Manag. 2014, 79, 128–139. [Google Scholar] [CrossRef]
  8. Wang, M.; Feng, C. Investigating the drivers of energy-related CO2 emissions in China’s industrial sector: From regional and provincial perspectives. Struct. Chang. Econ. Dyn. 2018, 46, 136–147. [Google Scholar] [CrossRef]
  9. Ouyang, X.; Lin, B. An analysis of the driving forces of energy-related carbon dioxide emissions in China’s industrial sector. Renew. Sustain. Energy Rev. 2015, 45, 838–849. [Google Scholar] [CrossRef]
  10. Xu, X.; Zhao, T.; Liu, N.; Kang, J. Changes of energy-related GHG emissions in China: An empirical analysis from sectoral perspective. Appl. Energy 2014, 132, 298–307. [Google Scholar] [CrossRef]
  11. Ang, B.W.; Zhang, F.Q. A survey of index decomposition analysis in energy and environmental studies. Energy 2000, 25, 1149–1176. [Google Scholar] [CrossRef]
  12. Ang, B.W.; Huang, H.C.; Mu, A.R. Properties and linkages of some index decomposition analysis methods. Energy Policy 2009, 37, 4624–4632. [Google Scholar] [CrossRef]
  13. Shao, S.; Liu, J.; Geng, Y.; Miao, Z.; Yang, Y. Uncovering driving factors of carbon emissions from China’s mining sector. Appl. Energy 2016, 166, 220–238. [Google Scholar] [CrossRef]
  14. Wang, M.; Feng, C. Decomposition of energy-related CO2 emissions in China: An empirical analysis based on provincial panel data of three sectors. Appl. Energy 2017, 190, 772–787. [Google Scholar] [CrossRef]
  15. Ang, B.W.; Choi, K.H. Decomposition of aggregate energy and gas emission intensities for industry: A refined Divisia index method. Energy 1997, 18, 59–73. [Google Scholar] [CrossRef]
  16. Ang, B.W. Decomposition analysis for policymaking in energy: Which is the preferred method? Energy Policy 2004, 32, 1131–1139. [Google Scholar] [CrossRef]
  17. Ang, B.W. The LMDI approach to decomposition analysis: A practical guide. Energy Policy 2005, 33, 867–871. [Google Scholar] [CrossRef]
  18. Mousavi, B.; Lopez, N.S.A.; Manuel Biona, J.B.; Chiu, A.S.F.; Blesl, M. Driving forces of Iran’s CO2 emissions from energy consumption: An LMDI decomposition approach. Appl. Energy 2017, 206, 804–814. [Google Scholar] [CrossRef]
  19. Du, G.; Sun, C.; Ouyang, X.; Zhang, C. A decomposition analysis of energy-related CO2 emissions in Chinese six high-energy intensive industries. J. Clean Prod. 2018, 184, 1102–1112. [Google Scholar] [CrossRef]
  20. Ang, B.W.; Xu, X.Y. Tracking industrial energy efficiency trends using index decomposition analysis. Energy Econ. 2013, 40, 1014–1021. [Google Scholar] [CrossRef]
  21. Fernandez Gonzalez, P.; Landajo, M.; Presno, M.J. Multilevel LMDI decomposition of changes in aggregate energy consumption. A cross country analysis in the EU-27. Energy Policy 2014, 68, 576–584. [Google Scholar] [CrossRef]
  22. Voigt, S.; De Cian, E.; Schymura, M.; Verdolini, E. Energy intensity developments in 40 major economies: Structural change or technology improvement? Energy Econ. 2014, 41, 47–62. [Google Scholar] [CrossRef]
  23. Fernandez Gonzalez, P.; Landajo, M.; Presno, M.J. The Divisia real energy intensity indices: Evolution and attribution of percent changes in 20 European countries from 1995 to 2010. Energy 2013, 58, 340–349. [Google Scholar] [CrossRef]
  24. Cunha, J.; Nunes, M.L.; Lima, F. Discerning the factors explaining the change in energy efficiency. Environ. Dev. Sustain. 2018, 20, 163–179. [Google Scholar] [CrossRef]
  25. Ediger, V.S.; Huvaz, O. Examining the sectoral energy use in Turkish economy (1980–2000) with the help of decomposition analysis. Energy Convers. Manag. 2006, 47, 732–745. [Google Scholar] [CrossRef]
  26. Shahiduzzaman, M.; Alam, K. Changes in energy efficiency in Australia: A decomposition of aggregate energy intensity using logarithmic mean Divisia approach. Energy Policy 2013, 56, 341–351. [Google Scholar] [CrossRef]
  27. Balezentis, A.; Balezentis, T.; Streimikiene, D. The energy intensity in Lithuania during 1995–2009: A LMDI approach. Energy Policy 2011, 39, 7322–7334. [Google Scholar] [CrossRef]
  28. Inglesi-Lotz, R.; Pouris, A. Energy efficiency in South Africa: A decomposition exercise. Energy 2012, 42, 113–120. [Google Scholar] [CrossRef]
  29. Bashmakov, I.; Myshak, A. Russian energy efficiency accounting system. Energy Effic. 2014, 7, 743–759. [Google Scholar] [CrossRef]
  30. Colinet Carmona, M.J.; Roman Collado, R. LMDI decomposition analysis of energy consumption in Andalusia (Spain) during 2003–2012: The energy efficiency policy implications. Energy Effic. 2016, 9, 807–823. [Google Scholar] [CrossRef]
  31. Cahill, C.J.; Gallachoir, B.P.O. Monitoring energy efficiency trends in European industry: Which top-down method should be used? Energy Policy 2010, 38, 6910–6918. [Google Scholar] [CrossRef]
  32. Bhattacharyya, S.C.; Ussanarassamee, A. Decomposition of energy and CO2 intensities of Thai industry between 1981 and 2000. Energy Econ. 2004, 26, 765–781. [Google Scholar] [CrossRef]
  33. Salta, M.; Polatidis, H.; Haralambopoulos, D. Energy use in the Greek manufacturing sector: A methodological framework based on physical indicators with aggregation and decomposition analysis. Energy 2009, 34, 90–111. [Google Scholar] [CrossRef]
  34. Kim, S. LMDI Decomposition Analysis of Energy Consumption in the Korean Manufacturing Sector. Sustainability 2017, 9, 202. [Google Scholar] [CrossRef]
  35. Inglesi-Lotz, R.; Blignaut, J.N. South Africa’s electricity consumption: A sectoral decomposition analysis. Appl. Energy 2011, 88, 4779–4784. [Google Scholar] [CrossRef]
  36. Mairet, N.; Decellas, F. Determinants of energy demand in the French service sector: A decomposition analysis. Energy Policy 2009, 37, 2734–2744. [Google Scholar] [CrossRef]
  37. Fernandez Gonzalez, P.; Landajo, M.; Presno, M.J. Tracking European Union CO2 emissions through LMDI (logarithmic-mean Divisia index) decomposition. The activity revaluation approach. Energy 2014, 73, 741–750. [Google Scholar] [CrossRef]
  38. Brizga, J.; Feng, K.; Hubacek, K. Drivers of CO2 emissions in the former Soviet Union: A country level IPAT analysis from 1990 to 2010. Energy 2013, 59, 743–753. [Google Scholar] [CrossRef]
  39. Bhattacharyya, S.C.; Matsumura, W. Changes in the GHG emission intensity in EU-15: Lessons from a decomposition analysis. Energy 2010, 35, 3315–3322. [Google Scholar] [CrossRef]
  40. Malla, S. CO2 emissions from electricity generation in seven Asia-Pacific and North American countries: A decomposition analysis. Energy Policy 2009, 37, 1–9. [Google Scholar] [CrossRef]
  41. Oh, I.; Wehrmeyer, W.; Mulugetta, Y. Decomposition analysis and mitigation strategies of CO2 emissions from energy consumption in South Korea. Energy Policy 2010, 38, 364–377. [Google Scholar] [CrossRef]
  42. O’ Mahony, T.; Zhou, P.; Sweeney, J. The driving forces of change in energy-related CO2 emissions in Ireland: A multi-sectoral decomposition from 1990 to 2007. Energy Policy 2012, 44, 256–267. [Google Scholar] [CrossRef]
  43. de Freitas, L.C.; Kaneko, S. Decomposition of CO2 emissions change from energy consumption in Brazil: Challenges and policy implications. Energy Policy 2011, 39, 1495–1504. [Google Scholar] [CrossRef]
  44. Akbostanci, E.; Tunc, G.I.; Turut-Asik, S. CO2 emissions of Turkish manufacturing industry: A decomposition analysis. Appl. Energy 2011, 88, 2273–2278. [Google Scholar] [CrossRef]
  45. Hammond, G.P.; Norman, J.B. Decomposition analysis of energy-related carbon emissions from UK manufacturing. Energy 2012, 41, 220–227. [Google Scholar] [CrossRef]
  46. Jeong, K.; Kim, S. LMDI decomposition analysis of greenhouse gas emissions in the Korean manufacturing sector. Energy Policy 2013, 62, 1245–1253. [Google Scholar] [CrossRef]
  47. Ma, C.; Stern, D.I. China’s changing energy intensity trend: A decomposition analysis. Energy Econ. 2008, 30, 1037–1053. [Google Scholar] [CrossRef]
  48. Zhao, X.; Ma, C.; Hong, D. Why did China’s energy intensity increase during 1998–2006: Decomposition and policy analysis. Energy Policy 2010, 38, 1379–1388. [Google Scholar] [CrossRef]
  49. Nie, H.; Kemp, R. Why did energy intensity fluctuate during 2000–2009? A combination of index decomposition analysis and structural decomposition analysis. Energy Sustain Dev. 2013, 17, 482–488. [Google Scholar] [CrossRef]
  50. Tan, R.; Lin, B. What factors lead to the decline of energy intensity in China’s energy intensive industries? Energy Econ. 2018, 71, 213–221. [Google Scholar] [CrossRef]
  51. Chong, C.; Ma, L.; Li, Z.; Ni, W.; Song, S. Logarithmic mean Divisia index (LMDI) decomposition of coal consumption in China based on the energy allocation diagram of coal flows. Energy 2015, 85, 366–378. [Google Scholar] [CrossRef]
  52. Zhang, M.; Li, H.; Zhou, M.; Mu, H. Decomposition analysis of energy consumption in Chinese transportation sector. Appl. Energy 2011, 88, 2279–2285. [Google Scholar] [CrossRef]
  53. Zhang, M.; Guo, F. Analysis of rural residential commercial energy consumption in China. Energy 2013, 52, 222–229. [Google Scholar] [CrossRef]
  54. Xu, S.-C.; He, Z.-X.; Long, R.-Y.; Chen, H. Factors that influence carbon emissions due to energy consumption based on different stages and sectors in China. J. Clean Prod. 2016, 115, 139–148. [Google Scholar] [CrossRef]
  55. Jiang, R.; Zhou, Y.; Li, R. Moving to a Low-Carbon Economy in China: Decoupling and Decomposition Analysis of Emission and Economy from a Sector Perspective. Sustainability 2018, 10, 978. [Google Scholar] [CrossRef]
  56. Chen, L.; Yang, Z.; Chen, B. Decomposition Analysis of Energy-Related Industrial CO2 Emissions in China. Energies 2013, 6, 2319–2337. [Google Scholar] [CrossRef]
  57. Liu, L.-C.; Fan, Y.; Wu, G.; Wei, Y.-M. Using LMDI method to analyzed the change of China’s industrial CO2 emissions from final fuel use: An empirical analysis. Energy Policy 2007, 35, 5892–5900. [Google Scholar] [CrossRef]
  58. Wang, Q.; Li, R.; Jiang, R. Decoupling and Decomposition Analysis of Carbon Emissions from Industry: A Case Study from China. Sustainability 2016, 8, 1059. [Google Scholar] [CrossRef]
  59. Lin, B.; Tan, R. Sustainable development of China’s energy intensive industries: From the aspect of carbon dioxide emissions reduction. Renew. Sustain. Energy Rev. 2017, 77, 386–394. [Google Scholar] [CrossRef]
  60. Zhou, X.; Zhang, M.; Zhou, M.; Zhou, M. A comparative study on decoupling relationship and influence factors between China’s regional economic development and industrial energy-related carbon emissions. J. Clean Prod. 2017, 142, 783–800. [Google Scholar] [CrossRef]
  61. Xu, S.-C.; He, Z.-X.; Long, R.-Y. Factors that influence carbon emissions due to energy consumption in China: Decomposition analysis using LMDI. Appl. Energy 2014, 127, 182–193. [Google Scholar] [CrossRef]
  62. Chen, L.; Yang, Z. A spatio-temporal decomposition analysis of energy-related CO2 emission growth in China. J. Clean Prod. 2015, 103, 49–60. [Google Scholar] [CrossRef]
  63. Yang, X.; Wang, S.; Zhang, W.; Li, J.; Zou, Y. Impacts of energy consumption, energy structure, and treatment technology on SO2 emissions: A multi-scale LMDI decomposition analysis in China. Appl. Energy 2016, 184, 714–726. [Google Scholar] [CrossRef]
  64. Zhao, M.; Tan, L.; Zhang, W.; Ji, M.; Liu, Y.; Yu, L. Decomposing the influencing factors of industrial carbon emissions in Shanghai using the LMDI method. Energy 2010, 35, 2505–2510. [Google Scholar] [CrossRef]
  65. Zou, J.; Liu, W.; Tang, Z. Analysis of Factors Contributing to Changes in Energy Consumption in Tangshan City between 2007 and 2012. Sustainability 2017, 9, 452. [Google Scholar] [CrossRef]
  66. Wang, Q.; Wang, Y.; Zhou, P.; Wei, H. Whole process decomposition of energy-related SO2 in Jiangsu Province, China. Appl. Energy 2017, 194, 679–687. [Google Scholar] [CrossRef]
  67. Lu, M.; Wang, X.; Cang, Y. Carbon Productivity: Findings from Industry Case Studies in Beijing. Energies 2018, 11, 2796. [Google Scholar] [CrossRef]
  68. Wang, M.; Feng, C. Decomposing the change in energy consumption in China’s nonferrous metal industry: An empirical analysis based on the LMDI method. Renew. Sustain. Energy Rev. 2018, 82, 2652–2663. [Google Scholar] [CrossRef]
  69. Luo, X.; Dong, L.; Dou, Y.; Li, Y.; Liu, K.; Ren, J.; Liang, H.; Mai, X. Factor decomposition analysis and causal mechanism investigation on urban transport CO2 emissions: Comparative study on Shanghai and Tokyo. Energy Policy 2017, 107, 658–668. [Google Scholar] [CrossRef]
  70. Wang, J.; He, S.; Qiu, Y.; Liu, N.; Li, Y.; Dong, Z. Investigating driving forces of aggregate carbon intensity of electricity generation in China. Energy Policy 2018, 113, 249–257. [Google Scholar] [CrossRef]
  71. Chontanawat, J.; Wiboonchutikula, P.; Buddhivanich, A. Decomposition analysis of the change of energy intensity of manufacturing industries in Thailand. Energy 2014, 77, 171–182. [Google Scholar] [CrossRef]
  72. Wang, W.; Liu, X.; Zhang, M.; Song, X. Using a new generalized LMDI (logarithmic mean Divisia index) method to analyze China’s energy consumption. Energy 2014, 67, 617–622. [Google Scholar] [CrossRef]
  73. Abdelaziz, E.A.; Saidur, R.; Mekhilef, S. A review on energy saving strategies in industrial sector. Renew. Sustain. Energy Rev. 2011, 15, 150–168. [Google Scholar] [CrossRef]
  74. Napp, T.A.; Gambhir, A.; Hills, T.P.; Florin, N.; Fennell, P.S. A review of the technologies, economics and policy instruments for decarbonising energy-intensive manufacturing industries. Renew. Sustain. Energy Rev. 2014, 30, 616–640. [Google Scholar] [CrossRef]
Figure 1. Spatial distribution of the seven targeted cities in China.
Sustainability 11 01806 g001
Figure 2. Structures of final energy use and output (in 2005 price) of ten industrial sectors in the seven targeted cities in 2015.
Sustainability 11 01806 g002
Figure 3. Changes in industrial output and final energy use in seven cities during 2005–2015.
Sustainability 11 01806 g003
Figure 4. Proportion change of each fuel consumed by sectors in 7 cities during 2005–2015.
Sustainability 11 01806 g004
Figure 5. Contributions of different factors to changes in aggregate final energy use in seven cities during 2005–2010 and 2010–2015.
Sustainability 11 01806 g005
Figure 6. Contribution of each industrial sector to total changes in industrial final energy use.
Sustainability 11 01806 g006
Figure 7. Contributions of different factors to changes in sectoral final energy use in seven cities during 2005–2010 and 2010–2015.
Sustainability 11 01806 g007
Table 1. General information of the seven target cities in 2015.
ItemsBeijingTianjinHangzhouShenyangXi’anFuzhouGuiyang
Population (×106)21.7115.477.248.298.166.784.62
GDP (×109 CNY) a2368.571683.791005.02727.23580.12561.81289.12
GDP ranking in China251019262966
Percentage of industry (% of GDP)16.1742.7434.8042.4723.7333.3824.70
Industrial final energy use (×106 tce) b8.8834.8415.246.132.788.725.36
a CNY: Chinese Yuan; b tce denotes tons of standard coal-equivalent.
Table 2. Aggregation of industrial sectors.
CodeIndustrial sectorsCodeIndustrial sectors
IS1Mining of coalIS6Chemicals
IS2Extraction of oil & natural gasIS7Nonmetals
IS3Mining & processing of oresIS8Metals
IS4Light industryIS9Manufacture of equipment
IS5Petroleum processing & coking IS10Production and supply of electricity, heat, gas, and water

