Article

Fragmented Riverine Habitats in Taiwan Have Spatio-Temporal Consequences, Re-Distributing Caprimulgus affinis into Urban Areas Leading to a Human–Wildlife Conflict

1
Graduate Institute of Environmental Resources Management, TransWorld University, Douliu City, Yunlin County 640, Taiwan
2
Department of Tourism, Tungnan University, Shenkeng District, New Taipei City 222, Taiwan
3
Department of Environmental Engineering, Da-Yeh University, Dacun, Changhua County 515, Taiwan
4
School of Forestry and Resource Conservation, National Taiwan University, Taipei City 106, Taiwan
5
Pacific Gas and Electric Company, 3401 Crow Canyon Road, San Ramon, CA 94583, USA
6
Academy of Natural Sciences, 1900 Benjamin Franklin Parkway, Philadelphia, PA 19103, USA
7
Graduate Institute of Environmental Education, National Taiwan Normal University, Taipei City 116, Taiwan
*
Authors to whom correspondence should be addressed.
Sustainability 2019, 11(6), 1778; https://doi.org/10.3390/su11061778
Submission received: 11 November 2018 / Revised: 25 January 2019 / Accepted: 20 March 2019 / Published: 25 March 2019
(This article belongs to the Special Issue Sustainable Wildlife Ecology and Conservation)

Abstract

:
Caprimulgus affinis is an endemic species commonly known as the Taiwan nighthawk, forest nighthawk, or South Asian nighthawk. In recent years, the C. affinis population has gradually moved outward from river habitats into the metropolitan areas of Taiwan. Because male birds’ booming sounds at night can reach up to 90 dB or higher and they can be intermittently tweeting for more than 10 hours, they often disturb the sleep of urban residents and can even cause nightmares. In this study, we analyzed long-term survey data to assess the distribution history of C. affinis in Taiwan. By using 1738 entries of observation data collected from 1999 to 2014, a model of C. affinis distribution was constructed, and a geostatistical method was used to improve the accuracy of the model estimate. In addition, the Mann–Kendall trend test was applied to predict future C. affinis distribution. Based on the results, four variables were selected to construct the C. affinis distribution matrix. Urban population, coastal proximity, and distance to upstream river location represented positive driving forces, whereas city elevation was a negative driving force. C. affinis is currently distributed on the plains of central and southern Taiwan and in eastern Taiwan. The C. affinis emergence trend diagram was plotted using the time–space trend diagram, which showed yearly increases in the C. affinis populations in urban and settled areas including central, western, northeastern, and southeastern Taiwan and yearly decreases in the populations in rural areas including northern and southern Taiwan, especially in fragmented riverine habitats. Regression kriging can correctly describe the distribution of the entire C. affinis population, which leads to the correct understanding of the biological corridor of C. affinis in their migration through the graphical contours in GIS. The analytic model in this study contributes to the establishment of the time–space trend diagram.

1. Introduction

In recent years, the high-decibel booming calls of Caprimulgus affinis Horsfield, 1821 are now being heard at night during spring and summer in metropolitan areas of Taiwan. These birds are distributed around cities and substantially impact the lives of urban residents, who have often resorted to flashlights, firecrackers, and other measures to drive away the birds. However, these measures have been ineffective. Therefore, C. affinis has become a new hazard for urban residents. In addition, because airports in Taiwan are located near cities, increased bird strike incidents with aircraft in recent years have caused aviation safety problems.
Caprimulgus affinis is one of ten subspecies with an average prevalence in Taiwan that is also called the Savanna nightjar, South Asian nighthawk or “breakwater earner”. Body length, weight, and wing span are approximately 20–26 cm, 54–110 g, and 64 cm, respectively. First described in Tainan City in Taiwan by Robert Swinhoe in 1863 [1], C. affinis is widely distributed in Taiwan, India, Indonesia, central China, and Pakistan, besides other areas [1]. In its native habitat, the yellowish-brown plumage provides superior camouflage from predators, resembling a rock when in its preferred sitting position on the ground. Having a short beak and wide rictus with a huge oral cavity, Savanna nightjars are often described as “hideous” creatures that make “disturbing booming sounds”. Due to their unflattering appearance, humans rarely deliberately capture these birds [1,2,3]. Nocturnal in nature, they feed on flying insects—their preferred food—in the evening.
It appears that the male birds are a nuisance. Their courtship behavior to attract females is established by the male birds’ vocalization in mating strategies [4,5,6,7]. The male birds also defend their territories using their squeaky sounds in general breeding behaviors. The female birds, therefore, seldom contribute to the noise [4], doing so only while they defend their solitary territories during the hatching and brooding phase. Possessing the same territorial breeding behaviors as female birds, every male remains in its own territory guarding and tending to ground nests, which are in low-elevation riverbed gravel, rocky soil, or open spaces. It is during the breeding season, which extends from January to July, that males produce their shrill booming sounds or continual caw calls while perched or in flight, respectively. In comparison, in the urban environment the males perch on the rooftops of buildings while making these well-recognized booming calls. A male bird can produce intermittent booming and bubbling trills of approximately 2 s in duration. These nocturnal sounds can reach up to 4.2 kHz, 90 decibels (dB) or higher, and can last for more than half an hour [5,6,7]. However, male birds’ booming sounds can go on for more than 10 hours as detected from our overnight audio recordings.
There are no significant differences between the nightjars currently living in the city and those from rural areas. That is both have “high-decibel tweets” according to Sharps et al. and Lowe et al. [8,9]. Caprimulgus affinis originally occupied low-altitude open grasslands, rocky soil, wheat fields, sugar cane plantations, and around streams and rivers in forests. Because these locations are far from cities and towns, the breeding calls of the birds were not a disturbance to humans. Although recent surveys have shown C. affinis populations to be growing, reproductive success rates continue to be low in natural environments due to environmental impacts (e.g., flooding) and predation (e.g., cats, dogs, rats, snakes, and birds such as crested goshawks, Accipiter trivirgatus, and collared scops-owls, Otus lettia glabripes). In contrast, “urbanized” C. affinis birds prefer to lay eggs on the flat roofs of penthouses in sparsely populated areas and particularly on the roofs of schools or larger institutions. Given the lack of natural predators, the urban environment provides safer breeding grounds and increased fecundity. Other than disturbances from humans and rodents, the absence of threats from natural predators enhances breeding success rates and contributes to higher reproduction rates for the species [10,11,12]. In addition, the phenomenon of nightjars’ “urbanization” has been observed, and the birds have begun to enter metropolitan areas [10,11,12,13,14,15,16]. This phenomenon of “urbanization” is occurring in other parts of the world where C. affinis exists [17].
Although riverbeds are the preferred habitats [18], in some cases, the concentration of nightjars in cities has been found to be higher than in the surrounding riverbeds and riverine sites [19,20,21,22,23,24]. River fragmentation from natural and anthropogenic influences, such as flooding, dredging, channelization, and dams has influenced water flow regimes throughout the country [25,26,27,28]. The resulting disturbed riparian and aquatic habitats may lead to shifts in avian distribution for breeding and foraging sites [27]. Avian communities are sensitive to spatial and phenological mismatches with aquatic prey following flow disturbances in rivers [28]. For instance, disturbance of gravel and sand along the river edge has destroyed natural habitat of C. affinis. However, the effects of river fragmentation on C. affinis distribution are still poorly understood and, to our knowledge, there have been no related reports in Taiwan or even in Asia on this topic. Therefore, this is the first study performed to evaluate trends in C. affinis’ distribution history to determine whether this species has changed habitats due to disturbances. The two purposes of this study were to: (1) determine current and past C. affinis distributions and (2) predict the likelihood of C. affinis sightings in major cities in the future by using past data.

2. Materials and Methods
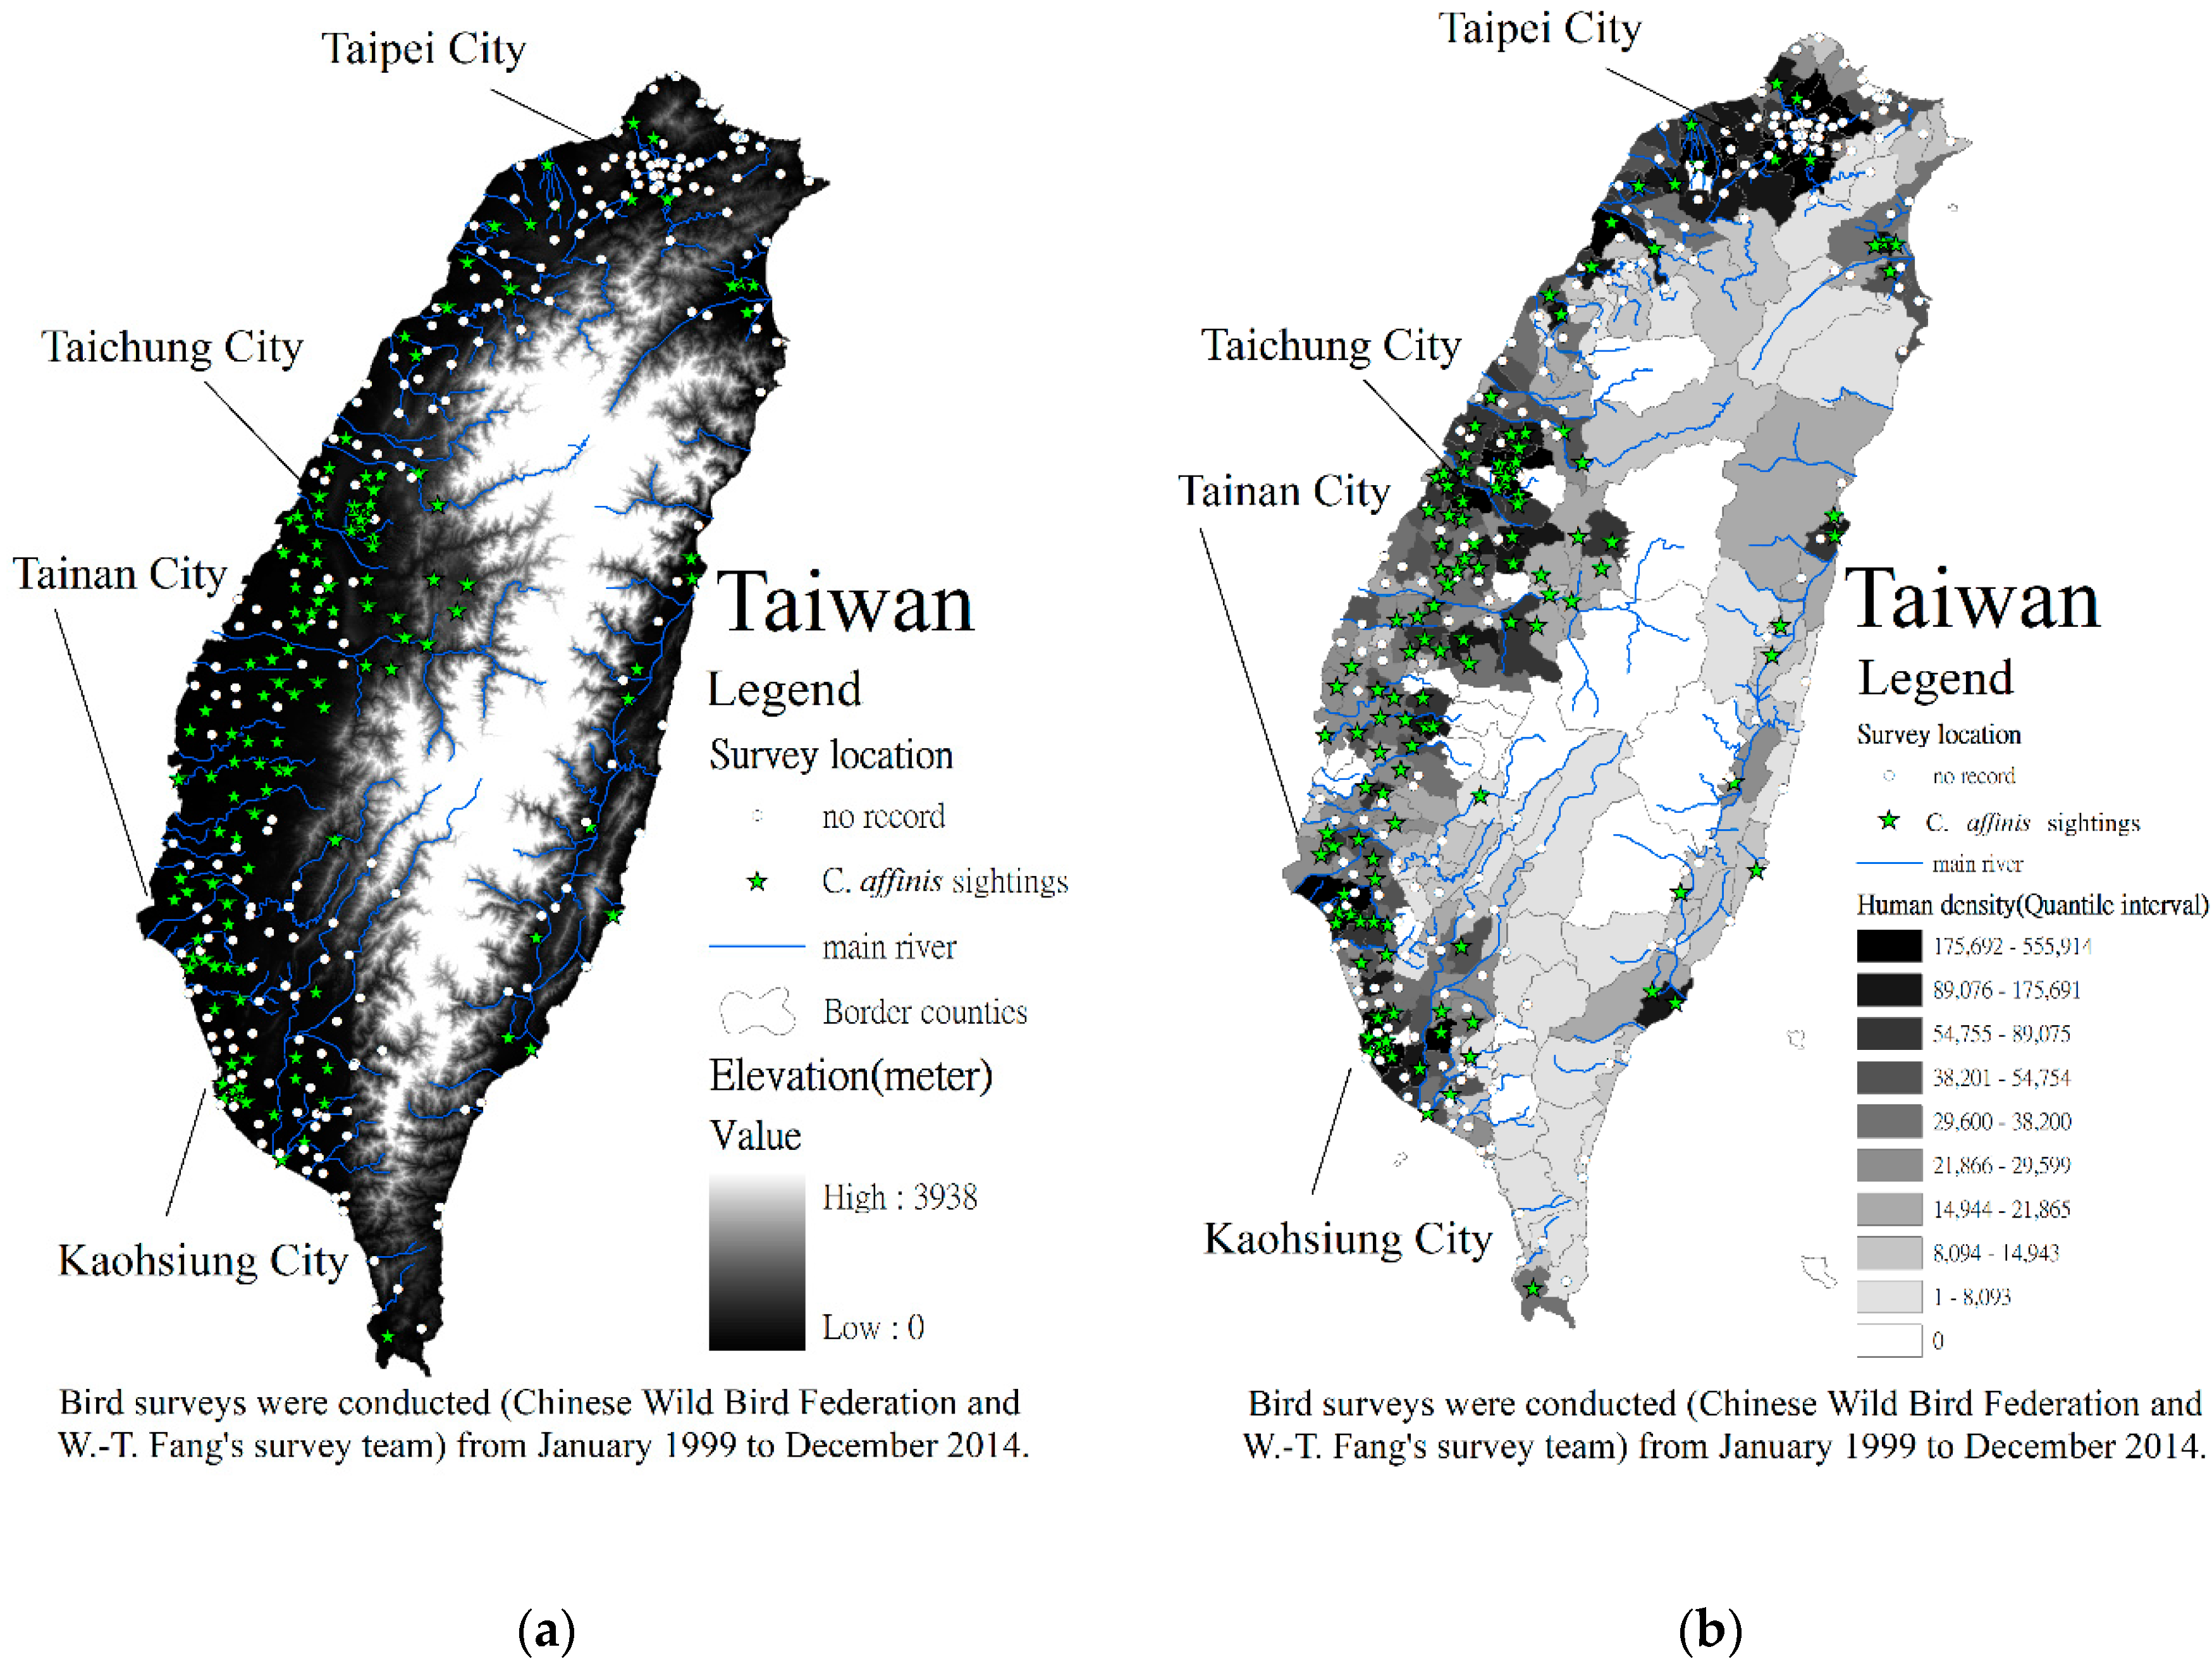
2.1. Study Area

Taiwan has a population of about 23.5 million people and the annual population growth rate is 1.22%. Taiwan is approximately 36,000 square kilometers in size, with 32% of the whole island having mean sea level elevations higher than 1000 meters (Figure 1). Distribution of the species based on elevation is as follows: 70.5% of the population occurs at elevations between 0 and 50 m, 27.0% occurs between 50 and 500 m, and 2.5% occurs between 500 and 600 m. The average annual precipitation in Taiwan is about 2150 mm, but rainfall in northern Taiwan is about 20% higher than that in the southern Taiwan. Most of this precipitation occurs from typhoons during the wet season that extends from May to October. However, the spatial and temporal distribution of precipitation is extremely uneven, leading to great differences in river flows during the dry and wet seasons.

2.2. Methods

To sample the entire island nation and account for C. affinis having various degrees of mobility, we used stratified random sampling methods [25] suitable for C. affinis niches from sea level up to 1000 m elevation. We conducted monthly surveys at 335 locations across Taiwan between January 1999 to December 2014 (Figure 1) and developed a database for the 16 years of field surveys that were conducted by 234 field birdwatchers, who were members of a citizen science training program, which we managed along with the birdwatchers from the Chinese Wild Bird Federation, Taiwan, R.O.C. More than 45,000 observation hours went into the field survey component of this study. To ensure quality control and data reliability, the records in the database were proofread and verified by the authors. The database included 60 riparian areas (Appendix A) for all river names and their total lengths (TLs = 3696.5 km, 2310.3 miles) of riparian sections along these rivers in the monitored areas. Using the observation data, coordinate calibration and cross-matching were performed. Corresponding data for every urban and rural settlement (n = 335) in Taiwan were compiled to establish a record of C. affinis sightings from 1999 to 2014. Surveys for C. affinis were conducted from evening to the following morning because this nocturnal species roosts and sleeps during the day. Sampling data were collected and no birds were harmed or disturbed. All survey data are maintained in an open database with free access upon request. All available data (i.e., 1738 entries of observation data) were mapped to 335 urban and rural settlements. No specific permissions were required for field permits in this study and no prior approval was required by the Council of Agriculture, Executive Yuan, R.O.C.
Caprimulgus affinis distributions in urban and rural settlements were set as analysis locations in the logistic regression model as well as the following variables: urban and rural settlement populations, coastal proximity, city elevation, urban and rural settlement location, distance to main river location (calculating the shortest distance from main river), and distance to upstream river location (calculating the shortest distance from the source of the main river). Logistic regression was conducted to analyze C. affinis distribution and the aforementioned variables. The distance from the edge between an urban and rural settlement to a peripheral location was defined as the short and direct distance from a core point of the urban and rural settlement to a line (i.e., distance to coastline defined as the shortest distance to nearest ocean coast, distance to main river location, and distance to upstream river location). A stepwise regression was performed using SPSS software. During the analyses, the recursive loop continued to calculate the weight of each variable and the insufficiently heavy variables were eliminated to retain the more influential variables; the significance of the variables was also calculated.
The Mann–Kendall trend test [29,30] was used to explore any changes in the distribution of C. affinis from 1999 to 2014. Indicator kriging estimates the probability that the concentration of a pollutant exceeds a specific threshold value at a given location [29,30,31]. The random function is then modeled as a combination of the trend and a random variable. Regression kriging combines these two approaches; regression is used to fit the explanatory variation and simple kriging, with the expected value of zero used to fit the residuals (i.e., unexplained variation) [29]. In addition, regression kriging is mathematically equivalent to universal kriging and kriging with external drift [32,33].
The Mann–Kendall trend test estimated only space distribution by using the observation data of C. affinis and the kriging method was used to estimate the incidence of C. affinis sightings. To enhance estimation accuracy, the logistic regression results were analyzed using the regression kriging method. Thus, in addition to the analysis of the spatial distribution of C. affinis, other assessment factors could be added to the estimation analysis (i.e., urban population, coastal proximity, city elevation, distance to main river location, and distance to upstream river location). In the present study, kriging and indicator kriging were performed using Geostatistical Software Library and related software (GSLIB) [31].
We, therefore, designed a first situational category and a second situational category to describe the following situations. The estimation results of the first situational category and the regression kriging method underwent correctness analysis [25,33,34,35]. We assessed whether the estimation model would be more accurate from regression kriging associated with indicator kriging method than that of logistic regression after the driving forces analysis.
A receiver operating characteristic curve (ROC curve) was performed in this model. This graph shows the performance of a classification model at all classification thresholds. This curve plots true positive rate (TPR) and false positive rate (FPR) at different classification thresholds. Lowering the classification threshold classifies more items as positive, thus increasing both false positives and true positives. To compute the points on a ROC curve, we could evaluate a logistic regression model many times with different classification thresholds. Therefore, the area under the curve (AUC under the ROC curve) is an efficient, sorting-based algorithm that can provide this information for us. That is, AUC measures the entire two-dimensional area underneath the entire ROC curve (think integral calculus) from (0,0) to (1,1). AUC ranges in value from 0 to 1. A model whose predictions are 100% wrong has an AUC of 0.0; one whose predictions are 100% correct has an AUC of 1.0.

3. Results and Discussion

3.1. Driving Forces of Diversity Detected Using Logistic Regression

Caprimulgus affinis observations were conducted in 335 urban and rural settlements, of which 213 had no record of C. affinis sightings and 122 did (Figure 1). The data are primarily from the southern and central parts of western Taiwan and only a few data records were from northern and eastern Taiwan. The analysis steps and results are shown in Table 1. Four variables were selected to construct the C. affinis distribution matrix: urban population, coastal proximity (the distance to the nearest ocean coast), and distance to upstream river location (calculating the shortest distance from the source of the main river) represented positive driving forces; and city elevation represented a negative driving force. The main-river distance parameter (calculating the shortest distance from a main river) was not included as a variable in the equation because it was not significant. The results of the driving-force analysis are consistent with the biological characteristics of C. affinis, which indicates the species prefers urban habitats rather than the ocean coast.

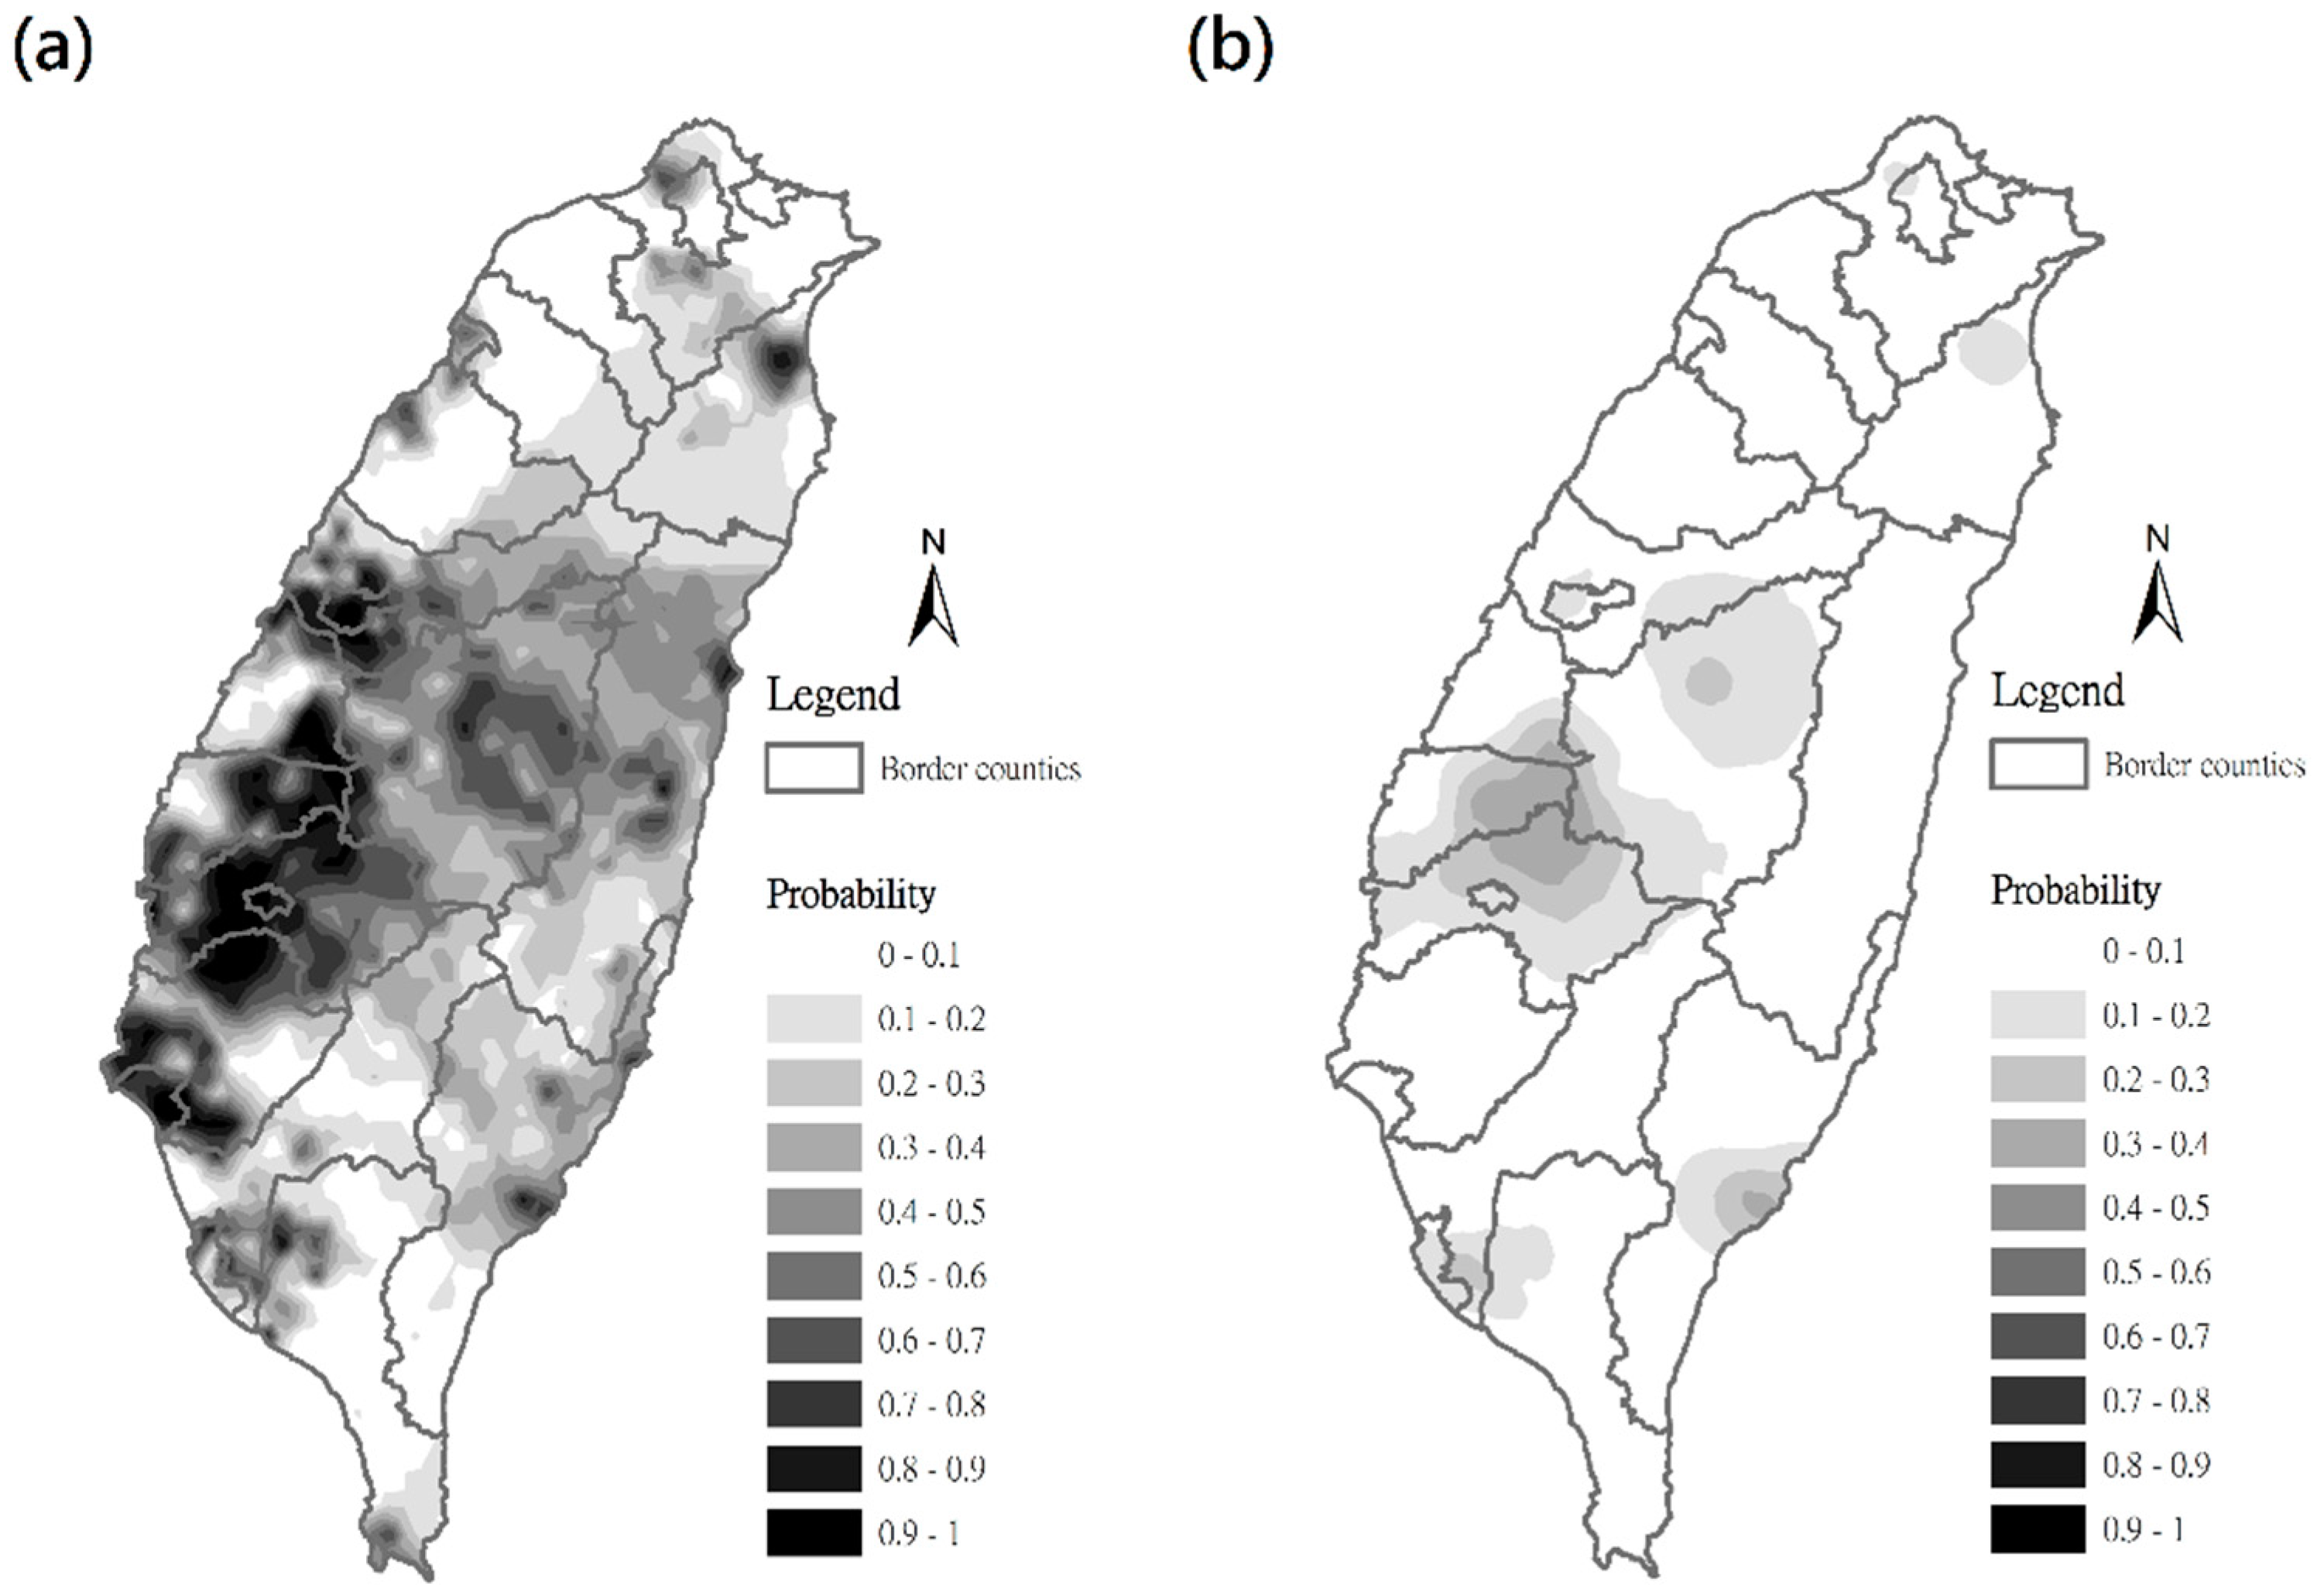
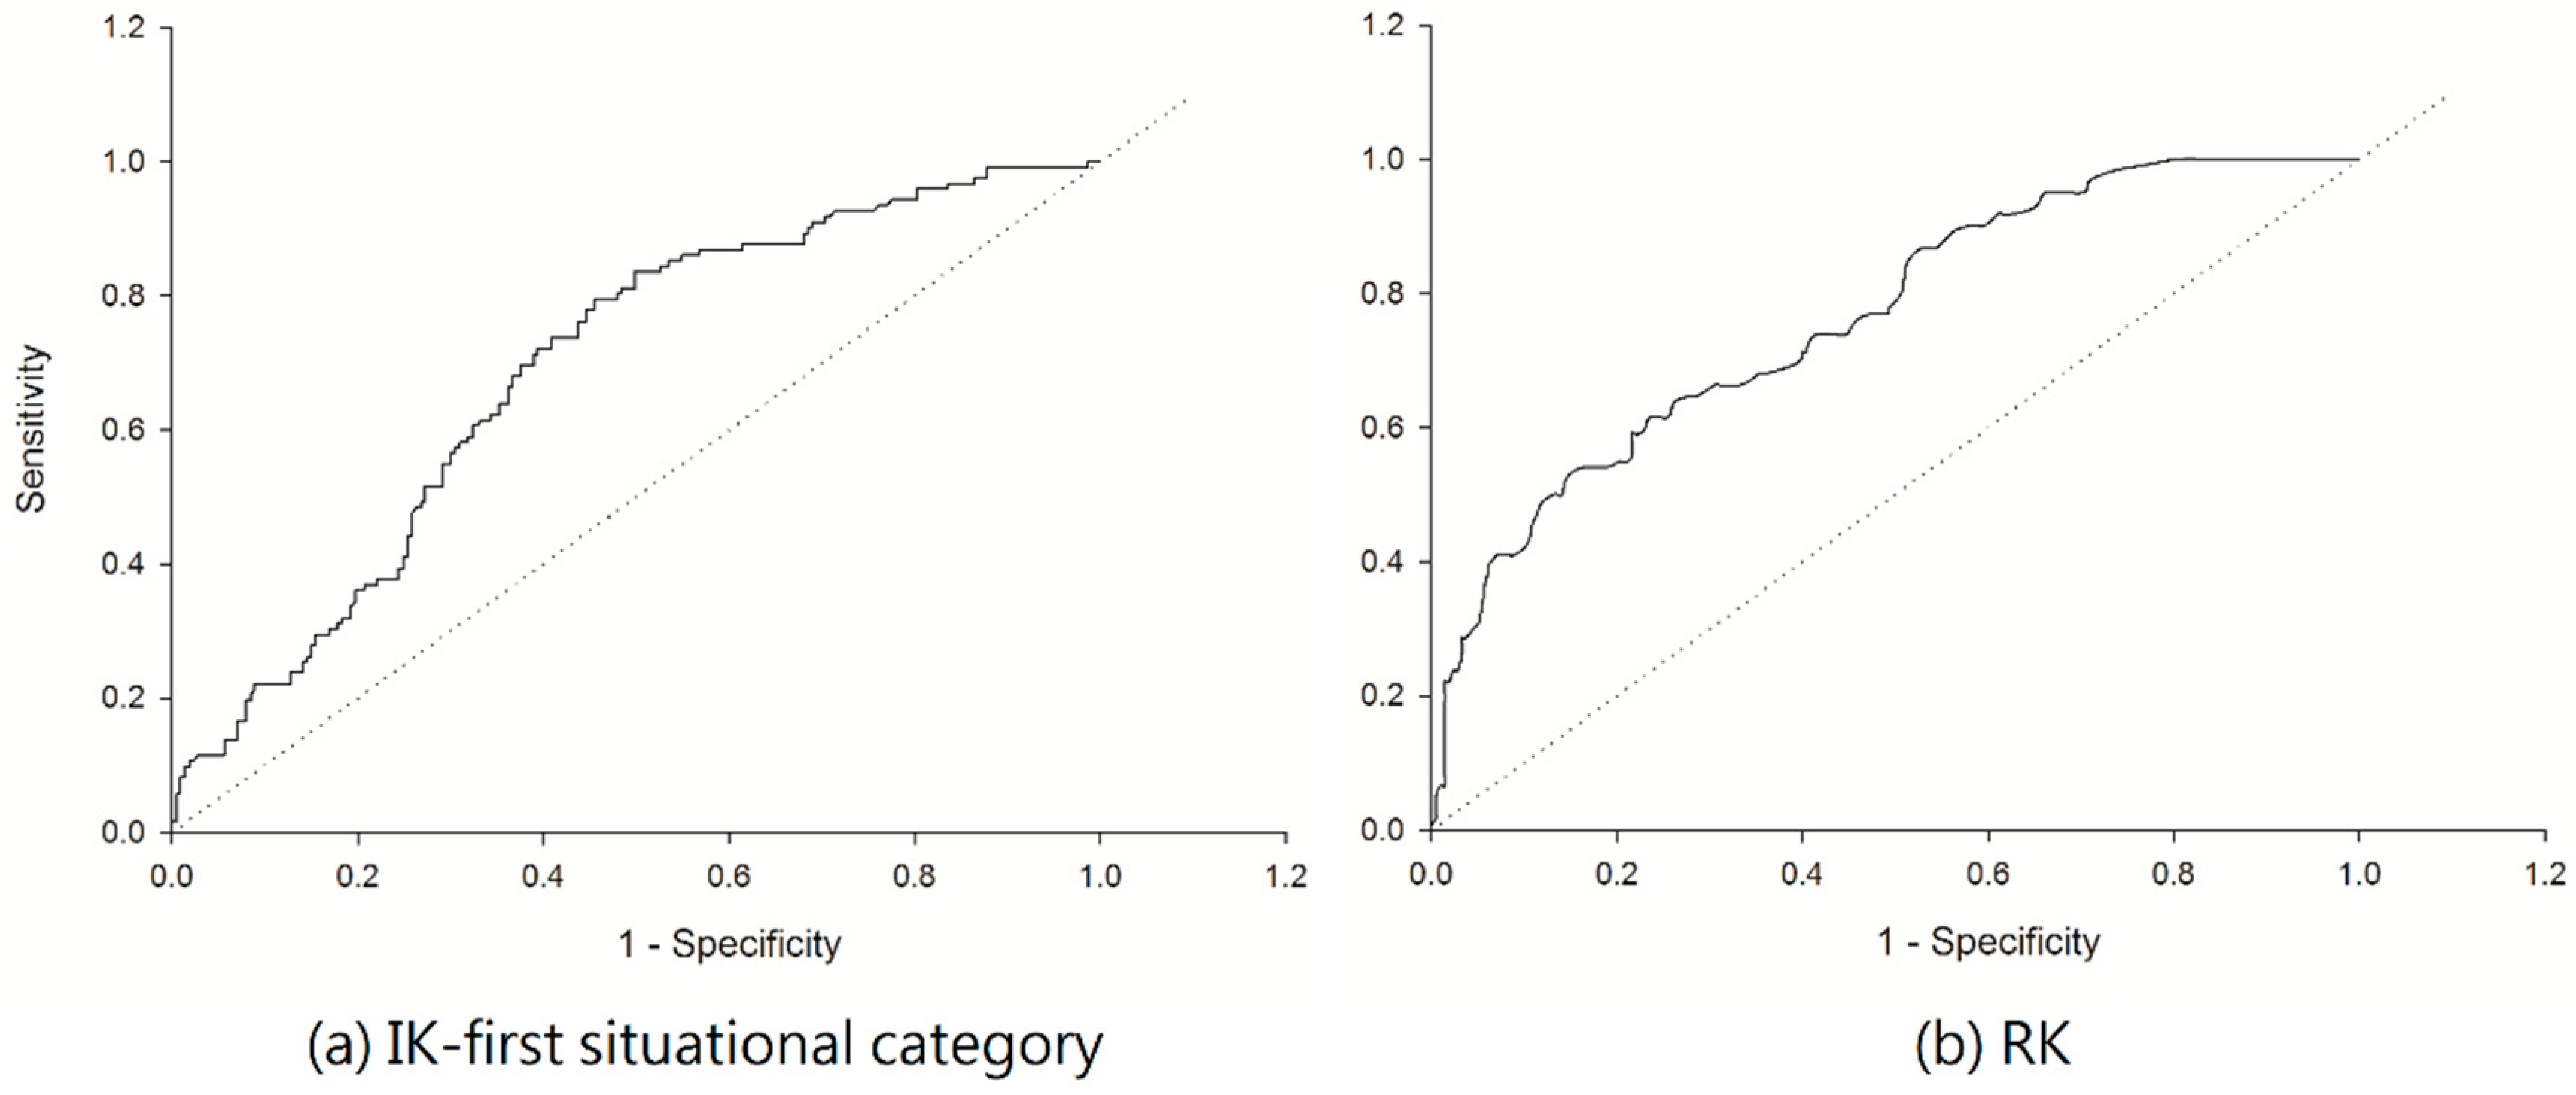
3.2. Estimation of C. affinis Space Distribution Using Indicator Kriging Method

Using the index model, the sightings of C. affinis underwent situational categorization as follows:
First situational category: If C. affinis is sighted, then this is coded as 1, otherwise it is coded as 0 (single-threshold method).
Second situational category: The frequency of C. affinis sightings from 1999 to 2014 was calculated. For example, the frequency of one sighting was calculated as 1/16 = 0.0625 and that of eight sightings was calculated as 8/16 = 0.5 (multi-threshold method).
The semi-variogram results of the incidence of C. affinis sightings are shown in Table 2. The first and second situational categories were suitable for the index model. The C0 of the first situational category should be smaller than that of the second situational category.The impact range of the first situational category was approximately nine times smaller than that of the second situational category. This finding indicated a more suitable space structure for the first situational category and showed regional location was the main influencing factor. By contrast, the second situational category provided a greater estimation result and more suitable outcomes for long distances. The estimation results of the two categories are shown in Figure 2. The basis of the first situational category (Figure 2a) is all of the locations of C. affinis sightings, which shows the species is spatially clustered and distributed mostly in the southern and central areas of Taiwan with few occurrences in northern Taiwan. However, the basis of the second situational category (Figure 2b) is the frequency of sightings. The diagram shows central Taiwan possesses the most C. affinis sightings, which agrees with the current phenomenon of C. affinis disturbing people’s sleep and the current location of this species.

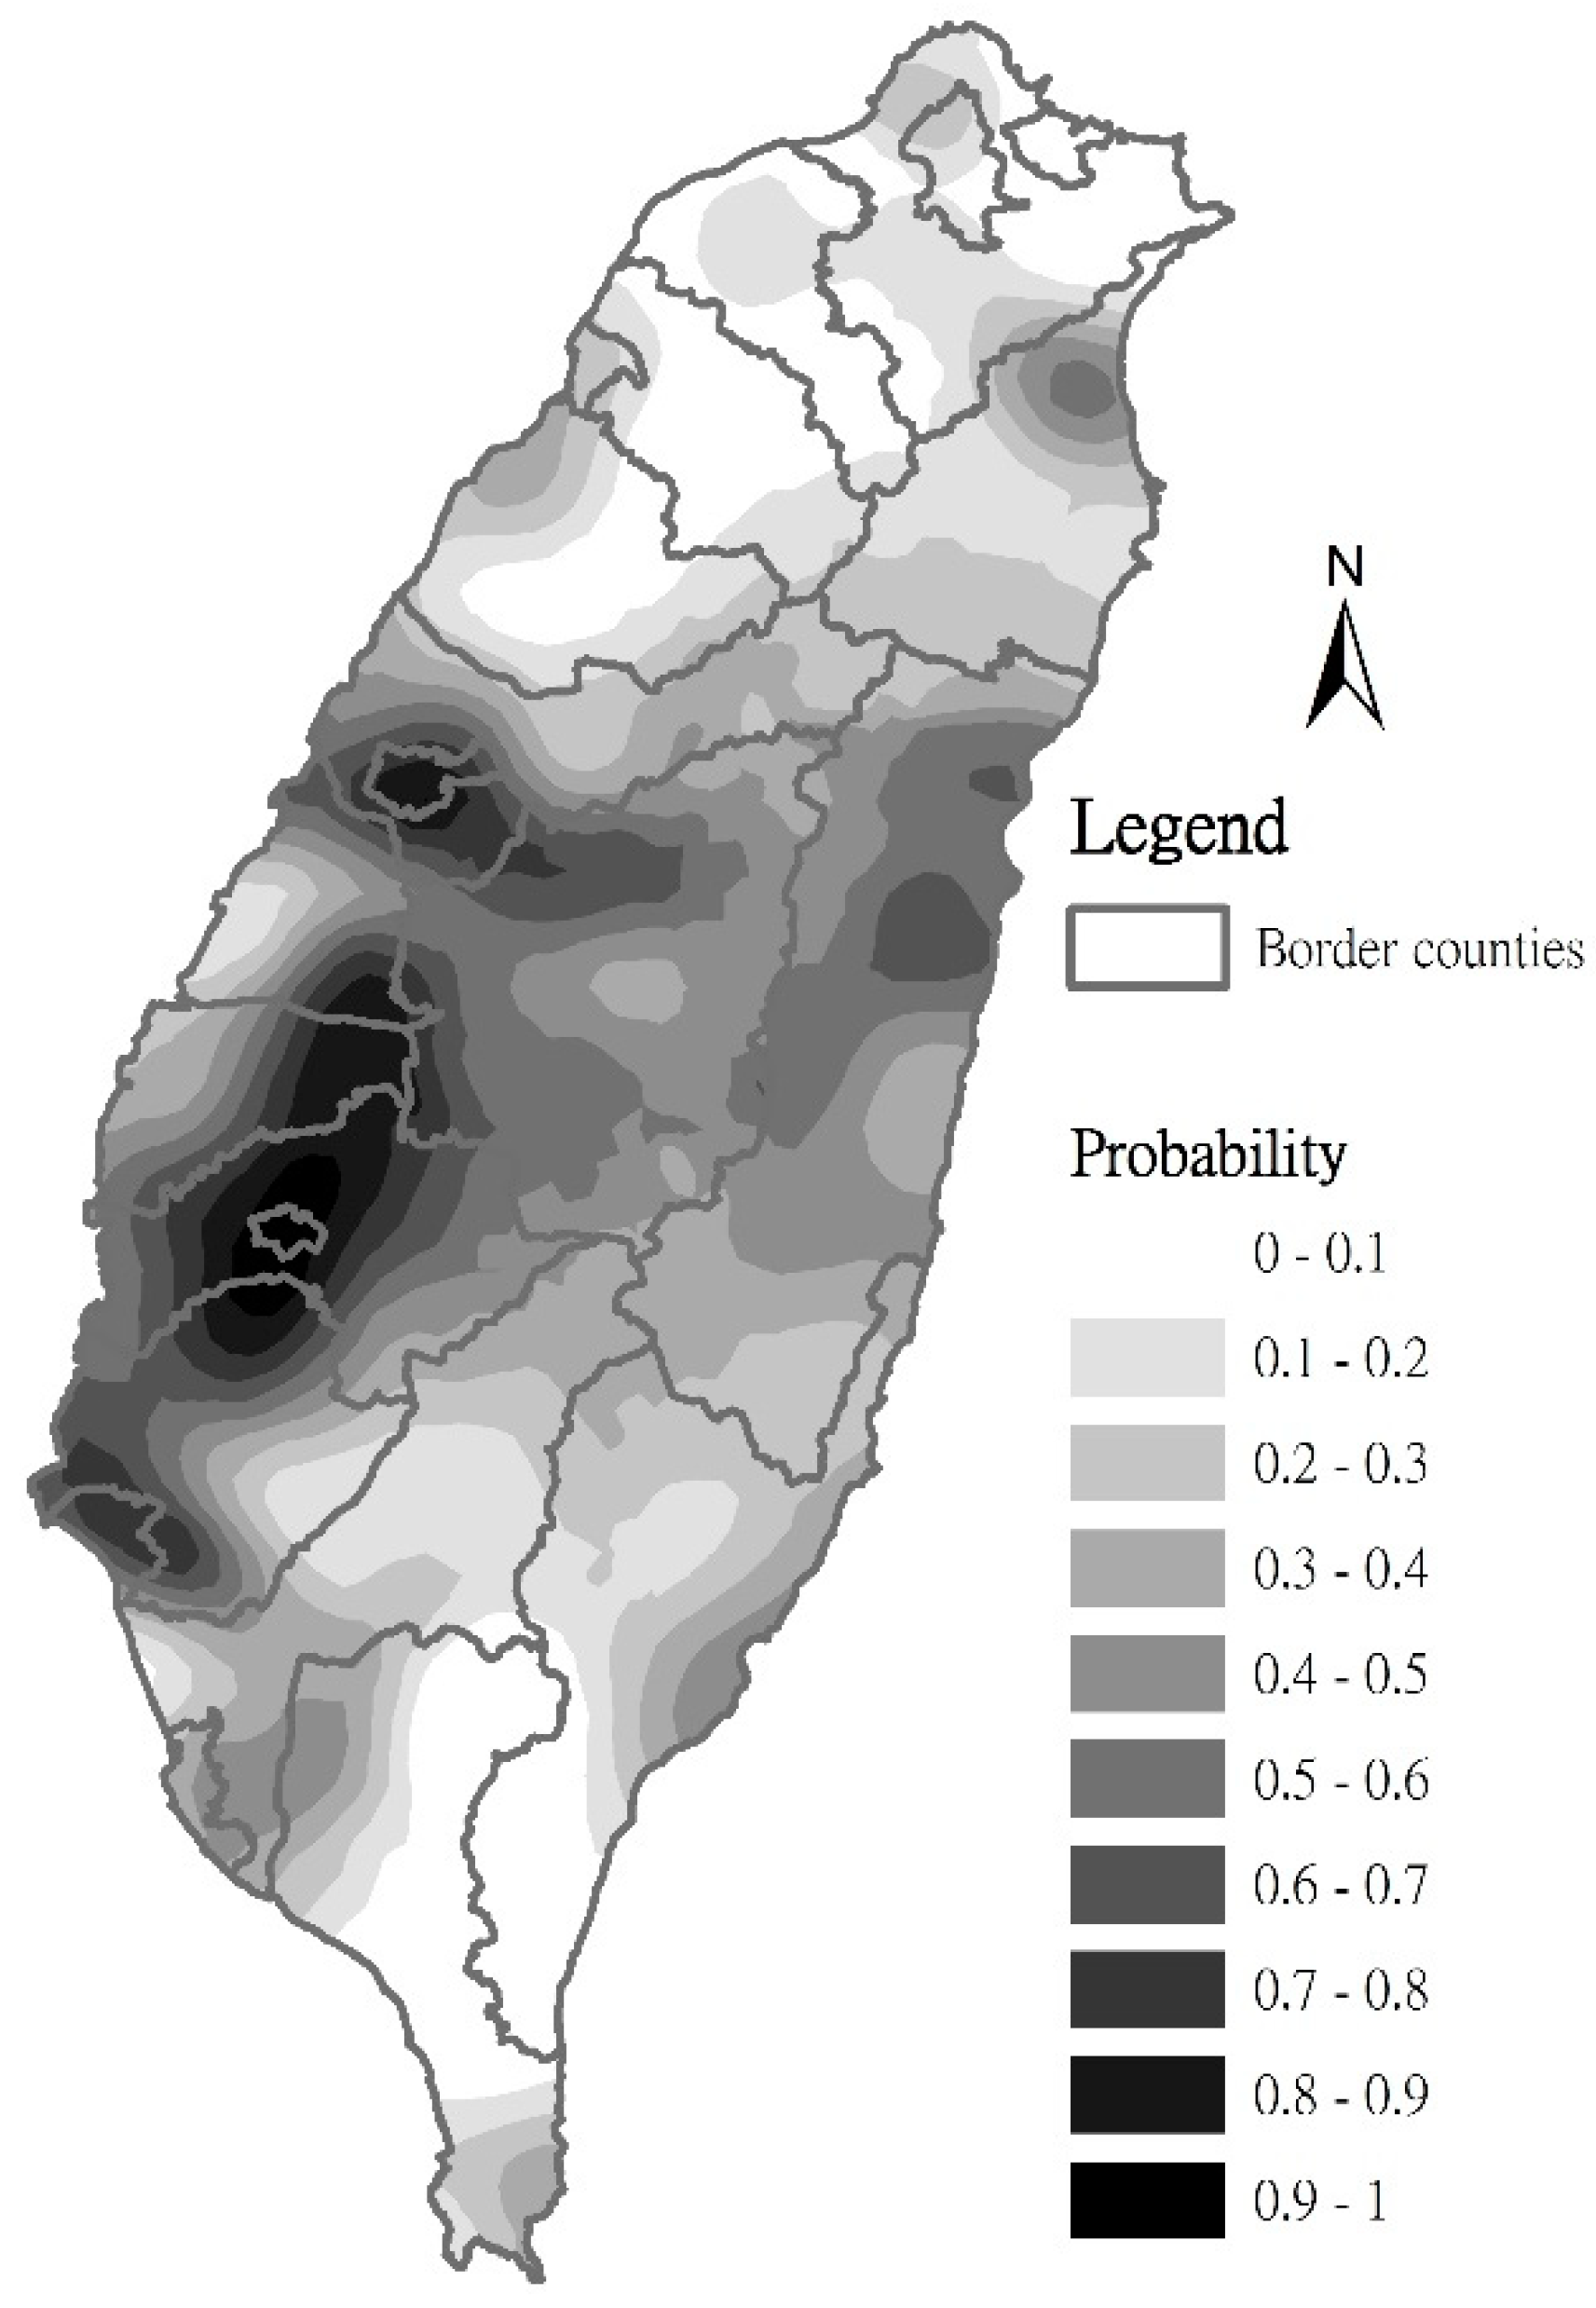
3.3. Estimation of C. affinis Space Distribution Using Regression Kriging Method

The estimation results are shown in Figure 3, which reveals several phenomena. First, the sightings mostly occurred in central, southern, and eastern (i.e., Lanyang Plains and Hualien County) Taiwan. Second, the line of equal probability for the incidence of C. affinis sightings is partially horizontal in the space. This finding indicates the range of bird activity is less limited and confirmed that a biological corridor exists for C. affinis. Third, although urban population was selected as a parameter for determining the C. affinis distribution matrix and represented a positive driving force, C. affinis was rarely observed in Taipei City (see Figure 1). Thus, C. affinis migration to northern Taiwan did not appear to be strong.
The results show the estimation result of the first situational category had an AUC of 0.688. The estimation result of the regression kriging method had an AUC of 0.765. Therefore, the regression kriging method yielded slightly higher results. The ROC curve is shown in Figure 4.

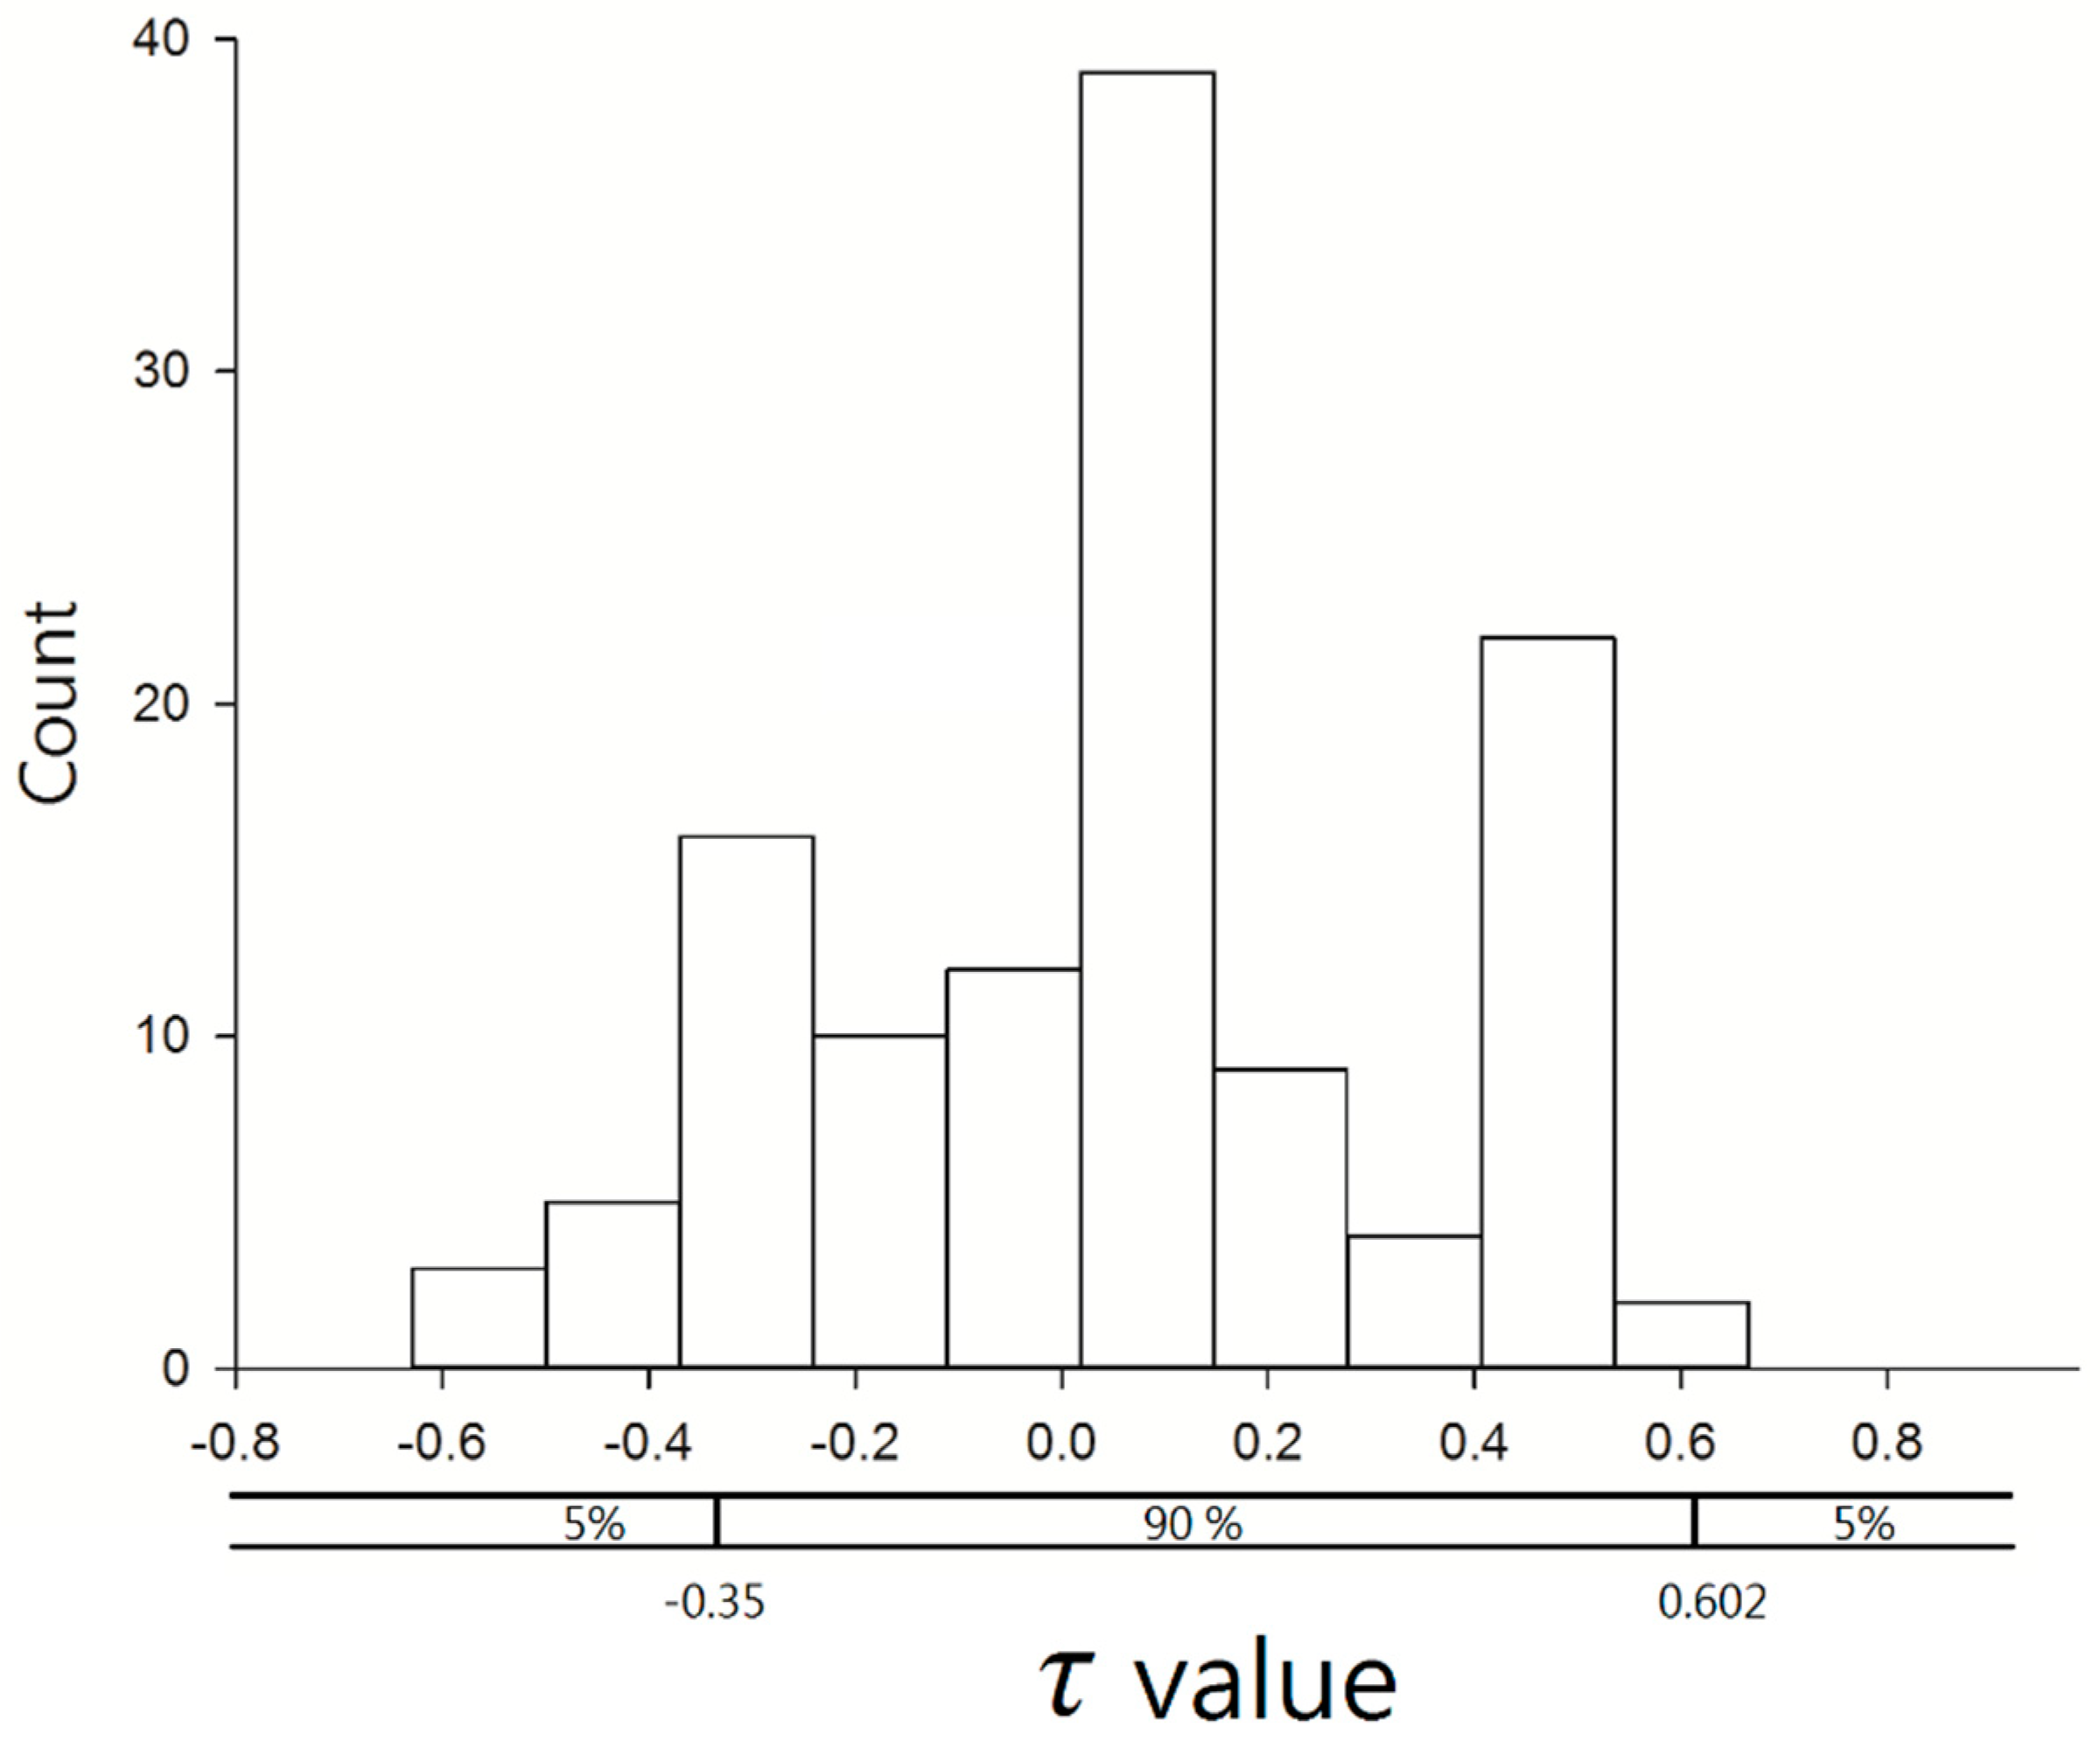
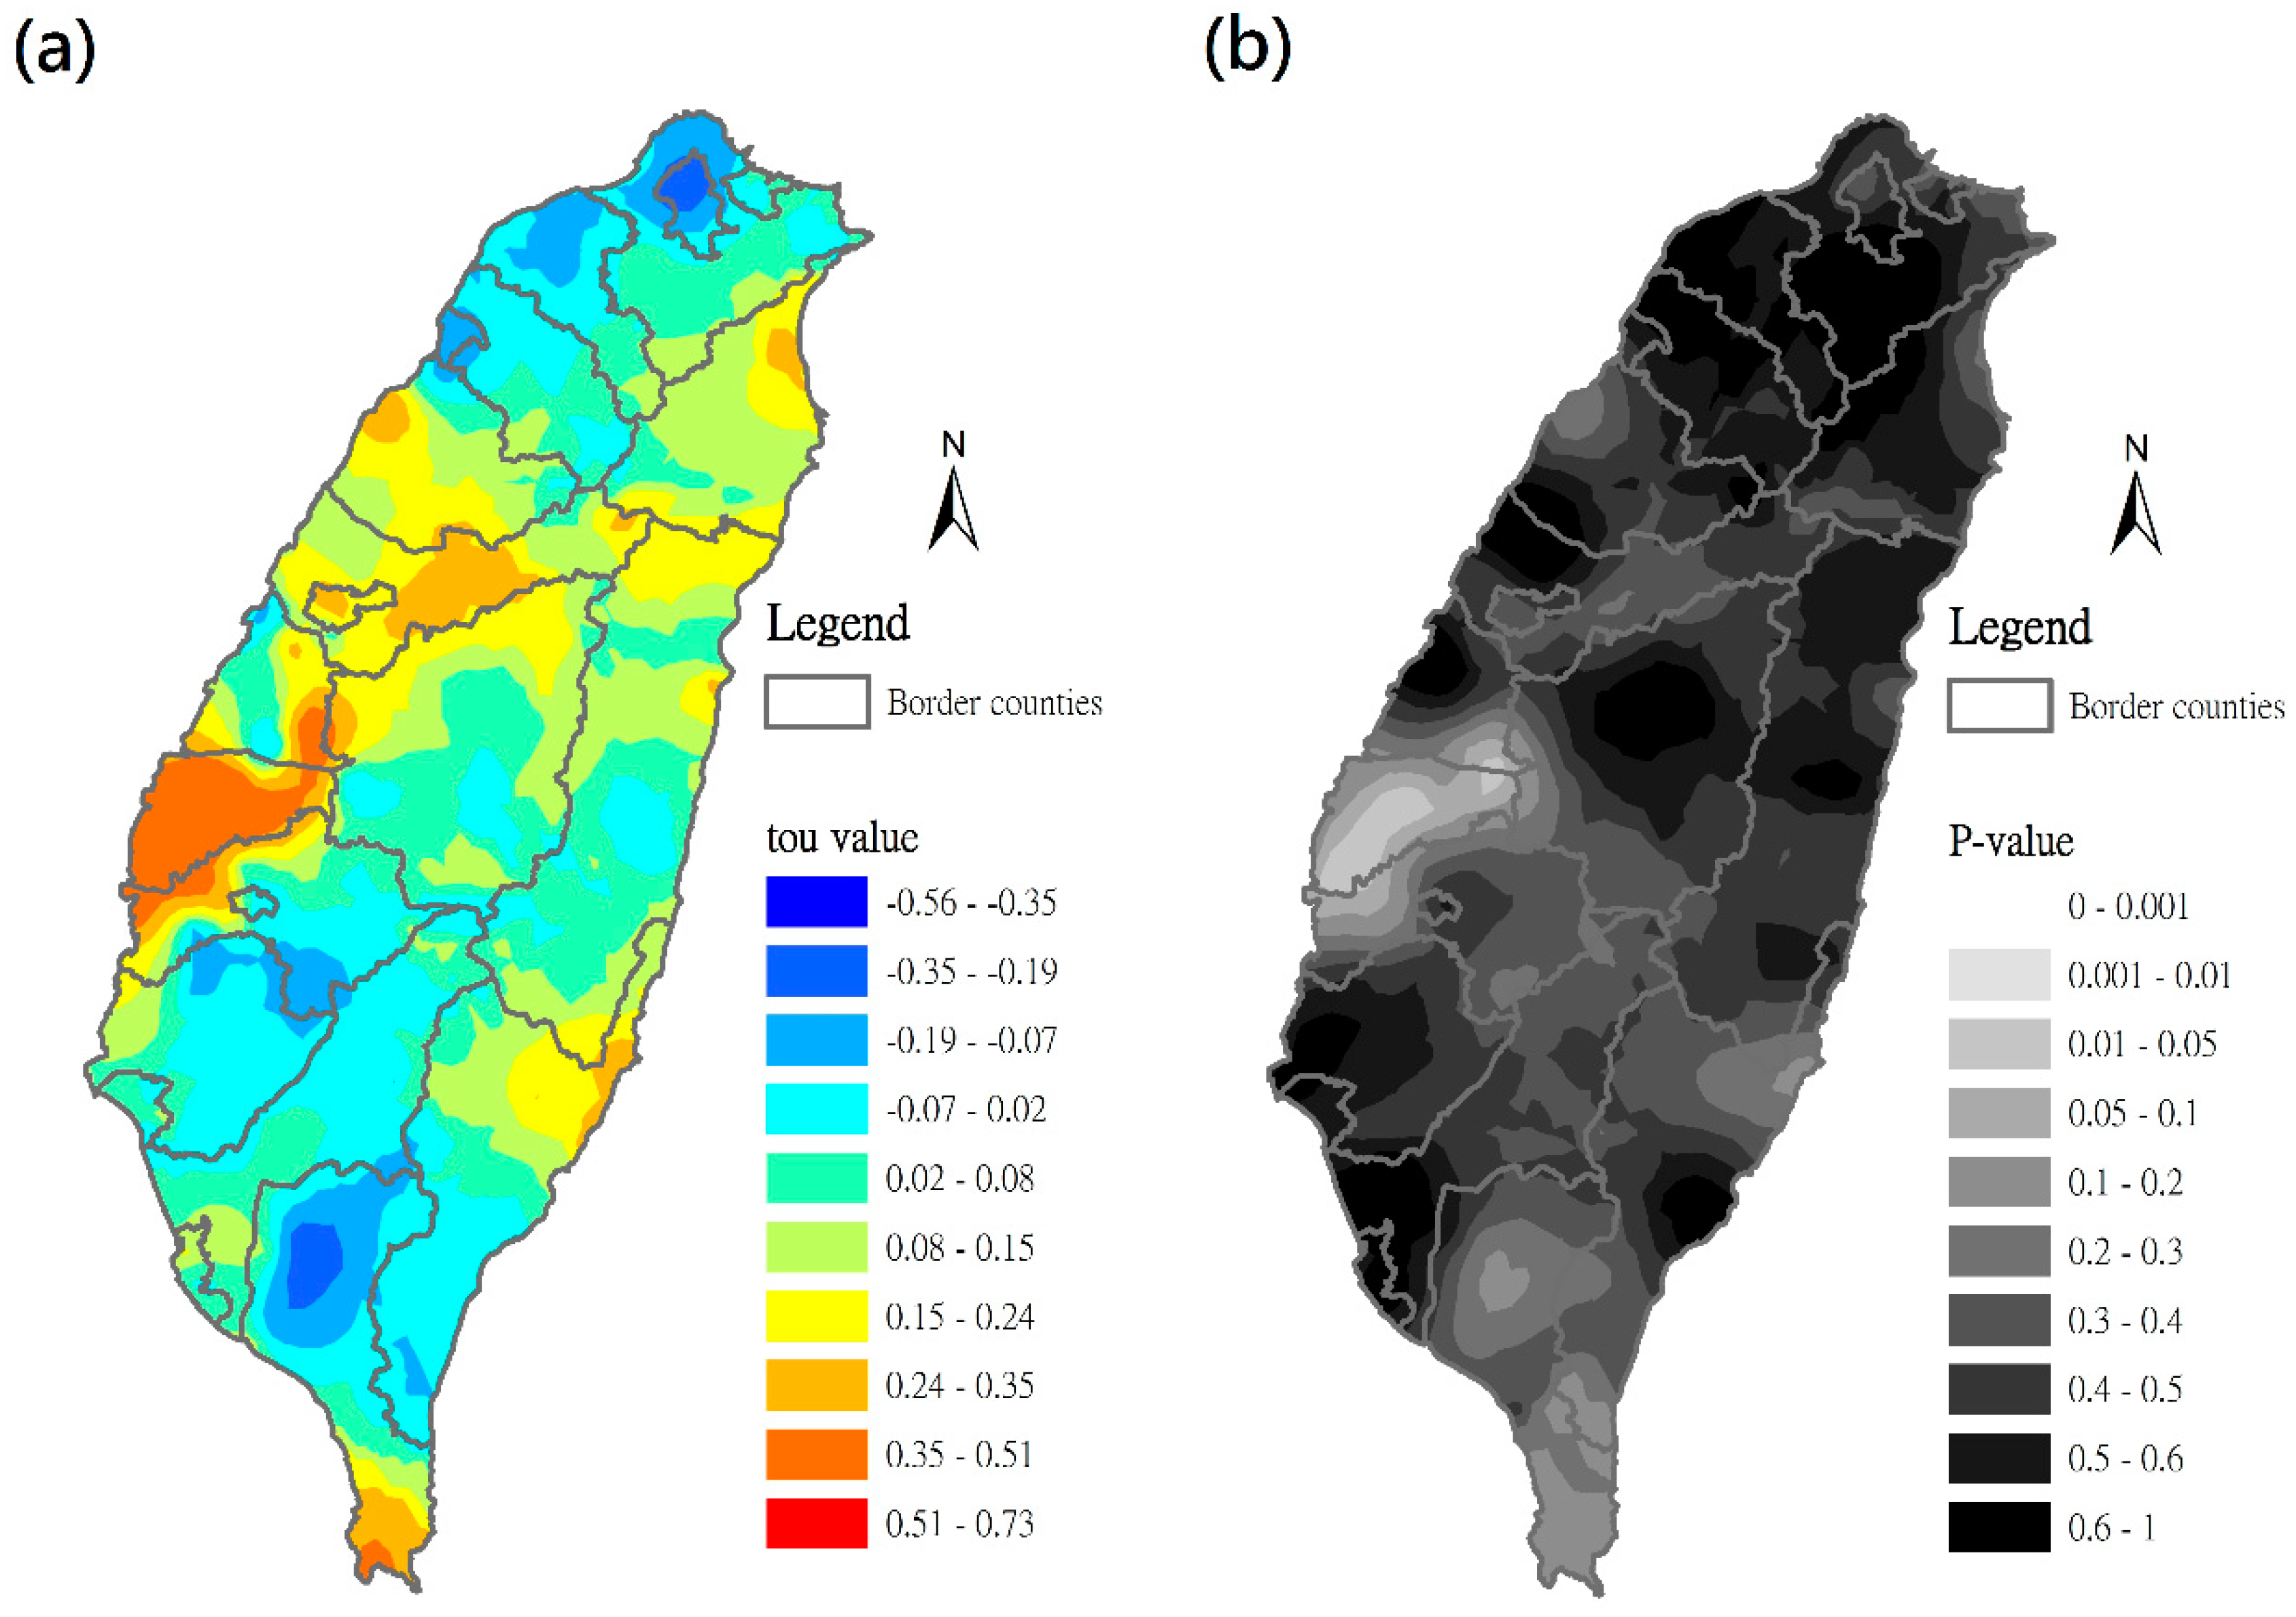
3.4. Time–Space Distribution of C. affinis Sightings

This study used observation data of C. affinis (continuity data collected over 16 years and shown in Figure 1) to calculate the incidence trend of C. affinis sightings in urban and rural settlements (n = 335). Using the Mann–Kendall trend analytic method [29,30,36,37], the τ and p values were obtained. The τ value indicates whether the 16-year data show an upward or downward trend. The p value indicates whether the test data volume is sufficient to show the trend. The trends histogram of C. affinis sightings from 1999 to 2014 revealed C. affinis sightings in towns and cities showed an upward trend (Figure 5). The data for 26 locations in Taiwan showed a significantly upward trend (τ > 0 and p value < 0.05) [31,32,33,34], and the sightings were mostly concentrated in central Taiwan. It can be seen from the reduction of the overall trends in the south and the increase in the trend in the central region that C. affinis had moved north from the southern parts of Taiwan and these trends might be related to the population density of people. Since the onset of the 21st century, C. affinis numbers have increased in the central/western regions of Taiwan, predominantly in urban settlements.
The incidence trends of C. affinis sightings in Taiwan are presented in Figure 6. Larger τ values indicate increased C. affinis sightings, while negative τ values show reducing sighting trends. Figure 6b represents whether the sighting trend of C. affinis in Taiwan is statistically significant. The smaller the p value, the better the confidence of the τ value. Caprimulgus affinis sightings in central, northeastern, and southeastern Taiwan show upward/increased sighting trends, which is consistent with the observed urbanization of C. affinis in these regions in recent years. Caprimulgus affinis sightings in northern and southern Taiwan showed decreased sighting trends, which is consistent with observations and historical records. At present, the number of C. affinis in the central region is large, widely distributed, and has an upward trend (p < 0.05). It is statistically significant and suggests the number of C. affinis in the central region is not likely to decrease in the future. The p value obtained from the Mann–Kendall trend analytic method indicates the significance of the data [31,32].
Although the main habitats of C. affinis are the Kaohsiung and Pingtung riverbeds in southern Taiwan [38,39], it is well documented that the species has migrated to western and eastern Taiwan [40,41,42]. While urban river construction projects have impacted the birds’ original habitats [25], suitable habitat appears to have been inadvertently created for C. affinis (or selected/deemed appropriate by the species) in urban areas. The large number of artificial urban river construction projects could be an indirect cause of C. affinis migration, but whether habitat change, degradation or elimination, change in breeding habitat, or reduced food supplies (i.e., moths) caused C. affinis, one of the important nocturnally insectivorous birds [43,44], to migrate from the countryside to metropolitan areas is not known and requires further investigation.

4. Conclusions

In this study, long-term (16 years) observational field survey data were used to determine the current and past distribution of C. affinis in Taiwan and analyze distribution changes for the species (n = 1738 observations of C. affinis) in 335 urban and rural settlements. Based on the results, three driving forces were determined to be important: urban population and far coastal proximity represented positive driving forces, whereas city elevation (0–1000 m) represented a negative driving force.
Our analyses suggest C. affinis will probably continue to expand its range to all major cities in western Taiwan and occupation of the species in its native riparian habitat is likely to continue to decrease. The regression kriging model graphically described the past and current distribution of C. affinis populations, which contribute further to understanding better potential and future migration corridors for C. affinis. In addition, GIS model simulations provide a reliable method for advanced forecasting of potential future relocation areas. This paper is the first study to use spatial and trend analyses to evaluate the distributional patterns of C. affinis, and the results indicate increased sightings of this bird will continue to occur in areas of higher human densities in central, western, northeastern, and southeastern Taiwan.

Author Contributions

Conceptualization, B.-Y.C. and W.-T.F.; methodology, B.-Y.C.; software, B.-Y.C.; validation, W.-T.F. and C.-H.H.; formal analysis, B.-Y.C.; investigation, W.-T.F.; resources, W.-T.F., G.-S.S., S.-C.W., B.A.L., and H.-H.L.; data curation, B.-Y.C. and W.-T.F.; Writing—Original Draft preparation, B.-Y.C., W.-T.F., and C.-H.H.; Writing—Review and Editing, B.A.L.; visualization, B.-Y.C. and C.-H.H.; supervision, B.-Y.C. and W.-T.F.; project administration, W.-T.F. and B.-Y.C.; funding acquisition, W.-T.F.

Funding

This research was funded by the Ministry of Science and Technology under Grant numbers MOST 105-2119-M-003-009 and 106-2119-M-003-003 to W.-T. Fang. This research was also partly supported by citizen science in training and outreach of the National Geographic Foundation for Science and Exploration Asia, Transaction Reference PYMTE-142998 to W.-T. Fang, General Secretary, Taiwan Wetland Society.

Acknowledgments

We thank Jay Lee, National Geographic Society—Asia, the members of the Graduate Institute of Environmental Resources Management, TransWorld University, the members of the Graduate Institute of Environmental Education, National Taiwan Normal University (NTNU), and the staff of National Geographic Foundation for Science and Exploration Asia for their contributions to the manuscript. This article was also subsidized by the National Taiwan Normal University (NTNU) and the Chinese Wild Bird Federation, Taiwan, ROC. The useful and helpful suggestions from J. Smith-Flueck and two anonymous reviewers were incorporated into the manuscript.

Conflicts of Interest

The authors declare no conflict of interest. The funders had no role in the design of the study; in the collection, analyses, or interpretation of data; in the writing of the manuscript; and in the decision to publish the results.

Appendix A

Names of All Rivers Included in This Survey.
No.River NamesLocationsLength of Riparian Section MonitoredPoints of the Compass
1DongshanYilan County24 km (15 mi) Northeast, NE
2LanyangYilan County73 km (45 mi)NE
3YilanYilan County25 km (16 mi)NE
4QingshuiYilan County25 km (16 mi)NE
5LuodongYilan County21 km (13 mi)NE
6ShuangNew Taipei City27 km (17 mi)North, N
7TamsuiNew Taipei City, Taoyuan City, Taipei City, Hsinchu County159 km (99 mi)N
8KeelungNew Taipei City, Taipei City, Keelung City89.4 km (55.6 mi)N
9XindianNew Taipei City, Taipei City82 km (51 mi)N
10JingmeiNew Taipei City, Taipei City28.1 km (17.5 mi)N
11BeishiNew Taipei City, Yilan County50 km (31 mi)N
12NanshiNew Taipei City45 km (28 mi)N
13DahanNew Taipei City, Taoyuan City, Hsinchu County 135 km (84 mi)N
14SanxiaNew Taipei City22.6 km (14.0 mi)N
15NankanTaoyuan City31 km (19 mi)Northwest, NW
16FengshanHsinchu County45 km (28 mi)NW
17TouqianHsinchu County63 km (39 mi)NW
18HoulongMiaoli County58 km (36 mi)West
19Da’anMiaoli County, Taichung City96 km (60 mi)W
20DajiaTaichung City124 km (77 mi)W
21DaduTaichung City, Changhua County, Nantou County116 km (72 mi)W
22MaoluoTaichung City, Changhua County, Nantou County47 km (29 mi)W
23NankangTaichung City34 km (21 mi)W
24ZhuoshuiNantou County, Changhua County, Yunlin County186 km (116 mi)W
25QingshuiTaichung City, Chiayi County, Tainan City51 km (32 mi)W
26ShuiliTaichung City19 km (12 mi)W
27WantaTaichung City37 km (23 mi)W
28KasheNantou County47 km (29 mi)W
29BeigangYunlin County, Chiayi County82 km (51 mi)W
30TahukouYunlin County33 km (21 mi)W
31SandieChiayi County35 km (22 mi)W
32PuziChiayi County75 km (47 mi)W
33BazhangChiayi County, Tainan City81 km (50 mi)W
34TouqianTainan City28 km (17 mi)Southwest, SW
35JishuiTainan City65 km (40 mi)SW
36GuichongTainan City35 km (22 mi)SW
37BaishuiTainan City20 km (12 mi)SW
38TsengwenChiayi County, Tainan City 130 km (81 mi)SW
39HoukuNantou County, Tainan City51.4 km (31.9 mi)SW
40YanshuiTainan City41 km (25 mi)SW
41ErrenTainan City, Kaohsiung City65 km (40 mi)SW
42AgongdianKaohsiung City38 km (24 mi)SW
43FengshanKaohsiung City20 km (12 mi)SW
44DianbaoKaohsiung City32 km (20 mi)SW
45GaopingKaohsiung City, Pingtung County171 km (106 mi)SW
46QishanKaohsiung City, Pingtung County117 km (73 mi)SW
47AiliaoKaohsiung City, Pingtung County69 km (43 mi)SW
48LaonongKaohsiung City136 km (85 mi)SW
49ZhuokouKaohsiung City50 km (31 mi)SW
50DonggangPingtung County47 km (29 mi)South, S
51LinbianPingtung County42 km (26 mi)S
52BeinanTaitung County84 km (52 mi)East, E
53XiuguluanHualien County81 km (50 mi)E
54FuyuanHualien County28 km (17 mi)E
55FengpingHualien County37 km (23 mi)E
56LekulekuHualien County54 km (34 mi)E
57HualianHualien County57 km (35 mi)E
58MukuaHualien County42 km (26 mi)E
59ShoufengHualien County37 km (23 mi)E
60WanliHualien County53 km (33 mi)E

References

  1. Swinhoe, R. The ornithology of Formosa, or Taiwan. Ibis 1863, 5, 250–311. [Google Scholar] [CrossRef]
  2. Zwart, M.C.; Baker, A.; McGowan, P.J.; Whittingham, M.J. The use of automated bioacoustic recorders to replace human wildlife surveys: An example using nightjars. PLoS ONE 2014, 9, e102770. [Google Scholar] [CrossRef]
  3. Camacho, C.; Palacios, S.; Sáez, P.; Sánchez, S.; Potti, J. Human-induced changes in landscape configuration influence individual movement routines: Lessons from a versatile, highly mobile species. PLoS ONE 2014, 9, e104974. [Google Scholar] [CrossRef]
  4. Ganpule, P. Roosting behaviour of Franklin’s Nightjar Caprimulgus affinis. Indian BIRDS 2010, 6, 92–94. [Google Scholar]
  5. MacKinnon, J.; Phillipps, K. A Field Guide to the Birds of China; Oxford University Press: Oxford, UK, 2000; p. 127. [Google Scholar]
  6. Myers, S. Birds of Borneo, 2nd ed.; Bloomsbury: London, UK, 2012; p. 168. [Google Scholar]
  7. Myers, S. Wildlife of Southeast Asia; Princeton University Press: Princeton, NJ, USA, 2016; p. 78. [Google Scholar]
  8. Sharps, K.; Henderson, I.; Conway, G.; Armour-Chelu, N.; Dolman, P.M. Home-range size and habitat use of European Nightjars Caprimulgus europaeus nesting in a complex plantation-forest landscape. Ibis 2015, 157, 260–272. [Google Scholar] [CrossRef]
  9. Lowe, A.; Rogers, A.; Durrant, K. Effect of human disturbance on long-term habitat use and breeding success of the European Nightjar, Caprimulgus europaeus. Avian Conserv. Ecol. 2014, 9. [Google Scholar] [CrossRef]
  10. Brigham, R.M.; Debus, S.J.; Geiser, F. Cavity selection for roosting, and roosting ecology of forest-dwelling Australian Owlet-nightjars (Aegotheles cristatus). Aust. J. Ecol. 1998, 23, 424–429. [Google Scholar] [CrossRef]
  11. Vilella, F.J.; Zwank, P.J. Geographic Distribution and Abundance of the Puerto Rican Nightjar (Distribución Geográfica y Abundancia del Guabairo Pequeño de Puerto Rico (Caprimulgus noctitherus). J. Field Ornithol. 1993, 223–238. [Google Scholar]
  12. Langston, R.; Liley, D.; Murison, G.; Woodfield, E.; Clarke, R. What effects do walkers and dogs have on the distribution and productivity of breeding European Nightjar Caprimulgus europaeus? Ibis 2007, 149, 27–36. [Google Scholar] [CrossRef]
  13. Delannoy, C.A. First nesting records of the Puerto Rican Nightjar and Antillean Nighthawk in a montane forest of western Puerto Rico. J. Field Ornithol. 2005, 76, 271–273. [Google Scholar] [CrossRef]
  14. Manegold, A. First evidence for a nightjar (Caprimulgidae Aves) in the early Pliocene of Langebaanweg, South Africa. Palaeobiodivers. Palaeoenviron. 2010, 90, 163–168. [Google Scholar] [CrossRef]
  15. Brigham, R.M.; Körtner, G.; Maddocks, T.A.; Geiser, F. Seasonal use of torpor by free-ranging Australian owlet-nightjars (Aegotheles cristatus). Physiol. Biochem. Zool. 2000, 73, 613–620. [Google Scholar] [CrossRef] [PubMed]
  16. Doucette, L.I.; Brigham, R.M.; Pavey, C.R.; Geiser, F. Roost type influences torpor use by Australian owlet-nightjars. Naturwissenschaften 2011, 98, 845. [Google Scholar] [CrossRef]
  17. Harvey, W.G. Caprimulgus affinis as an urban species in Indonesia. Bull. Br. Ornithol. Club 1976, 96, 122–123. [Google Scholar]
  18. Hayes, W.K.; Bracey, E.D.; Price, M.R.; Robinette, V.; Gren, E.; Stahala, C. Population Status of Chuck-will’s-widow (Caprimulgus carolinensis) in the Bahamas. Wilson J. Ornithol. 2010, 122, 381–384. [Google Scholar] [CrossRef]
  19. Ashdown, R.A.; McKechnie, A.E. Environmental correlates of Freckled Nightjar (Caprimulgus tristigma) activity in a seasonal, subtropical habitat. J. Ornithol. 2008, 149, 615–619. [Google Scholar] [CrossRef]
  20. Clay, R.P.; López-Lanús, B.; Tobias, J.A.; Lowen, J.C.; Mazar Barnett, J. The display of the White-winged Nightjar. J. Field Ornithol. 2000, 71, 619–626. [Google Scholar] [CrossRef]
  21. Pratt, T.K. Evidence for a previously unrecognized species of Owlet-nightjar. Auk 2000, 117, 1–11. [Google Scholar] [CrossRef]
  22. Jiguet, F.; Williamson, T. Estimating local population size of the European Nightjar Caprimulgus europaeus using territory capture–recapture models. Bird Study 2010, 57, 509–514. [Google Scholar] [CrossRef]
  23. Perrins, C.; Crick, H. Influence of lunar cycle on laying dates of European Nightjars (Caprimulgus europaeus). Auk 1996, 113, 705–708. [Google Scholar] [CrossRef]
  24. Wichmann, G. Habitat use of nightjar (Caprimulgus europaeus) in an Austrian pine forest. J. Ornithol. 2004, 145, 69–73. [Google Scholar] [CrossRef]
  25. Fang, W.-T.; Cheng, B.-Y.; Shih, S.-S.; Chou, J.-Y.; Otte, M.L. Modeling driving forces of avian diversity in a spatial configuration surrounded by farm ponds. Paddy Water Environ. 2016, 14, 185–197. [Google Scholar] [CrossRef]
  26. Jonsson, M.; Strasevicius, D.; Malmqvist, B. Influences of river regulation and environmental variables on upland bird assemblage in northern Sweden. Ecol. Res. 2012, 27, 945–954. [Google Scholar] [CrossRef]
  27. Chiu, M.-C.; Kuo, M.-H.; Sun, Y.-H.; Hong, S.-Y.; Kuo, H.-C. Effects of flooding on avian top-predators and their invertebrate prey in a monsoonal Taiwan stream. Freshw. Biol. 2008, 53, 1335–1344. [Google Scholar] [CrossRef]
  28. Royan, A.; Hannah, D.M.; Reynolds, S.M.; Noble, D.G.; Sadler, J.P. Avian community responses to variability in river hydrology. PLoS ONE 2013, 8, e83221. [Google Scholar] [CrossRef] [PubMed]
  29. Mann, H.B. Nonparametric tests against trend. Econom. J. Econom. Soc. 1945, 13, 245–259. [Google Scholar] [CrossRef]
  30. Kendall, M. Rank Correlation Methods, 4th ed.; Charles Griffin: London, UK, 1975. [Google Scholar]
  31. Deutsch, C.V.; Journel, A.G. GSLIB: Geostatistical Software Library and User’s Guide. Hauptbd, 2nd ed.; Oxford University Press: New York, NY, USA, 1992; 340p. [Google Scholar]
  32. Hengl, T.; Heuvelink, G.B.; Rossiter, D.G. About regression-kriging: From equations to case studies. Comput. Geosci. 2007, 33, 1301–1315. [Google Scholar] [CrossRef]
  33. Lin, Y.-P.; Cheng, B.-Y.; Chu, H.-J.; Chang, T.-K.; Yu, H.-L. Assessing how heavy metal pollution and human activity are related by using logistic regression and kriging methods. Geoderma 2011, 163, 275–282. [Google Scholar] [CrossRef]
  34. Lin, Y.-P.; Cheng, B.-Y.; Shyu, G.-S.; Chang, T.-K. Combining a finite mixture distribution model with indicator kriging to delineate and map the spatial patterns of soil heavy metal pollution in Chunghua County, Central Taiwan. Environ. Pollut. 2010, 158, 235–244. [Google Scholar] [CrossRef]
  35. Lin, Y.-P.; Chang, C.-R.; Chu, H.-J.; Cheng, B.-Y. Identifying the spatial mixture distribution of bird diversity across urban and suburban areas in the metropolis: A case study in Taipei Basin of Taiwan. Landsc. Urb. Plan. 2011, 102, 156–163. [Google Scholar] [CrossRef]
  36. Hirsch, R.M.; Slack, J.R.; Smith, R.A. Techniques of trend analysis for monthly water quality data. Water Resour. Res. 1982, 18, 107–121. [Google Scholar] [CrossRef]
  37. Cheng, B.-Y.; Liu, T.-C.; Shyu, G.-S.; Chang, T.-K.; Fang, W.-T. Analysis of trends in water quality: Constructed wetlands in metropolitan Taipei. Water Sci. Technol. 2011, 64, 2143–2150. [Google Scholar] [CrossRef] [PubMed]
  38. Wang, F.; Taipei Times. Chen Chu Calls for Increased Campus Security. Available online: http://www.taipeitimes.com/News/taiwan/archives/2010/06/01/2003474390 (accessed on 1 June 2010).
  39. Brazil, M. Birds of East Asia: China, Taiwan, Korea, Japan, and Russia; Princeton University Press: Princeton, NJ, USA, 2009; p. 270. [Google Scholar]
  40. Maa, T.-C.; Kuo, J.-S. Catalogue and bibliography of ticks and mites on vertebrates in Taiwan. Quart. J. Taiwan Mus. 1966, 19, 373–413. [Google Scholar]
  41. Hsu, F.-H.; Yao, C.-T.; Lin, S.R.-S.; Yang, C.-C.; Lai, S.-J. Avian species composition and distribution along elevation gradient in the Southern Taiwan. Endem. Species Res. 2004, 6, 41–66. [Google Scholar]
  42. Chen, C.-H.; Den, W. The value of green belts in urban sprawl: A case study of Taichung city, Taiwan. Int. J. GEOMATE 2017, 12, 147–152. [Google Scholar] [CrossRef]
  43. Jathar, G.; Anpat, S.; Bhangare, B.; Patil, D.J. Unusual congregation of Savaana nightjar, Caprimulgus affinis in a wheat field. J. Bombay Nat. Hist. Soc. 2014, 111, 138. [Google Scholar] [CrossRef]
  44. Chavan, S.P.; Jondhale, S.; Walke, D.; Jadhav, P. Habitat for camouflage is priority in preference besides harsh physical conditions in three species of Nightjar (Aves: Caprimulgiformes). Int. J. Fauna Biolog. Stud. 2017, 4, 5–10. [Google Scholar]
Figure 1. (a) Study area and location of Caprimulgus affinis sightings; (b) C. affinis sightings superimposed on human density values.
Sustainability 11 01778 g001
Figure 2. Probability of C. affinis sightings. (a) First situational category and (b) Second situational category.
Sustainability 11 01778 g002
Figure 3. Estimation of the probability of C. affinis sighting distribution using regression kriging.
Sustainability 11 01778 g003
Figure 4. Receiver operating characteristic (ROC) curve. (a) Indicator kriging (IK)—first situational category and (b) regression kriging (RK).
Sustainability 11 01778 g004
Figure 5. Distribution of the τ value, which shows the upper probability of C. affinis sightings in 1999–2014.
Sustainability 11 01778 g005
Figure 6. (a) τ map of the probability of C. affinis sightings and (b) p map of the probability of C. affinis sightings.
Sustainability 11 01778 g006
Table 1. Variables used in the logistic regression (LR).
InterceptStandard ErrorWald bDegrees of FreedomSig. cExponentiation of the Intercept (B) Coefficient
Urban population0.0030.0015.4610.019 *1.003
Coastal proximity (the distance to the nearest ocean coast)0.0690.01422.3510.000 ***1.071
City elevation−0.0050.0028.0810.004 **0.995
Distance to a main river location a------
Distance to an upstream river location0.0000.00012.9510.000 ***1.000
Constant−2.6770.50627.9310.0000.069
a The main river distance parameter was non-significant and was not included in the LR equation. b,c This is the Wald chi-square that tests the null hypothesis that the constant equals zero. This hypothesis is rejected because the p value (listed in the column called “Sig.”) is smaller than the critical p value of 0.05 (or 0.01, or 0.001). Hence, we conclude that the constant is not zero. * p < 0.05, ** p < 0.01, *** p < 0.001.
Table 2. Indicator variogram models for C. affinis sightings.
Model TypeC0C0 + CRangeR2C/C0 + CRSS
First situational categoryExponential0.00630.204610,8000.9070.9694.7E–4
Second situational categoryExponential0.01160.023394,5000.7590.5024.4E–4
RSS: Residual sum of square; C0: Nugget. In the early development of geostatistics, the term ‘nugget effect’ was coined for the apparent discontinuity at the beginning of many semi-variogram graphs; C0 + C (sill): The value at which the model first flattens out; C/C0 + C is the nugget coefficient.

