Article

Visualizing Sustainability of Selective Mountain Farming Systems from Far-eastern Himalayas to Support Decision Making

1
Kunming Institute of Botany, Chinese Academy of Sciences, Kunming 650201, China
2
International Centre for Integrated Mountain Development (ICIMOD), Lalitpur 44700, GPO Box 3226, Nepal
3
University of Chinese Academy of Sciences, Beijing 100049, China
4
Department of Viticulture and Enology, California State University, Fresno 93740, CA, USA
5
The Mountain Institute India (TMI), Gangtok 737101, Sikkim, India
6
College of Natural Resources, Royal University of Bhutan, Lobesa 14001, P.O Wangdu, Bhutan
7
North Eastern Region Community Resource Management Project, Shillong, Meghalaya 793001, India
8
Yunnan Institute of Environmental Sciences, Kunming 650034, China
9
Sustainable Development Forum Nagaland, Kohima, Nagaland 797001, India
10
Department of Plant Breeding, Physiology and Ecology, Yezin Agricultural University, Nay Pyi Taw 15013, Myanmar
11
Centre for Development and Environment, Department of Integrative Geography, University of Bern, 3012 Bern, Switzerland
*
Author to whom correspondence should be addressed.
Sustainability 2019, 11(6), 1714; https://doi.org/10.3390/su11061714
Submission received: 18 February 2019 / Revised: 11 March 2019 / Accepted: 14 March 2019 / Published: 21 March 2019
(This article belongs to the Section Sustainable Agriculture)

Abstract

:
Mountain farming systems rely on both empirical and academic knowledge. Their sustainability depends on how effectively diverse knowledge is used for solution-oriented decision making. For mountains, decisions must be conducive to rural farmers whose livelihoods depend on agriculture and related activities. Adopting transdisciplinary research approach, we define a composite Sustainability Space indicator that will help decision makers better understand the ingredients for sustainability, and formulate policy and management decisions to reinforce on-the-ground sustainability. Sustainability Space was derived through analysis of the positive and negative impact factors co-defined by community and disciplinary experts, and visualized through a radar diagram. We used Principal Component Analysis to understand relationships between factors. The results on Sustainability Spaces for eight cases of farming systems from the far-Eastern Himalayas indicated that the sustainability of farming systems is strengthened if decisions holistically cater to (i) geophysical pre-requisites, (ii) ecological foundations, (iii) integrated processes and practices, (iv) resources, knowledge, and value systems, (v) stakeholders’ development and economic aspirations, (vi) well-being of farming communities, and (vii) government support mechanisms. More equitable the attention to these seven components, the higher the sustainability of farming systems in this region could be.

1. Introduction

Mountain farming systems are socio-ecologically dynamic. They are land spaces that define and direct people’s aspirations, interests, and motivations [1], and are oriented by the ways people manage diverse resources and implement management practices within their respective socio-cultural and economic value systems [2]. For more than 70% of the rural population in the hills and mountains of South Asia, these land spaces represent not only a cultivated space, but a way of life, their knowledge system, and their means of livelihoods [3]. However, Mountain farming systems are transforming [4,5,6,7] with influence from constantly evolving global discourses on poverty reduction, natural resources management, biodiversity conservation, climate change, green revolution, sustainable intensification, globalization, and trade liberalization; along with a wide range of thematic disciplines concerning forest, soil, water, biodiversity, economics, and politics—all directing their functional pathway [7].
The sustainability context for agricultural systems picked up momentum as discourses on conservation, ecosystem services, food security, nutrient security, resilience, and climate adaptation pitched up in the global agenda [8]. Additionally, sustainability of agricultural systems was regarded as critical in the context of its “multi-functionality, changing knowledge paradigm, and social aspirations and influence from drivers of change whose future intensity and impacts remain unpredictable” [9]. Sustainability, while it needs to consider current context of being more socio-culturally equitable, environmentally sound, and economically viable [10], also has to factor in the concept of being more resilient and performing in the future [11]. There have been concerns about sustainability assessments or sustainability oriented knowledge not adequately guiding farming communities manage their farms, and other stakeholders make relevant research, management, and policy decisions [12,13]. We attempt to particularly fill this gap of appropriate knowledge interpretation and visualization of on-the-ground farms situations and farmers knowledge for decisions makers.
In this paper, we emphasize on co-defining indicators for sustainability based on the interactions between researchers who want to generate assessment-based knowledge on sustainability and other actors who make various research, management, and policy decisions at different scales [14]. We considered the key essence of transdisciplinary research [13,15] to evaluate sustainability through wider stakeholders’ engagement, and make sustainability research results comprehensible and applicable to key stakeholders—particularly farming communities and policy makers. We used a composite indicator—referred here as Sustainability Space to translate farm performances into a measure for sustainability that policy makers can refer to—to facilitate appropriate management and policy decisions for sustainability. Exploring the Sustainability Spaces of selective farming systems from the far-Eastern Himalayan countries, allowed us to also understand the interplay of interdisciplinary factors affecting sustainability.

2. Materials and Methods

The steps in the following sections were deemed essential to define indicators that would legitimize actionable knowledge generated by communities at the local scale, and then enable decision makers relate to these in the form of broader-level decisions—ultimately aligned to address sustainability issues on the ground.

2.1. Co-defining Impact Factors

A preliminary survey was conducted in December 2016, using two sets of open-ended questions: (i) What three factors positively influence farming systems or make it better? Additionally, (ii) what three factors negatively influence farming systems or deteriorate it?—to capture factors influencing sustainability. We approached two tiers of experts: (i) Farmers and the local and traditional institutions who bring empirical and traditional knowledge were considered as Community experts, and (ii) academia, government decision makers, and stakeholders belonging to business, regional, and international firms who bring thematic discourse-based knowledge and policy decisions were considered as disciplinary experts. Disciplinary experts were reached through online survey (www.limesurvey.com) and community experts through village level key informant interviews. This exercise was crucial because wider the stakeholders’ diversity in thematic knowledge (for disciplinary experts) and experiences with agricultural systems (for community experts) more comprehensive are the inputs to the impact factors. Literature also emphasizes using multidimensional indicators [16,17]. We collated responses from 100 disciplinary experts and 50 community experts and organized their responses into a set of 21 Positive Impact Factors (PIFs) and 16 Negative Impact Factors (NIFs) relating them to the three pillars of sustainability and other cross cutting pre-requisites, as shown in Table 1. Since the intention was to enumerate factors that stakeholders regarded as important for sustainability, the factors were not weighted or ranked, and all were assumed to be valid and of equal importance as they reflected experts’ individual values and knowledge.

2.2. Categorizing PIFs and NIFs into Components of Composite Indicators

To provide decision makers and administrators an analytical overview of the sustainability of different farming systems and highlight areas where government interventions needed to be focused, a composite indicator referred to here as Sustainability Space was developed. It comprises seven sustainability space components—Space Organization (SO), Resource Efficiency (RE), Integrated Approach (IA), Adaptive Features (AF), Economic Prospect (EP), Social Well-being (SW), and External Support (ES). These seven components were drawn to collectively answer questions related to key issues in agricultural systems development: what land use decisions were necessary? [18]; what interdisciplinary actions were necessary? [19]; what builds and ensures adaptive features and resilience? [20]; what agribusiness infrastructure and services were necessary for economic viability? [21]; what societal infrastructure and knowledge base were important? [22]; and what government supports and services were necessary? [23]. These questions also reflected upon the logic experts’ survey responses were sorted into. A multi-criteria influence exercise was carried out with 15 disciplinary experts to determine how each PIF and NIF could be related to these seven sustainability space components (Appendix A). This exercise led us to categorize the PIFs and NIFs into respective sustainability space components (Figure 1).

2.3. Defining Farm-Performance Indicators

The objective was to bring out a balanced set of indicators [24] that could depict farm sustainability performance—that is their strengths and challenges with respect to the PIFs and NIFs as these would either enhance or hinder sustainability. Thus, a set of 74 farm performance indicators were defined within the PIFs (Table 2). These were distilled from the community experts’ survey responses on positive factors affecting sustainability. Community knowledge have been considered dynamic [25], and are valuable to reorient modern agriculture towards a more sustainable and resilient development pathway [26]. Framing of Sustainability Space building upon the farm-level determinants was thus to underscore role of primary stakeholders or the mountain farming communities in maintaining their respective farming systems; and to acknowledge their experience-based knowledge. Disaggregation of PIFs was necessary to make farmers’ day-to-day work-related indicators more explicit to them and to increase their awareness about interdisciplinary factors positively affecting their farms. The intention was to place a set of performance indicators that community experts could relate to and use them to analyze their farm condition in the present, and in the future. NIFs were not disaggregated further as they adequately captured on-the-ground challenges indicated by the surveyed community experts. The 74 farm performance indicators within PIFs and 16 NIFs used in this research for community-based exercise are by no means complete. Survey with wider farming communities in different areas could refine them further.

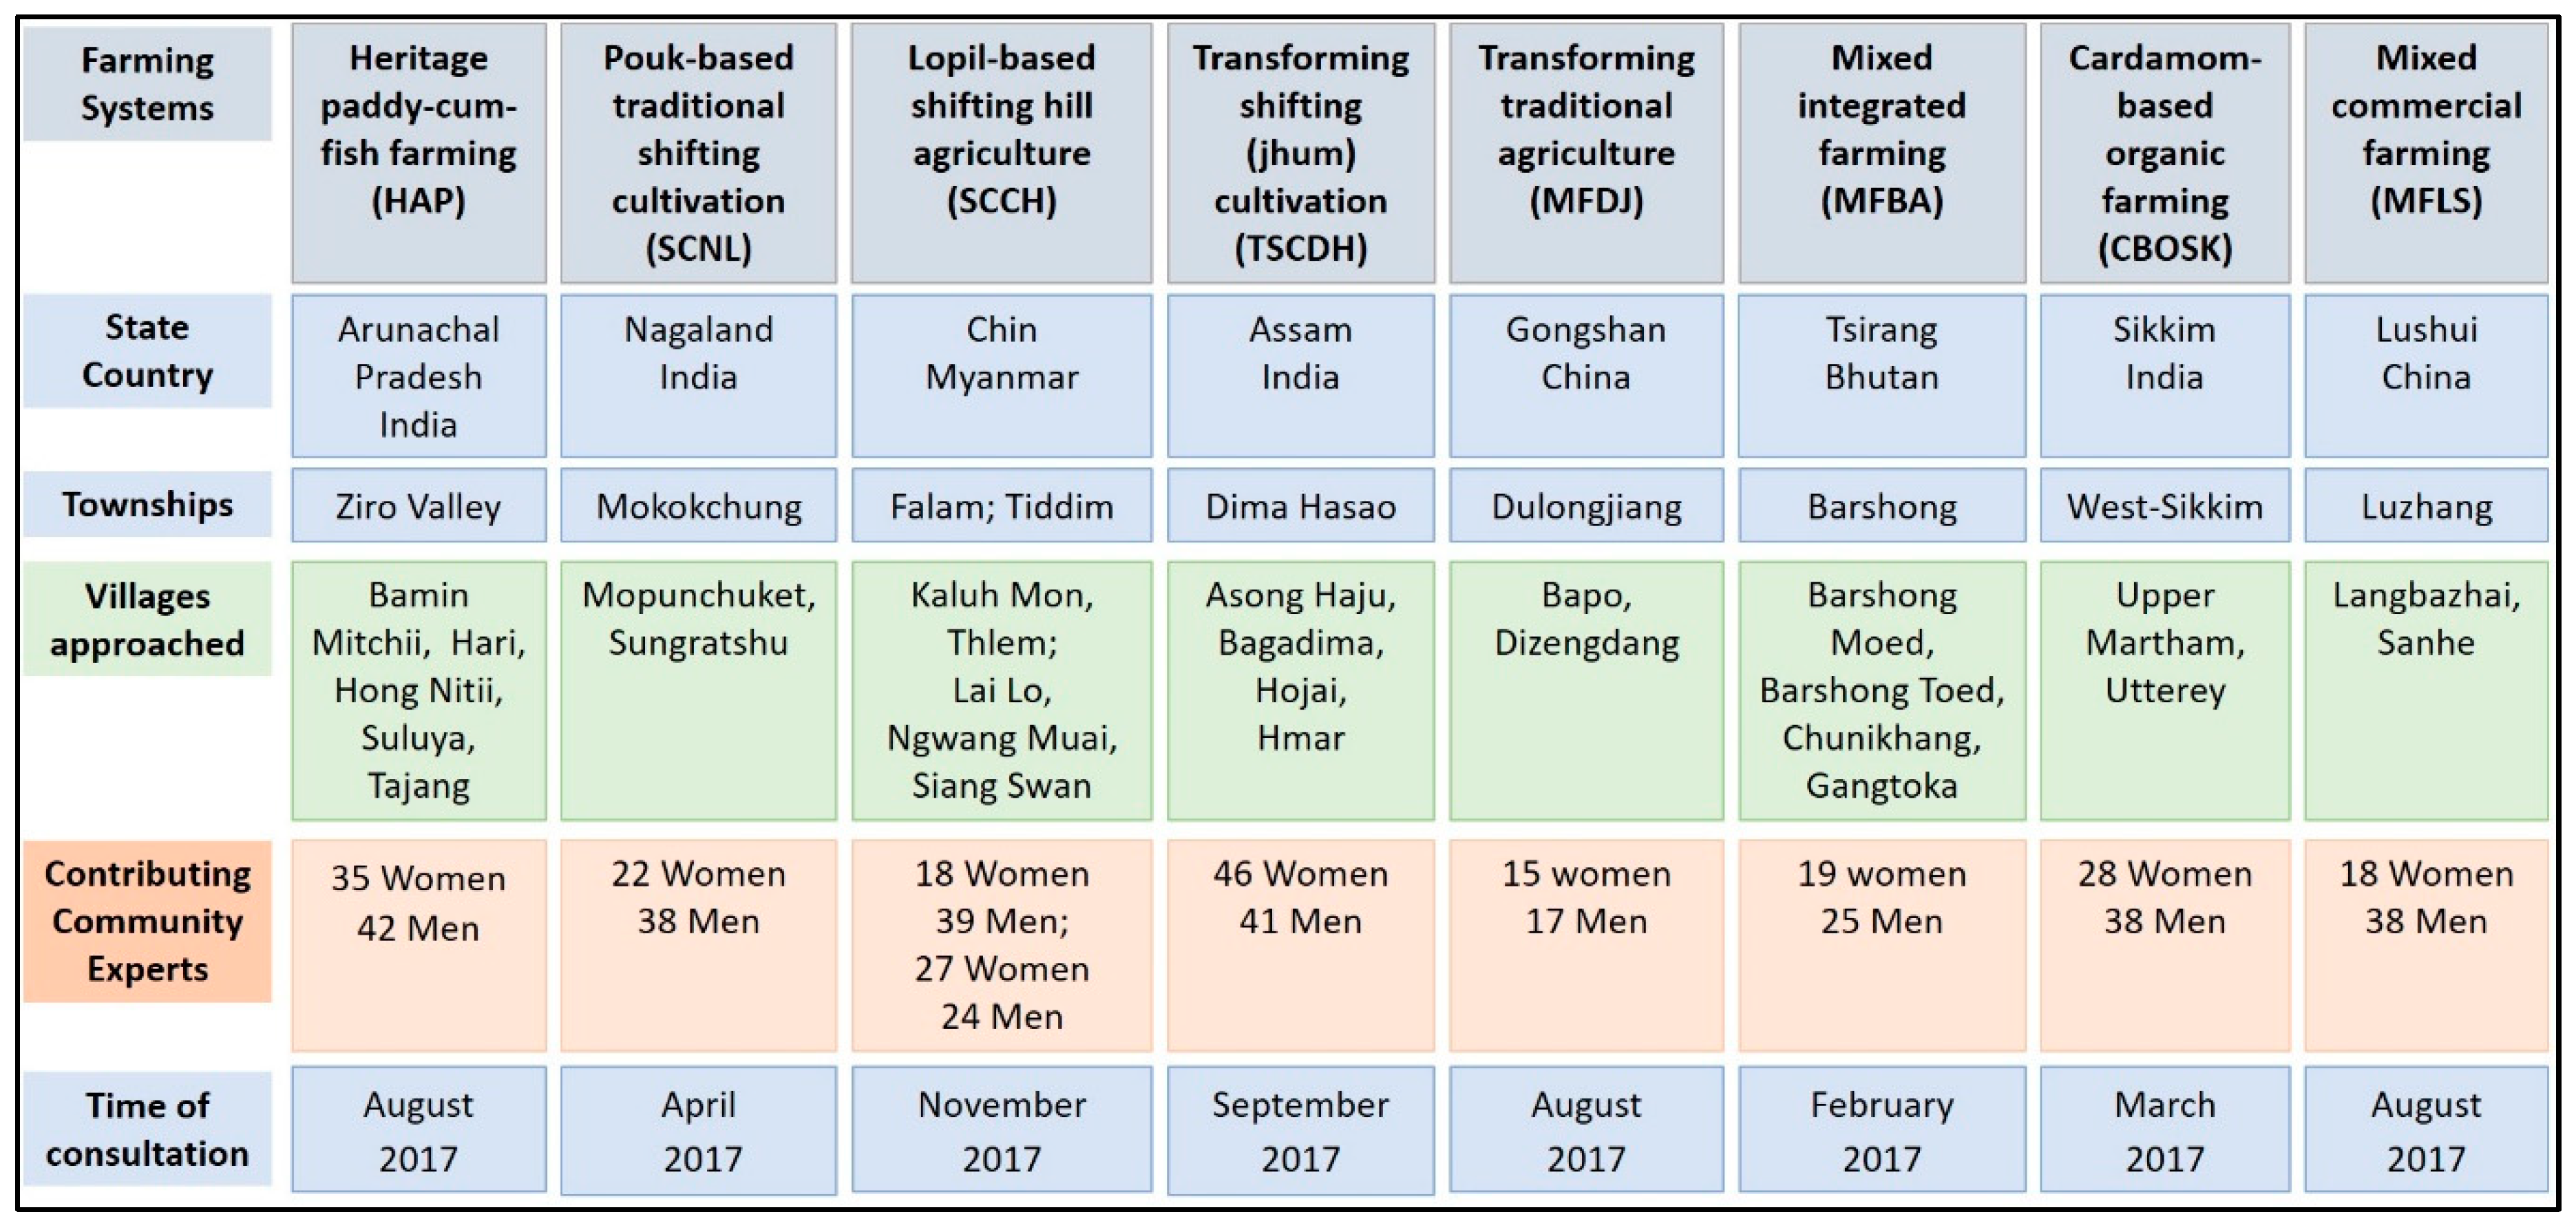
2.4. Selecting Sites for Assessing Sustainability

Eight types of farming systems were selected in four countries in the far-eastern Himalayas (Figure 2). The intent was to include at least one representative sample of a farming system within the traditional-commercial spectrum. The selection process also considered access to the field site; availability of financial resources; availability of country leads to facilitate community-based exercises; and time for both community and disciplinary experts.

2.5. Participatory Exercises in Different Sites to Define Sustainability Space

A cross-section of farming community members (women group, mixed group, elderly group, younger farmers group, local governing bodies and traditional institutions) totaling 530 community experts from 26 villages (Figure 2) were engaged in the participatory ranking exercise. Community groups were formed by the village heads in respective villages. Community members in a group were asked to discuss and provide scores between 5 and 1 on each of the 75 PIFs and 16 NIFs indicators where 5 indicated best and 1 indicated unsatisfactory current condition for PIF. For NIFs, 5 indicated critical and 1 milder condition. For each site, the scores for all PIFs and NIFs indicators within each of the sustainability space component were summed up and converted to percentile score. The final performance score for each sustainability space component was derived by subtracting the total NIFs score from total PIFs score. The scores for each type of farming system were then graphically (MS Excel) plotted to develop radial charts. The assumption was that more balanced or bigger the circumference of the space, higher the system’s sustainability. The balanced condition represented that all seven components were given adequate attention and had good current conditions. Greater circumference indicated that all PIFs and NIFs within the seven sustainability space components were proficiently managed—PIFs were sustained and NIFs were addressed. Since sustainability spaces were built using all PIFs and NIFs, interdisciplinary strengths of farm performance indicators were not diluted or compromised while constructing seven sustainability space components—thus, the sustainability space composite indicator.

2.6. Principal Component Analysis

Principal component analysis (PCA) was used to extract commonalities between the: (i) Farming system sites and sustainability spaces, (ii) farming system sites and Sustainability Space Components, (iii) farming systems sites and PIFs and, and (iv) farming system sites and NIFs. The analysis was conducted using SPSS v. 25. Prior to conducting the PCA, the data were tested for suitability using Kaiser-Meyer-Olklin (KMO) and Bartlett’s Test of Sphericity. The extracted components were rotated using Oblimin with Kaiser Normalization to obtain the significant components. Eigen values of greater than 1.0 were used to reduce the number of variables and Scree plots were used to identify the number of components that best described the variables. Bi-plots were used to make result visualization easier for the decision makers. We opted for PCA because it is one of the most commonly used methods of reducing the dimensionality of data sets as those collected in this study. This is the oldest method used for large data sets, that allows for increasing the interpretability of relationships between variable, while minimizing information loss [27]. We regarded that other methods such as correspondence analysis and canonical correlation analysis are only loosely connected to PCA as they are based on factorial decompositions of certain matrices, although they share a common approach with PCA. Therefore, we concluded that PCA fit our purpose of analyzing our data set to enable decision makers interpret relationships between the interdisciplinary factors in our study.

3. Results and Discussions

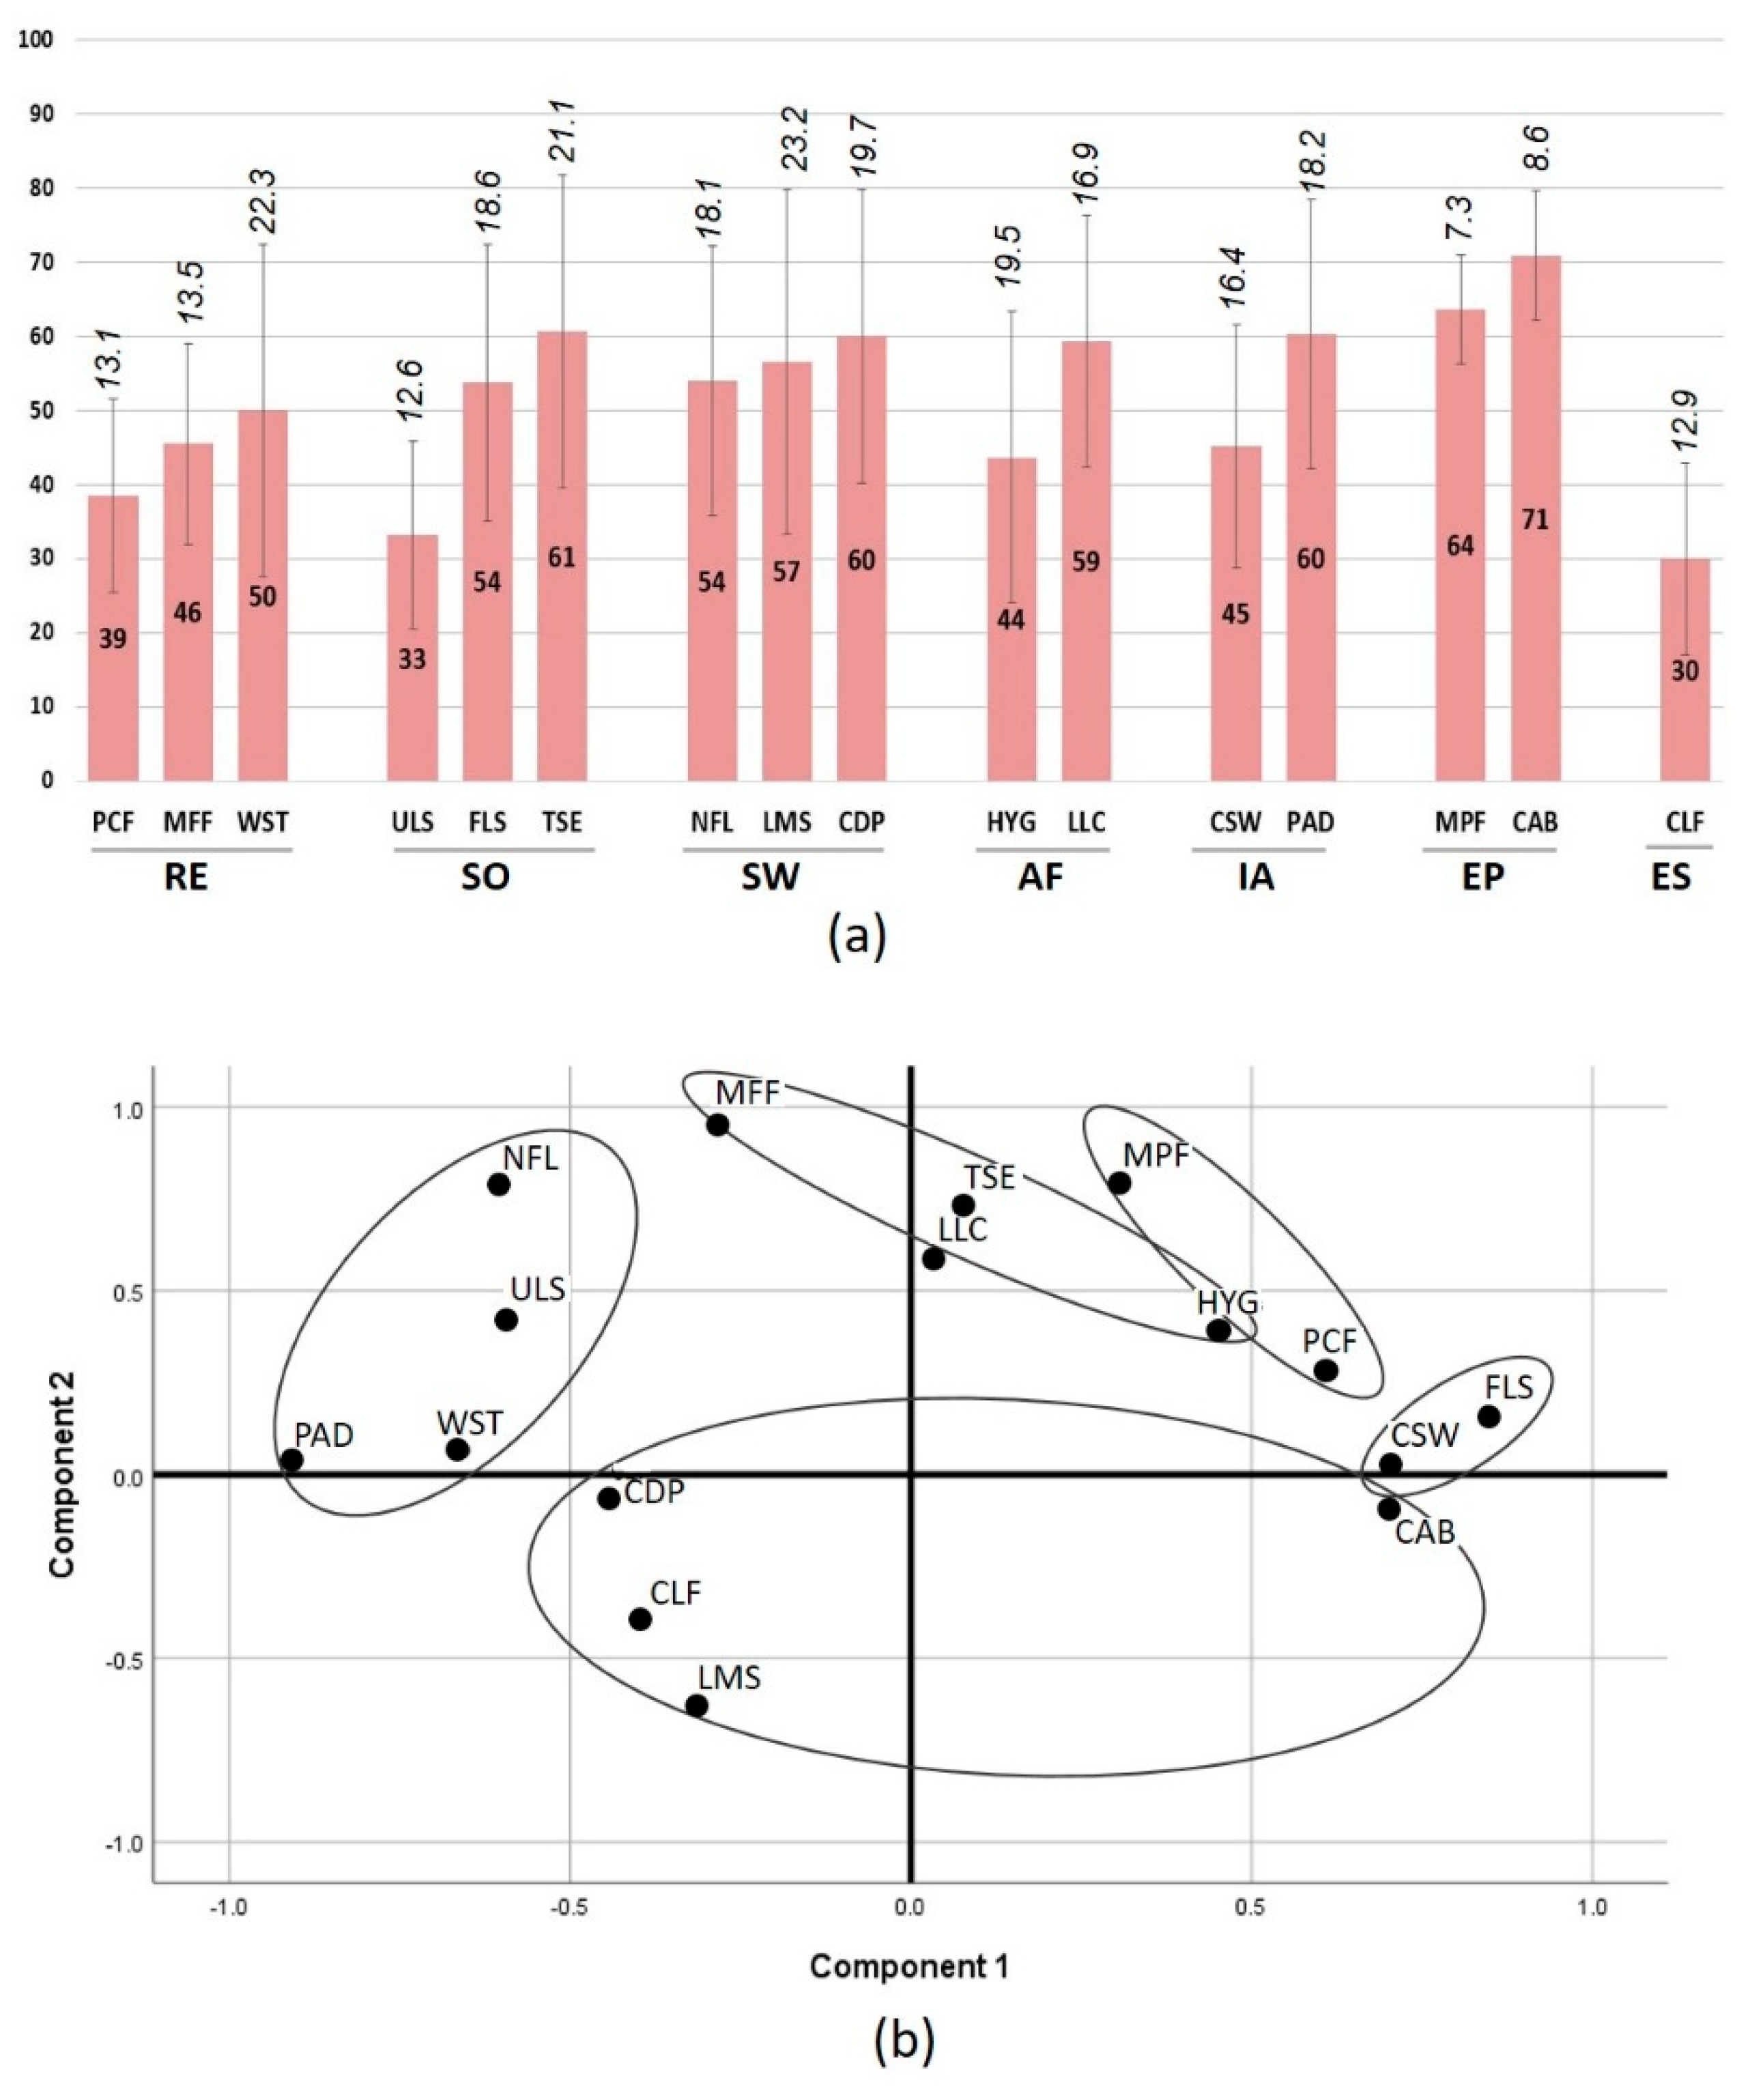
3.1. Sustainability Spaces of Different Farming Systems

The sustainability spaces as visualized through a radar diagram (Figure 3) indicated the extent of balance that currently existed among the seven sustainability components in the different farming systems studied. More uniform or bigger radial space points to a greater sustainability as it meant holistic interventions and comparatively balanced attention to the seven sustainability space components. Altogether, the sustainability spaces reflected the extent of the use of physical spaces; use of ecological and socioeconomic resources; acknowledgement, use, and promotion of local and traditional value systems; prospects for livelihoods and economic development; application of integrated farming processes and strategies; and extent of government support mechanisms.
Considering the cumulative scores of all seven sustainability components, it was noted that the Apatani heritage paddy-cum-fish farming of Ziro Valley (Figure 3a) and integrated mixed farming system of Bhutan (Figure 3f) had greater potential for sustainability with bigger and balanced radial spaces. This implied to balanced attention to all seven sustainability space components. Comparatively, the Lopil-based shifting hill agriculture of Chin Hills (Figure 3c) had uneven and smaller radial spaces, indicating lesser attention to Economic Prospects, External Support, Integrated Approach, and Social Wellbeing components. Looking at the PCA bi-plot (Figure 4), the clustering of the Traditional Shifting Cultivation of Nagaland (SCNL) and Transforming System of Dima Hasao (TSCDH) indicated that these two farming systems were similar in sustainability space scores. Likewise, the Lopil-based shifting hill agriculture (SCCH), Sikkim Organic Farming (CBOSK), and Apatani Community heritage paddy-cum-fish farming (HAP) clustered together indicating similarities between these farming systems. The Mixed Commercial farming in Lushui (MFLS) loaded more on PC1 than on PC2 and shared lesser similarities with the other systems. The farming system in Dulongjiang (MFDJ), although loaded more on PC2, showed similarity to MFDJ—both being market oriented cultivation systems complemented through ‘Grain for Green’ programme [28]. The Mixed Farming of Barshong (MFBA) loaded heavily on PC2 and seemed to differ from the rest of the farming systems.
The loadings of SCNL and TSCDH in close proximity could be justified if we consider External Support (ES) component of sustainability space where communities expressed concerns on government support to conservation of traditional landraces and germ plasm, including support to organic farming. They also indicated lesser support in promoting low cost soil water management and weather technologies and climate information. Likewise, farming systems such as CBOSK, HAP, SCCH, SCNL, and TSCDH grouped together in terms of their stronger positive correlation with sustainability space components relating to Social Well-being, Space Organization, Resource Efficiency, and Adaptive Features. These farms have eco-agricultural orientations that generates both conservation and production co-benefits and enhances production-dependent livelihoods [29]. These farming systems were perceived to be also efficient in terms of RE and AF with better situation for crop/livestock germplasm conservation including equitable access and resource sharing mechanisms, and indigenous land management practices and techniques. These farming systems also share similarities in their judicious utilization of limited land spaces into various types of production spaces [30,31]. The two cases from China—MFDJ and MFLS—had more of a commercial orientation with higher inclination towards the use of hybrid species and chemical fertilizers, and market-oriented crops—therefore lesser scores for AF and RE.

3.2. General Characteristic of Mountain Farming Systems in Terms of Seven Sustainability Space Components

We extrapolated general characteristic of mountain agricultural systems (Figure 5a) from the average scores of sustainability spaces of the eight types of mountain farming systems, supplemented by a PCA bi-plot (Figure 5b) using seven sustainability space components as variables. In this case, as per the scree plot, the variability was best explained with three principal components, thus PC1 and PC2 explained only 50.2% of the variability in the data. This exercise was mainly to highlight current strength and limitations of farming systems in the mountains, so that policy and management decisions can become more mountain specific.
From Figure 5a, it is evident that:
(i) Mountain farming systems are resource-efficient (RE: 68%) with the local communities managing their resources efficiently, making the most of the locally available resources, and recycling elements between the farm and other land uses [32];
(ii) Mountain farming communities make the best use of the land spaces available to them (SO: 62%) that entails making the land ownership and tenure situation as efficient as possible, demarcating areas for various purposes such as community forests, conserved areas, plantation, private forests, upland terrace, terraced fields, sloping lands, wet paddy fields, home gardens, orchards, settlements, and village areas [33];
(iii) Farming communities are custodians of site-specific cultural values and social norms, and their motivations are indispensable for sustainably shaping mountain agriculture. Often regarded as family farming, mountain agriculture co-evolves with the aspirations and well-being of the farming families and community they are part of (SW: 58%);
(iv) Mountain farming systems maintain a subsistence orientation and rely on the use of microclimate-driven habitats, resulting in high agro-biodiversity, which provide the farming system with greater adaptive capacity and resilience (AF: 57%). Diversity, alongside the richness of knowledge and practices and the engagement of communities, keeps them vibrant and dynamic;
(v) Mountain communities integrate an extensive set of actions (IA: 52%) such as managing forests, managing water for farm and home, building fodder resources for livestock, dealing with pests and diseases, maintaining soil nutrients, exploring cash crops and markets, promoting food crops and commodities during traditional ceremonies and festivals, building institutions and networks, and setting up collective norms and benefit-sharing mechanisms;
(vi) More than money, farmers often seek an effective rural Research and Development program that is relevant to them, fulfills their basic development needs, and addresses local-level challenges (ES: 49%). They need to add value to what is already being well-managed by the farming communities; and
(vii) While mountain farming has a subsistence orientation, it is a major source of livelihoods for rural farming communities. The prospects for agribusiness and income opportunities from mountain agriculture are minimally explored, including systematic support mechanisms at the organizational levels, such as cooperatives and small-scale industry developments (EP: 37%).
From the PCA bi-plot (Figure 5b) correlations among the components AF and RE (PC1 loading) with ES and EP stands true with the characteristic of mountain agriculture where lesser the economic and support outreach, the higher the tendency to rely on diversity and channelization of local resources [34]. In heritage and traditional faming systems such as HAP and SCNL, communities have long maintained their farmlands using an integrated landscape management approach by making optimal use of available local resources, also maintaining a very high diversity of agrobiodiversity making use of also wild edibles from the forests and crop relatives in the wild [31]. Additionally, They have elements of sustained soil quality maintained using rotations of crops, compost and organic manures, conservation of natural resources for long term services provisions from farmland, resilient and diverse production systems, social equity and healthy environment to sustain people, families, and communities [35]. It is evident that farming systems with greater Social Well-being (SW) and Space Organization (SO)scores- loading heavily on PC1, have higher sustainability potential, as it means greater engagement of farming communities, in terms of their motivation and affinity toward managing the systems [36]. Their engagement is crucial in strengthening the effective use of land spaces and the maintenance of agro-biodiversity resources and wider ecosystem services [37].

3.3. Positive Impact Factors Enhacing Farm Sustainability

The cumulative performance of PIFs from across eight farming cases (Figure 6a) indicated that community perceptions towards current condition of most of the PIFs were good except for 3 PIFs with below average score—Use of Interdisciplinary knowledge (UIK:48%), Research and Programmatic Support (RPS: 46%), and Agricultural Entrepreneurship infrastructure (ENI: 45%). The overall scores for all three PIFs related to External Support (ES) from the government- Agriculture extension services (AES: 53%), Policy and technological infrastructure (PTS: 52%), and Research and Development programme and schemes (RDS: 46%) were the lowest compared to other PIFs.
Principal Component Analysis of the PIFs showed that PC1 and PC2 explained only 57.6% of the variability in the data. The scree plot indicated that the variability was best explained with five principal components. The factors ENI, FNI and AES loaded positively on PC2, while RDI and ABD on PC3, CIF on PC4, and ETI and ING on PC5. However, for ease in explaining the variables rotated in space, only PC1 and PC2 were considered and presented in a bi-plot (Figure 6b). The variables that shared common perceptions are circled and discussed.
Management of Local Resource (MLR: 83%) and Habitat Connectivity and Network (HCN: 82%) were among the most proficient and well-maintained PIF. Stronger correlation between HCN and MLR both loading strongly on PC1 related to better condition and extent of adjoining forests and wetlands, and ecological connectivity between farm land and non-farm spaces; better availability of food, fodder, water through-out the year; and effective channelization of inputs into farming systems from adjoining forests and wetlands. Although with differential PC loading, MLR corresponded strongly with Agrobiodiveristy (ABD: 76%) in terms of the use of various production habitats for growing diversity of crop resources. However, the extent of Agrobiodiversity (ABD) varied across different farming systems (Figure 6a).
Land tenure and ownerships (LTO: 75%) was perceived to be weaker in terms of the extent of land used for growing traditional crop species, especially farming systems that are commercially oriented. These perceptions justified the correlation between LTO and Social Equity and Cohesion (SEC: 78%)—both loading negatively on PC2. Social Equity and Cohesion stood for extent of celebration of festivals, extent of community institutions and network, interest and motivation among community towards agriculture and importance of local cuisine and culture—therefore stronger connect to the traditional farming land spaces. In the case of sites from China, the traditional upland farms were under ‘Grain for Green’ scheme [28], therefore no longer into traditional hill farming; traditional crops were mostly replaced by high-yielding hybrid species. The farming spaces in the newer settlement areas were also mostly occupied by collectively marketed commercial crops. Such transformation also influenced the extent of ABD.
Engagement of traditional institutions (ETI: 81%) reflected on availability of in-kind support within community, organization of labor force and extent of transfer of knowledge from elder to younger generations, across all farming systems. Majority of the community within their respective farming system still relied upon support from each other for farming activities, with elder generation still leading and guiding the farm activities. These feature strengthened both PIFs related to LTO and SEC. Community experts regarded that wherever there were inclinations or positive scores for economic orientation in farm management, there were lesser regard to opinions of or engagement of traditional institutions- this justified the negative correlation between PIFs related to Economic Prospects (EP)—Enterprise infrastructure (ENI), Financial infrastructure and process (FNI) with ETI (Figure 6b).
Perceptions on Community interest in developing farm resources (CIF: 73%) varied across the farming systems. In the traditional farming systems community agreed on having high interest in developing local crop varieties, while in the commercially driven farming systems, scores for this indicator were low—thus showing greater correlation with LTO, ETI, and SEC—all loaded negatively on PC1.
For all farming systems, the PIFs under Economic Prospects (EP)—Enterprise infrastructure (ENI: 45%), Market infrastructure and connect (MKI: 50%), and Financial infrastructure and process (FNI: 53%) had lowest scores. Communities in general perceived that the farming systems in the mountains are not adequately equipped to enhance the economic objectives. Market connect and infrastructure was considered better in Sikkim, India, but very unsatisfactory in Chin Hills in Myanmar, where community perceived lesser promotion of local produce and it’s connect to wider market beyond the villages. These three factors MKI, FNI and ENI showed closer correlation with Use of Interdisciplinary Knowledge (UIK) indicating the need to apply diversified and integrated knowledge base related to value chain mechanisms, certification and branding, microenterprise development and linkages to wider markets and private sector partnerships for agribusiness.
The three factors —Ecosystem Services Management (ESM), UIK, and Inter-sectoral Coordination (ISC) within Integrated approach (IA) correlated positively with Policy and technological support (PTS)—all loading positively on PC1. This emphasizes the need to acknowledge traditional agro-ecosystem management practices and integrate wider sectorial knowledge, while developing policy and technological supports for mountain farms. The strong correlation between ESM and UIK is well justified in terms of communities indicating that effective use of local resources calls for use of both traditional and modern knowledge base. Likewise, close collaborations of different line department of governments and research institutions with the farming communities signifies stronger correlations between ISC and Research and Development Programmes and Schemes (RPS) and between ISC and PTS. Community experts provided higher score on ISC where government research and development programs were more integrated and prompted community engagement.
Considering PIFs under Social Well-Being (SW)—Access to development facilities (ADF: 72%), and Inclusive growth (ING)—loaded strongly on PC1 reflected importance of access to basic health, local market, and market information facilities. Strengthening these factors would play an important role in mitigating farm challenges related to out-migration and farm abandonment [38]. Likewise, PIFs under Adaptive Features (AF)—Agrobiodiversity, Community Skills and Practices, and Risk Mitigation Mechanism (RMM)—all loading positively on PC2 highlight PIFs that help mountain farming community’s deal with issues on crop-livestock loss, market failure, and crop depredation.

3.4. Negative Impact Factors Enhacing Farm Sustainability

The cumulative performance of NIFs from across eight farming cases (Figure 7a) indicated inadequate capacities in agribusiness (CAB: 71%) as the most crucial factor followed by market price fluctuation (MPF: 64%) of crops and farm commodities, Top soil erosion (TSE: 61%) and extent of pest and diseases (PAD: 60%). The least challenging factors were conflict with forest and other land uses (CLF: 30%) and extent of unused land due to labor shortage (ULS: 33%). In the cases of eastern Himalayan farms, this could be clearly observed in the field that most of the land was farmed, and that forests management received equal attention as the farmland.
Labor shortage was a moderate concern only in Barshong where farming communities were migrating to cities (MFF) for other non-farm jobs, especially the younger generation who preferred other technical professions. This perception also justified strong correlations between MFF and the increasing interest towards Non-Farm Livelihoods (NFL). Likewise, MFF also related well to the fluctuation of market price (MPF) for high value farm commodities- especially lesser return of investment and unavailability of fair price. Additionally, there was a noticeable trend of less interest among younger people in taking up agriculture as a profession, especially traditional farming.
PCA of the NIFs showed that PC1 and PC2 explained only 56% of the variability in the data. Similar to the PIFs, the scree plot indicated that the variability was best explained with five principal components. However, for ease in explaining the variables rotated in space, only PC1 and PC2 were considered and presented in a bi-plot (Figure 7b). The variables that shared common perceptions are circled and discussed. A strong correlation was evident between NIFs related to Adaptive Feature (AF)—HYG and LLC indicating a common perception across all farming systems that with the ingress of hybrid and improved varieties, local crop cultivars are less likely to be grown by the farming communities. Additionally, the challenge of injudicious use of pesticides and chemical fertilizers (PCF) is also closely connected. The negative correlation between PCF and pest and diseases infestation (PAD) reiterates the challenge of extensive use of chemicals to manage cultivation of market-oriented crop species, especially true to the transforming traditional agricultural systems.
Across all farming systems, inadequate capacities in relation to agribusiness were the most crucial (CAB: 71), this factor had strongest positive correlation with CSW or capacities related to sustainable soil, water management.
Top soil erosion (TSE), was considered a moderate challenge; however, the perceptions showed high variation between the communities. For example, this factor was less of a concern in Dima Hasao (low altitude farming), Sikkim (perennial crop-based farming), and Apatani (valley-based farming). However, top soil erosion was considered a huge challenge by communities in Nagaland, Chin Hills, and Lushui, where farming is done in comparatively steeper lands that easily erode, especially during monsoons. In Chin inadequate and improper road infrastructure cut off the villages during the monsoon and landslides often cause erosion.
The water stress (WST) was considered as a moderate challenge, but the variations were high between the farming systems. For example, Apatani, Lushui, and Dulongjiang farmers did not consider water stress as a challenge because water was available for domestic and farm use at all times. However, in Bhutan and Chin Hills, it was considered a challenge, because of limited drainage facilities, water channeling systems, and low-cost water saving technologies.
Thus, PAD, WST, ULS, NFL with strong loading on PC2 were factors reinforcing deviation of farm practices. The NIFs indicating conflict with other land use (CLF), Lack of motivation to farming community (LMS), capacity for agribusiness (CAB) and Crop Depredations (CDP) that loaded negatively on PC2 highlight the importance of government support in terms of meeting the needs of the farming community with regard to capacity building, acknowledgements of their contribution to maintaining agricultural systems in harmony with other natural land uses.

4. Conclusions

The Sustainability Space: A composite index to measure sustainability as elaborated in this paper enabled the conversion of farm specific sustainability performance into seven relevant themes for decision-making. It reaffirmed that sustainable agriculture development requires a more integrated, objective oriented approach [39] and that sustainability assessment results must be socially relevant for decision making—that is helping farming community’s reflect upon their knowledge and practices within the wider context of impact factors, and helping decision makers make better decisions. The decision imperatives making the mountain agricultural system more resilient in future lies on holistic strengthening of geophysical pre-requisites; ecological foundations; integrated processes and practices; resources, knowledge, and value systems; stakeholders’ development and economic aspirations; well-being of farming communities; and government support mechanisms. Visualization of on-the-ground sustainability with the help of seven sustainability space components defined through 21 PIFs and 16 NIFs prompts decision makers to give attention to:
(i) Minimizing external inputs to the systems and channelization of internal resources -human, social, ecological, and capacity;
(ii) Planning rural development infrastructures in a way that diversified mountain production land spaces that the communities use for the cultivation of diverse crops at different times are not compromised;
(iii) Considering well-being of farming communities in terms of their inclusive growth, access to basic development facilities, and societal harmony that gives continuity to communities interaction with their farmlands, evolving them further;
(iv) Strengthening communities’ skills and capacities through participatory and collaborative research approaches and co-learning mechanisms;
(v) Diversifying economic benefits from mountain farm products and strengthening agribusiness infrastructures and investments from a wider range of stakeholders;
(vi) Considering incentive mechanisms for farmers who grow local landraces and maintain in-situ farm genetic resources. It is necessary that the price of local produce incorporate the cost of maintaining the wider farm ecosystem services- the ecological, cultural and aesthetic services—adding to the benefits for the farming communities who maintain the system;
(vii) Strengthening organic orientation by appropriate government schemes and policies for soil nutrient management, water management, low cost technologies, as well as for promoting certified and branded mountain farm products; and
(viii) Supporting agrobiodiversity conservation-oriented policies considering in-situ conservation of mountain agro-resources and their relatives in the wild, including wild edibles, as well as ex-situ conservation infrastructure for conservation of agro-germ plasm. The future sustainability of mountain agriculture and food security will require access to a wider genetic resource base and the engagement of farming communities in the continual development of crop/ livestock germplasm.
Our primary intention behind this research was to enable solution-oriented mountain specific decision-making that brings balance among the seven interconnected sustainability space components—reinforcing holistic sustainability of mountain agricultural systems.

Author Contributions

Conceptualization, B.S.; methodology, B.S., Y.Y. and D.C.; validation, B.S., G.S., T.G., D.M., S.Y., A.J., S.W. and X.H.; formal analysis, B.S. and A.S.; investigation, B.S., G.S., T.G., D.M., S.Y., A.J., S.W. and X.H.; resources, B.S., Y.Y.; data curation, B.S.; writing—original draft preparation, B.S.; writing—review and editing, B.S., G.S., T.G., D.M., S.Y., A.J., S.W., X.H., A.S.; F.S.; visualization, B.S. and A.S.; supervision, B.S., A.S., Y.Y., D.C.; F.S.; project administration, B.S.; G.S., T.G., D.M., S.Y., A.J., S.W., X.H., and Y.Y.; funding acquisition, B.S. and Y.Y.

Funding

This research received no external funding.

Acknowledgments

We are grateful to all community and disciplinary experts in Bhutan, China, India and Myanmar who spared their time on the knowledge co-production process of this research. This paper is our effort to present the analysis of their knowledge in a way decision makers could understand and refer to. First author gratefully acknowledges the financial support from the Landscape Initiative for Far-eastern Himalayas (HI-LIFE) of International Centre for Integrated Mountain Development (ICIMOD) supported by the Governments of Sweden and Germany; and from University of Chinese Academy of Sciences (UCAS)/Kunming Institute of Botany (KIB) for field consultations in China. We would like to thank Dr David Molden and Dr. Eklabya Sharma from ICIMOD for this transdisciplinary research opportunity. We would also like to acknowledge Deependra Tandukar (for lime survey); and Yi Shaoliang, Sanjeev Bhuchar, Tashi Dorji, Uma Pratap (for preliminary discussions on indicators). Our special thanks to the three reviewers, and editors for their valuable and constructive inputs.

Conflicts of Interest

The authors declare no conflict of interest. The funders had no role in the design of the study; in the collection, analyses, or interpretation of data; in the writing of the manuscript, or in the decision to publish the results.

Appendix A. Categorization of PIFs and NIFs into Seven Sustainability Space Components

The disciplinary experts were asked to give score between 0–2. (0 = no influence; 1 = Indirect and weak influence; and 2 = Direct and strong influence) depending on how they thought each PIF/NIF influenced different sustainability space components. This was to explore which SSC was most strongly and directly affected by which PIFs or NIFs. Their opinion scores were plotted in excel to determine activeness of each impact factors. The sum of their responses for each sustainability space was converted into percentile value referred here as ‘activeness’ score for each PIF and NIF. Placement of PIFs/NIFs under different Sustainability Space Components were sorted by their activeness score (as highlighted) in the tables below: For example, the PIFs– Habitat Connectivity (HCN), Land tenure and Ownerships (LTO) and Rural Development Infrastructure (RDI) were categorized under Space Organization (SO) component.
PIFsSustainability Space Components
SOIAREAFEPSWES
Agrobiodiversity83.337083.331008063.3366.67
Ecosystem services management76.6796.6786.6783.3376.677073.33
Habitat Connectivity96.67608086.67605073.33
Management of local resources83.3366.671008076.6786.6750
Use of interdisciplinary knowledge701008066.677076.6766.67
Engagement of traditional institution73.336093.337056.6783.3333.33
Land tenure and ownerships10066.6773.3360707063.33
Rural development infrastructure100607056.6783.339066.67
Community motivation and interest76.678093.3376.6773.3386.6740
Intersectoral coordination66.6710083.335066.6756.6790
Farming community capacities, skills and practices708066.679063.3383.3350
Inclusive growth73.3360709076.6793.3363.33
Social equity and cohesion705083.3376.6763.3310050
Incentives and subsidies33.3366.675086.6773.338080
Agri-enterpreneurships63.3386.6766.6766.6710083.3380
Financial infrastructures and services507076.677010083.3370
Market infrastructure and services66.6773.3376.67701008080
Technological infrastructure and support63.338063.3376.677080100
Access to development facilities76.676083.338073.3310073.33
R&D programmes and schemes66.679076.6773.3366.6773.33100
Agriculture extension services63.3383.33507073.3376.6793.33
NIFsSustainability Space Components
SOIAREAFEPSWES
Extent of unused land due to labour shortage1007096.766.7808063.3
Conflict with forests and other land use86.78076.773.356.786.793.3
Floods and landslides10056.776.77063.376.763.3
Extent of pest and disease46.793.366.77086.776.746.7
Inadequate capacities to integrated soil/water management8096.7809066.793.373.3
loss of local cultivars and breeds66.76086.79046.78063.3
Use of pesticides and chemical fertilizers6063.393.353.386.763.366.7
Extent of migration of farming families86.75096.756.7909070
Use of hybrid and genetically improved crops6056.766.793.38063.383.3
Water stress709093.386.773.39066.7
Inadequate capacities to start agribusiness63.383.38066.710096.780
Market price fluctuation3056.783.366.710093.370
Interest towards off-farm livelihoods73.356.793.356.79096.766.7
Lack of motivation and support for farming communities66.773.39053.376.710053.3
Crop depredation46.77046.743.356.786.746.7
Top soil erosion and changing of soil structure9076.78083.37066.773.3

References

  1. Ramakrishnan, P.S. An integrated approach to land use management for conserving agroecosystem biodiversity in the context of global change. Int. J. Agric. Res. Gov. Ecol. 2000, 1, 56–67. [Google Scholar] [CrossRef]
  2. Pretty, J. Agricultural sustainability: Concepts, principles and evidence. Philos. Trans. R. Soc. B Biol. Sci. 2008, 363, 447–465. [Google Scholar] [CrossRef]
  3. Pratap, T. Mountain Agriculture, Marginal Lands, and Sustainable Livelihoods: Challenges and Opportunities. In Mountain Agriculture in the Hindu Kush-Himalayan Region; Ya, T., Tulachan, P., Eds.; ICIMOD: Kathmandu, Lalitpur, Nepal, 2003. [Google Scholar]
  4. Harwood, R.R. Sustainability in Agricultural Systems in Transition—At What Cost? America Society of Agronomy, Crop Science Society of America, Soil Science Society of America; World Bank: Baltimore, MD, USA, 1998. [Google Scholar]
  5. Hazell, P.; Poulton, C.; Wiggins, S.; Dorward, A. The Future of Small Farms: Trajectories and Policy Priorities. World Dev. 2010, 38, 1349–1361. [Google Scholar] [CrossRef]
  6. Jiao, X.; Mongol, N.; Zhang, F. The transformation of agriculture in China: Looking back and looking forward. J. Integr. Agric. 2018, 17, 755–764. [Google Scholar] [CrossRef]
  7. Sharma, H.R.; Chauhan, S.K. Agricultural Transformation in Trans Himalayan Region of Himachal Pradesh: Cropping Pattern, Technology Adoption and Emerging Challenges. Agric. Econ. Res. Rev. 2013, 26, 173–179. [Google Scholar]
  8. Rao, N.H.; Rogers, P.P. Assessment of agricultural sustainability. Curr. Sci. 2006, 91, 439–448. [Google Scholar]
  9. Food and Agriculture Organization of the United Nations (FAO). Why Invest in Sustainable Mountain Development? FAO: Roma, Italy, 2011. [Google Scholar]
  10. World Commission on Environment and Development (WCED). Our Common Future; WCED: Oxford, UK; New York, NY, USA, 1987.
  11. Stirling, A.; Leach, M.; Mehta, L.; Scoones, I.; Smith, A.; Stagl, S.; Thompson, J. Empowering Designs: Towards More Progressive Appraisal of Sustainability; STEPS Working Paper 3; STEPS Centre: Brighton, UK, 2007; pp. 1–72. [Google Scholar]
  12. Wuelser, G.; Pohl, C.; Hadorn, G.H. Structuring complexity for tailoring research contributions to sustainable development: A framework. Sustain. Sci. 2012, 7, 81–93. [Google Scholar] [CrossRef]
  13. Lang, D.J.; Wiek, A.; Bergmann, M.; Stauffacher, M.; Martens, P.; Moll, P.; Swilling, M.; Thomas, C.J. Transdisciplinary research in sustainability science: Practice, principles, and challenges. Sustain. Sci. 2012, 7, 25–43. [Google Scholar] [CrossRef]
  14. Schneider, F.; Bonriposi, M.; Graefe, O.; Herweg, K.; Homewood, C.; Huss, M.; Kauzlaric, M.; Liniger, H.; Rey, E.; Reynard, E.; et al. Assessing the sustainability of water governance systems: The sustainability wheel. J. Environ. Plan. Manag. 2015, 58, 1577–1600. [Google Scholar] [CrossRef]
  15. Schneider, F. Promising degrees of stakeholder interaction in research for sustainable development. Sustain. Sci. 2018, 13, 129–142. [Google Scholar] [CrossRef] [PubMed]
  16. Peano, C.; Tecco, N.; Dansero, E.; Girgenti, V.; Sottile, F. Evaluating the sustainability in complex agri-food systems: The SAEMETH framework. Sustainability 2015, 7, 6721–6741. [Google Scholar] [CrossRef]
  17. Hayati, D. A Literature Review on Frameworks and Methods for Measuring and Monitoring Sustainable Agriculture; Global Strategy Technical Report: Rome, Italy, 2017. [Google Scholar]
  18. Mottet, A.; Ladet, S.; Coqué, N.; Gibon, A. Agricultural land-use change and its drivers in mountain landscapes: A case study in the Pyrenees. Agric. Ecosyst. Environ. 2006, 114, 296–310. [Google Scholar] [CrossRef]
  19. Lélé, S.; Norgaard, R.B. Practicing Interdisciplinarity. Bioscience 2005, 55, 967. [Google Scholar] [CrossRef] [Green Version]
  20. Olsson, P.; Folke, C.; Berkes, F. Adaptive comanagement for building resilience in social-ecological systems. Environ. Manag. 2004, 34, 75–90. [Google Scholar] [CrossRef] [PubMed]
  21. Häni, F.; Braga, F.; Stämpfli, A.; Keller, T. RISE, a Tool for Holistic Sustainability Assessment at the Farm Level. Int. Food Agribus. Manag. Rev. 2003, 6, 78–90. [Google Scholar]
  22. Axelsson, R.; Angelstam, P.; Elbakidze, M.; Stryamets, N.; Johansson, K.-E. Sustainable Development and Sustainability: Landscape Approach as a Practical Interpretation of Principles and Implementation Concepts. J. Landsc. Ecol. 2011, 4, 5–30. [Google Scholar] [CrossRef] [Green Version]
  23. Moller, H.; Macleod, C.J. Design criteria for effective assessment of sustainability in New Zealand’s production landscapes. N. Z. Sustain. Dashboard Res. Rep. 2013, 13, 73. [Google Scholar]
  24. Bossel, H. Indicators for Sustainable Development: Theory, Method, Applications; Intl Institute for Sustainable: Winnipeg, ON, Canada, 1999; Volume 68. [Google Scholar]
  25. Segnon, A.C.; Achigan-Dako, E.G.; Gaoue, O.G.; Ahanchédé, A. Farmer’s knowledge and perception of diversified farming systems in sub-humid and semi-arid areas in Benin. Sustainability 2015, 7, 6573–6592. [Google Scholar] [CrossRef]
  26. Koohafkan, P.; Altieri, M.A.; Holt Gimenez, E. Green Agriculture: Foundations for biodiverse, resilient and productive agricultural systems. Int. J. Agric. Sustain. 2012, 10, 61–75. [Google Scholar] [CrossRef]
  27. Jolliffe, I.; Cadima, J. Principal component analysis: A review and recent developments. Philos. Trans. R. Soc. A Math. Phys. Eng. Sci. 2016, 374, 20150202. [Google Scholar] [CrossRef]
  28. Liu, C.; Wu, B. “Grain for Green Programme” in China: Policy Making and Implementation? Briefing series-Issue 60; University of Nottingham, China Policy Institute: Nottingham, UK, 2010; pp. 1–17. [Google Scholar]
  29. Scherr, S.J.; McNeely, J.A. Biodiversity conservation and agricultural sustainability: Towards a new paradigm of “ecoagriculture” landscapes. Philos. Trans. R. Soc. B Biol. Sci. 2008, 363, 477–494. [Google Scholar] [CrossRef]
  30. Sharma, G.; Rai, L.K. Climate Change and Sustainability of Agrodiversity in Traditional Farming of the Sikkim Himalaya. In Climate Change in Sikkim Patterns, Impacts and Initiatives; Information and Public Relations Department, Government of Sikkim: Gangtok, India, 2012; pp. 193–218. [Google Scholar]
  31. Dollo, M.; Samal, P.K.; Sundriyal, R.C.; Kumar, K. Environmentally Sustainable Traditional Natural Resource Management and Conservation in Ziro Valley, Arunachal Himalaya, India. J. Am. Sci. 2009, 5, 41–52. [Google Scholar]
  32. Bisht, I.S.; Mehta, P.S.; Bhandari, D.C. Traditional crop diversity and its conservation on-farm for sustainable agricultural production in Kumaon Himalaya of Uttaranchal State: A case study. Genet. Resour. Crop Evol. 2007, 54, 345–357. [Google Scholar] [CrossRef]
  33. Deb, S.; Lynrah, M.M.; Tiwari, B.K. Technological innovations in shifting agricultural practices by three tribal farming communities of Meghalaya, northeast India. Trop. Ecol. 2013, 54, 133–148. [Google Scholar]
  34. Cáceres, D.M.; Tapella, E.; Quétier, F.; Díaz, S. The social value of biodiversity and ecosystem services from the perspectives of different social actors. Ecol. Soc. 2015, 20, 62. [Google Scholar] [CrossRef]
  35. Kremen, C.; Iles, A.; Bacon, C. Diversified farming systems: An agroecological, systems-based alternative to modern industrial agriculture. Ecol. Soc. 2012, 17. [Google Scholar] [CrossRef]
  36. Jonas, A.; Vanclay, F.; Imperiale, A.J.; Vanclay, F. Sustainable Rural Development in Mountain Areas Using Social Impact Assessment to Strengthen Community Resilience in Sustainable Rural Development in Mountain Areas. Mt. Res. Dev. 2016, 36, 431–442. [Google Scholar] [CrossRef]
  37. Thies, E. Incentive Measures Appropriate to Enhance the Conservation and Sustainable Use of Agrobiodiversity; Deutsche Gesellschaft für Technische Zusammenarbeit (GTZ): Eschborn, Germany, 2000; p. 36. [Google Scholar]
  38. Satyal, P.; Shrestha, K.; Ojha, H.; Vira, B.; Adhikari, J. A new Himalayan crisis? Exploring transformative resilience pathways. Environ. Dev. 2017, 23, 47–56. [Google Scholar] [CrossRef] [Green Version]
  39. Nicholls, T.; Elouafi, I.; Borgemeister, C.; Campos-Arce, J.J.; Hermann, M.; Hoogendoorn, J.; Keatinge, J.D.H.; Kelemu, S.; Molden, D.J.; Roys, A. Transforming Rural Livelihoods and Landscapes: Sustainable Improvements to Incomes, Food Security and the Environment; White Paper; Association of International Research and Development Centers for Agriculture (AIRCA): Nairobi, Kenya, 2013. [Google Scholar]
Figure 1. Seven Sustainability space components with their corresponding decision logic and positive and negative impact factors.
Sustainability 11 01714 g001
Figure 2. Details of farming systems assessed in this study, including the extent of contributors.
Sustainability 11 01714 g002
Figure 3. Radar diagrams showing sustainability spaces of eight types of farming systems as per the scores of seven sustainability space components—SO = Space Organization; IA = Integrated Approach; RE = Resource Efficiency; AF = Adaptive Features; EP = Economic Prospect; SW = Social Well-being; and ES = External Support. Scores (%) reflect perception of community experts on how the current situation is for each sustainability space component.
Sustainability 11 01714 g003
Figure 4. A bi-plot showing placement of eight farming systems as per the PCA components loading with respect to sustainability space scores. HAP = Heritage-Apatani; SCNL = Traditional Pouk based shifting cultivation-Nagaland; SCCH = Traditional Lopil based hill agriculture-Chin; TSCDH = Transforming agroforestry-Dima Hasao; MFDJ = Transforming traditional-Dulongjiang; MFBA = Integrated mixed-Barshong; CBOSK = Cardamom based organic-Sikkim; and MFLS = Integrated commercial-Lushui. Farming systems within a circle are similar in characteristics. Component 1 reflecting more on features related to environmental, socio-cultural pillars, and geophysical prerequisites, whereas Component 2 more on government support and economic pillars.
Sustainability 11 01714 g004
Figure 5. (a) Cumulative scores of eight farming systems for seven sustainability space components. Values on the bars = mean and values with error bars = Standard Deviation indicating variations in responses among different farming systems; and (b) A bi-plot of the sustainability space components. Space components within a circle share similar response scores. RE = Resource Efficiency; SO = Space Organization; SW = Social Well-being; AF = Adaptive Feature; IA = Integrated Approach; EP = Economic Prospect; and ES = External Support.
Sustainability 11 01714 g005
Figure 6. (a) Comparative farm performance scores of eight types of farming systems against 21 PIFs within each of seven Sustainability Space Components; MLR = Management of local resources; ETI = Engagement of traditional institution; CIF = Community interest in developing farm resources; RDI = Rural development infrastructure; HCN = Habitat connectivity; LTO = Land tenure and ownership; ESM = Ecosystem service management; ISC = Inter sectoral coordination; UIK = Use of interdisciplinary knowledge; SCE = Social equity and cohesion; ADF = Access to development facilities; ING = Inclusive growth; ABD = Agrobiodiversity(ecosystems, species, gene); CSP = Capacities, skills and practices; RMM = Risk mitigation mechanisms; AES = Agriculture extension services; PTS = Policy and Technology infrastructure support; RPS- R&D programmes and schemes; FNI = Financial infrastructure and processes; MKI = Market infrastructures; and ENI = Agribusiness entrepreneurships Infrastructure. Values on the bars= mean and values with error bars = Standard Deviation indicating variations in responses among different farming systems; and (b) A bi-plot of the PIFs. PIFs within a circle share interesting response scores, thus discussed. Most PIFs load on Component 1.
Sustainability 11 01714 g006
Figure 7. (a) Comparative farm performance scores of eight types of farming systems against 16 NIFs within each of the seven sustainability space components; ULS = Extent of unused land due to labour shortage; FLS = Floods and landslides; TSE = Top soil erosion and changing of soil structure; PAD = Extent of pest and disease; CSW = Inadequate capacities to integrated soil/water management; PCF = Injudicious use of pesticides and chemical fertilizers; MFF = Extent of migration of farming families; WST = Water stress; HYG = Use of hybrid and genetically improved crops; LLC = Loss of local cultivars and breeds; CAB = Inadequate capacities to start agribusiness; MPF = Market price fluctuation; NFL = Interest towards off-farm livelihoods; CDP = Crop depredation; LMS = Lack of motivation and support for farming communities; and CLF = Conflict with forests and other land use. Values on the bars = mean and values with error bars = Standard Deviation indicating variations in responses among different farming systems; and (b) A bi-plot of the NIFs. NIFs within a circle share interesting response scores, thus discussed. Most NIFs load on Component 2.
Sustainability 11 01714 g007
Table 1. List of Positive Impact Factors (PIFs) and Negative Impact Factors (NIFs), their acronyms (as used for Principal Component Analysis), and the logic used to sort the survey responses.
LogicPIFs (= reinforces sustainability)NIFs (= hinders sustainability)
Environmental pillar1. Agrodiversity (ABD);
2. Habitat connectivity (HCN);
3. Ecosystem services maintenance (ESM)
1.Loss of local cultivars and breeds (LLC);
2. Pest and diseases (PAD);
3. Use of hybrids and genetically improved crops against local varieties (HYG)
Geo-physical prerequisites4. Land-tenure and Ownerships (LTO);
5. Rural Development Infrastructure (RDI);
6. Management of local resources (MLR)
4. Topsoil erosion and changing soil structure (TSE);
5. Water stress due to drought and dry spell (WST);
6.Floods and landslides (FLS)
Socio-cultural pillar7. Engagement of traditional institutions (ETI);
8. Use of interdisciplinary knowledge (UIK);
9. Capacities, skills and practices (CSP);
10. Social Equity and Cohesion (SEC)
7. Inadequate capacities for soil-water management (CSW);
8. Injudicious use of pesticides and chemical fertilizers (PCF)
Community well-being prerequisites 11. Inclusive growth (ING);
12. Community interest in developing farm resources (CIP);
13. Risk management mechanisms (RMM);
14. Access to development facilities (ADF)
9. Interest towards off-farm livelihoods-changing aspirations (NFL);
10. Crop depredation (CDP);
11. Unused land due to labour shortage (ULS);
12. Migration of farming families out of farming (MFF)
Economic pillar15. Agribusiness entrepreneurships (ENI);
16. Financial infrastructure (FNI);
17. Market infrastructure (MKI)
13. Inadequate capacities for agribusiness (CAB);
14. Market price fluctuations (MPF)
Government support 18. Intersectoral coordination (ISC);
19. Agriculture extension services (AES);
20. R&D Programmes and Schemes (RPS);
21. Policy and technological support (PTS)
15. Conflict in land-use policy (CLF);
16. Lack of conservation support for agrobiodiversity (LMS)
Table 2. The 74 farm level performance indicators used within each Positive Impact Factors (PIFs) for perception exercise with community experts.
21 PIFsFarm Performance Indicators
Agrodiversity (ABD) 1. Diversity of crop and livestock species;
2. Diversity of varieties, cultivars, and landraces;
3. Extent of local commodities and niche products
Habitat connectivity (HCN)4. Extent of nearby/adjoining forests;
5. Extent of nearby/adjoining wetlands;
6. Extent of use of a variety of production habitats;
7. Connectivity of farming land with other natural land use
Ecosystem services management (ESM)8. Soil nutrient management;
9. Carbon services management;
10. Water management;
11. Integrated pest management
Land-tenure and Ownerships (LTO)12. Land allocation per household;
13. Extent of land under traditional crop cultivation;
14. Extent of land under cash crop cultivation;
15. Compliance with other land uses
Rural Development Infrastructure (RDI)16. Road network and transportation facilities
Management of local resources (MLR)17. Availability of fodder throughout the year;
18. Availability of staple and nutritious food;
19. Availability of water for home and farm;
20. Dependence and use of locally available material;
21. Use of inputs from forests and wetlands
Engagement of traditional institutions (ETI)22. Availability of in-kind help and support within community;
23. Availability and organization of labour force;
24. Activeness of institutions to transfer knowledge from elder to younger generation
Use of interdisciplinary knowledge (UIK)25. Extent of use and application of low-cost technologies;
26. Trying of new generation crops from wild relatives
Capacities, skills and practices (CSP)27. Extent of use of traditional knowledge and practices;
28. Availability of modern knowledge and technical skills
Social Equity and Cohesion (SEC)29. Extent of festivals related to farming practices;
30. Extent of community institutions and network;
31. Importance of local culture and cuisine;
32. Interest, motivation towards agriculture and farming
Inclusive growth (ING)33. Good income and purchasing power;
34. Engagement of women in agribusiness;
35. Opportunity to engage and participate in farm management programmes;
36. Satisfaction over market price of farm produce
Community interest in developing farm resources (CIF)37. Interest towards growing local crop types/varieties;
38. Use and promotion of wild edibles;
39. Extent of investment by communities in agribusiness
Risk management mechanisms (RMM)40. Access to wider genetic resource base;
41. Crop/livestock Insurance and compensation mechanisms;
42. Effective post- harvest mechanisms for essential produce;
43. Access to forests/wetlands resources;
44. Provision of Community seed fair or Diversity seed fair;
45. Farmers network for seed exchange
Access to development facilities (ADF)46. Access to basic health, education, home, energy;
47. Access to local market for selling farm produce;
48. Access to market information
Agribusiness entrepreneurships (ENI) 49. Private sector support and engagement;
50. Large scale community participation for cash crop cultivation;
51. Partnerships with value chain actors;
52. Extent of microenterprise and small-scale industry
Financial infrastructure (FNI)53. Profitable return of investment from agriculture;
54. Access to finance;
55. Provision of cash income from agriculture;
56. Buy back mechanism and support
Market infrastructure (MKI)57. Demand for local niche products in the market;
58. Connect to international market and trade;
59. Certification for local niche products
Intersectoral coordination (ISC) 60. Research collaboration between farmers and research institutions;
61. Engagement of farming communities in forest management;
62. Maintenance of agriculture for heritage tourism;
63. Inclusive value chain mechanism and processes
Agriculture extension services (AES) 64. Information Technological support;
65. Support with uptake of technology;
66. Support for crop variety development in farmers field;
67. Extension services infrastructure and facility
R&D Programmes and Schemes (RPS)68. Extent of capacity strengthening programmes for farmers in integrated farm management;
69. Support for organic/eco-farming;
70. Ex-situ conservation support for traditional landraces and germplasm
Policy and technological support (PTS)71. Recognition of traditional knowledge and rights;
72. Promotion of agricultural system as a globally important agricultural heritage site;
73. Policy support from government;
74. Weather information support at local level.

