1. Introduction
The Shanghai Security Exchange and Shenzhen Security Exchange, two major stock markets in China, are closely connected, which exhibit certain similar features and face same external shocks. The relationship between stock market development and economic growth is a significant issue that is related to the sustainable economic development of an economy and financial markets, manifested in optimizing the allocation of resources. Researchers have clearly shown that a well-functioning stock market can effectively employ social funds and then allocate these funds to productive sectors with high efficiency. Stock markets promote financial markets development by spreading risks, thus improving resource allocation efficiency, supervising managers and utilizing corporate governance, and influencing the savings rate, which can reduce the cost of information and transactions, thus advancing sustainable economic growth. Moreover, for a long time, the random walk theory and Effective Market Hypothesis (EMH) maintain key theoretical cornerstones of mainstream financial theory. However, the EMH has been challenged by the real operations of the markets and related studies since the 1980s. The fractal market research has modified the basic hypothesis of the linear model, random walk, and normal distribution, on which the mainstream financial econometric theory is based. Furthermore, China’s stock market experienced abnormal fluctuations from June to August in 2015. In the case of the Shanghai Stock Exchange Composite Index (SSE Composite Index, SSE index), the index dropped from 5178.19 to 2850.71 in 53 trading days after two rounds of cliff-cut declines, representing a decline of more than 45%. The stock market crash has caused great shocks, which has a negative impact on China’s social stability and stable economic operation. Furthermore, the stock market crash also led to a large-scale drop-stop of individual stocks, the lack of stock market liquidity, huge losses investors being suffered, and less sustainability of economic growth. Under such circumstances, this paper studies the impacts of the stock crash on the dynamics and efficiency of China’s stock market.
When considering the complex nonlinear characteristics in the Chinese stock market [
1], this paper applies the theory and method of multifractal analysis to the study of price fluctuation in China’s stock market, and analyzes the price fluctuations of Chinese stock market from the nonlinear angle. The paper examines four main indices of Chinese stock markets, including Shanghai Stock Exchange Composite Index (SSE Composite Index, SSE), Shenzhen Stock Exchange Component Index (SZSE Component Index, SZSE), Shanghai Shenzhen 300 Index (SHSE-SZSE300), and CSI Smallcap 500 Index (CSI500). The indices of SSE, SZSE, and SHSE-SZSE300 are selected to study the characteristics of the main board, while SSE and SZSE are studied to reflect the fluctuations of stock prices of the Shanghai Stock Exchange and Shenzhen Stock Exchange, respectively. The SHSE-SZSE300, a cross-market index, is also studied, because it reflects the overall trend of Shanghai and Shenzhen Markets and the joint changes in stock prices in the two markets. The CSI500 comprehensively reflects the stock price of a group of small and medium-sized companies in China’s A-share market, which can be a supplement to research on the other three indices. Therefore, this research aims to investigate and compare the multifractality levels and dynamic evolutions of the daily return data of four major indices in China’s stock market throughout January 2000 to November 2018.
Literatures mainly focus on the multifractality of the mainboard market, but only a few studies have examined the impact of stock market crash on the stock market and its efficiency. Unlike previous studies, this paper applies empirical methodology to compare and study the dynamic evolution of multifractality of the series of daily return of the four main indices between January 2000 and November 2018. By comparing the multifractal properties of the four-index returns, we estimate the market efficiencies of the two main stock market in China, i.e., Shanghai stock market and Shenzhen stock market. Particularly, we explore the impacts of the 2015 stock market crash on the market dynamics and efficiency by dividing the sample into three sub-samples: before, during, and after the crash.
The four indices show multifractal characteristics with different degrees that are caused by the long-range correlation and the fat-tail distribution. The multifractal levels of the return series of the four indices exhibit different dynamic properties during different periods and the fluctuations of the multifractality of the indices are different. The 2015 stock crash had different effects on the dynamics and efficiency in different markets during different periods. The study is organized, as follows.
Section 2 proposes the MF-DFA methodology.
Section 3 introduces the data and model settings.
Section 4 presents empirical results.
Section 5 further discusses the results and corresponding explanations and
Section 7 concludes this paper.
2. Literature Review
An efficient market has been theoretically proven to be a vital component for effective and efficient resource allocation in an economy. The issue of market efficiency has attracted considerable attention in literatures. Researchers have studied the efficiencies of different markets with various methods or models. Rizvi et al. [
2] incorporated econophysics with Efficient Market Hypothesis (EMH) and then used Multi-fractal detrended fluctuation analysis (MF-DFA) to undertake a comparative analysis of Islamic and developed countries markets, providing a deeper understanding of the markets’ efficiency in Islamic countries particularly in crisis periods. Jiang et al. [
3] applied the method of DMA/DFA to study the efficiency of the West Texas Intermediate (WTI) crude oil futures prices, showing that the WTI oil futures market is a weak-form efficient market and that the research results can verify the hypothesis of the weak-form efficient market. Ntim et al. [
4] examined the weak-form efficiency of the global gold markets with a specific focus on the random walks (RWS) and martingale difference sequence (MDS) hypotheses. This research also examined the extent to which the predictability or non-predictability of global daily spot gold price return series behavior can be interpreted. This research showed that gold markets are not weak-form efficient, neither from the perspective of the strict RWS nor in the relaxed MDS sense in some countries, and that greater changes in economic fundamentals are related to lower levels of rejecting the RWS and MDS hypotheses. Gil-Alana et al. [
5] investigated financial market efficiency in the time series of four daily Baltic stock market indices, i.e., Baltic Benchmark Gross Index (OMXBBGI), all share index of Tallin-Lithuanian (OMXT), all share index of Riga (OMXR), and all share index of Vilnius (OMXV), based on historical data from 2000/01/01 to 2016/01/22. They used fractional integration methods to test the hypothesis of market efficiency and identified the bull and bear market phases from each of the time series. Applying the fractional integration approach, they found that the random walk hypothesis of market efficiency is overall rejected based on two bull and one bear sub-samples of the four Baltic stock indices. Ali et al. [
6] investigated the comparative efficiency of 12 Islamic and conventional stock markets counterparts by the method of multifractal detrended fluctuation analysis (MF-DFA), finding that the developed markets are relatively more efficient, followed by the BRICS’ stock markets through the full sample. The comparative efficiency analysis also showed that almost all of the stock markets that were explored in the workm excluding Russia, Jordan, and Pakistan, are more efficient than their conventional counterparts. Fan et al. [
7] investigated the efficiency of Chinese carbon market using the MF-DFA method, finding a lack of efficiency in the carbon markets under study. The study also showed that inefficiency is positively correlated with market activity in the short run, while negatively in the long run. Levich et al. [
8] developed an index of informational market inefficiency to study market efficiency. They demonstrated the usefulness of the index of the predictability of the forward exchange rates of currencies of emerging and developed economies from 1994 to 2016 to study how the efficiency of currency markets has evolved over this time. They found widespread evidence of excess-predictability, hence currency market inefficiency, in the early part of the sample period, and then at specific times, such as the recent global financial crisis.
The global economy has been complicated and volatile over the past decade. It has experienced certain economic or political events that may have great impacts on it. Some studies have focused on the relationships between the events and their impacts. Particularly, stock market crash can be one of the problems with the most impacts. Anagnostidis et al. [
9] empirically investigated the effect of the 2008 financial crisis on the weak-form efficiency of twelve Eurozone stock markets, showing that the crisis has adverse effects on stock market efficiency in most of the Eurozone stock markets, resulting in the emergence of significant mean-reverting patterns in stock price movements. Barro et al. [
10] studied the relationship between stock market crashes and macroeconomic depressions, indicating that, conditional on a crash, the probability of a minor depression is 31 percent and of a major depression is 10 percent. They also showed that the covariance between stock-returns and an asset-pricing factor accounts for the observed average (levered) equity premium of seven percent. Chauhan et al. [
11] investigated the role of stock liquidity as a governance mechanism to discipline managers for withholding such bad news as stock price crash-risk, finding that stock liquidity reduces the stock price crash-risk and that the threat of intervention and price informativeness can be two possible mechanisms through which stock liquidity decreases stock price crash-risk. Yeung et al. [
12] examined whether or not a Chinese firm’s ownership structure, audit quality, and board structure are associated with its future stock price crash risk, indicating that stronger ownership structure and higher audit quality are associated with lower stock price crash risk, and that the board structure is not significantly associated with stock price crash risk. Deng et al. [
13] examined the effect of mutual fund herding behaviors on stock price crashes to indicate that mutual fund herding is related to a poor information environment and low disclosure quality, and that mutual fund herding increases the stock price crash risk afterwards.
MF-DFA, together with multifractal spectrum analysis, is widely applied in market dynamics analysis. Especially, the MF-DFA model is a tool frequently used to explore the possible properties and internal structures of the Chinese stock market. Du et al. [
14] used MF-DFA to analyze the closing index fluctuations of the Shanghai stock market, finding that the Shanghai stock market has weak multifractal features and that the strengths of multifractal increase, the singular spectrums become rougher, and the general Hurst exponents decrease when the orders of partition function increase. Lu et al. [
15] empirically investigated the multifractal properties of the Chinese stock index futures market by the MF-DFA method and multifractal spectrum analysis, concluding that the Chinese stock index futures returns exhibit long-range correlations and multifractality. This research also showed that long-range correlations contribute more to the multifractality for the Chinese stock index futures market than the fat-tailed probability distributions. Wang et al. [
16] empirically investigated the Shanghai financial market based on the return series of the Shanghai Composite Index, Shanghai Bond Index, and Shanghai Fund Index. The research showed that the cross-correlations among the markets exhibit different fractal features at different time scales and that the correlation between the stock and fund markets is stronger than that of the other two groups. Zhu et al. [
17] applied MF-DFA to analyze the multifractal structure of the Chinese stock market in the CSI 800 index that consists of the CSI 500 index and CSI 300 index, finding that the fluctuation of the closing logarithmic returns have multifractal properties and that the shape and width of multifractal spectrum are dependent on the weighing order q. On the other hand, multifractal analysis is often used in other markets experiencing financial crisis or other events. Hasan et al. [
18] used the MF-DFA technique to investigate the multifractal structure of the U.S. and seven Asian stock markets during the crisis period, showing that the peaks of the singularity spectra shift to lower values of α and markets of the U.S., Japan, Hong Kong, Korea, and Indonesia exhibit increased long range correlations of large fluctuations in index returns and that the tail exponent increases across all markets.
However, these literatures have been concerned with the MF-DFA method and the events, like financial crisis only, and do not link the multifractality, market efficiency, and stock market crash together. Despite vast literatures on the Chinese stock market, existing studies rarely explore the effects of such events as the stock market crash on the efficiency of stock markets. Our work aims to achieve two major objectives. First, we apply MF-DFA to examine and compare the multifractality of return series of four main indices in the Chinese stock market. Second, we focus on the 2015 stock market crash in China’s stock market, which might have some effects on the stock return. The efficiency of stock markets is closely associated with their multifractal characteristics, which are usually investigated by Multifractal Detrended Fluctuation Analysis (MF-DFA).
3. Methodology
3.1. MF-DFA Formalism
The MF-DFA, as introduced by Kantelhardt et al. [
19], is a powerful tool for detecting and quantifying multifractal properties in the markets. MF-DFA method has been widely applied to analyze the complexity and dynamics of financial markets, such as foreign exchange markets [
20,
21], stock markets [
22,
23], crude oil markets [
24,
25], international capital flows [
26], etc. Multifractal characteristics of major financial variables reflect market inefficiency, because long-range correlation properties or fat-tail distributions of the market variable series often cause multifractality in markets [
27,
28]. According to Kantelhardt [
19], there are five major steps to conduct the generalized MF-DFA procedure. Suppose that
is a certain variable time series of length
N, we can implement the MF-DFA methodology through five successive steps.
Step1: Calculate the profile
.
where
Step 2: Divide the profile {y(k)} into non-overlapping segments. The segments have equal length, e.g., time scale s, and the total number of segments, therefore is Ns = int(N/s). Specially, the same procedure is repeated from the end of the sample in order to cover the whole sample, supposing that N is not a multiple of time scale s. 2Ns segments are obtained altogether after division twice in this way.
Step 3: Apply the OLS (Ordinary Least Square) method to fit the series data within each segment to obtain the local trend for each segment.
is the fitting polynomial in segment v.
where i = 1, 2, …, s; k = 1, 2, …
Here, we demonstrate the linear fitting polynomial. Actually, quadratic, cubic, or even higher order polynomials can be applied to fit the series if necessary. Currently, we use m as the order of the polynomial and m should not be too high in case it may over-fit the series. We can also select the optimal order m according to fitting results for a different m value.
Step 4: Calculate the qth order fluctuation function
Fq(
s) for the overall segments.
Repeat step 2 to 4 with different time scales s to compare the different fluctuation function Fq(s) with different order q.
Step 5: Analyze the log-log plots
versus s for different order q. If the series are long-range power-law correlated, for large values of s, the generalized Hurst exponent H(q) (Hurst, 1951) can be defined by:
The Hurst exponent and how fast local fluctuations grow with increasing scale s define the fractal structure of the time series. When the series has multifractal properties, e.g., the small and large fluctuations scale differently, we can obtain a significant dependence of H(q) on q by this method. Besides, H(q) describes the scaling behavior of the segments with large fluctuations for positive q and the scaling behavior of the segments with small fluctuations for negative q. On the other hand, when the series has monofractal properties, H(q) can be constant, despite different q values. Series with multifractal properties often come with comparatively smaller H(q) at positive q values. The range of H(q) shows the multifractality degree of the serial. Higher ΔH = qmin − qmax means stronger multifractal features.
Additionally, the scaling exponent
can be defined by:
Subsequently, the singularity strength
and the singularity spectrum
can be calculated through Legendre transform. The operations can be associated with the following equations:
Multifractal spectrum
is introduced to describe the fractal dimension of the ensemble formed by all of the points that share the same singularity exponent
. Fractal dimension
is shaped like a single-peaked bell. The multifractal spectrum width is defined by the difference between h(q)
max and h(q)
min, which represents the difference between the maximum probability and the minimum probability and it measures the multrifractality degree of the series. For this study, we follow Zunino et al. (2008) [
29] and set MD = h(q)
max − h(q)
min to quantify the multifractality level. Since the multifractal level is negatively correlated with market efficiency [
27,
28], the higher the MD value is, the less efficient the stock market could be.
3.2. Causes of Multifractality
Normally, there are two major possible causes of multifractality in the time series: long-range correlation for small and large fluctuations and the fat-tailed distribution of the series. The multifractality sources can be tested and identified by shuffling or phase-randomizing the original series and comparing their multifractal degrees between the testing series and the original series.
The correlation in original series is usually distorted by shuffling the series, but the original fluctuation distribution is still preserved. If long-range correlation is the only source of multifractality, the shuffled series will exhibit no multifractality. Subsequently, there are three steps of shuffling the series: (1) generate pairs (p, r) of random integer numbers, which satisfy p,r < N; (2) interchange entries p and r of the same series; and, (3) repeat step (1) and (2) for 20N times to make the ordering of original series fully shuffled.
By phase-randomization, the non-Gaussianity property of the series is weakened. When fat-tailed distribution is the only source for multifractality, the phase-randomized series should exhibit no multifractal characteristics. If both the shuffled series and the phase-randomized series have multifractal characteristcs, then we can conclude that the original series may have both long-range correlation and fat-tail properties. Accordingly, MF-DFA provides some mechanisms that can examine the existence of the multifractality of the series and trace its causes. According to Zhou [
28], there are three steps of phase- randomization: (1) apply discrete Fourier transform; (2) randomly select a phase angle; and, (3) employ inverse Fourier transform.
3.3. MF-DFA Model Settings
To use the MF-DFA, the first step is to configure the settings of this model. In this step, we should input the necessary parameters m, q, and scale for MF-DFA analysis. According to the methodology, we usually set the value of m between 1 and 3, when the smallest segment sizes contain 10–20 samples [
30]. Usually, the polynomial fitting order m of detrended values is 1, 2, 3. According to the study of Lashermes et al. [
31], in order to avoid over fitting and facilitate calculation, m = 1 is selected in this paper. After comparing the multifractal spectrum with different m values, we choose m = 1 in the MF-DFA model to prevent the overfitting of the polynomial trend. As far as the q value is concerned, Lashermes et al. [
31] suggested that the order value of q between −5 and 5 be suitable and sufficient in most cases. The selection of the order q value is based on experiences, and (−5, 5) takes 1 as the tolerance of arithmetical series. According to EA Ihlen [
30], the segmentation length of the sub-interval that is too long or too short is not appropriate. In this study, we choose 1/10 of the total sample size from 10 to 2 as the increment. The segmentation interval length is not larger than the sample capacity of 1/10. Ihlen [
30] and Kantelhardt et al. [
19] suggested that the minimum segment size for MF-DFA analysis should be larger than 10 and be significantly greater than the polynomial order m. Moreover, they suggested that the maximum segment size should not be greater than 1/10 of the sample size. In this study, we set 16 as the maximum segment size, 8 as the minimum segment size, and 10 as the total number of segment sizes in MF-DFA model.
4. Data
This paper uses the daily returns of four indices: SSE, SZSE, SHSE-SZSE300, and CSI500. The data source is the RESSET database (
www.resset.cn). The SSE Index and the SZSE Index that were selected in this paper reflect the quotations and trends of the Shanghai and Shenzhen markets, respectively, while the SHSE-SZSE300 index synthetically reflect the overall quotations and trends of the Shanghai and Shenzhen markets. Component stocks are mainstream stocks with good market representativeness, high liquidity, and active trading, which can reflect the return of mainstream investment in the Chinese stock market. The CSI500 Index that was selected in this paper reflects the return of investment and the overall quotations and trends of stocks of small and medium enterprises, which comprehensively embody the stock price performance of a group of small and medium enterprises in China’s A-share market.
Table 1 shows the sample.
Table 1 presents the descriptive statistics of the data. The skewness values in
Table 1 are all less than 0, thus indicating that the distributions of SSE, SZSE, SHSE-SZSE300, and CSI500 index return are featured by that the tail on the left is longer than the tail on the right, which makes the tail on the left side of the curve longer than that on the right. From
Table 1, we know that the kurtosis values of the four indices are all greater than 0, showing that the distributions of them are like a peak, steeper than the normal distribution. The kurtosis values of SSE, SZSE, and SHSE-SZSE300 are greater than 3, thus indicating that the distributions are fat-tailed and peaked with excessive kurtosis and extreme values, and that the distributions are bound to be steeper than the normal distribution. Thus, the indices can deviate from normal distribution, which indicates that the indices may exhibit multifractal properties that can be caused by non-Gaussian distribution like fat-tail properties [
19].
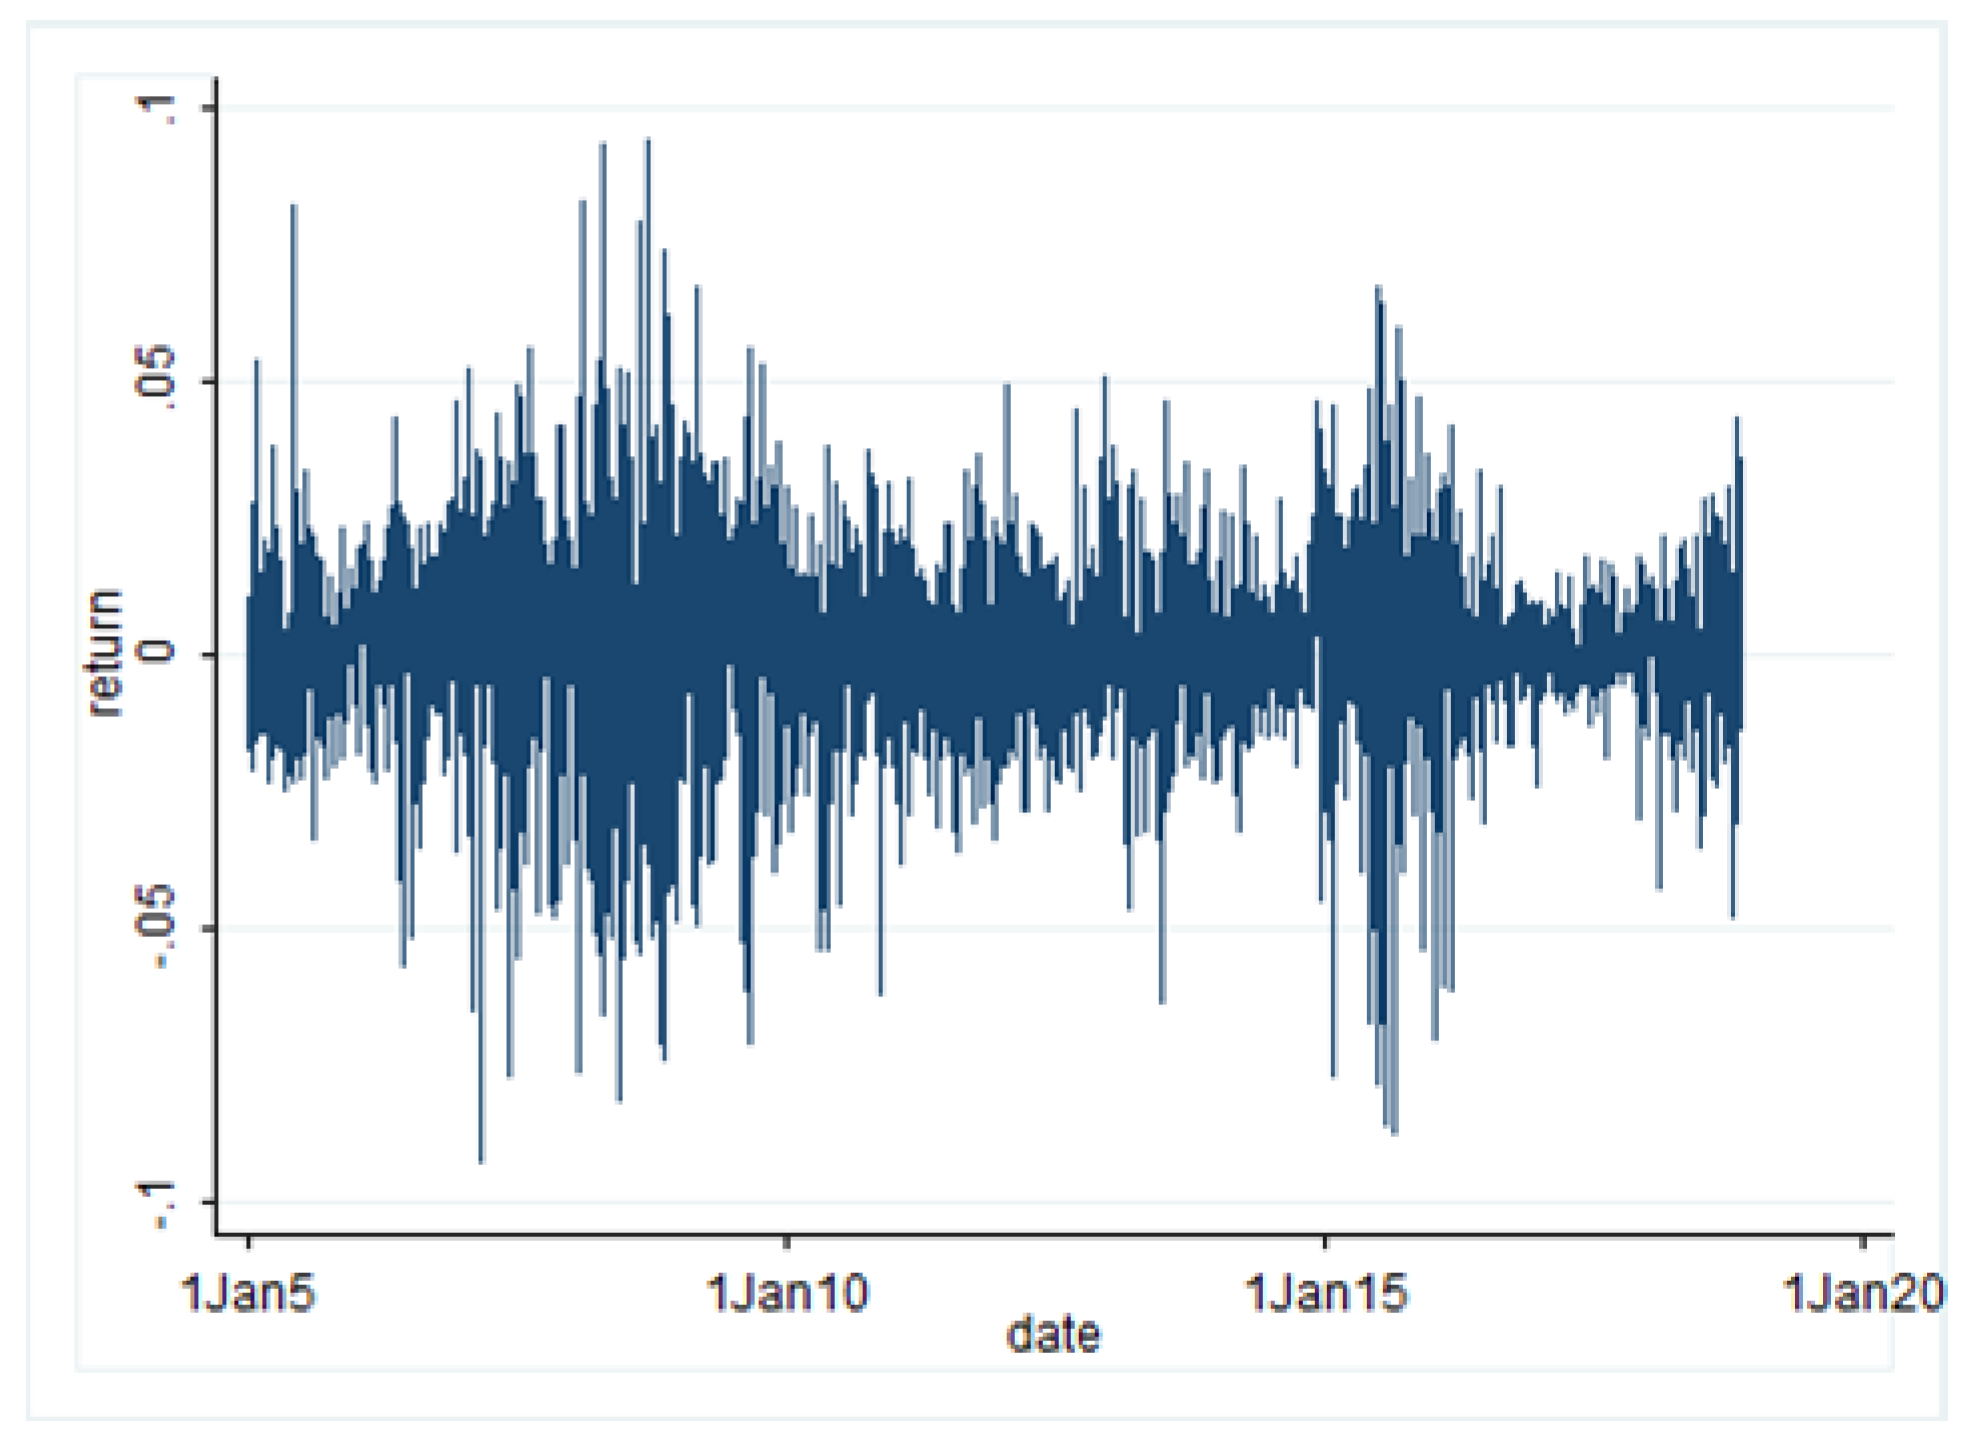
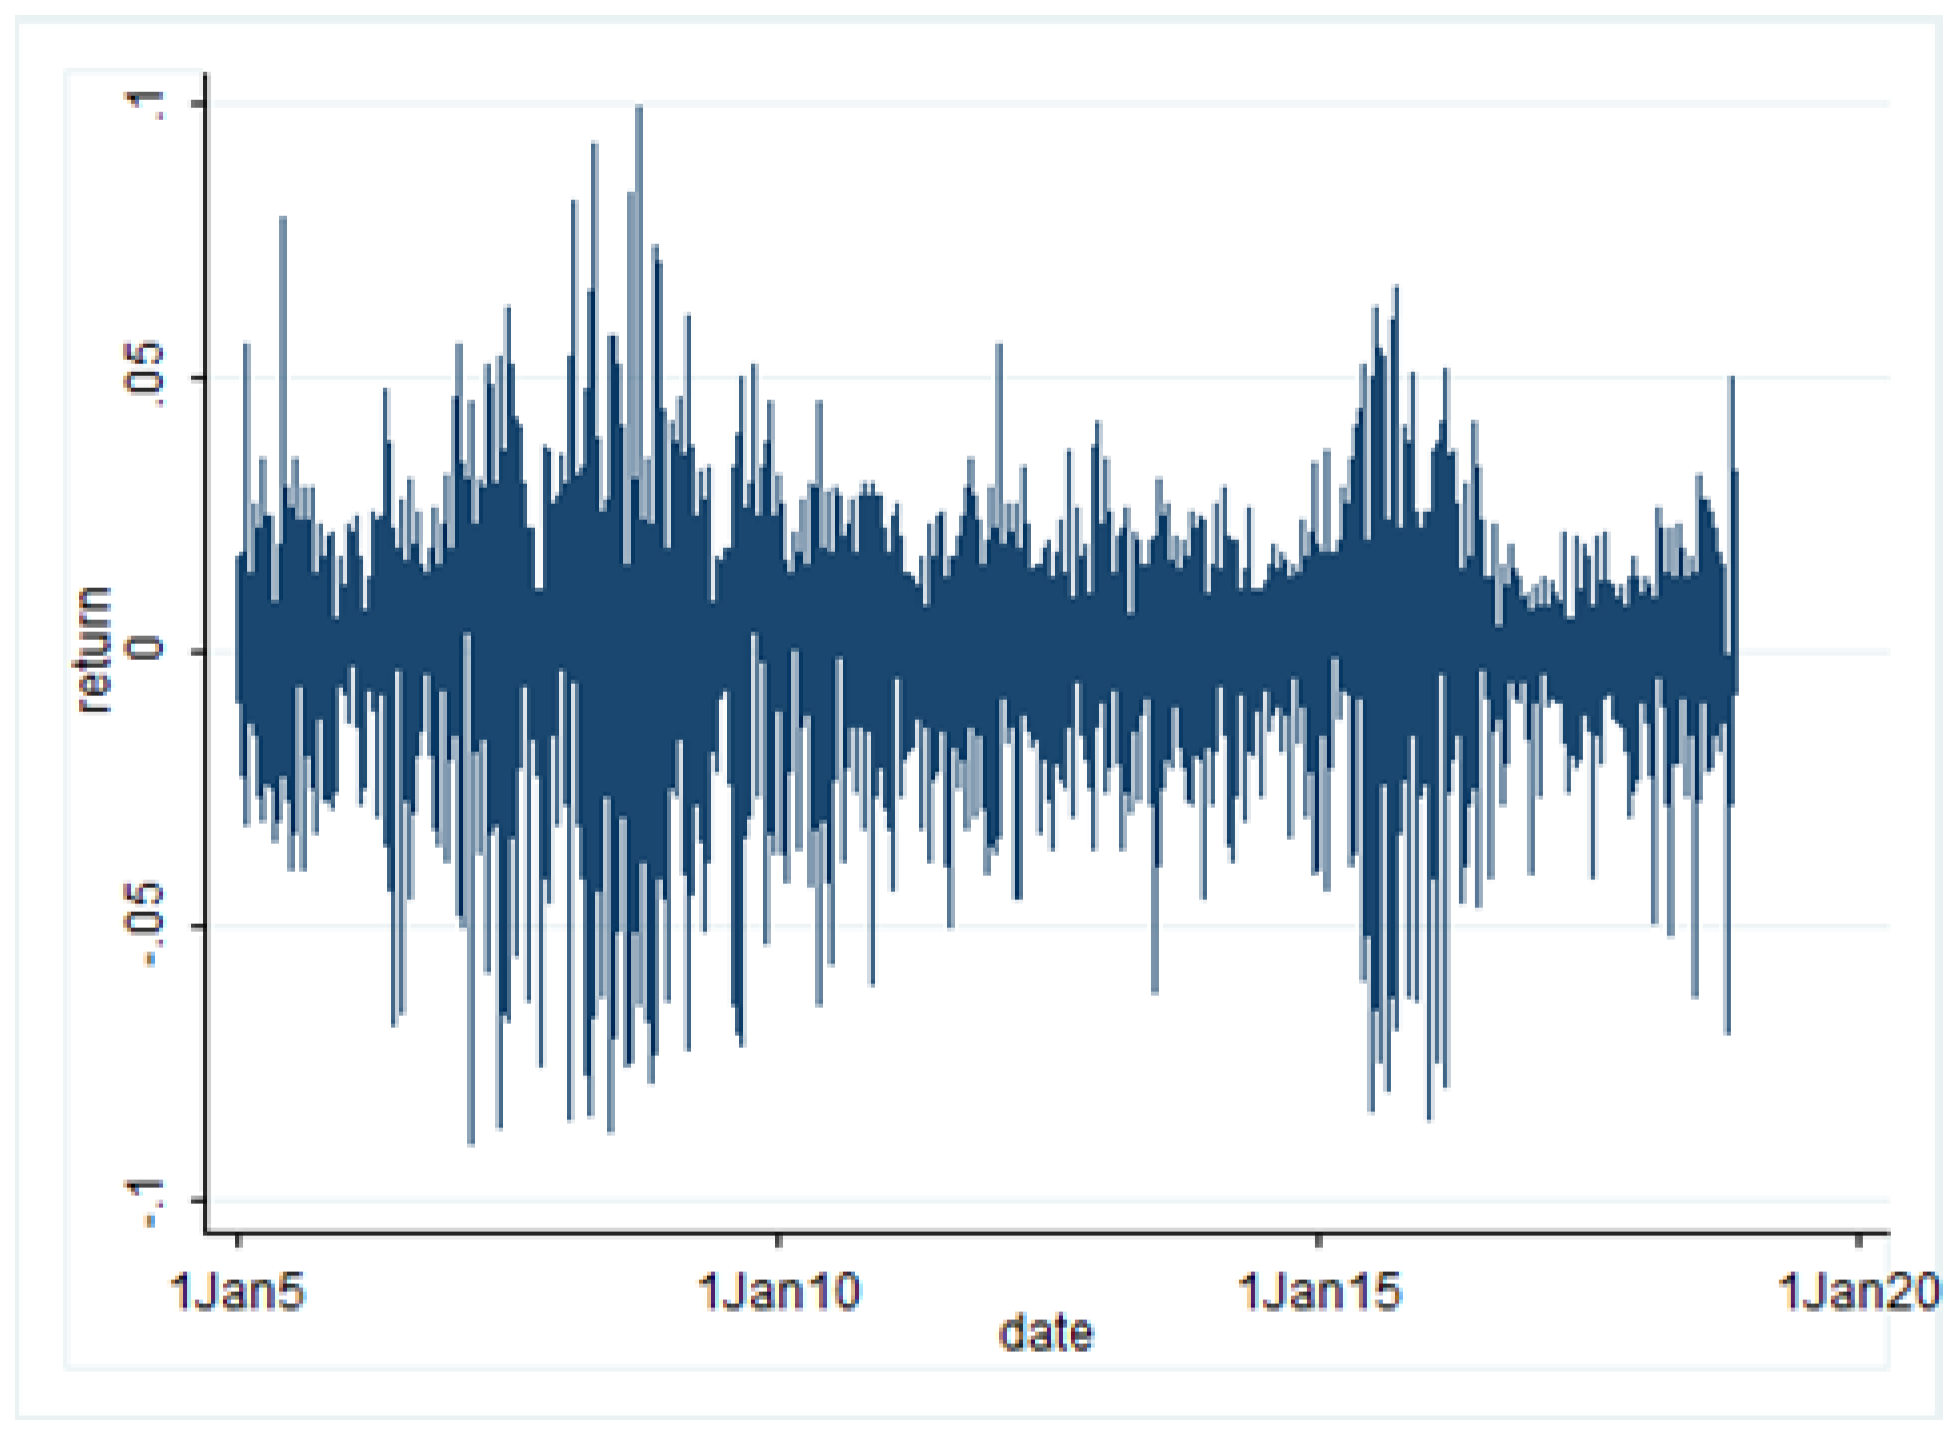
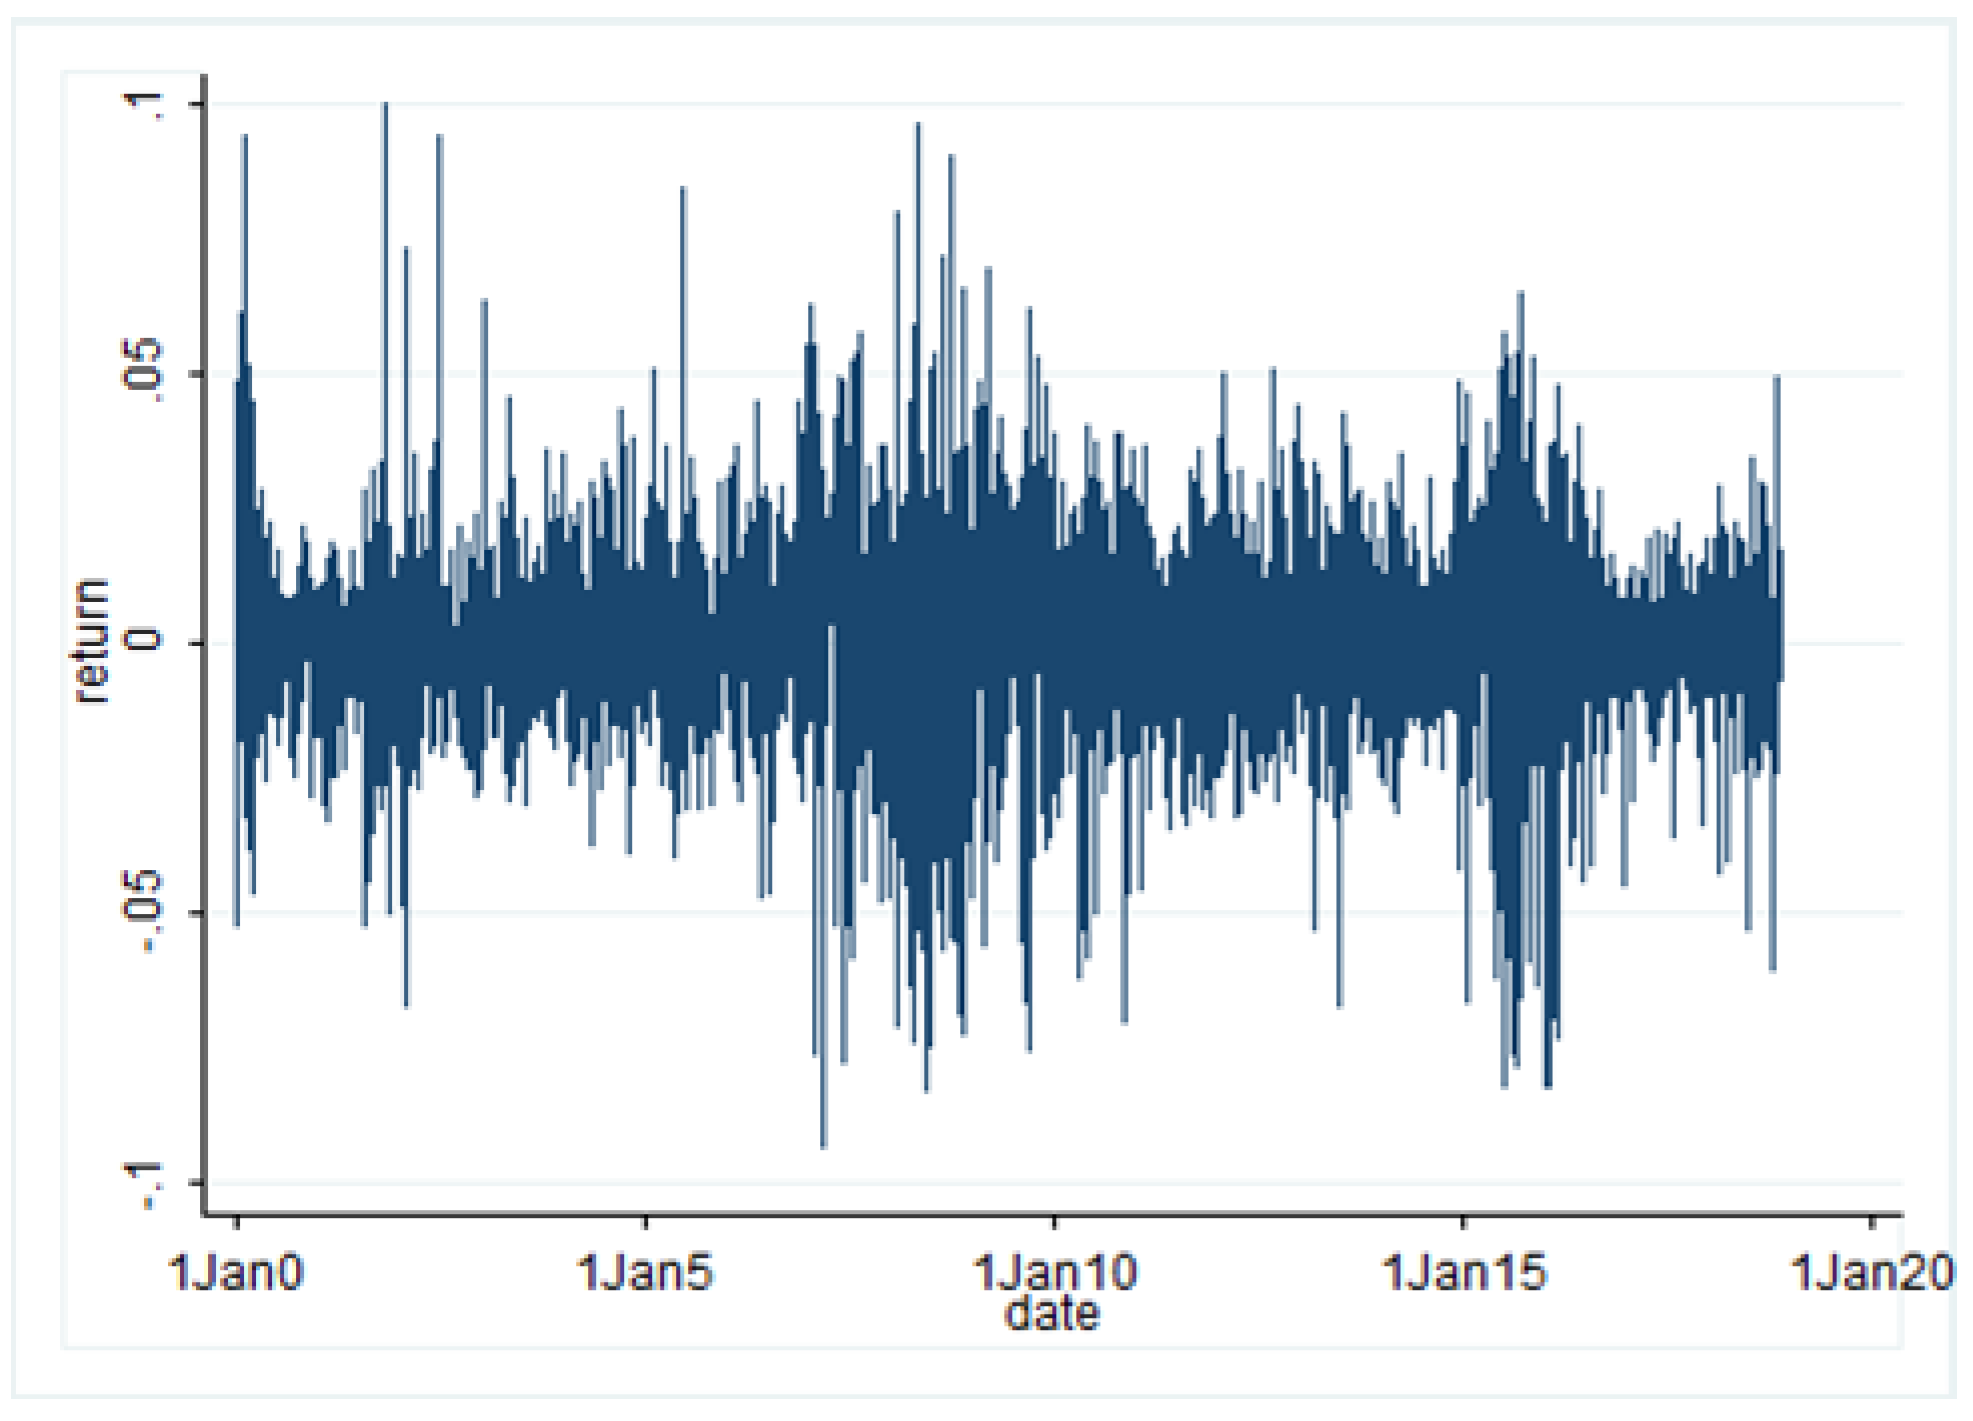
The overall trends of SSE, SZSE, SHSE-SZSE300, and CSI500 index return series are shown in
Figure 1,
Figure 2,
Figure 3 and
Figure 4, respectively. In the four figures, the horizontal axis is the time axis and the vertical axis is the daily return values of the four indices. As shown in
Figure 1,
Figure 2,
Figure 3 and
Figure 4, the trends of the four indices are relatively close, showing the consistency and correlations of the Shanghai and Shenzhen stock market changes. The index returns considerably fluctuated during 2008 to 2015, while the daily fluctuations remained relatively stable at other times, indicating the effects of the global financial crisis in 2008 and the stock market crash in 2015. The four indices experienced relatively small fluctuations during 2012 to 2014. Particularly, the returns also witnessed a substantial fluctuation that was caused by the stock market crash in 2015, second only to that in 2008. Meanwhile,
Figure 1,
Figure 2,
Figure 3 and
Figure 4 show that fluctuation persists in the return series for the SSE, SZSE, SHSE-SZSE300, and CSI500 index, which can be a key factor of multifractality, which can be caused by some extreme events and extreme volatility [
19]. The volatility, on the other hand, may exhibit time-scale persistence, causing long-range correlations in the series, which is another key cause of multifractality.
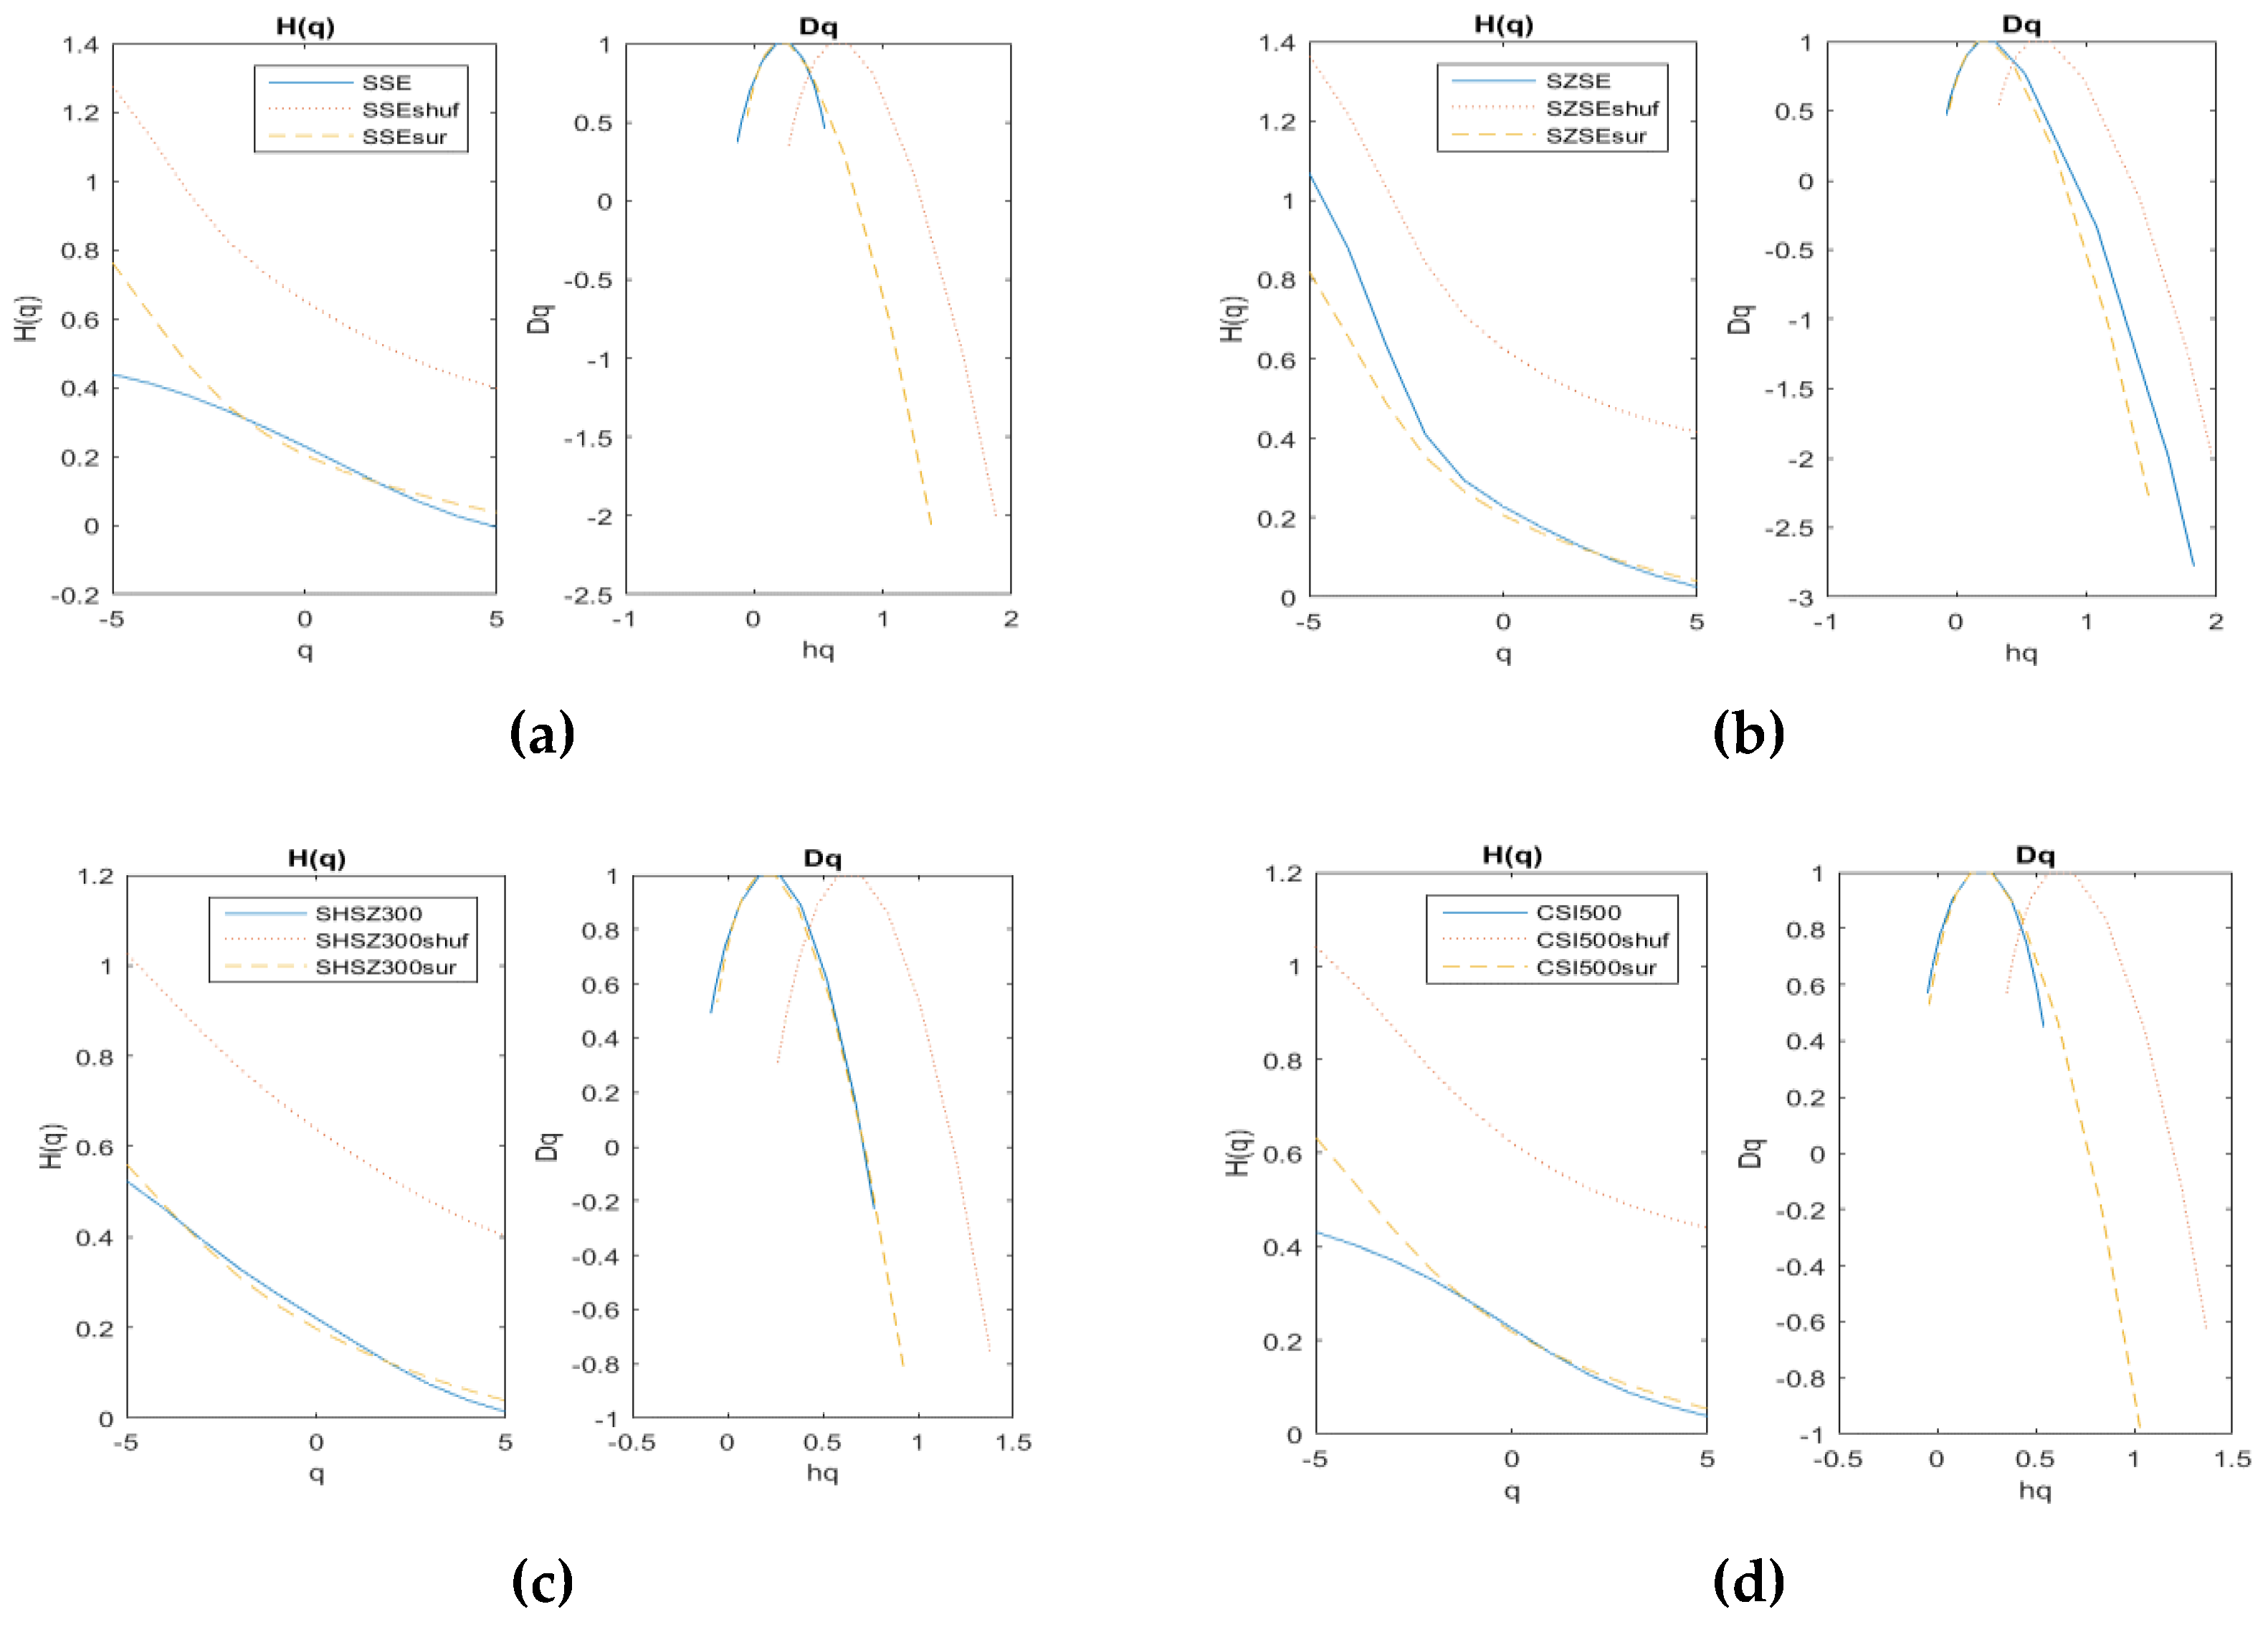
5. Empirical Results
The generalized Hurst exponent of order q and the multifractal spectrum of the daily return of SSE, SZSE, SHSE-SZSE300, CSI500, and of its test series are shown in
Figure 5. According to Kantelhardt [
19], the multifractality properties of the return series are examined based on the generalized Hurst exponent.
5.1. Existence Test of Multifractal Structure of Index Return Series
In
Figure 5, the horizontal axis and the vertical axis represent the q value and the Hurst exponent value, respectively. As shown in
Figure 5, the solid line refers to the q-order Hurst exponent H(q) of the return series. According to preceding model [
19,
20,
21,
22,
23], the generalized Hurst exponent H(q) that is based on order q is a suitable indicator for multifractality. As shown in
Figure 5, the generalized Hurst exponent H(q) of order q of the SSE, SZSE, SHSE-SZSE300, CSI500 index and their test series are correlated to the order number q, and a decrease with the increase of order q. Decreasing H(q) shows that the SSE, SZSE index return series has significant multifractal properties. Meanwhile, H (q) is not a constant, but a function of q, indicating that the daily return series of the indices has a multifractal structure. H (q) is showing a downward trend on the interval (−5, 5) When q = 2, the classical Hurst exponent H (q) of the original sequence is 0.2256, 0.1274, 0.1183, and 0.1257 respectively, which shows strong negative long range correlation.
For the four indices, when q = −5 H(q) is slightly lower than 0.5. It decreases smoothly, with a rising q value between −5 and 5, showing considerably persistent characteristics of small fluctuations. The values of H (q) indicate that the changes in these index returns are in the opposite direction from the past. As shown in
Figure 5, the multifractal spectrum of the four daily index return series is a single peak function, which further illustrates that the daily index return series have multifractal characteristics. Accordingly, it is not appropriate to describe the daily return of the indices with a simple single fractal model.
5.2. Measure of Multifractal Degree of Index Return Series
The relationship between the multifractal spectrum f(α) and the q-order singularity exponent α is in the shape of a single-peak bell. As shown in
Figure 5, the singularity strength h(q) is represented by the horizontal axis and the singularity spectrum D(q) is represented by the vertical axis.
Table 2, below, shows the properties of the multifractal spectrum [
19].
For SSE, the chance of maximization of daily returns is less than the chance of being at a minimum, because Δf<0, indicating small fluctuations in the original series. For SSE and CSI500, the asymmetric exponent R>0 indicates that the shape of the multifractal spectrum of SSE and CSI500 index return is a right-skewed distribution and that the multifractal spectrum shows an inverted bell of right-skewed distribution. At this time, the relatively high fractal exponents dominate, indicating that the left half of the daily return of these index ΔαR has a larger range of values and that the events with a higher daily return of the SSE index have an advantage over those with lower daily return. This means that the events with higher daily return take a more dominant position in the sample that was selected.
However, the opposite occurs for the SZSE, SHSE-SZSE300, and CSI500. The shape of the multifractal spectrum of SZSE and SHSE-SZSE300 index return is a left-skewed distribution and that the multifractal spectrum shows an inverted bell of left-skewed distribution. The relatively low fractal exponents dominate, indicating that the left half of the daily return of these index ΔαR has a smaller range of values and that the events with lower daily return of the SZSE index have an advantage over those with higher daily return. This means that the events with lower daily return take a more dominant position in the sample that was selected.
For the four indices, the widths of the multifractal spectra of the phase-randomized series of the SZSE index and the SHSE-SZSE300 index are less than those of their shuffled series, which can be interpreted as the influence of extremely large Gaussian events on the fractal characteristics of the time series, indicating that the fat-tail distribution of volatility for the original series of daily returns of the SZSE and the SHSE-SZSE300 index has greater effects on the multifractal feature of the original series than the long range correlation of the series on the multifractality. Conversely, for the SSE index and the CSI500 index, the long-range correlation of the series has a greater impact on the multifractal characteristics of the original series than on the fat-tailed distribution of the series. In the Shanghai market, the inefficiency is correlated with return long-range correlation, which may have some impacts on the asset price and investor expectations. However, in the Shenzhen market, extreme events, like financial crisis, might have greater effects on the market inefficiency. All of the above results indicate some contradictions with the Effective Market Hypothesis (EMH) [
32,
33].
5.3. Analysis of Causes of Multifractal Properties of Index Return Series
Two major sources of multifractality are traditionally present: different long-range correlations for small and large fluctuations and fat-tailed probability distributions of variations [
34]. We can compare the multifractality between the original series and randomly shuffled series to understand the effect of long-range correlations through the shuffling test and compare the multifractalities between the original series and the surrogated series to investigate the contribution of the fat-tailed distribution through the phase-randomizing test. By shuffling and phase-randomizing the original series, the shuffled and phase-randomized series can be obtained. We named them shuf and sur, respectively. From
Figure 5, we can see the Hurst exponents of shuf and sur with different characteristics.
The generalized Hurst exponent H(q) of order q of the SSE index return series and its test series, including its shuffled series and phase-randomized series, are correlated to the order number q. The generalized Hurst exponent H(q) drops when order q rises, showing that the original series of the SSE index return and its shuffled and phase-randomized series exhibit multifractal properties. The subtle difference between the q-order generalized Hurst exponent H(q) of the original series of the SSE index return and that of the phase-randomized series indicates that the correlation of the original series is well preserved by the phase-randomizing process results. The q-order generalized Hurst exponent H (q) of the shuffled series is significantly higher than that of the original series, indicating that the shuffled series also retains the correlation of the original series.
For the daily return data of SSE, SZSE, SHSE-SZSE300, and CSI500 index, the width of the multifractal spectrum of the test series is almost equal to that of the original series, showing that the multifractal characteristics and multifractal degree of the test series are slightly weakened. The combination of the long range correlation and fat-tailed distribution properties of the series cause the multifractal characteristics of the daily return series.
6. The Multifractal Levels and Efficiency of The Index Return Series in Sub-Samples
In this paper, we use the MD (multifractality degree) values in the sample to describe the multifractality degrees of the four series. We obtain the MD values by analyzing the characteristics of the multifractal spectrum of each index. Moreover, we use the MD values to measure the multifractality level by calculating the difference between α
max and α
min. Comparatively high MD value means a high multifractality degree, corresponding to low market efficiency. In this way, we can get the multifractality and efficiency of the Shanghai stock market and the Shenzhen stock market in China for three periods [
35].
Table 3 shows the MD values of the four main index returns in three different periods and all-sample. From two aspects of the sub-samples and the whole sample, we can see the differences in multifractality among indices, thus indicating the impact of the stock market crash. The SZSE has the highest MD value in the whole sample, while its MD values becomes comparatively lower in the sub-samples. This means that the crash has greater impact on the multifractality and inefficiency of Shenzhen stock market than on other market in China’s stock market.
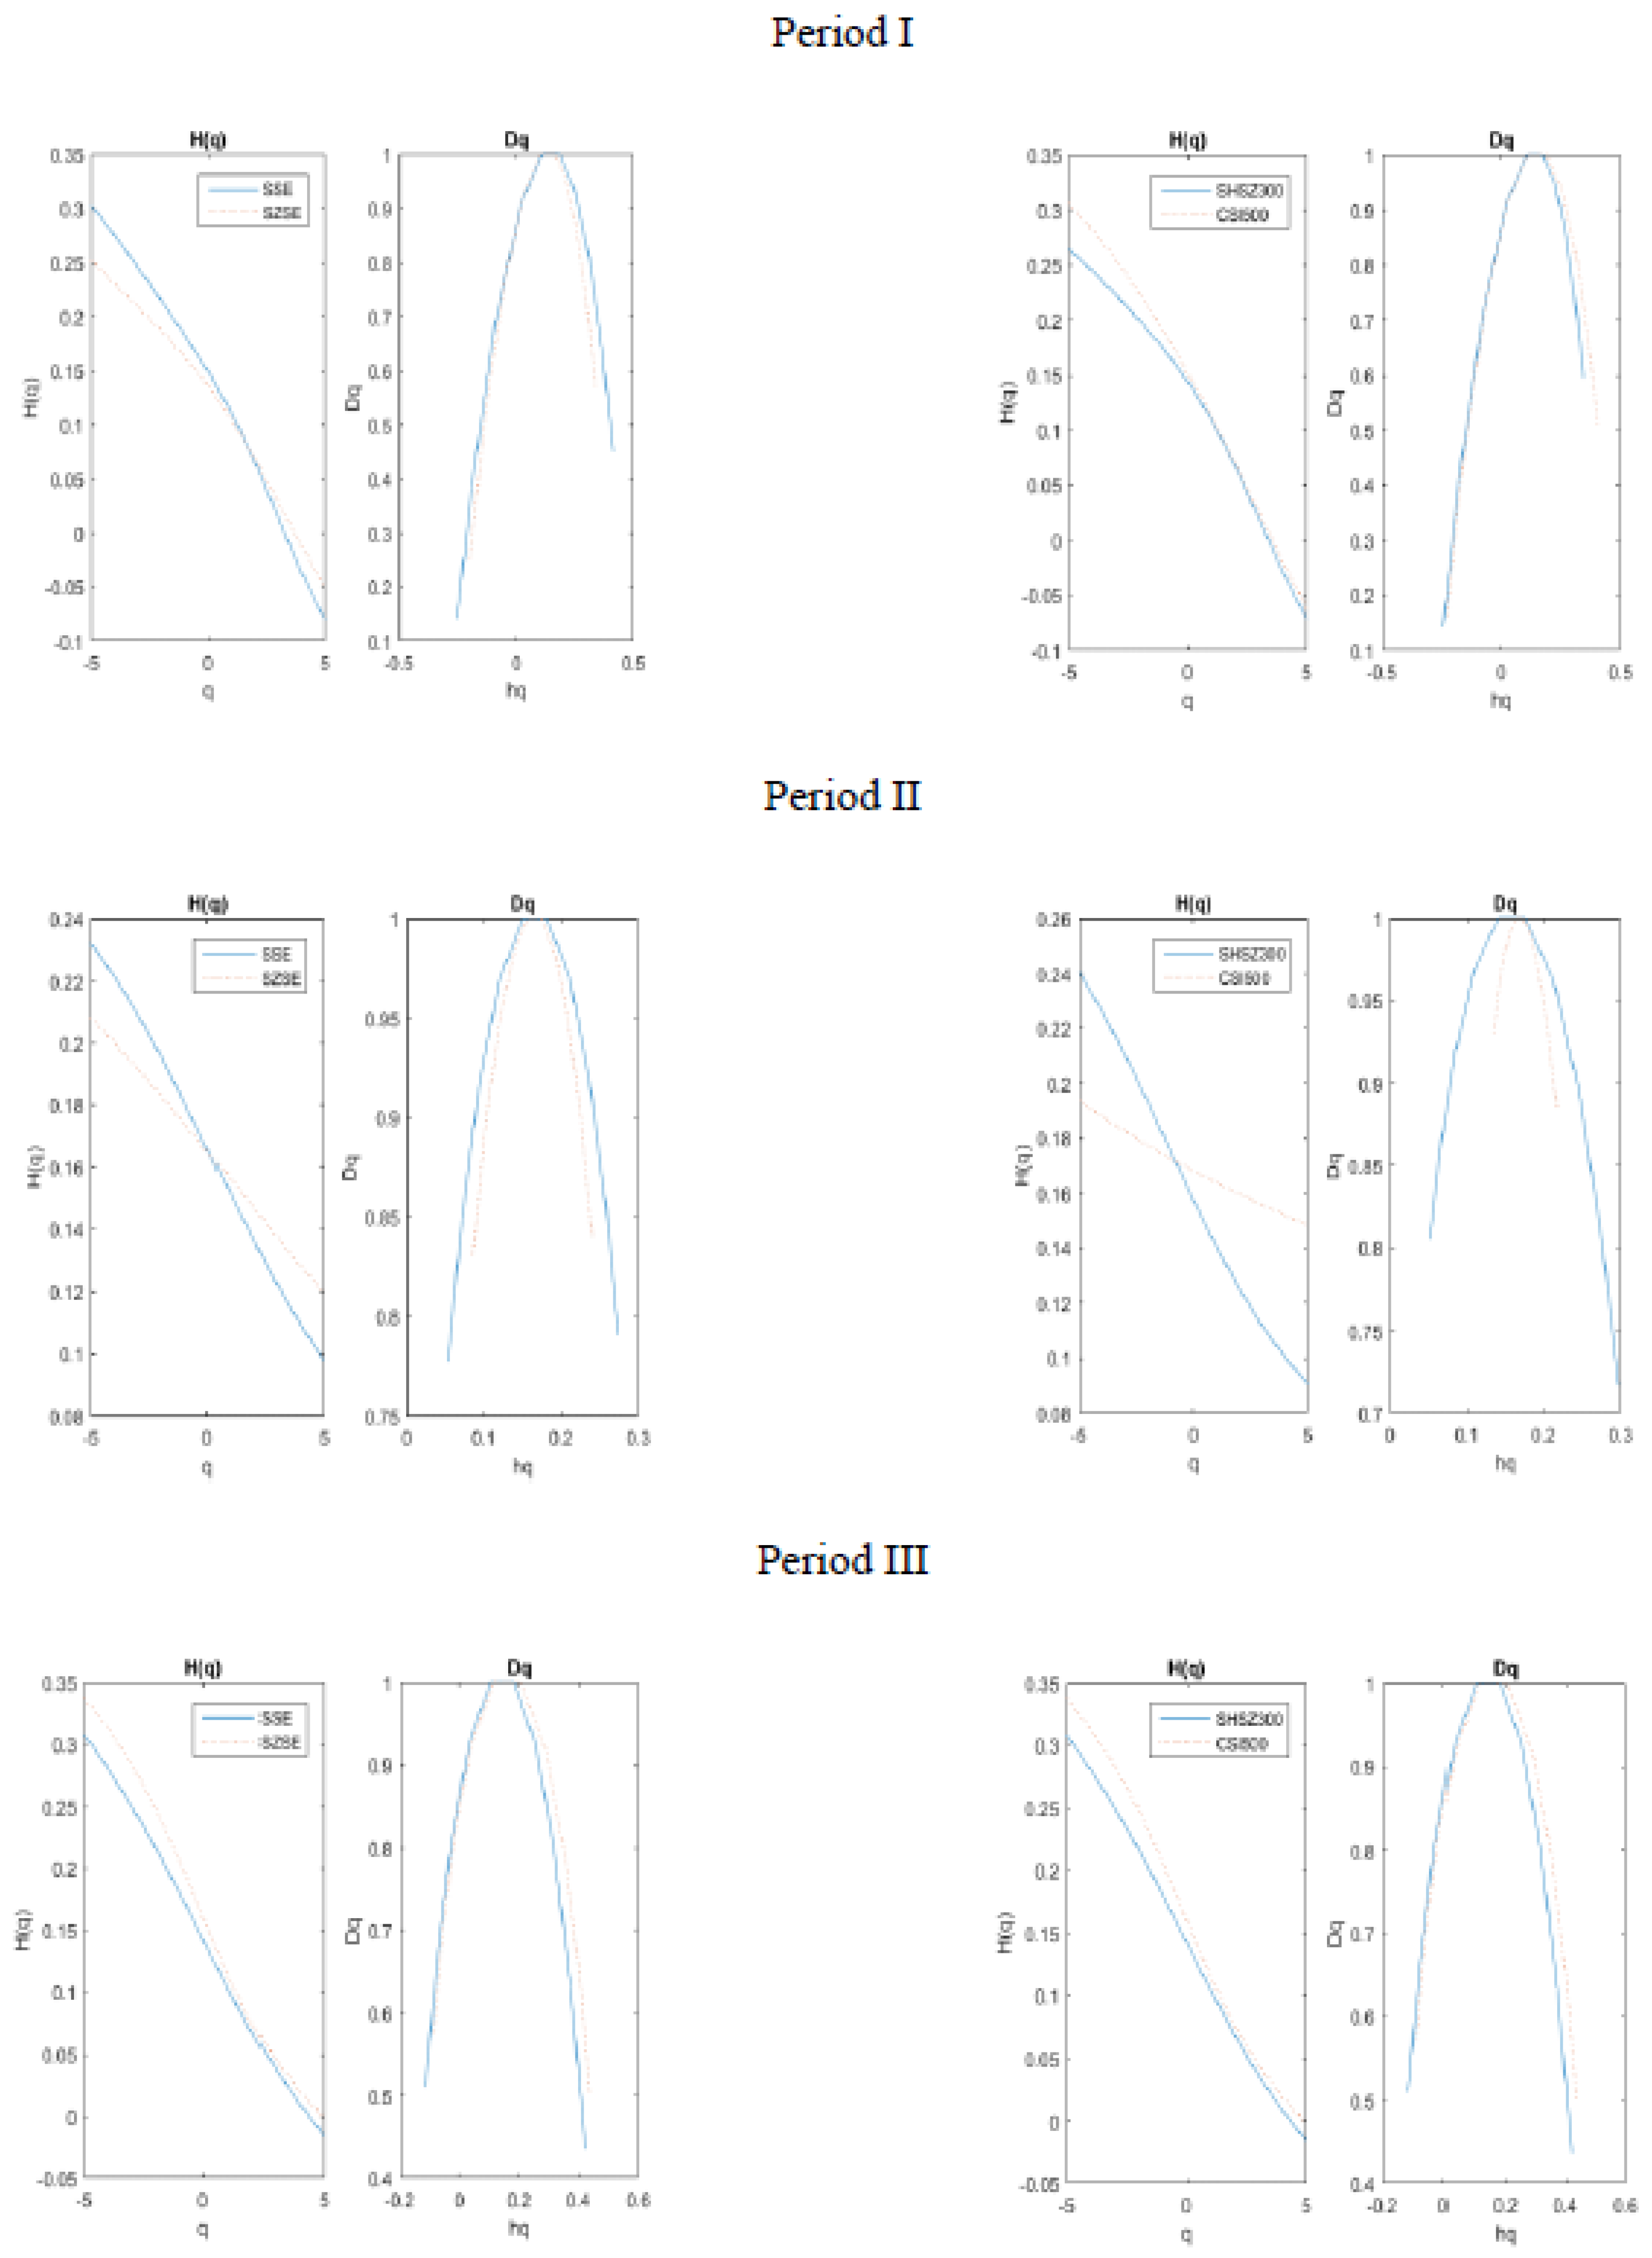
Figure 6 shows the Hurst exponents and the multifractal spectra of SSE, SZSE, SHSE-SZSE300, and CSI500 index daily return series for three sub-samples: Period I, II, and III. For each period, the solid line represents the SSE and SHSE-SZSE300 index, respectively. The dashed line represents the SZSE and CSI500 index, respectively.
During Period I, the H(q) of SSE drops from about 0.3 to −0.075, at a faster speed than that of SZSE, which drops from about 0.25 to −0.05. The SSE return series exhibits slightly higher multifractality level than the SZSE return series. The MD values are 0.6138 for SSE and 0.6068 for SZSE, respectively. Therefore, both SSE and SZSE return series during Period I have multifractal properties, and the multifractal level of SSE is higher than that of SZSE, showing that the Shanghai A-share market is slightly less efficient than Shenzhen A-share market during Period I. In the same way, the return series of the SHSE-SZSE300 Index and the CSI500 Index during period I are compared. When q is negative, the H(q) of CSI500 return series drops from 0.3 to 0.13, at a faster rate than that of the SHSE-SZSE300 return series, which drops from 0.27 to 0.13. On the other hand, when q is positive, the q-H(q) curves of SHSE-SZSE300 and CSI500 seem to be highly close, representing the H(q) of two indices falling at almost the same rate. Moreover, the CSI500 return series exhibits a slightly higher multifractality level than SHSE-SZSE300 return series. The MD values are 0.6476 for SHSE-SZSE300 and 0.6523 for CSI500, respectively. Therefore, both SHSE-SZSE300 and CSI500 return series during Period I have multifractal properties, and the multifractal level of CSI500 is slightly higher than that of SHSE-SZSE300, showing that the stock market of small and medium-sized value companies in the A-share market is slightly less efficient than the cross-market reflecting the overall trend of Shanghai and Shenzhen stock markets during Period I. For Period II and III, we can analyze the market efficiency in a similar way. Meanwhile, the multifractal level of SSE is also higher than that of SZSE, showing that the Shanghai A-share market is also less efficient than Shenzhen A-share market during Period II to a larger degree. The multifractal degree of SHSE-SZSE300 is significantly higher than that of CSI500, indicating that the cross-market reflecting the overall trend of Shanghai and Shenzhen stock markets is less efficient than the stock market of small and medium-sized value companies in the A-share Market during Period II. However, Shenzhen A-share market exhibits slightly less efficiency than Shanghai A-share market during Period III. In a word, we can draw three main conclusions from the MD values of the four return series in the sub-samples and the whole sample. First, the MD values of the four-index return series fluctuated over time during different periods. Second, the fluctuations of the MD value of the four indices are different. Third, the stock market crash has a different impact on market efficiency in a different market, thus it adversely affects the sustainability of China’s capital market and Chinese economy.
7. Conclusions
The empirical results of multifractal analysis indicated that the four-index return series exhibit multifractal characteristics with different levels in the sample, resulting in inefficiency in stock markets. This inefficiency may be economically caused by government intervention and other market behaviors during or after the stock crash. The four return series in Shanghai and Shenzhen stock markets are not totally statistically independent and they have multifractal properties that are sensitive to local fluctuations with large magnitudes, but are comparatively insensitive to local fluctuations with small magnitudes. The multifractal properties of the four return series result from the interaction of the long-range correlation and the fat-tail distribution of the series. The fat-tail distributions of the original series of the SZSE and the SHSE-SZSE300 index have greater effects on the multifractal properties of their original series than the long-range correlation of the series on their multifractal properties. However, the opposite may happen for the SSE and the CSI500 index. The dynamics of the stock market in China, such as nonlinearity, inefficiency, and randomness, constitute a complex nonlinear system. For the sample of 2000 to 2018, the SZSE index return has a stronger multifractal structure than the SSE index return, meaning that the Shanghai stock market has higher efficiency than Shenzhen stock market. The MD value of the SZSE index return is the maximum value among the MD values of these four indices, while the MD value of the CSI500 index return is the minimum value among the five indices, indicating that the Shenzhen stock market exhibits relatively lower levels of market efficiency than the other markets discussed in this study. MD values of the four return series had different values over time and the fluctuations of their MD value seem to be different, indicating the different effects that the stock crash had on the dynamics and efficiency in different markets during different periods.
The healthy development of Chinese stock market helps to improve the allocation efficiency of social capital, enhance the vigour of the Chinese economy, and promote the development of the economy. In the long run, the issue of stock market efficiency may be critical to the sustainable development of the Chinese capital market. The sustainable development of capital market is to promote capital accumulation, compensate market inefficiency, and maintain effective resource allocation. There are still many factors in China’s stock market, which have effects on stock market functioning and its efficiency. Due to the current imperfection of China’s stock market, to ensure the sustainable development of stock market and economy, we should: (1) promote the reform of the stock market to maintain a dynamic and sustainable market, (2) rationally apply market mechanism regulation to reduce the impact of external events on the efficiency of the stock market and to maintain effective resource allocation, (3) optimize the investor structure in the stock market and enhance the investment value of listed companies to play comparative advantages over financial intermediation, and (4) reduce excessive government administrative intervention to improve the operational and functional efficiency of the stock market and to ensure the sustainable development of China’s capital market and economy. If the measures are smoothly implemented, it will be conducive to stabilizing market sentiment, boosting market confidence, and promoting the sustainable development of the Chinese capital market and economy.


