Sustainable Development for Small Economy and Diversification from a Dominant Industry: Evidence from Macao


Abstract
:1. Introduction
2. Literature Review
2.1. Economic Diversification
2.2. Moderate Economic Diversification and Sustainable Development in Macao
2.3. Agglomeration Economies
2.4. The Dilemma of Moderate Economic Diversification, Agglomeration Economies of Gambling Industry and Diminishing Returns in Macao
3. Research Methods
3.1. Entropy Index of Economic Diversification
3.2. Data Envelopment Analysis (DEA)
3.3. Markov Chain Forecast
3.4. Data Collection and Variables Description
4. Results
4.1. Entropy Index of Economic Diversification
4.2. Bootstrapping-DEA Efficiency
4.3. Transition Matrix According to Relatedness and Complexity Framework
4.4. Forecast by the Markov Chain
5. Discussion
6. Conclusions
6.1. Summary and Implications
6.2. Theoretical Contributions
6.3. Practical Implications
6.4. Limitation and Further Studies
Author Contributions
Funding
Acknowledgments
Conflicts of Interest
References
- Yearbook of Statistics 2017. Available online: https://www.dsec.gov.mo/Statistic.aspx?lang = en-USNodeGuid = d45bf8ce-2b35-45d9-ab3a-ed645e8af4bb (accessed on 1 January 2019).
- Hua, Y.M. Macao moderate economic diversification: Connotation, path and policy. J. Sun Yat-Sen Univ. Soc. Sci. Ed. 2009, 49, 149–157. (In Chinese) [Google Scholar]
- Gu, X.; Li, G.; Chang, X.; Guo, H. Casino tourism, economic inequality, and housing bubbles. Tour. Manag. 2017, 62, 253–263. [Google Scholar] [CrossRef]
- Hackbart, M.M.; Anderson, D.A. On measuring economic diversification. Land Econ. 1975, 51, 374–378. [Google Scholar] [CrossRef]
- Abouchakra, R.; Shediac, R.; Moujaes, C.N.; Najjar, M.R. Economic Diversification: The Road to Sustainable Development; Booz Company: New York, NY, USA, 2008. [Google Scholar]
- Nourse, H.O. Regional Economics: A Study in the Economic Structure, Stability and Growth of Regions; McGraw-Hill: New York, NY, USA, 1968. [Google Scholar]
- Government of the Macao Special Administrative Region. 2018 Policy Address. Available online: https://images.io.gov.mo/cn/lag/lag2018_cn.pdf (accessed on 1 January 2019). (In Chinese)
- Government of the Macao Special Administrative Region. Yearbook of Statistics 2018. Available online: https://www.dsec.gov.mo/Statistic.aspx?NodeGuid = d45bf8ce-2b35-45d9-ab3a-ed645e8af4bb (accessed on 1 January 2019).
- Government of the Macao Special Administrative Region. Policy Address for the Fiscal Year 2019. Available online: https://www.policyaddress.gov.mo/policy/home.php?lang = en (accessed on 1 January 2019).
- San, C.S. Rationales and options for economic diversification in Macao; Monetary Authority of Macao: Macau, China, 2006. [Google Scholar]
- Greenwood, V.A.; Dwyer, L. Reinventing Macau tourism: Gambling on creativity? Curr. Issues Tour. 2017, 20, 580–602. [Google Scholar] [CrossRef]
- Wan, Y.K.P.; Li, X. Sustainability of tourism development in Macao, China. Int. J. Tour. Res. 2013, 15, 52–65. [Google Scholar] [CrossRef]
- Xi, L.; Wei, C.S. The way to the diversification of Macau’s social economy: A study on Macau’s cultural tourism development. Int. J. Tradeeconomics Financ. 2010, 1, 131. [Google Scholar] [CrossRef]
- Zhang, Y.; Kwan, F. Macao’s gaming-led prosperity and prospects for economic diversification. China Int. J. 2009, 7, 288–319. [Google Scholar] [CrossRef]
- Hvidt, M. Economic Diversification in GCC Countries: Past Record and Future Trends; The London School of Economics and Political Science: London, UK, 2013. [Google Scholar]
- UNFCCC. The Concept of Economic Diversification in the Context of Response Measures Technical Paper by the Secretariat. 6 May 2016. Available online: https://unfccc.int/resource/docs/2016/tp/03.pdf (accessed on 1 January 2019).
- Liu, M.T.; Chang, T.T.G.; Loi, E.H.; Chan, A.C.H. Macau gambling industry: Current challenges and opportunities next decade. Asia Pac. J. Mark. Logist. 2015, 27, 499–512. [Google Scholar] [CrossRef]
- Lu, P. Study on the Moderate Diversification of Industrial Structure in Macao. Am. J. Ind. Bus. Manag. 2016, 6, 176. [Google Scholar] [CrossRef]
- Wei, D. Research on Industrial Development Strategy of Macao. J. Tsinghua Univ. Philos. Soc. Sci. Ed. 2000, 15, 43–51. (In Chinese) [Google Scholar]
- Harrison, B.; Kelley, M.R.; Gant, J. Innovative firm behavior and local milieu: Exploring the intersection of agglomeration, firm effects, and technological change. Econ. Geogr. 1996, 72, 233–258. [Google Scholar] [CrossRef]
- Porter, M.E. Location, competition, and economic development: Local clusters in a global economy. Econ. Dev. Q. 2000, 14, 15–34. [Google Scholar] [CrossRef]
- Delgado, M.; Porter, M.E.; Stern, S. Clusters, convergence, and economic performance. Res. Policy 2014, 43, 1785–1799. [Google Scholar] [CrossRef]
- Aratuo, D.N.; Etienne, X.L. Industry level analysis of tourism-economic growth in the United States. Tour. Manag. 2019, 70, 333–340. [Google Scholar] [CrossRef]
- Rosenthal, S.S.; Strange, W.C. Evidence on the nature and sources of agglomeration economies. In Handbook of Regional and Urban Economics; Elsevier: Amsterdam, The Netherlands, 2004; pp. 2119–2171. [Google Scholar]
- Kolko, J. Urbanization, agglomeration, and coagglomeration of service industries. In Agglomeration Economics; University of Chicago Press: Chicago, IL, USA, 2010; pp. 151–180. [Google Scholar]
- Smith, A. An Inquiry into the Nature and Causes of the Wealth of Nations; Thomas Nelson and Sons: Edinburgh, UK, 1887; Volume 2. [Google Scholar]
- Marshall, A. Principles of Economics: An Introductory Volume; Macmillan: London, UK, 1961. [Google Scholar]
- Raj, S.K. Measuring Economic Diversification in Hawaii. Research and Economic Analysis Division (READ), Department of Business, Economic Development and Tourism of Hawaii, 2008. Available online: http://files.hawaii.gov/dbedt/economic/data_reports/EconDiversification/Economic_Diversification_Report_Final%203-7-08.pdf (accessed on 1 January 2019).
- Banker, R.D.; Charnes, A.; Cooper, W.W. Some models for estimating technical and scale inefficiencies in data envelopment analysis. Manag. Sci. 1984, 30, 1078–1092. [Google Scholar] [CrossRef]
- Seiford, L.M.; Thrall, R.M. Recent developments in DEA: The mathematical programming approach to frontier analysis. J. Econom. 1990, 46, 7–38. [Google Scholar] [CrossRef]
- Banker, R.D.; Thrall, R.M. Estimation of returns to scale using data envelopment analysis. Eur. J. Oper. Res. 1992, 62, 74–84. [Google Scholar] [CrossRef]
- Gilks, W.R.; Richardson, S.; Spiegelhalter, D. Markov Chain Monte Carlo in Practice; Chapman and Hall/CRC: London, UK, 1995. [Google Scholar]
- Kort, J.R. Regional economic instability and industrial diversification in the US. Land Econ. 1981, 57, 596–608. [Google Scholar] [CrossRef]
- Conroy, M.E. The concept and measurement of regional industrial diversification. South. Econ. J. 1975, 41, 492–505. [Google Scholar] [CrossRef]
- Tress, R.C. Unemployment and the Diversification of Industry 1. Manch. Sch. 1938, 9, 140–152. [Google Scholar] [CrossRef]
- Tim, C.; Reda, C.; Fuad, H.; Amgad, H.; Padamha, K. Economic Diversification in the GCC: Past, Present, and Future; International Monetary Fund: Washington, DC, USA, 2014. [Google Scholar]
- UNESCAP. Economic Diversification in Asian Landlocked Developing Countries: Prospect and Challenges; 2014; Available online: https://www.unescap.org/sites/default/files/Economic%20Diversification_low%20resolution.pdf (accessed on 15 March 2019).
- Li, K.X.; Jin, M.; Shi, W. Tourism as an important impetus to promoting economic growth: A critical review. Tour. Manag. Perspect. 2018, 26, 135–142. [Google Scholar] [CrossRef]
- Wu, S.T.; Chen, Y.S. The social, economic, and environmental impacts of casino gambling on the residents of Macau and Singapore. Tour. Manag. 2015, 48, 285–298. [Google Scholar] [CrossRef]
- Li, G.; Gu, X.; Siu, R.C.S. The impacts of gaming expansion on economic growth: A theoretical reconsideration. J. Gambl. Stud. 2010, 26, 269–285. [Google Scholar] [CrossRef] [PubMed]
- Wan, Y.K.P. The social, economic and environmental impacts of casino gaming in Macao: The community leader perspective. J. Sustain. Tour. 2012, 20, 737–755. [Google Scholar] [CrossRef]
- Ivan, K.W.L.; Michael, H.; Dong, L.; Yedi, L. The influence of word of mouth on tourism destination choice: Tourist–resident relationship and safety perception among Mainland Chinese tourists visiting Macau. Sustainability 2018, 10, 2114. [Google Scholar]
- Glaeser, E.L. Introduction to “Agglomeration Economics”. In Agglomeration Economics; University of Chicago Press: Chicago, IL, USA, 2010; pp. 1–14. [Google Scholar]
- Marshall, A. Principles of Economics, 9th ed.; Macmillan: London, UK, 1920. [Google Scholar]
- Glaeser, E.L.; Gottlieb, J.D. The wealth of cities: Agglomeration economies and spatial equilibrium in the United States. J. Econ. Lit. 2009, 47, 983–1028. [Google Scholar] [CrossRef]
- Simar, L.; Wilson, P.W. Sensitivity analysis of efficiency scores: How to bootstrap in nonparametric frontier models. Manag. Sci. 1998, 44, 49–61. [Google Scholar] [CrossRef]
- Charnes, A.; Cooper, W.W.; Rhodes, E. Measuring the efficiency of decision making units. Eur. J. Oper. Res. 1978, 2, 429–444. [Google Scholar] [CrossRef]
- Zhang, Z. Changes in the market structure of the gaming industry and in performance of Macao. Greater Pearl River Delta Forum 2008, 1, 1–12. (In Chinese) [Google Scholar]
- Zhangping, Y. Research on the Appropriate Scale of Gaming Industry and Diversification of Industrial Structure: Taking Macao as an Example; Social Science Literature Publishing House: Beijing, China, 2017. (In Chinese) [Google Scholar]
- Stigler, G.J. The Organization of Industry; University of Chicago Press: Chicago, IL, USA, 1983. [Google Scholar]
- Kaya, A.; Koc, M. Over-Agglomeration and Its Effects on Sustainable Development: A Case Study on Istanbul. Sustainability 2019, 11, 135. [Google Scholar] [CrossRef]
- Herrick, B.; Kindleberger, C.P. Economic Development, 4th ed.; McGraw-Hill: Singapore, 1983. [Google Scholar]
- Jingwen, W.; Liang, M.Z. Characteristics of visitor expenditure in Macao and their impact on its economic growth. Tour. Econ. 2018, 24, 218–233. [Google Scholar] [CrossRef]
- Sheng, M.; Gu, C. Economic growth and development in Macau (1999–2016): The role of the booming gaming industry. Cities 2018, 75, 72–80. [Google Scholar] [CrossRef]


| Year | 2008 | 2009 | 2010 | 2011 | 2012 | 2013 | 2014 | 2015 | 2016 |
|---|---|---|---|---|---|---|---|---|---|
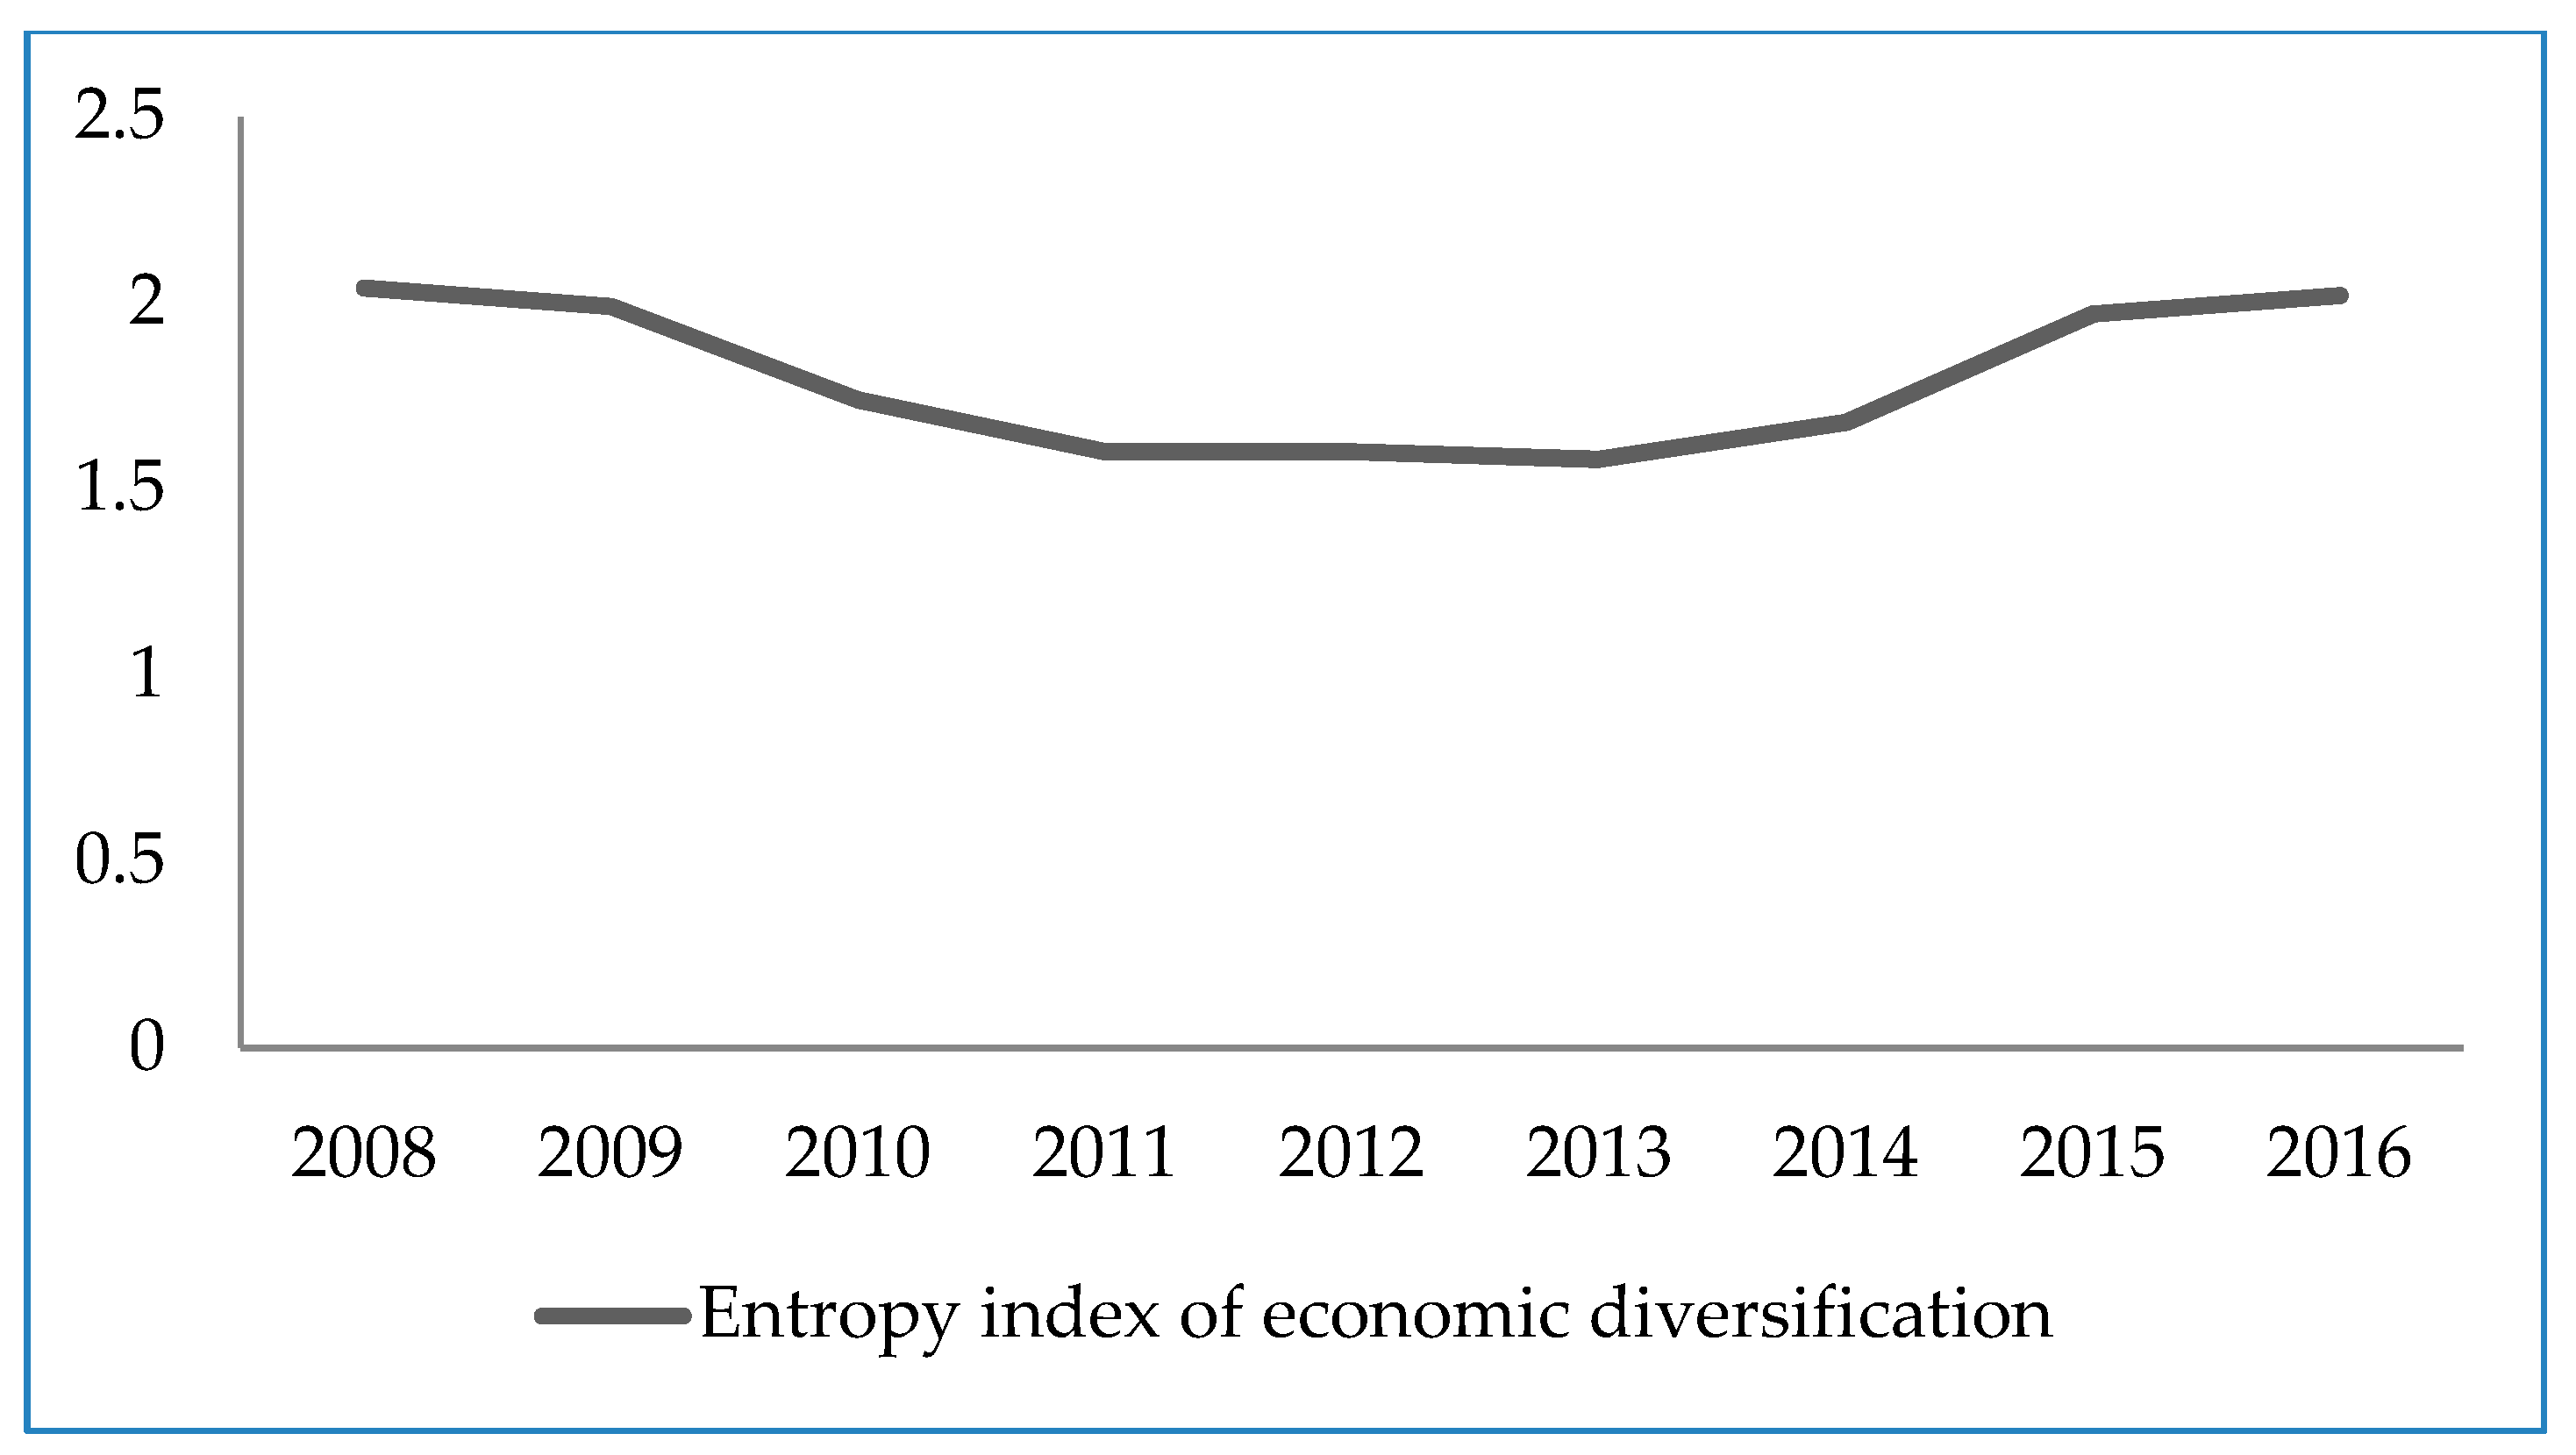
| Entropy index of economic diversification | 2.04 | 1.99 | 1.74 | 1.60 | 1.60 | 1.58 | 1.68 | 1.97 | 2.02 |
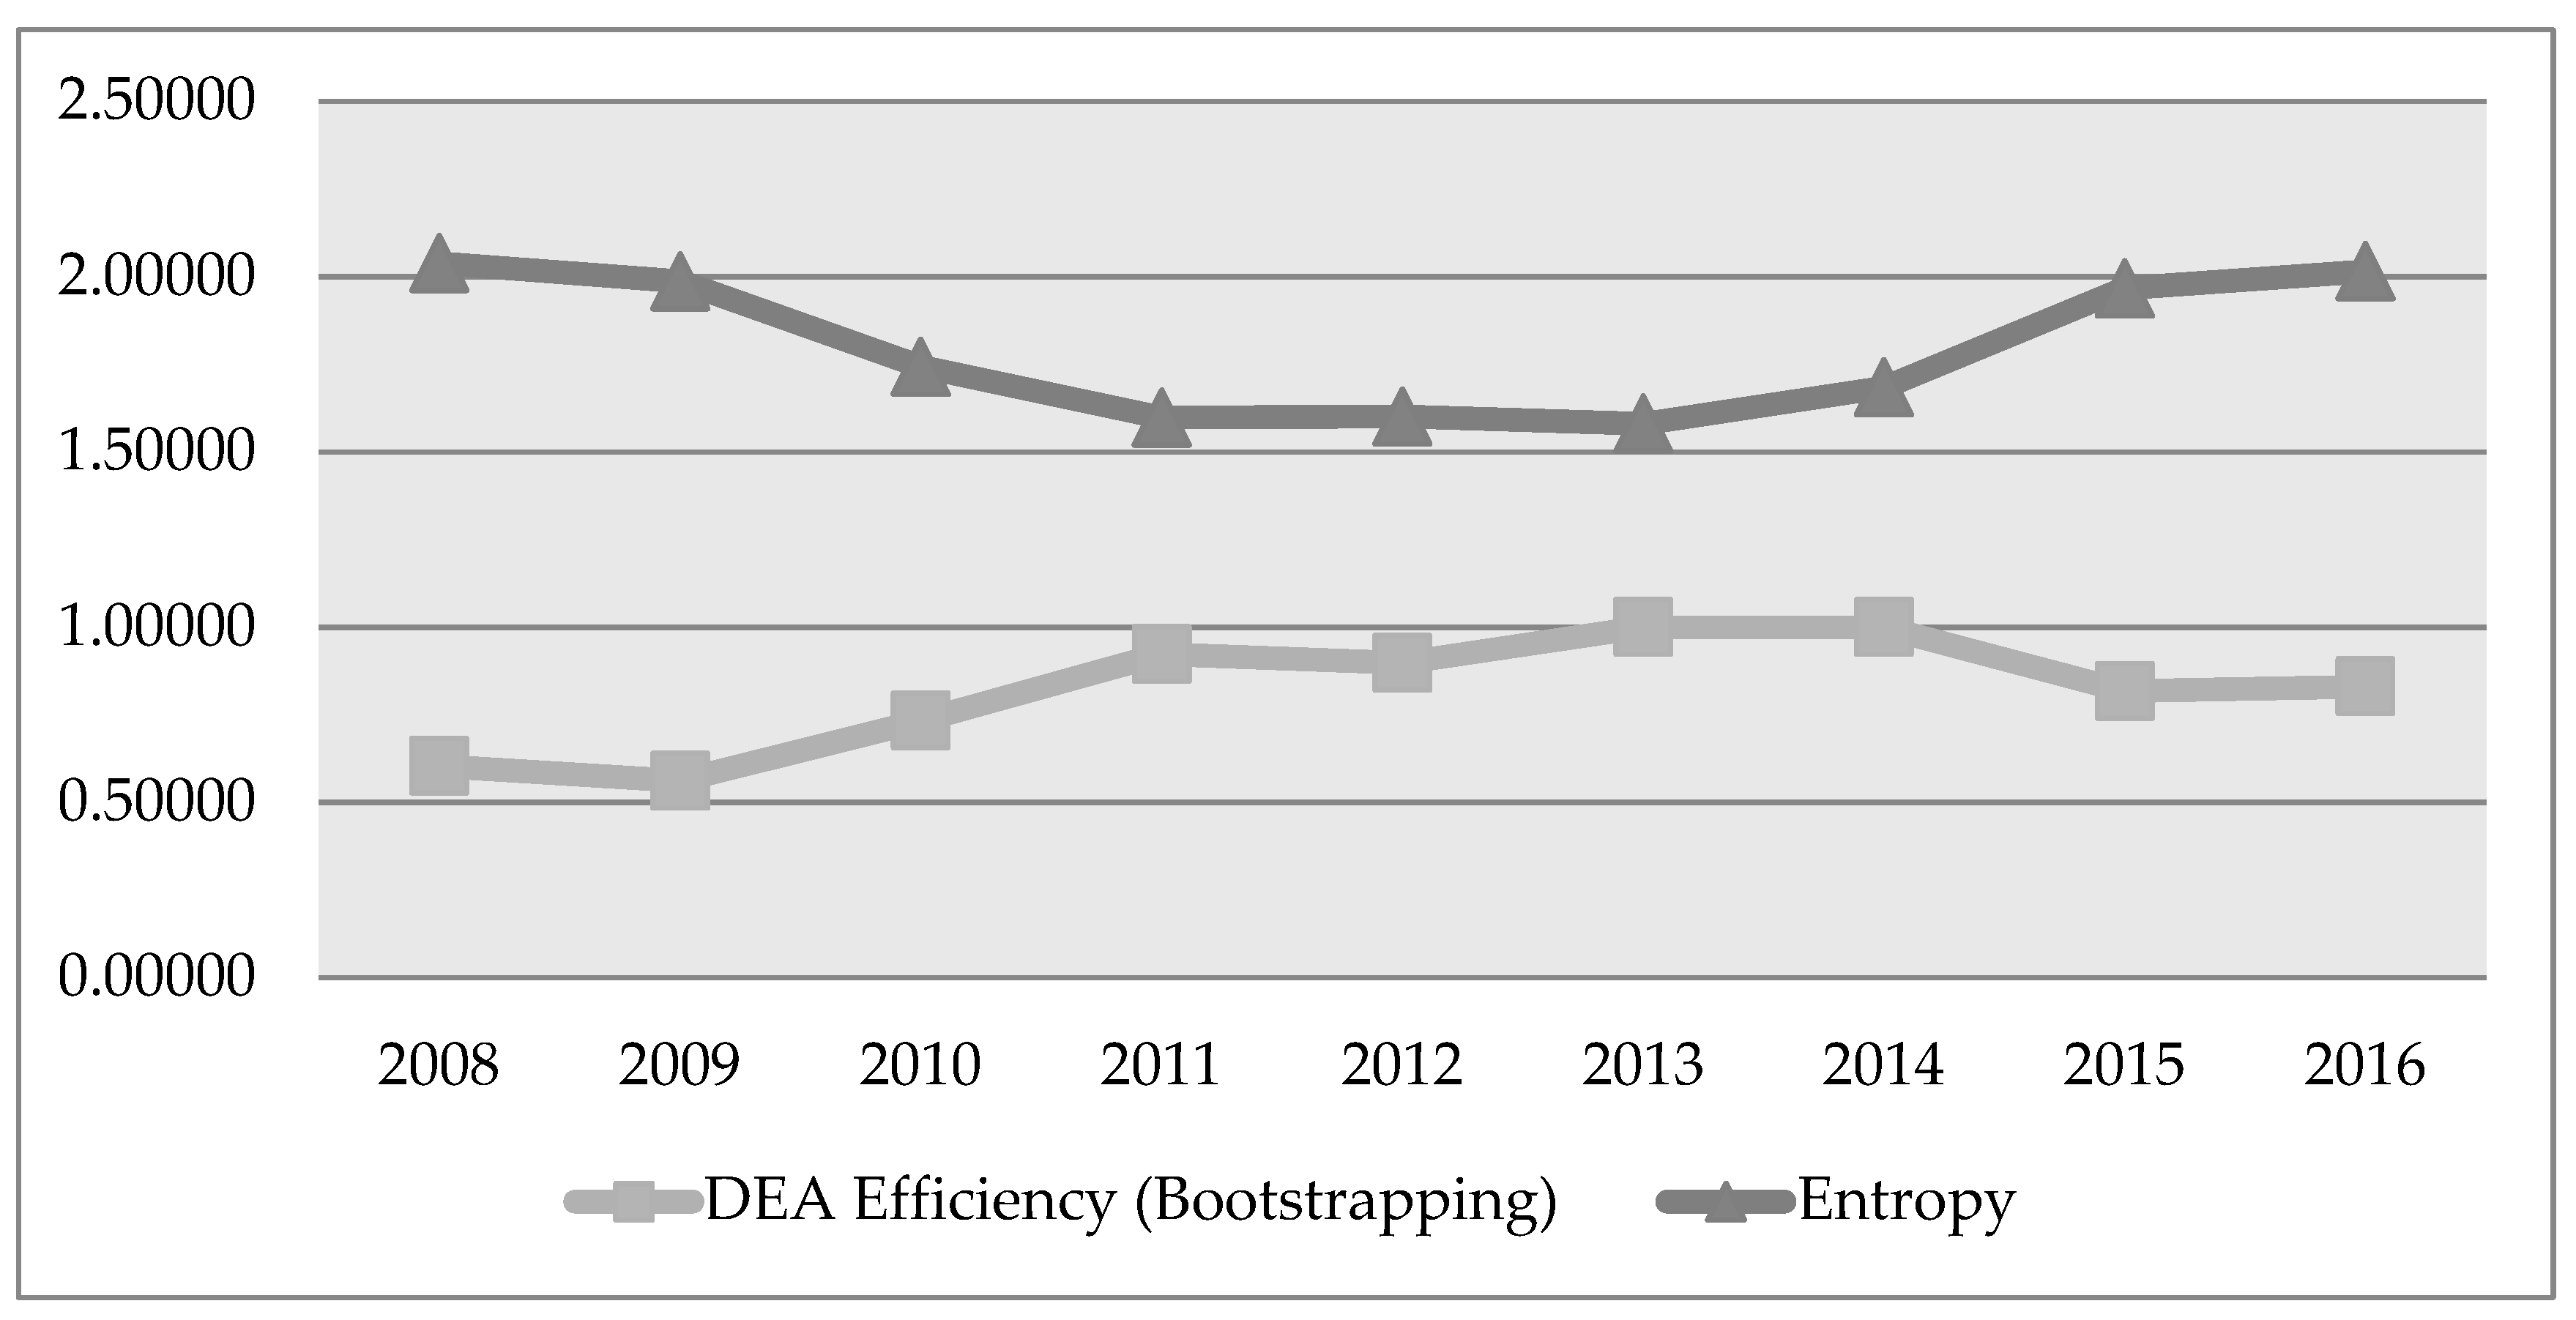
| Year | DEA-BCC Efficiency | Bootstrapping-DEA Efficiency | Entropy Index of Economic Diversification |
|---|---|---|---|
| 2008 | 0.68648 | 0.60396 | 2.04 |
| 2009 | 0.61839 | 0.56198 | 1.99 |
| 2010 | 0.82248 | 0.73357 | 1.74 |
| 2011 | 0.99921 | 0.92339 | 1.60 |
| 2012 | 0.91766 | 0.89850 | 1.60 |
| 2013 | 1.00000 | 1.00000 | 1.58 |
| 2014 | 1.00000 | 1.00000 | 1.68 |
| 2015 | 0.81936 | 0.81762 | 1.97 |
| 2016 | 0.83262 | 0.83097 | 2.02 |
| Scenario 1: Rapid Transition from the Gambling Industry to the Non-Gambling Industry ( High Relatedness Diversification Transition ) | Scenario 2: Stable Transition from the Gambling Industry to the Non-Gambling Industry | Scenario 3: Slow Transition from the Gambling Industry to the Non-Gambling Industry (Technology-Oriented Diversification) | ||||
|---|---|---|---|---|---|---|
| Gambling Industry | Non-Gambling Industry | Gambling Industry | Non-Gambling Industry | Gambling Industry | Non-Gambling Industry | |
| Gambling industry | 92.0% | 8.0% | 95.6% | 4.4% | 98.0% | 2.0% |
| Non-gambling industry | 0.5% | 99.5% | 0.5% | 99.5% | 0.5% | 99.5% |
| Economic growth rate | 7% | |||||
| Scenario 1: Rapid Transition from Gambling Industry to Non-Gambling Industry (High Relatedness Diversification Transition) | Scenario 2: Stable Transition from Gambling Industry to Non-Gambling Industry | Scenario 3: Slow Transition from Gambling Industry to Non-Gambling Industry (Technology Oriented Diversification) | ||||||||||
|---|---|---|---|---|---|---|---|---|---|---|---|---|
| Gambling Industry | Non-Gambling Industry | Gambling Industry | Non-Gambling Industry | Gambling Industry | Non-Gambling Industry | |||||||
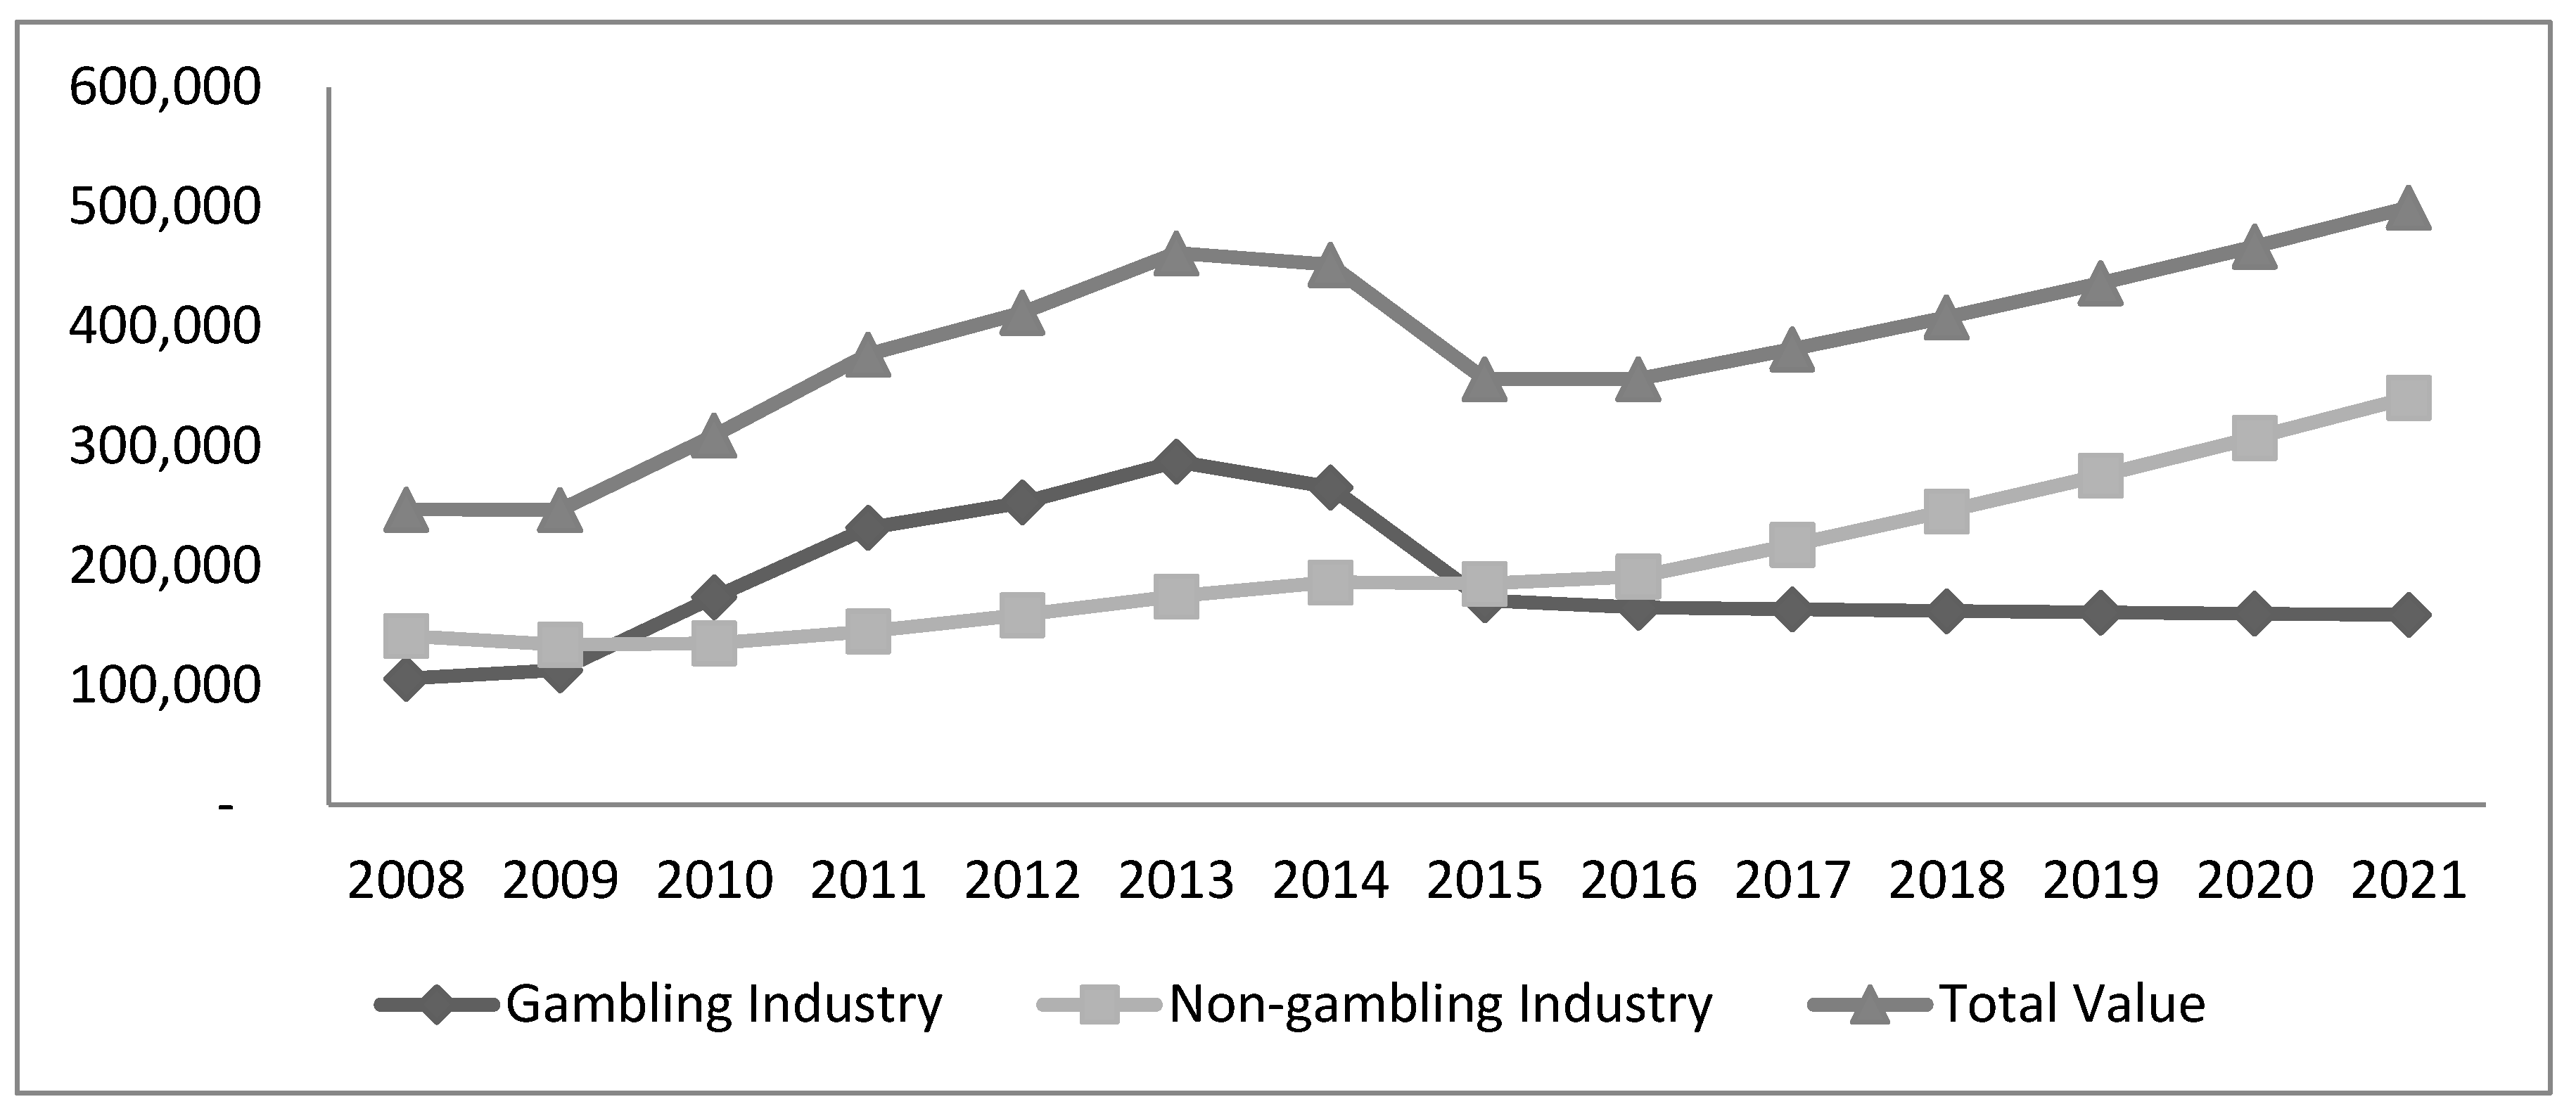
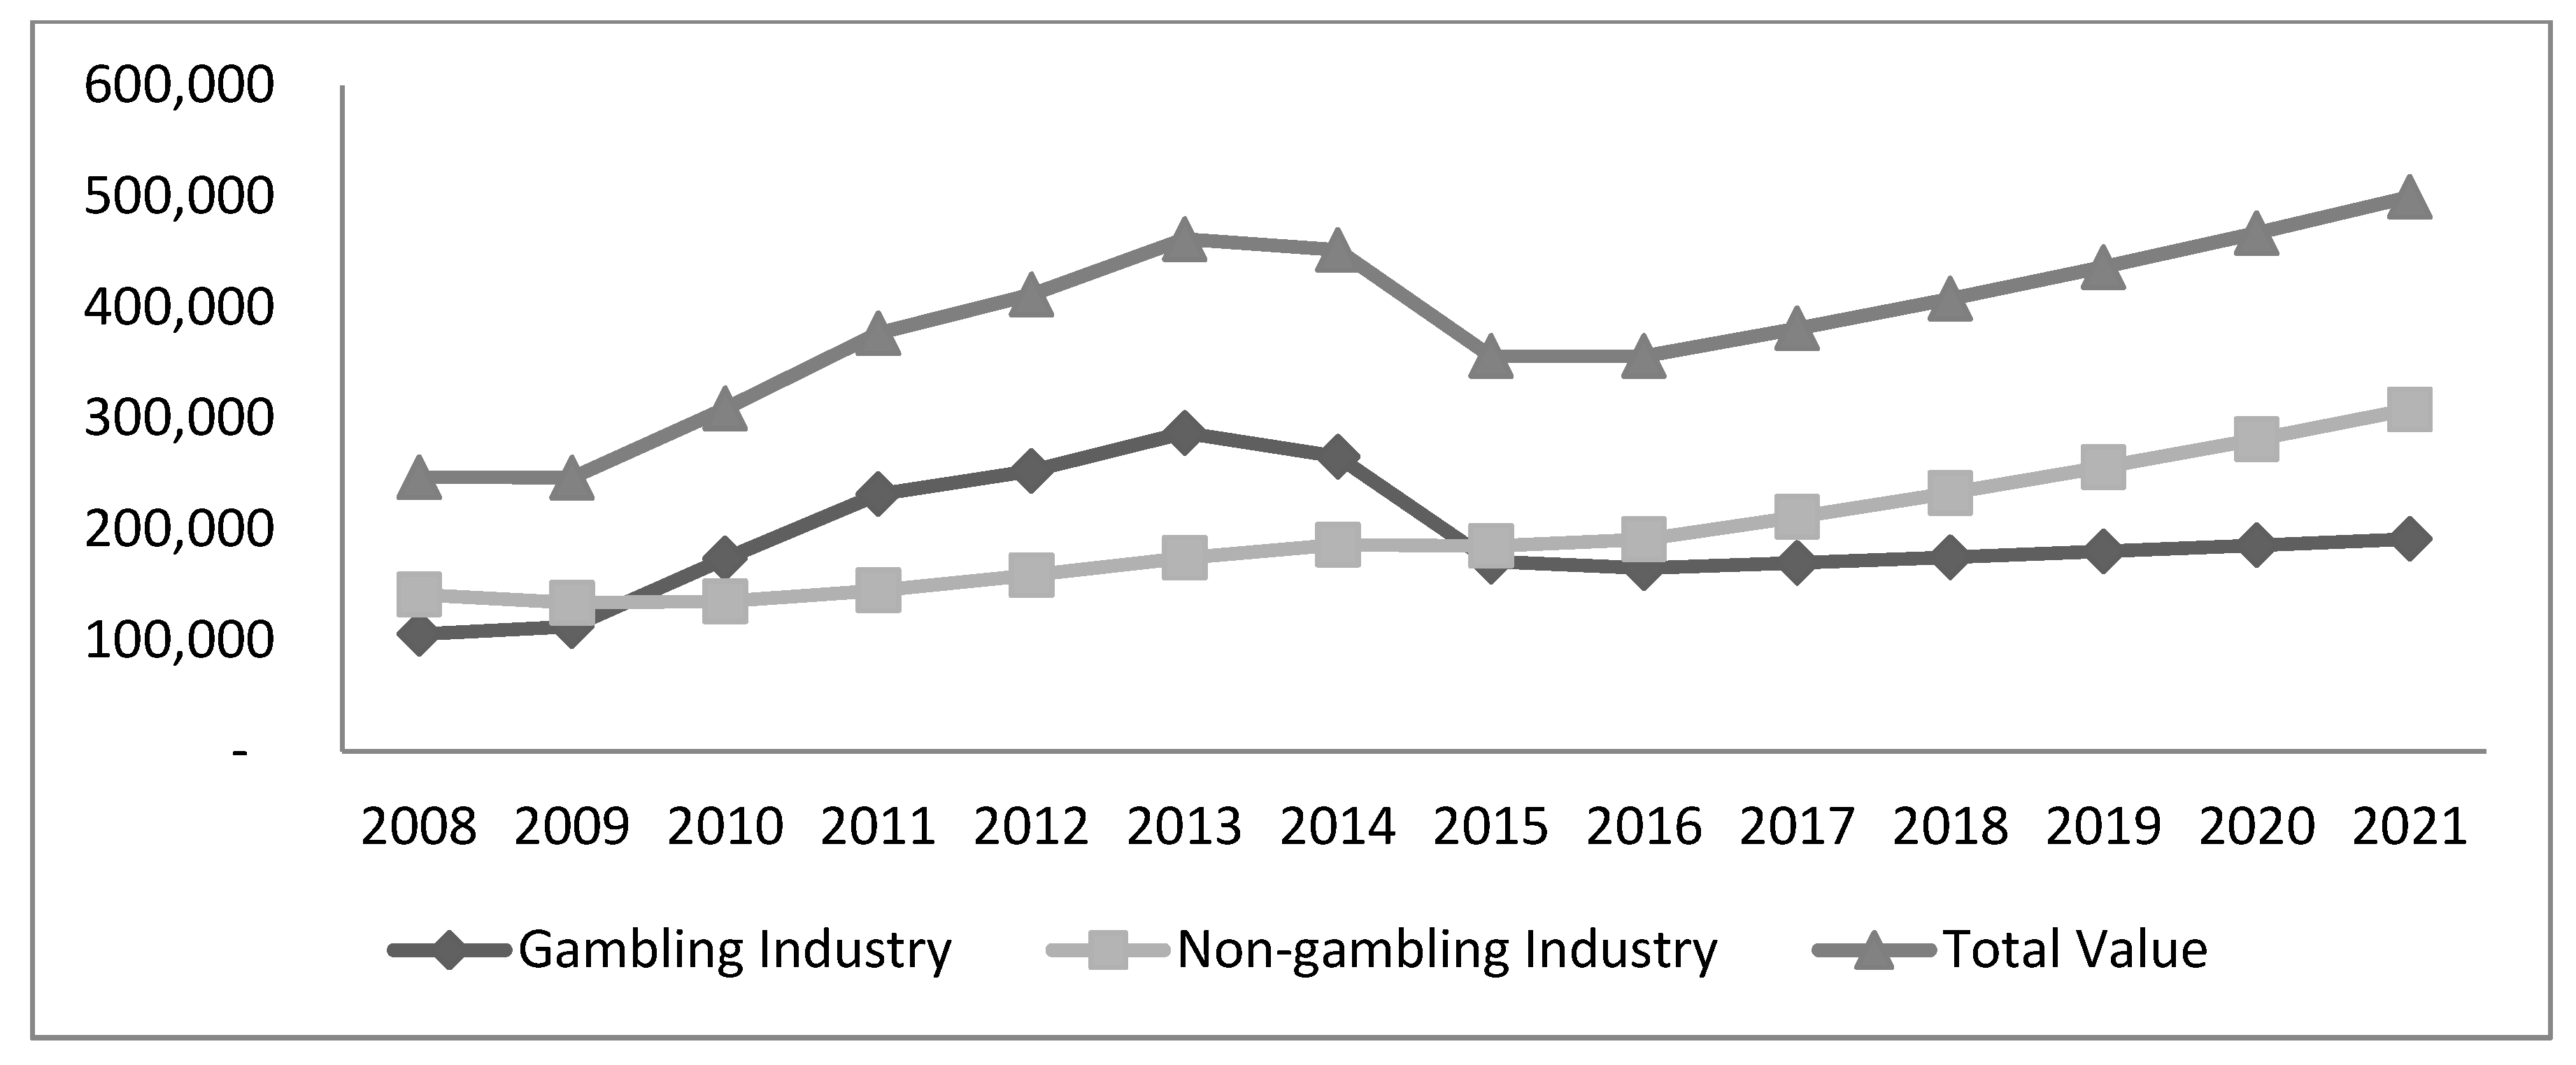
| 2008 | 105,717 | % | 141,340 | % | 105,717 | % | 141,340 | % | 105,717 | % | 141,340 | % |
| 2009 | 112,708 | 6.6 | 134,009 | −5.2 | 112,708 | 6.6 | 134,009 | −5.2 | 112,708 | 6.6 | 134,009 | −5.2 |
| 2010 | 173,772 | 54.2 | 135,239 | 0.9 | 173,772 | 54.2 | 135,239 | 0.9 | 173,772 | 54.2 | 135,239 | 0.9 |
| 2011 | 231,704 | 33.3 | 145,158 | 7.3 | 231,704 | 33.3 | 145,158 | 7.3 | 231,704 | 33.3 | 145,158 | 7.3 |
| 2012 | 252,773 | 9.1 | 158,832 | 9.4 | 252,773 | 9.1 | 158,832 | 9.4 | 252,773 | 9.1 | 158,832 | 9.4 |
| 2013 | 287,099 | 13.6 | 174,450 | 9.8 | 287,099 | 13.6 | 174,450 | 9.8 | 287,099 | 13.6 | 174,450 | 9.8 |
| 2014 | 265,689 | −7.5 | 186,168 | 6.7 | 265,689 | −7.5 | 186,168 | 6.7 | 265,689 | −7.5 | 186,168 | 6.7 |
| 2015 | 171,105 | −35.6 | 185,085 | −0.6 | 171,105 | −35.6 | 185,085 | −0.6 | 171,105 | −35.6 | 185,085 | −0.6 |
| 2016 | 165,094 | −3.5 | 191,126 | 3.3 | 165,094 | −3.5 | 191,126 | 3.3 | 165,094 | −3.5 | 191,126 | 3.3 |
| 2017 | 163,541 | −0.9 | 217,614 | 13.9 | 169,900 | 2.9 | 211,255 | 10.5 | 174,140 | 5.5 | 207,015 | 8.3 |
| 2018 | 162,154 | −0.8 | 245,682 | 12.9 | 174,925 | 3.0 | 232,911 | 10.3 | 183,711 | 5.5 | 224,125 | 8.3 |
| 2019 | 160,939 | −0.7 | 275,446 | 12.1 | 180,180 | 3.0 | 256,205 | 10.0 | 193,838 | 5.5 | 242,547 | 8.2 |
| 2020 | 159,902 | −0.6 | 307,030 | 11.5 | 185,681 | 3.1 | 281,251 | 9.8 | 204,556 | 5.5 | 262,375 | 8.2 |
| 2021 | 159,050 | −0.5 | 340,567 | 10.9 | 191,441 | 3.1 | 308,176 | 9.6 | 215,902 | 5.6 | 283,715 | 8.1 |
| Entropy Index of Economic Diversification (2021) | ||||||||||||
| 2.01 | 1.84 | 1.70 | ||||||||||
© 2019 by the authors. Licensee MDPI, Basel, Switzerland. This article is an open access article distributed under the terms and conditions of the Creative Commons Attribution (CC BY) license (http://creativecommons.org/licenses/by/4.0/).
Share and Cite
Choi, F.; Hon, C.T.; Mao, Y.H.; Lai, I.K.W. Sustainable Development for Small Economy and Diversification from a Dominant Industry: Evidence from Macao. Sustainability 2019, 11, 1626. https://doi.org/10.3390/su11061626
Choi F, Hon CT, Mao YH, Lai IKW. Sustainable Development for Small Economy and Diversification from a Dominant Industry: Evidence from Macao. Sustainability. 2019; 11(6):1626. https://doi.org/10.3390/su11061626
Chicago/Turabian StyleChoi, Fei, Chi Tin Hon, Yan Hua Mao, and Ivan Ka Wai Lai. 2019. "Sustainable Development for Small Economy and Diversification from a Dominant Industry: Evidence from Macao" Sustainability 11, no. 6: 1626. https://doi.org/10.3390/su11061626
APA StyleChoi, F., Hon, C. T., Mao, Y. H., & Lai, I. K. W. (2019). Sustainable Development for Small Economy and Diversification from a Dominant Industry: Evidence from Macao. Sustainability, 11(6), 1626. https://doi.org/10.3390/su11061626