Article

Assessing the Sustainability of High-Value Brands in the IT Sector

by
María Ángeles Alcaide
,
Elena De La Poza
* and
Natividad Guadalajara
Center of Economic Engineering, Universitat Politècnica de València, 46022 Valencia, Spain
*
Author to whom correspondence should be addressed.
Sustainability 2019, 11(6), 1598; https://doi.org/10.3390/su11061598
Submission received: 6 February 2019 / Revised: 6 March 2019 / Accepted: 11 March 2019 / Published: 15 March 2019
(This article belongs to the Special Issue Sustainable Financial Markets)

Abstract

:
Nowadays, companies have more freedom on how they can report their corporate social responsibility (CSR) actions and outcomes, despite them being increasingly important for how investors and shareholders can obtain knowledge about companies’ non-financial aspects. This is why more importance is being attached to sustainability rankings as an additional tool to seek excellence and distinguish between companies. The main objective of the present research was to analyze the degree of similarity in sustainability valuations among the most important open-access sustainability rankings that have appeared in the last decade (Green Ranking, RepTrack, Global 100 most sustainable corporations, and Finance Yahoo Sustainability). The secondary objective was to study whether these rankings incorporated the most de facto prestigious brands, and the third objective was to learn of the influence of the level of controversy in Finance Yahoo Sustainability scores in technological companies. Our results reveal wide variability among open-access CSR rankings. Not all the most valued brands appear in the sustainability rankings, which indicates the differences between the rankings of brands and CSR rankings. Finally, the level of controversy was found to be an important aspect in companies’ CSR scores.

1. Introduction

The concept of sustainability in the business world has numerous meanings. Indeed, some authors take the concepts of corporate social responsibility (CSR) and sustainability to be synonyms [1,2,3], while others consider that epistemological ones can be found among them [4,5,6,7]. Consequently, a new term which now appears in the scientific literature, corporate sustainability, is used to specify its differences and similarities in the business domain. In any case, sustainability is understood from three areas of action or dimensions, namely the “triple bottom line” or “triple result”: the economic area, the social area, and the environmental area [8,9]. This article uses this “triple result” definition to homogeneously interpret the terms of CSR and corporate sustainability.
Currently, some proposals to measure the CSR or corporate sustainability of companies and countries exist, which have been prepared by private companies, such as the American agency KLD Research & Analytics, Inc. However, the fact that so many CSR-related standards have been reported in the world implies heterogeneity and difficulty in assessing and comparing results. Notwithstanding, it is becoming increasingly more important to measure aspects such as commitment to society and the environment, as well as the transparency of companies. This is because they are key factors of competitiveness, of creating tools of value and excellence in management, and of points of differentiation [10]. As a result of the severe criticism and crisis that some of the world’s biggest and most recognized companies have gone through, groups of interest are seeking a new index of trust as a CSR reference.
This is why much importance is attached to the standards and guidelines that several world organizations prepare. The following is a list of some of the most outstanding ones, along with the year they were created: the Global Compact (a UN initiative created in 1999), the Green Book prepared by the European Commission (2001), the OECD guidelines (1976 and updates in 2011), the Global Reporting Initiative (GRI, 1997), the World Business Council for Sustainable Development (WBCSD, 1995), SA 8000 (1989), AA 1000 or Accountability 1000 (1996), ISO 26000 (2010), and the Ethos Indicators of CSR (1998).
Some studies [11,12] have analyzed the impact of CSR activities on the creation of companies’ value using the sustainability indices of private agencies like KLD, or the Chinese agency, Southern Weekend. Other studies have analyzed the influence of CSR on the value of brands and examined CSR in line with what this influence implies for interested stakeholders (customers, shareholders, employers, suppliers, and the community as a whole) [13], or whether their information about CSR significantly improves consumer attitudes about the brand and how they perceive its singularity [14]. Several other studies [15,16] have focused exclusively on analyzing the strong and weak points of sustainability indices by, for instance, empirically comparing private access indices in the USA (Dow Jones Sustainability Index (DJSI), Morgan Stanley Capital International and KLD Research & Analytics, Inc. Index (MSCI KLD 400 Social Index) and Financial Times Stock Exchange Index (FTSE4Good Index), and have obtained considerably different results [17]. Similar results on the divergence among sustainability rankings can be found in the literature [18,19]. Other works have analyzed only the DSJI to study the impact of its use (e.g., by including its logo in reports and on websites) in 24 Canadian companies on the Stock Exchange [20], or have evaluated the differences in the composition between DJSI Emerging markets and DJSI Developed markets (DJSI Europe and DJSI North America) [21].
In today’s international context, having open access to sources of information via digital media is essential for investors, and is even more so for companies because they are capable of increasing the value of their brands by diffusing their strategic policies, actions, results, and achievements. The four most popular CSR open-access rankings are published by Newsweek, Forbes or Corporate Knights, the Reputation Institute, and the financial server Yahoo Finance. These four agencies annually evaluate companies’ levels of CSR from 1% to 100% (from worst to best).
The main objective of the present research was to study the degree of similarity in the sustainability valuation that might exist among the open-access CSR rankings in companies with the most globally valued brands. The secondary objective was to study whether these rankings incorporated the most de facto prestigious brands, and the third objective was to know of the influence of technological companies’ controversy levels on the CSR ranking of Finance Yahoo Sustainability.
In this way, the study’s premises are: (i) Smaller differences in the scores granted to companies between CSR rankings generate more confidence on financial markets in the “triple result”, and consequently, free-access indices are more widely used when making investment and financing decisions; (ii) smaller differences between CSR rankings and brand rankings also means greater commitment of large companies for sustainability. Thus, the present work contributes to the literature by analyzing the open-access sustainability rankings that have not been studied to date. Companies from the technology sector (IT) were chosen, for which no previous work exists despite it being the most incipient sector in the economy, and one that has been revolutionizing markets and society worldwide, particularly since the 1990s [22]. It is also the sector that is growing the most in terms of both turnover and the number of companies.
This article is arranged as follows: Section 2 offers a background for understanding the selected sample and the objective set in this research. Section 3 describes the research objective, the methodology, and the sample and data employed herein. Section 4 presents the results. Finally, the discussion of the results and a few final remarks are provided.

2. Background

2.1. Brands and Brand Valuation

A brand is usually associated with a name, term, signal, symbol, design, or a combination of some of these, which identifies the company’s products and services, and differentiates it from its competitors [23]. Keller uses a similar definition by stating that whenever a marketer creates a new name, logo, or symbol for a new product, a brand has been created [24]. Understanding the factors that affect the reputation of a brand and its value is crucial for managers.
In the international literature, the techniques which are followed for the assessment of brands are classified according to the perspective or purpose of the valuation. In this way, methods for valuing brands can be grouped into two main categories:
(1) Marketing perspective or consumer perception: These models provide an index of the brand’s value using qualitative variables. From this perspective, it is important to take into account the relationship of trust built between the brand and its consumers [25,26,27,28,29].
(2) The economic-financial perspective: This provides the brand with a quantitative value through economic-financial variables. There are generally four main approaches to classifying economic-financial brand valuation methods—according to their basis market [30,31,32], costs [33], incomes [34], or mixed methods [35].
However, the vast majority of studies use a combination of both methods [30,36] by combining qualitative and quantitative variables, because no consensus about methodologies exists.
The importance of providing a brand with a monetary value allows international consultancy companies to develop their own methods for valuing brands by performing annual rankings that are recognized worldwide. These rankings are used by authors as a basis to build their own brand valuation models [37,38]. The best-known consultancy companies are the British Interbrand [39], the American Millward Brown [40], and the British Brand Finance [41]. These three agencies employ mixed valuation methods by combining economic-financial information with qualitative variables, as discussed in Section 3, and their valuations are used in this work.
In this study, we paid attention to the IT industry, an emergent sector that covers a myriad of processes and services, and products as well. Thus, the technological and digital revolution has led to new companies arising that provide solutions, but also adjust any existing ones whose brands are top-ranked by the three major consulting groups.
In this way, the considerable importance of this study for investors and creditors is shown because companies with very valuable intangible assets in the business world are analyzed, as is the possible impact that their CSR actions can have on the brand’s value.

2.2. Sustainability and Brand Value

Many companies have been found to consider sustainability to be used to contribute to society, but also to make financial profits and gain an advantage over competitors. However, several researchers on sustainability and corporate financial performance (CFP) suggest that findings on this are inconclusive [42,43]; other researchers show that the overall effect is positive, but small, and then conclude whether, apart from striving to do no harm, companies have grounds for doing good [44]. Other studies show that corporate sustainability correlates positively with CFP [45,46], and the basic premise is that CSR improves financial performance by improving a firm’s relationships with its major stakeholder group [47]. The literature generally shows that there is a positive relationship in mature markets, especially in the banking industry, but there is less evidence for its impact on other sectors [48].
In addition, the link between what companies really do in sustainability terms and how consumers see it is unclear [49], and it depends on not only reported information, but also on brand reputation.
Accordingly, the literature has investigated the relationship between sustainability and brand reputation. A good brand reputation is an important strategic asset because it distinguishes a company from its competitors [50]. Many companies use CSR as a strategic tool to respond to stakeholder expectations and, thus, to create a favorable corporate image [49], which is why managers seek to implement CSR activities with their business strategy [51]. Thus, the CSR must be considered as a strategic investment to create or maintain one’s reputation [52].
Moreover, the relationship between brand value and reputation has also been studied. The results indicate that a good reputation can improve brand value, and brand equity as the brand value is created to meet the expectations of shareholders (not just customers), and what shareholders expect is a company with a good reputation [49].
These relationships between sustainability and brand reputation, and between brand value and reputation, contribute to positively and significantly link corporate sustainability and brand value.
Likewise, the way in which sustainability information is reported also makes a huge influence, especially nowadays with the growing impact of digital communication. Despite this growing amount of attention being paid to both the academic and business communities, models to analyze and evaluate online sustainability communication have not yet been developed [53]. However, it is important to communicate the commitment to corporate sustainability to stakeholders because a sustainable business approach cannot be implemented without effective communication, which aims to share CSR values with stakeholders [54].
It is true that the new digital era has changed the ways in which an organization can communicate with its shareholders or with society, and that these new digital tools have empowered networks to contribute to discussions on CSR, and with them, to bring about some changes between citizens or society and organizations. That is why several authors [55,56] have paid attention to the true dialog that must exist between a company and its shareholders in order to communicate the reality about CSR actions, and not only what they (shareholders) want to hear [57]. However, only a few companies are ready to hold open conversations on topics that stakeholders and civil society wish to discuss [57].
Although this digital revolution affects the way CSR is communicated, sustainability reports are the communication medium most widely used by companies to report their economic, environmental, and social impacts [58], and many organizations include these reports on their websites. In fact, better communication of companies’ sustainable behavior improves its reputation [59] and, therefore, this can also improve the brand value.

2.3. Sustainability and Controversial Industries

Corporate sustainability, or CSR, has recently been gaining much importance within companies. In fact, it seems like all large companies nowadays are taking special care to report this information [58] and to improve their CSR activities, and it is particularly important for the industries considered to be controversial [60].
Wilson and West [61] initiated studies on controversial industries by linking their concept with the controversial product, defined as
“products, services, or concepts that for reasons of delicacy, decency, morality, or even to fear to elicit reactions of distaste, disgust, offense, or outrage when mentioned or when openly presented”. Later, other ideas were incorporated into this concept, such as controversial advertising “by the type of product or execution, [which] can elicit reactions of embarrassment, distaste, disgust, offence, or outrage from a segment of the population when presented.”
[62]
Some typically identified controversial industries are tobacco, gambling, alcohol, abortion providers, and health- or sex-related products [63]. However, the identification of other industries is less obvious, such as the chemical and pharmaceutical, petroleum, transport (including automobile and airline), utility and resource industries, and the steel industry [64]. In these cases, the degree of controversy may vary according to the product or business [65].
Some studies have linked controversial industries with CSR communication or sustainability that companies get involved in by concluding that US [66] and German companies [65] included in the controversial sectors consider CSR to be important, even though their products are harmful to the environment and society. Logically, these companies work more actively to communicate CSR by using it as a strategy to mitigate the level of controversy [60]. Controversial industries use the majority of their CSR reports to communicate their socio-community activities, while uncontroversial industries devote a considerably bigger share to communicate their environmental activities. This suggests that controversial companies place more emphasis on the actions in a given area to compensate for the damage caused in other areas that is inherent to their main business [67].

3. Materials and Methods

3.1. Methods

To study the degree of similarity in the sustainability valuations that open-access CSR rankings make of technology companies with the most valued brands over time, a descriptive and graphical statistical analysis was done of the scores that each company obtained in the four open-access CSR ranking agencies.
Linear regression by Ordinary Least Squares (OLS) was applied, where the dependent variable was the companies’ score in each ranking and year, and the explanatory variables were the four rankings, defined as dummy variables (with 1 being if the ranking scored a company within this year, and 0 being otherwise). In addition, indicators of the company’s size and performance were included as control variables. Size was measured by total asset (millions in $) and the number of employees in each tax year (these two variables were obtained from companies’ annual accounts for the years 2010–2018). Performance was measured by market capitalization (market capitalization = share market price x number of shares).
The equation of the model is expressed as follows:
Yij = α + β1 Green Rankingij + β2 RepTrakij + β3 Global 100ij + β4 Finance Yahoo Sustainabilityij + β5 Total Assetij + β6 No. Employeesij + β7 Market Capitalizationij + ε
where:
  • Yij: Score of company i (i = 1 to 13) in the year j (j = 2010 to 2018).
  • α: Constant term.
  • βm: Coefficients of the explanatory variables.
  • ε: Random disturbance term.
Different regression models were obtained for all the companies as a whole, for each separate company and for each individual year.
Finally, in order to know the influence of the controversy level in the technological sector on the ranking scores of Finance Yahoo Sustainability, another model was obtained by OLS regression. This third objective was applied only to the Finance Yahoo ranking for 2018, as it is the only one that provides this indicator among the four rankings studied herein. The indicator’s five levels were transformed into five dummy variables (with 1 being if the company has that level of controversy, and 0 otherwise). The equation of this model is expressed as follows:
Yi = α + β1 Level of controversyi1 + β2 Level of controversyi2 + β3 Level of controversyi3 + β4 Level of controversyi4 + β5 Level of controversyi5 + ε
where:
  • Yi: Score of company i (i = 1 to 13) in Finance Yahoo Sustainability.
  • α: Constant term.
  • βm: Coefficients of the explanatory dummy variables.
  • ε: Random disturbance term
The models’ goodness of fit was measured with the adjusted R2 and the Student’s t. The error considered levels were 0.5%, 1%, and 5%. Multicollinearity was measured with the condition index (CI) and the variance inflation factor (VIF).

3.2. Sources of Information

For our study, the selection of companies belonging to the IT sector was based on the brand value criterion, using the ratings of the rankings published by Intebrand, Millward Brown, and Brand Finance. These three consultancy firms only analyze companies whose brands are global, visible, growing, and relatively transparent with financial results. These companies only publish the top 100 brands according to their rankings. Given their relevance, these brand valuation rankings have been previously used in other studies [68].
It is notable that these three consultancy companies employ mixed valuation methods. Interbrand uses a mixed model of discounted cash flows, along with marketing methods. Millward Brown publishes the ranking Brand Z and uses a mixed model between marketing variables and the Millward Brown Optimor. Brand Finance combines market approaches (royalty-based methods) with the brand strength associated with these approaches. Therefore, these three agencies combine economic-financial information with qualitative variables. These qualitative variables measure the strength of the brand and how consumers perceive it, which is what Interbrand calls “brand strength” (a measure of the ability of a brand to create loyalty), and what Millward Brown calls “brand contribution” (which assesses the ability of brand associations in consumers’ minds). However, neither of these agencies include environmental or social performance variables, which constitute the other two CSR dimensions, along with the economic-financial dimension. Only the company Brand Finance was found to calculate the “Brand Strength Index” using a balanced scorecard of a number of relevant attributes, such as emotional connection, financial performance, and sustainability, among others. The weight of “sustainability” is diluted among the other variables used to calculate this index, which is then multiplied by the royalties tax.
The brand value criterion for selecting the companies in the sample are companies that have been in the top 100 in at least two rankings published by Interbrand, Millward Brown, and Brand Finance between 2000 and 2018 (inclusive). This requirement was met by 13 companies, which made up our study object sample—namely: Accenture, Apple, Cisco, Facebook, Google, HP, IBM, Intel, Microsoft, Oracle, Samsung, SAP, and Sony.
To facilitate understanding of the importance attached to the value that brands take in companies, especially in the companies selected for the present work, Table 1 shows the evolution of the mean brand values of all 13 of the studied companies. The mean brand value was obtained as the means of the valuations made by Interbrand, Millward Brown, and Brand Finance for each year from 2010 to 2018.
Table 1 shows how all 13 companies obtained very high values and whose values increased with time, except for Sony, IBM, and HP. Apple leads the Interbrand, Millward Brown, and Brand Finance rankings in all the sectors by occupying either first or second position between 2012 and 2018. It is followed by brands Google, Microsoft, and Facebook, which have also appeared in the top 10 of these rankings in recent years, and were higher up than the most prestigious brands in other economy sectors.
According to the Global Industry Classification Standard (GICS), the 13 selected companies came from different industries, but appeared more (with four companies) in “consumer electronics” (Table 2). According to their location, nine had their headquarters in the USA, two in Europe, and two in Asia. Differences in their ages also appeared (the oldest was created in 1911, the youngest in 2004), as they did in economic results. Their size was measured as their amount of assets and number of employees. It is noteworthy that the companies belonging to the “IT services” industry required more employees, such as Accenture or IBM, while, conversely, the “internet, content, & services” industry employed fewer workers, such as Facebook. Some companies stood out for several reasons: Apple for its amount of assets, net income, and market capitalization; Microsoft for its total number of outstanding shares; and Google for its price to earning ratio (PER) and earnings per share ratio. (EPS). All this information was valid on 31 December 2017.
The four open-access CSR rankings employed (2018) herein are described in order of age:
Newsweek classifies the biggest companies in corporate sustainability or environmental impact terms as a ranking. This list is known as the “Green Ranking” and has been published continuously ever year since 2010, except for 2013. The “Green Ranking, Global 500” assesses the sustainable performance (measured in environmental terms) of the 500 biggest companies worldwide, according to their income and whether they were on the Stock Exchange on December 31 of each year. This ranking exclusively employs environmental indicators [69].
Reputation Institute classifies those companies with the best reputation in CSR matters worldwide. Its ranking, known as “CSR RepTrak”, has been published since 2012 and lists the top 100 companies with the best reputation [70].
The financial Finance Yahoo portal includes Environment, Social, and Governance (or ESG) scores of more than 2000 companies on the Stock Exchange [71]. Such information provides a given company’s numerical score for all three ESG categories, as well as its overall score. It also graphically presents information, which is compared with the averages of either their category or industry over time, and indicates their level of controversy. The level of controversy is measured by identifying the companies involved in incidents and events that may have a negative impact on the interested parties, the environment, or a company’s operations. This is scored on a scale from 1 to 5, where 1 indicates a low level, 2 a moderate level, 3 is significant, 4 is high, and 5 indicates the gravest or most serious controversy, with the strongest potential impact. The Yahoo Finance Sustainability ranking was published for the first time on 1 February 2018, but has included data of each company since 2014. However, the level of controversy is available only for the current year. The methodology that it employs was developed by Sustainalytics, a leading independent world supplier of corporate governance and ESG research works and scores. This is further proof that investors at all levels look beyond the conventional financial risk, and consider the risk of investing in ESG to better assess companies’ performance from many angles.
Forbes has published the “Global 100 most sustainable corporations”, also known as “Global 100” [72], from 2015 to 2018. This ranking was named one of the best CSR rankings in 2017 and 2018, and has been prepared by the company Corporate Knights since 2005. The objective of creating this index was to design a methodology to quantitatively compare and classify the largest public companies in the world (with a minimum income of 1000 million US dollars). In 2018, it employed 15 indicators, of which five are environmental and 10 are corporate.
The 13 brands selected for our sample were not equally present in the four open-access CSR rankings, and the years that the four rankings have been available also differed. This provided 266 data for the series of scores obtained by the four rankings for our selected sample of 13 companies. The values of the rankings to be analyzed corresponded to the period between 2010, which was when the first ranking was published (“Green Ranking”) and 2018. The data distribution is shown below in Table 3 and Table 4 for years and companies, respectively.
The years with the most information were the more recent ones, except for 2018, as some rankings had still not published their classification when the present study was conducted. The first years provided less information because most public rankings still did not exist at that time. The presence of different technology companies was similar, with a mean of 8.2%. The least present companies were SAP and Facebook because they were included in fewer rankings (Facebook appeared in only two) and in fewer years.

4. Results

4.1. Descriptive Analysis

A descriptive analysis was firstly carried out (Table 5) of the scores obtained jointly by the 13 companies from the technology sector in the four open-access CSR rankings.
The mean scores were similar: “Green Ranking” and “RepTrack” came close to 60%, and “Global 100” and “Finance Yahoo Sustainability” came close to 70%. Thus, it can be stated that the technology sector companies have a mean RSC index of 60–70. However, none of these four CSR indices coincided in terms of maximum and minimum scores. This is due to the methodology used, the number of companies studied, and the years analyzed (Table 6). The “Green Ranking” is the oldest and, therefore, includes more years—and as seen below, there have been differences over time, as well as the inclusion of more companies (top 500), meaning that its range is wider. Finance Yahoo Sustainability follows in terms of the number of valid cases and rank, with it being 63 and 45, respectively. This is because, despite being quite recent (since 2014), it analyzes more than 2000 companies and, thus, the sample included the 13 companies. The smallest number of analyzed valid cases, 20, corresponds to “Global 100”, and its range is 25.42 because it includes the fewest companies in our sample in its Top 100 ranking, as it has been publishing for a fewer number of years. Finally, the narrowest range corresponds to RepTrak, which, despite having published its ranking since 2012, employs a completely different methodology to the other rankings, and obtains values through surveys with a panel of experts, who could make more subjective and homogeneous assessments.
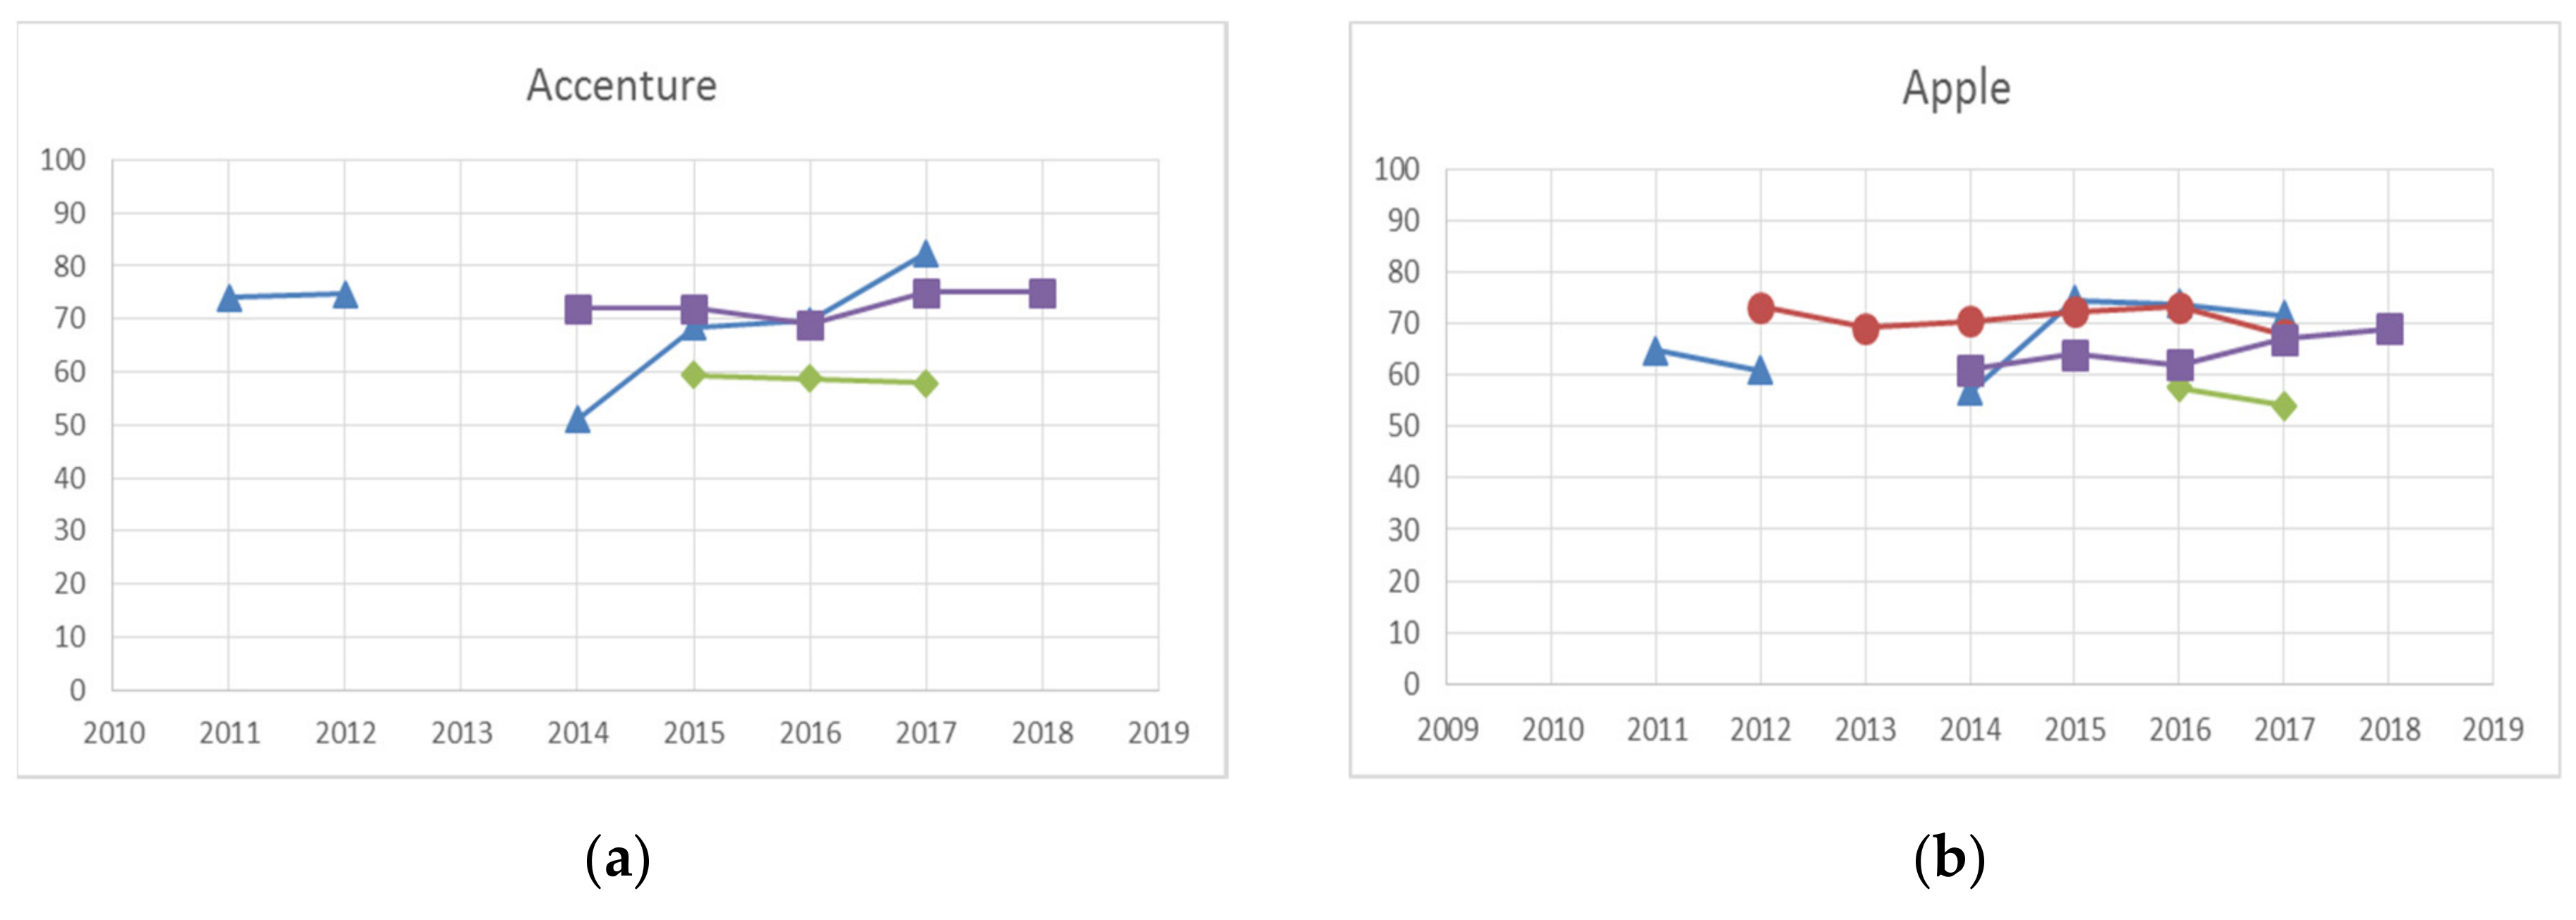
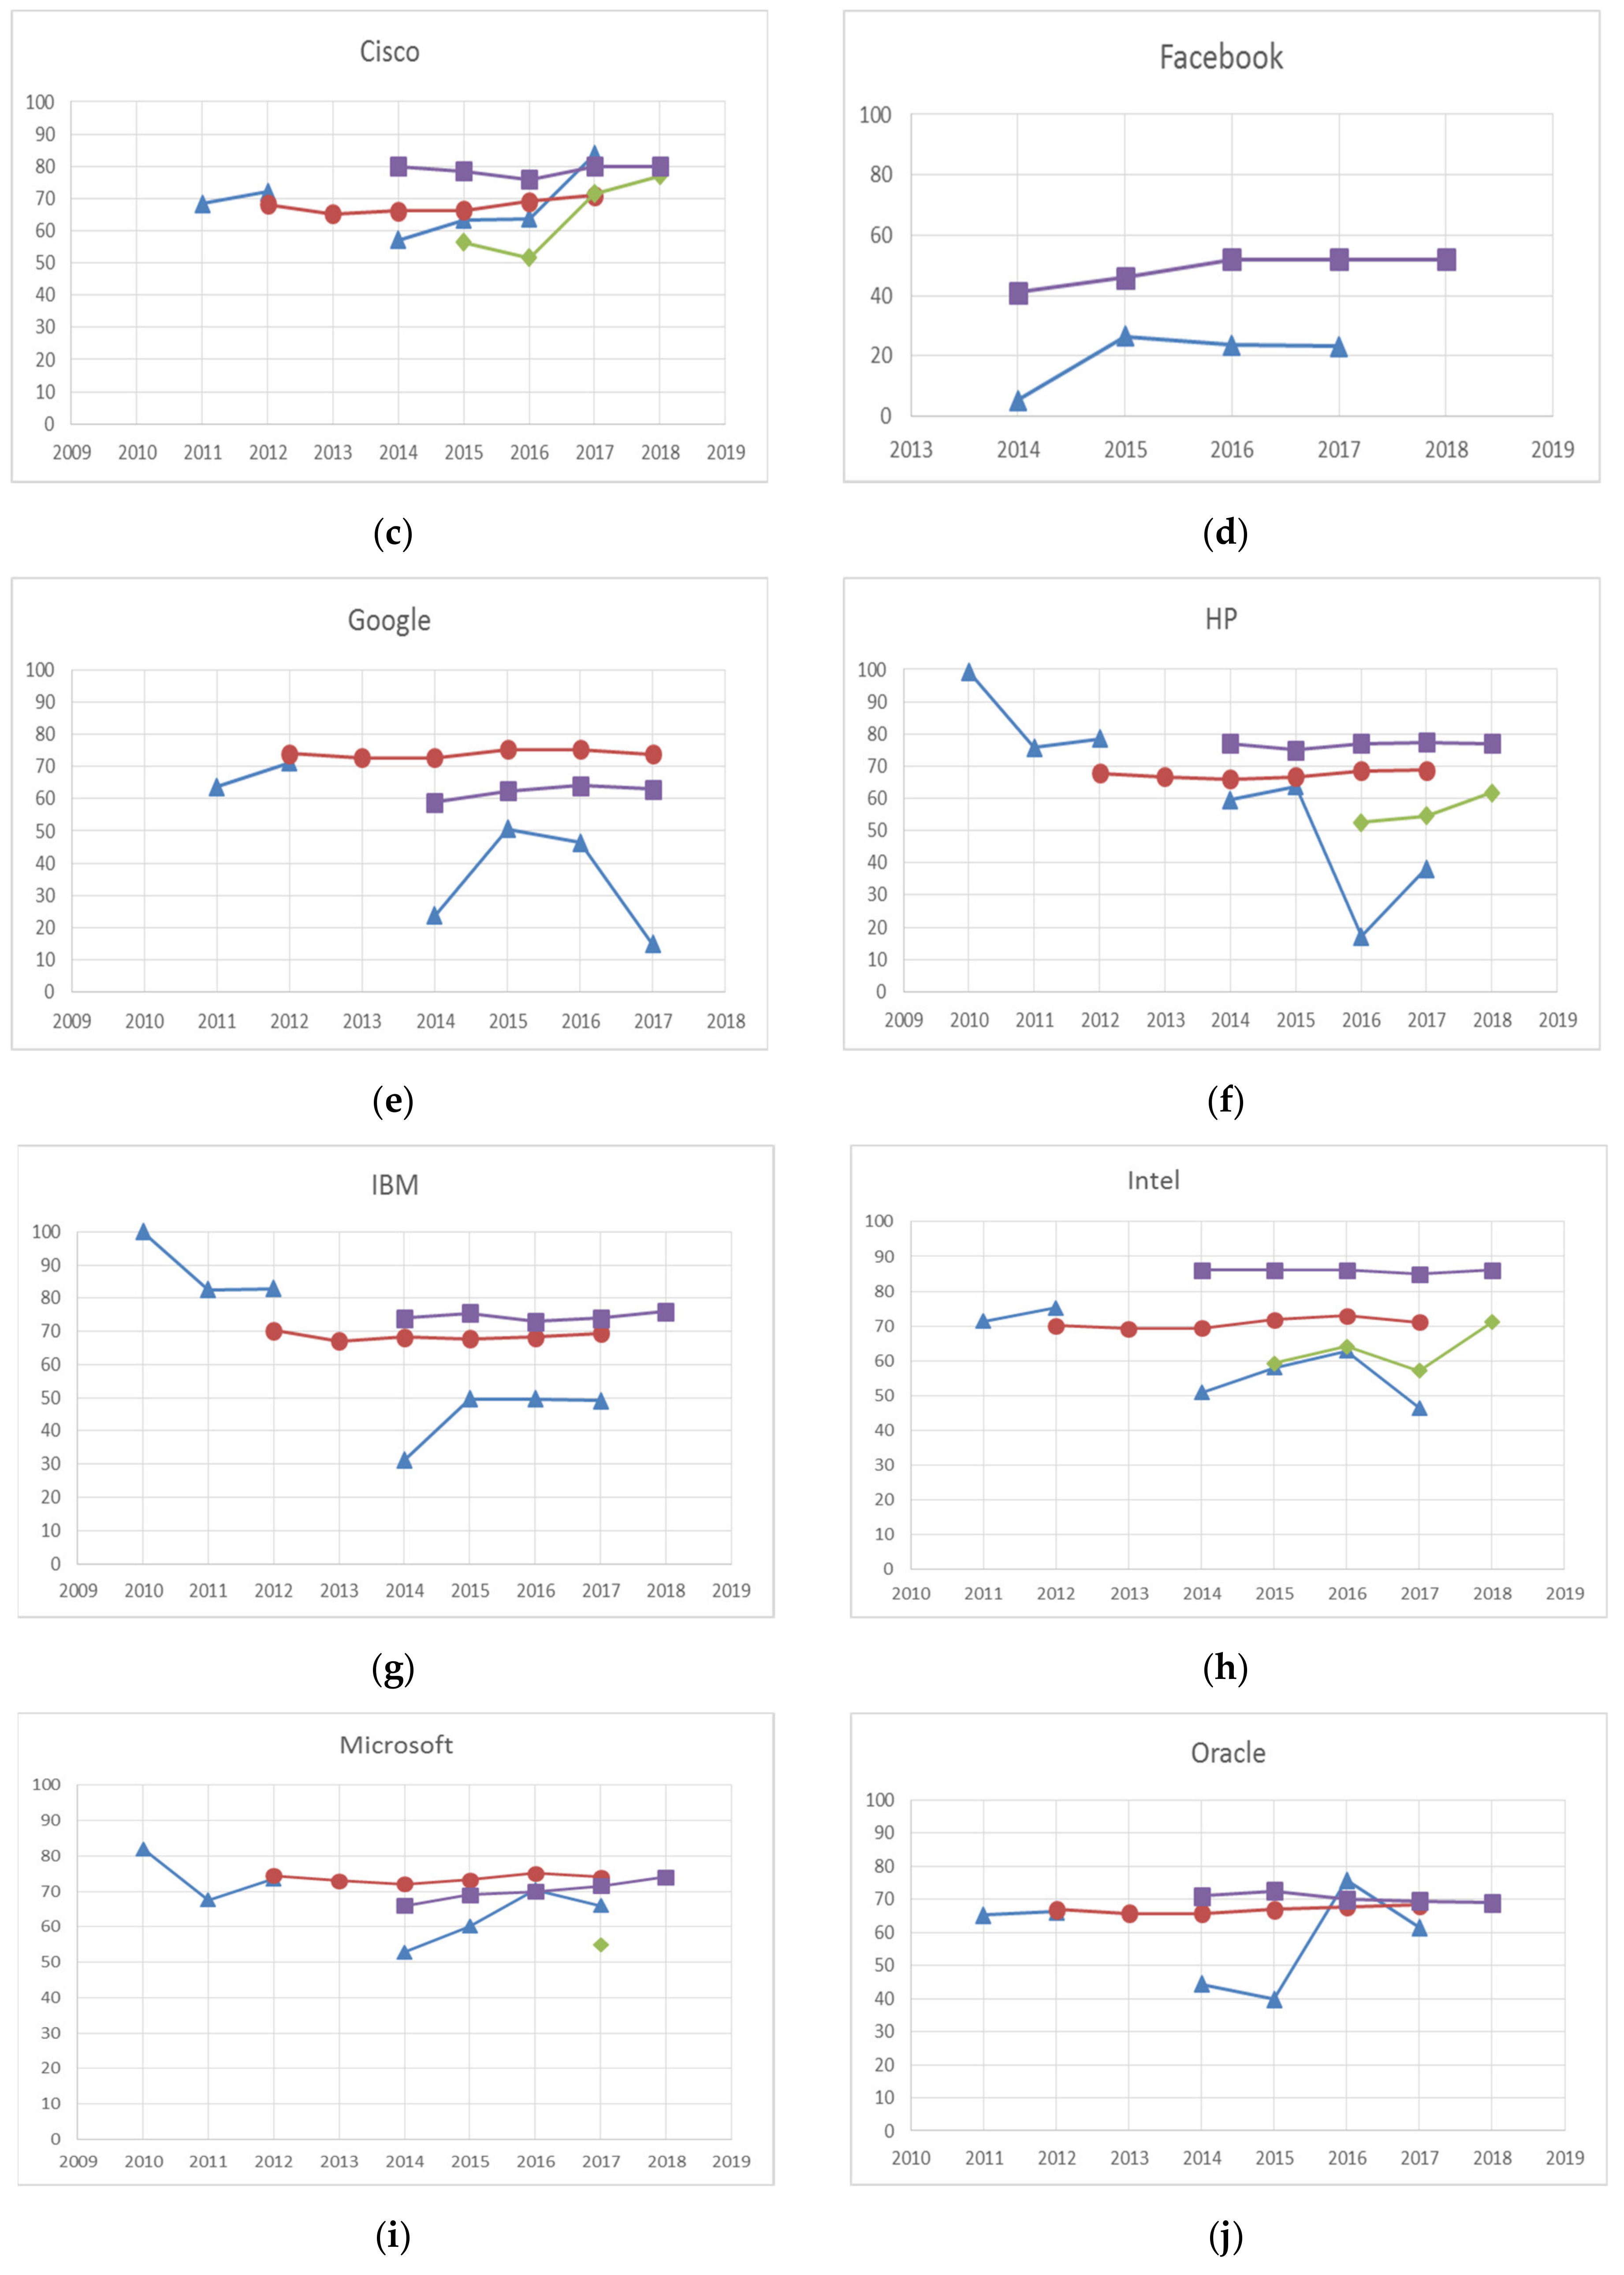
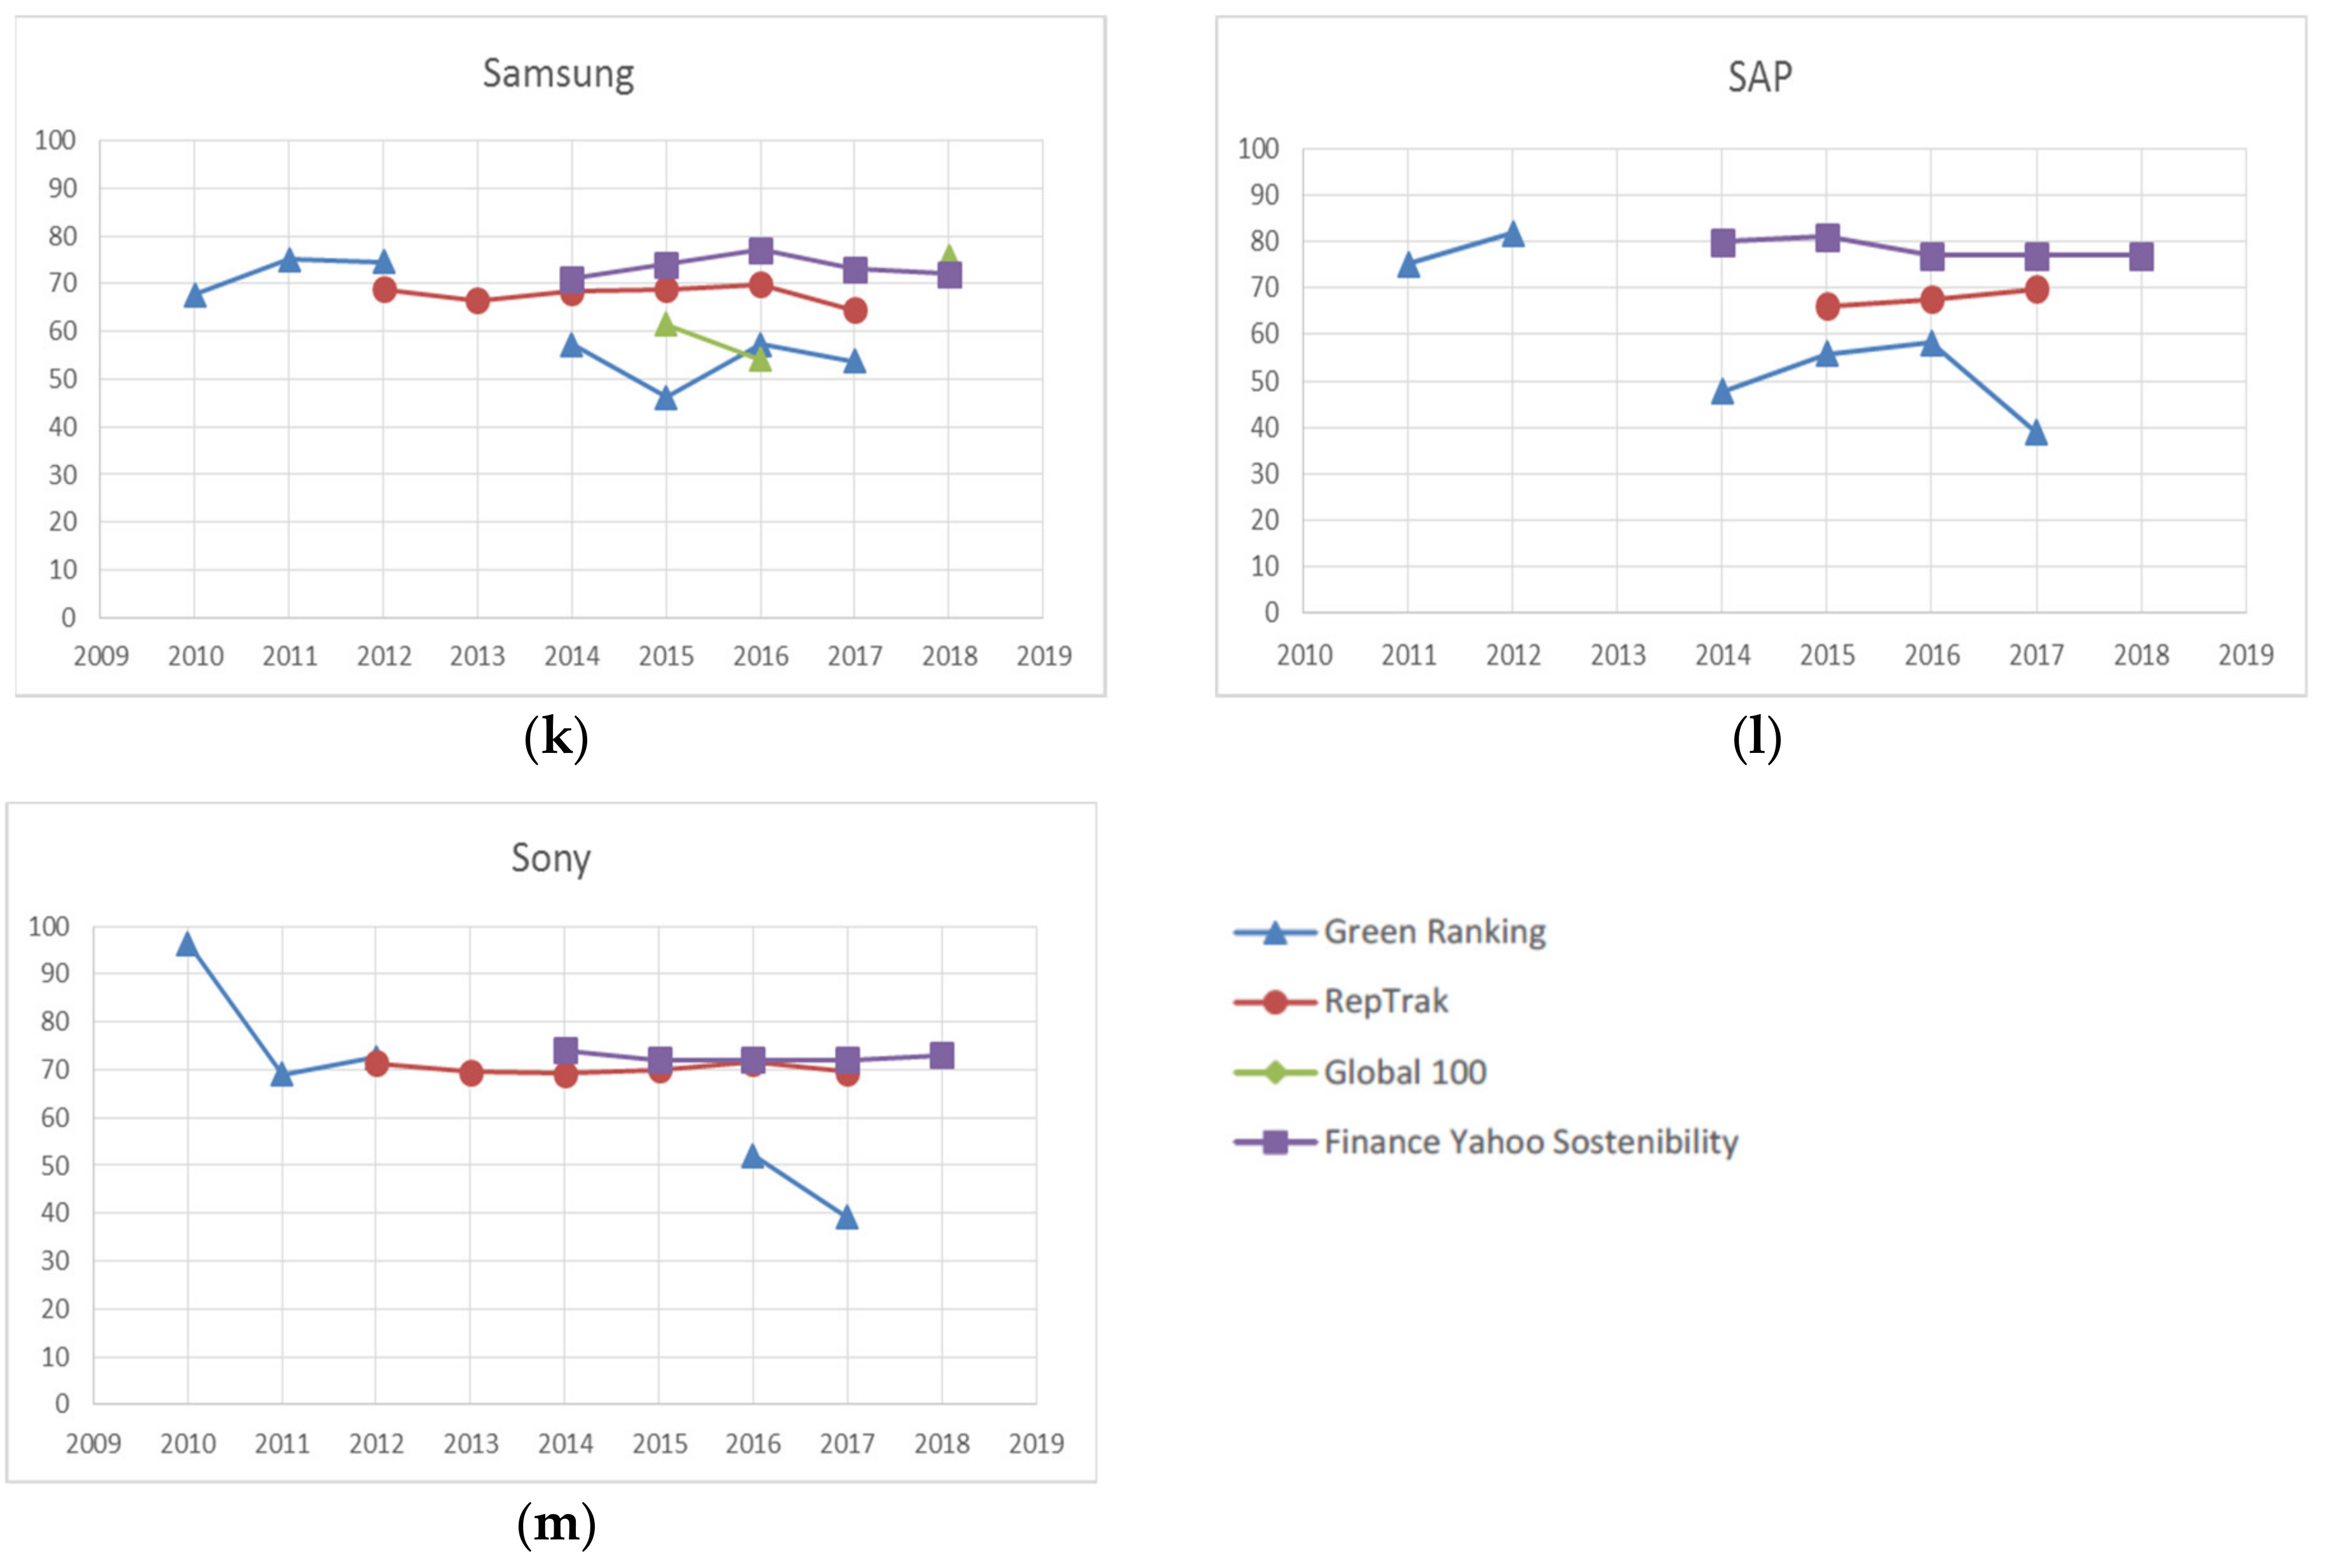
Some companies did not appear in any ranking for any studied year. This was the case for Accenture and Facebook, because they did not appear in “RepTrack” (Figure 1). The “Global 100” index did not include six of the 13 companies in any studied year—namely, Facebook, Google, IBM, Oracle, Sap, and Sony. Therefore, the number of companies assessed in the four rankings in any study year was 53.84%.
Marked discrepancies also appeared in the maximum and minimum scores that each ranking gave to companies. The maximum value given by “Green Ranking” was 100% to IBM in 2010, and its minimum one was 5.40%, which went to Facebook in 2014 and coincided with position 478 in this ranking. However, the best value given by the Reputation Institute was 75.40% for Google in 2015, which repeated this value in 2016 and occupied first place in both years. The worst score that it gave went to Samsung in 2017 with 64.50%, which occupied post 84. This agency provided less variability in the studied data (its range was only 10.90%). The maximum “Global 100” ranking score corresponded to Cisco in 2018 (77.02%), which occupied post 7, while the minimum score went to the same company in 2015 (51.6%), which occupied position 57 of this ranking. Finally, the best “Finance Yahoo Sustainability” score went to Intel in years 2014, 2015, 2016, and 2018, with the score being 86% in all four years. The worst score was for Facebook in 2014, with only 41%. Only “Green Ranking” and “Finance Yahoo Sustainability” coincided in placing Facebook in the worst position in 2014, but with very different scores of 5.40% and 41%, respectively.
When examining the time course of each company’s CSR score (Figure 1), we observed that, just as the descriptive statistics pointed out, the scores of the four indices revealed differences in most of the observations made throughout the study period. It is worth stressing that “RepTrack” proved the best stability given its variability or range, which has been previously indicated with only 10.90%. However, “Green Ranking” and “Global 100” indicated more volatility over the study period, where the quantity of the “Global 100” data was too minimal to draw any significant conclusions. In general, “Green Ranking” displayed a trend for giving the lowest scores.
To measure the consistency of the rankings on the selected companies’ sustainability valuations, the coefficient of variation was calculated for each company and year (mean scores/standard deviation) of their score in all four rankings. Table 7 shows that the coefficients of variation lie between 0.92 (Facebook in 2014) and 136.59 (Oracle in 2012). The vast majority obtained low values, which indicated a high degree of variability among rankings. The highest coefficients were obtained in 2012 for Microsoft and Oracle, which indicated that the degree of variability between rankings was lower for that particular year. These coefficients lowered in the following years, but rose again in 2018, which implies fewer discrepancies among the scores that the four CSR rankings provided.
In relation to the third objective about the influence of the level of controversy on the Finance Yahoo Sustainability ranking in 2018, according to this ranking, the average level of controversy of the technology sector was around 1.3, which indicates that it is a sector with a low level of controversy. However, the average level of controversy obtained by the 13 companies in the sample was somewhat higher with a score of 2.69, which lies between the moderate (2) and significant (3) levels. The companies Apple, Facebook, Google, and Samsung reached a higher level of controversy of level 4, possibly because they have been involved in 2018 in some type of event with either a negative impact on the environment, the interested parties, or the company. On the contrary, Accenture was the only company to obtain a low level of controversy, level 1, in that particular year.

4.2. Regression Analysis

The linear regression results corresponding to mathematical Equation (1) are offered in Table 8 and Table 9, and several models are presented. Table 8 presents ten models: one for the data (226) and nine individual models for each company, except for HP, IBM, Oracle, and Sony, for which no significant results were obtained.
A model was also obtained for the years 2014, 2015, and 2016 (Table 9). No significant results were found for 2018, 2017, and 2012, and this was not possible for 2013, 2011, and 2010 because only one of the four rankings gave scores in these years.
Of all the obtained models (Table 8 and Table 9), “Green Ranking” was selected as the reference variable. It is noteworthy that none of the economic-financial control variables (total assets, no. of employees, and market capitalization) were statistically significant in any model.
The constant in all the models was extremely similar, being between 44.83 and 71.18, except for Facebook. In contrast, the coefficient for the Finance Yahoo ranking was the highest (28.85), because Facebook was valued by only two rankings (Green Ranking and Finance Yahoo Sustainability), with large differences between them of 28.85 points on average. These differences were due to the fact that Green Ranking measures only the environmental dimension, while Finance Yahoo Sustainability measures the three ESG dimensions. This corroborates the low coefficients of variability obtained by Facebook in Table 7, especially in 2014. Indeed, Facebook was fully expanding and building an important datacenter in 2014, which allowed its environmental footprint to considerably increase [73], a fact that was much criticized by organizations like Greenpeace. As a result, Facebook took energy efficiency measures to improve its score in the rankings, especially in the Green Ranking.
We also found that the obtained CSR scores lay between 14.10% (for the sample as a whole) and 79.80% (for Facebook) for the company that prepared the ranking.
The scores given by “Finance Yahoo Sustainability” for all the companies were above those given by “Green Ranking” (a positive coefficient), except for Apple, which was lower (a negative coefficient), and no difference was found for the companies Accenture, Google, and Microsoft. Indeed, for these three companies, “Global 100” scored below the “Green Ranking” (for Accenture and Microsoft), and “RepTrak” scored above it (for Google).
In the joint model (1) for the years 2014–2016 (13, 12, and 11), the “Finance Yahoo Sustainability” coefficient was always above that which corresponded to RepTraK. “Global 100” did not appear, which meant that no significant differences were found between its valuations and those of the control variable “Green Ranking”.
Thus, we concluded that the “Finance Yahoo Sustainability” ranking tends to score above the other rankings in most cases, while “Green Ranking” and “Global 100” tends to score below.
The linear regression result corresponding to mathematical Equation (2) is offered in Table 10 to analyze the influence of the level of controversy in the Finance Yahoo Sustainability scores in 2018.
The obtained results (Table 10) reveal that only the level of controversy explains 45.90% variability of the score of the Finance Yahoo ranking for technology companies in 2018. In addition, there were only differences in the Finance Yahoo Sustainability scores between a level of controversy of 4 (high) and the other levels (1, 2, and 3), which did not appear in the model because they were not statistically significant. Companies with a level of controversy of 4 had a mean score in the ranking of 12.33 points less (negative coefficient) than those with levels 1, 2, and 3 (76.33 points). Therefore, there were no differences in score due to the level of controversy among levels 1, 2, and 3. A level of controversy of 5 (gravest level) did not appear in the model because none of the 13 companies that we analyzed obtained this level in 2018 and, therefore, its impact on the ranking score could not be determined.

5. Concluding Remarks

This study confirms that, like private CSR rankings, which have been the study object of previous research works [17,18,19], the degree of variability between different open-access CSR rankings is high. In other words, the scores that these rankings give to technology companies do not coincide to assess their level of sustainability throughout our study period (2010–2018). These differences between rankings are due to the methodology used by each one. Green Ranking, Global 100, and Finance Yahoo use quantitative indicators, which is why they are more objective than Rep Track, which is based on expert surveys. Green Ranking only measures the environmental aspect of CSR; thus, any variation in only this aspect will more strongly influence the final score of the ranking, and will lead to wider temporal variability in the same company. On the contrary, Finance Yahoo Sustainability measures the three aspects (ESG), so the same environmental variation will have a much lower impact on the final score. Therefore, Finance Yahoo Sustainability is much stabler over time. The same can be stated of private access rankings, where differences have been observed for the methodologies they use, and also for other aspects such as lack of standardization, transparency, bias, tradeoffs, and the credibility of both information and the independence between rating organizations and companies [17,19]. These differences are corroborated empirically in the study conducted by Delmas and Blass [18] in the chemical sector, where 15 companies in that sector were analyzed during the 2000–2005 period. Hence, it can be stated that these differences are not specific to a given sector, but exist in different sectors of the economy.
It has been verified that these differences in scores between rankings are due solely to the different forms of their performance, regardless of the differences that may exist between companies for economic-financial aspects, such as total assets, number of employees, and market capitalization.
Hence, nowadays, these rankings do not provide investors and shareholders with reliability, so they can be used as further information with which to assess companies’ performance. A trend is stressed for the “Finance Yahoo Sustainability” ranking—that of scoring above the rest. “RepTrack” can be considered the stablest, or that its variability is narrower. The results indicate wide variability among open-access CSR rankings depending on the analyzed companies and years. The widest variability was obtained for Facebook in 2014, and the smallest differences went to Oracle in 2012. In general, 2012 was the year with the smallest differences among rankings.
Rankings are useful for companies themselves because they help them to know their position compared to other companies in the sector, which can be useful for making improvements in the future and, with it, to increase their reputation in the market. However, this study shows that, depending on the pursued investment-financing object, some sustainability indicators are more useful than others. For example, if a company chooses to finance itself by issuing green bonds, which entails its environmental performance being monitored, the Green Ranking will be used as a reference. On the contrary, if investors wish to buy stocks of technology companies, they will look more at Finance Yahoo Sustainability, which encompasses the three dimensions (ESG), where it is also one of the stablest rankings that incurs a lower risk.
All this evidences the need for both financial agents and society to define a regulation or homogeneous standard for measuring and diffusing companies’ CSR actions, as well as standards for reporting financial information (e.g., International Financial Report Standards). This is because investors and shareholders particularly need increasingly stabler and more reliable indices to measure companies’ non-financial aspects.
Moreover, the companies studied herein have brands that have been more economically valued (the top 100) since 2000, which indicates that the highest economic value is no synonym of sustainability according to the agencies that measure CSR, because the companies in our sample have not always been included in the top 100 of open-access CSR rankings. In other words, there is no correspondence between CSR rankings and brands rankings. This is because the methodologies used to value brands and those that value CSR differ as the consultancy firms that value brands do not include any variables to contemplate the three sustainability dimensions in their methodologies, but only the economic-financial dimension. Likewise, no CSR measurement agency explicitly includes the economic-financial dimension in its methodology. However, some companies like Newsweek or Forbes implicitly consider them in order to include sales in productivity indicators.
Probably in the future, international consultancy firms of brands valuations will include variables of socio-environmental dimensions because non-financial information is becoming increasingly more relevant for investors and creditors and could also affect the value of brands. If a regulation or standard existed to measure CSR actions, it would help the agencies that value brands to include these results in their methodologies.
This work has demonstrated that levels of controversy is an important aspect in the CSR score of companies, but it is only measured explicitly by the Finance Yahoo ranking. According to this ranking, the technology sector generally has a low level of controversy [65], but some analyzed companies have a high level of controversy, which is possibly due to them having performed some specific act with a negative impact on both their own operations and the environment. It would be desirable for all sustainability and brand valuation rankings to explicitly include this measure in order to compare them, although, implicitly, some rankings are already considering this by completely excluding companies from certain highly controversial sectors from their presence in rankings, which is the case for companies in the tobacco or armament sectors in the Global 100.
This study has two main limitations. One is its small sample size, which means that its results cannot be extrapolated to other technological brands and sectors because only 13 companies were selected, given the interest in knowing what effect CSR had on the best-valued brands. Future research could be extended to all companies in the technology sector on the Stock Exchange and to other sectors. The second limitation is the different time availability of the open-access CSR ranking scores, specifically for the years 2010, 2012, 2014, and 2015 for the rankings by Newsweek, the Reputation Institute, Finance Yahoo, and Forbes, respectively.
Finally, it would be relevant to perform a cost–benefit analysis in the future, and what it means for companies to provide CSR information, by comparing the cost of collecting information with the benefit that it confers their reputation, their position in rankings, and their market value.

Author Contributions

This article was originally conceived and designed by M.Á.A., E.D.L.P., and N.G. These three authors contributed equally to this work.

Funding

This research received no external funding.

Conflicts of Interest

The authors declare no conflict of interest.

References

  1. Cavalcanti, M.; Teixeira, L.; Barlow, C. Institutional dynamics and organizations affecting the adoption of sustainable development in the United Kingdom and Brazil. Bus. Ethics A Eur. Rev. 2015, 24, 73–90. [Google Scholar]
  2. Choi, Y.; Yu, Y. The influence of perceived corporate sustainability practices on employees and organizational performance. Sustainability 2014, 6, 348–364. [Google Scholar] [CrossRef]
  3. Hahn, R.; Kühnen, M. Determinants of sustainability reporting: A review of results, trends, theory, and opportunities in an expanding field of research. J. Clean. Prod. 2013, 59, 5–21. [Google Scholar] [CrossRef]
  4. Lozano, R. A holistic perspective on corporate sustainability drivers. Corp. Soc. Responsib. Environ. Manag. 2015, 22, 32–44. [Google Scholar] [CrossRef]
  5. Maletic, M.; Maletic, D.; Dahlgaard, J.; Dahlgaard-Park, S.M.; Gomiscek, B. Sustainability exploration and sustainability exploitation: From a literature review towards a conceptual framework. J. Clean. Prod. 2014, 79, 182–194. [Google Scholar] [CrossRef]
  6. Montiel, I.; Delgado-Ceballos, J. Defining and measuring corporate sustainability: Are we there yet? Organ. Environ. 2014, 27, 113–139. [Google Scholar] [CrossRef]
  7. Schneider, A.; Meins, E. Two dimensions of corporate sustainability assessment: Towards a comprehensive framework. Bus. Strategy Environ. 2012, 21, 211–222. [Google Scholar] [CrossRef]
  8. Archel, P. Las Memorias de Sostenibilidad de la Global Reporting Initiative, Quinto Congreso de Economía de Navarra: Economía y Desarrollo Sostenible, Pamplona, España, Noviembre de 2003; Gobierno de Navarra, Departamento de Economía y Hacienda: Navarra, Spain, 2003. [Google Scholar]
  9. Liang, X.; Zhao, X.; Wang, M.; Li, Z. Small and Medium-Sized Enterprises Sustainable Supply Chain Financing Decision Based on Triple Bottom Line Theory. Sustainability 2018, 10, 4242. [Google Scholar] [CrossRef]
  10. Strandberg, L. La medición y la comunicación de la RSE: Indicadores y normas. Cuadernos de la Cátedra “La Caixa” de Responsabilidad Social de la Empresa y Gobierno Corporativo, 9. Pamplona, 2010: IESE Busines School—Universidad de Navarra. Available online: https://studylib.es/doc/5989799/la-medici%C3%B3n-y-la-comunicaci%C3%B3n-de-la-rse--indicadores-y-no (accessed on 28 July 2018).
  11. Ding, D.K.; Ferreira, C.; Wongchoti, U. Does it pay to be different? Relative CSR and its impact on firm value. Int. Rev. Financ. Anal. 2016, 47, 86–98. [Google Scholar] [CrossRef]
  12. Kao, E.H.; Yeh, C.C.; Wang, L.H.; Fung, H.G. The relationship between CSR and performance: Evidence in China. Pac. Basin Financ. J. 2018, 51, 155–170. [Google Scholar] [CrossRef]
  13. Torres, A.; Bijmolt, T.H.A.; Tribó, J.A.; Verhoef, P. Generating global brand equity through corporate social responsibility to key stakeholders. Int. J. Res. Mark. 2012, 29, 13–24. [Google Scholar] [CrossRef]
  14. Manzano, J.A.; Simó, L.A.; Pérez, R.C. La responsabilidad social como creadora de valor de marca: El efecto moderador de la atribución de objetivos. Rev. Eur. Dir. Econ. Empresa 2013, 22, 21–28. [Google Scholar]
  15. Sharfman, M. The construct validity of the kinder, lydenberg & domini social performance ratings data. J. Bus. Ethics 1996, 15, 287–296. [Google Scholar]
  16. Chatterji, A.K.; Levine, D.I.; Toffel, M.W. How Well Do Social Ratings Actually Measure Corporate Social Responsibility? J. Econ. Manag. Strategy 2009, 18, 125–169. [Google Scholar] [CrossRef]
  17. Chatterji, A.; Levine, D. Breaking down the wall of codes: Evaluating non-financial performance measurement. Calif. Manag. Rev. 2006, 48, 29–52. [Google Scholar] [CrossRef]
  18. Delmas, M.; Blass, V.D. Measuring corporate environmental performance: The trade-offs of sustainability ratings. Bus. Strategy Environ. 2010, 19, 245–260. [Google Scholar] [CrossRef]
  19. Windolph, S.E. Assessing Corporate Sustainability Through Ratings: Challenges and Their Causes. J. Environ. Sustain. 2011, 1, 1–22. [Google Scholar] [CrossRef]
  20. Searcy, C.; Elkhawas, D. Corporate sustainability ratings: An investigation into how corporations use the Dow Jones Sustainability Index. J. Clean. Prod. 2012, 35, 79–92. [Google Scholar] [CrossRef]
  21. Kutay, N.; Tektüfekçi, F. A New Era for Sustainable Development: A Comparison for Sustainability Indices. J. Account. Financ. Audit. Stud. 2016, 22, 70–95. [Google Scholar]
  22. Timoteo, J.; Matías, G.; Buxaderas, E.; Ferruz, S. Intangibles in the Value of Companies. The Business of Faust; Díaz de Santos Editions: Madrid, Spain, 2015. [Google Scholar]
  23. American Marketing Association. Available online: https://www.ama.org/resources/Pages/Dictionary.aspx?dLetter=B (accessed on 20 July 2018).
  24. Keller, K.L. Strategic Brand Management, 3rd ed.; Grada Publishing: Praha, Czech Republic, 2007; p. 796. [Google Scholar]
  25. Lambin, J. Strategic Marketing; McGraw-Hill Editions: Madrid, Spain, 1995. [Google Scholar]
  26. Kapferer, J.N.; Thoenig, J.C. The Brand: Engine of Competitiveness of the Companies and Growth of the Economies; McGraw-Hill Editions: Madrid, Spain, 1991. [Google Scholar]
  27. Kamakura, W.A.; Russell, G.J. Measuring brand value with scanner data. Int. J. Res. Mark. 1993, 10, 9–22. [Google Scholar] [CrossRef]
  28. Keller, K.L. Conceptualizing, measuring and managing customer-based brand equity. J. Mark. 1993, 57, 1–22. [Google Scholar] [CrossRef]
  29. Erdem, T.; Swait, J. Brand equity as a signaling phenomenon. J. Consum. Psychol. 1998, 7, 131–157. [Google Scholar] [CrossRef]
  30. Salinas, G.; Ambler, T. A taxonomy of brand valuation practice: Methodologies and purposes. J. Brand Manag. 2009, 17, 39–61. [Google Scholar] [CrossRef]
  31. Virvilaitè, R.; Jucaytè, I. Brand valuation: Viewpoint of costumer and company. Eng. Econ. 2008, 56, 111–119. [Google Scholar]
  32. Simon, J.; Sullivan, M. The measurement and determinants of brad equity: A financial approach. Mark. Sci. 1993, 1, 28–52. [Google Scholar] [CrossRef]
  33. Abratt, R.; Bick, G. Valuing brands and brand equity: Pitfalls and processes. J. Appl. Manag. Entrep. 2003, 8, 21–39. [Google Scholar]
  34. Srinivasan, V.; Park, C.; Chang, D. Equitymap: Measurement, analysis, and prediction of brand equity and its sources. Res. Pap. Ser. 2001, 1685, 110. [Google Scholar]
  35. Damodaran, A. Investment Valuation; John Wiley and Sons.: New York, NY, USA, 1996. [Google Scholar]
  36. Majerova, J.; Kliestik, T. Brand valuation as immanent component of brand value building and managing. Procedia Econ. Financ. 2015, 26, 546–552. [Google Scholar] [CrossRef]
  37. Johansson, J.K.; Dimofte, C.V.; Mazvancheryl, S.K. The performance of global brands in the 2008 financial crisis: A test of two brand value measure. Int. J. Res. Mark. 2012, 29, 235–245. [Google Scholar] [CrossRef]
  38. Ratnatunga, J.; Ewing, M.T. An ex-ante approach to brand capability valuation. J. Bus. Res. 2009, 62, 323–331. [Google Scholar] [CrossRef]
  39. Interbrand. Available online: https://www.interbrand.com/best-brands/ (accessed on 15 December 2018).
  40. Kantar Millward Brown. Available online: http://www.millwardbrown.com/brandz/rankings-and-reports (accessed on 15 December 2018).
  41. The Brand Finance Group. Available online: http://brandfinance.com/knowledge-centre/reports/brand-finance-global-500-2018/ (accessed on 15 December 2018).
  42. Jones, T.M.; Andrew, C.W. Convergent stakeholder theory. Acad. Manag. Rev. 1999, 24, 2. [Google Scholar] [CrossRef]
  43. Donaldson, T. Response: Making stakeholder theory whole. Acad. Manag. Rev. 1999, 24, 237–241. [Google Scholar] [CrossRef]
  44. Margolis, J.D.; Elfenbein, H.; Walsh, J.P. Does it pay to be good? A meta-analysis and redirection of research on the relationship between corporate social and financial performance. Ann. Arbor 2007, 1001, 48109–51234. [Google Scholar]
  45. Orlitzky, M.; Schmidt, F.L.; Rynes, S.L. Corporate social and financial performance: A meta-analysis. Organ. Stud. 2003, 24, 403–441. [Google Scholar] [CrossRef]
  46. Margolis, J.D.; Walsh, J.P. Misery loves companies: Rethinking social initiatives by business. Adm. Sci. Q. 2003, 48, 268–305. [Google Scholar] [CrossRef]
  47. Lai, C.S.; Chiu, C.J.; Yang, C.F.; Pai, D.C. The effects of corporate social responsibility on brand performance: The mediating effect of industrial brand equity and corporate reputation. J. Bus. Ethics 2010, 95, 457–469. [Google Scholar] [CrossRef]
  48. Fijałkowska, J.; Zyznarska-Dworczak, B.; Garsztka, P. Corporate social-environmental performance versus financial performance of banks in Central and Eastern European Countries. Sustainability 2018, 10, 772. [Google Scholar] [CrossRef]
  49. Jones, R. Finding sources of brand value: Developing a stakeholder model of brand equity. J. Brand Manag. 2005, 13, 10–32. [Google Scholar] [CrossRef]
  50. Grubor, A.; Milovanov, O. Brand strategies in the era of sustainability. Interdiscip. Descr. Complex Syst. 2017, 15, 78–88. [Google Scholar] [CrossRef]
  51. Porter, M.; Kramer, M. Strategy and Society: The Link Between Competitive Advantage and Corporate Social Responsibility. Harv. Bus. Rev. 2006, 84, 78–92. [Google Scholar] [PubMed]
  52. McWilliams, A.; Siegel, D.S.; Wright, P.M. Corporate Social Responsibility: Strategic Implications. J. Manag. Stud. 2006, 43, 1–18. [Google Scholar] [CrossRef]
  53. Siano, A.; Conte, F.; Amabile, S.; Vollero, A.; Piciocchi, P. Communicating sustainability: An operational model for evaluating corporate websites. Sustainability 2016, 8, 950. [Google Scholar] [CrossRef]
  54. Herrick, C.N.; Pratt, J.L. Communication and the narrative basis of sustainability: Observations from the municipal water sector. Sustainability 2013, 5, 4428–4443. [Google Scholar] [CrossRef]
  55. Fieseler, C.; Fleck, M. The Pursuit of empowerment through social media: Structural social capital dynamics in CSRblogging. J. Bus. Ethics 2013, 118, 759–775. [Google Scholar] [CrossRef]
  56. Seele, P.; Lock, I. Instrumental and/or deliberative? A typology of CSR communication tools. J. Bus. Ethics 2014, 22, 1–14. [Google Scholar] [CrossRef]
  57. Illia, L.; Romenti, S.; Rodríguez-Cánovas, B.; Murtarelli, G.; Carroll, C.E. Exploring corporations’ dialogue about CSR in the digital era. J. Bus. Ethics 2017, 146, 39–58. [Google Scholar] [CrossRef]
  58. Fernández-Feijoo, B.; Romero, S.; Ruiz, S. Commitment to corporate responsibility measured through global reporting initiative reporting: Factors affecting the behavior of companies. J. Clean. Prod. 2014, 81, 244–254. [Google Scholar] [CrossRef]
  59. Graafland, J.J.; Smid, H. Reputation, Corporate Social Responsibility and Market Regulation. Tijdschrift voor Economie en Management No. XLIX. 2004, Volume 2, pp. 271–308. Available online: https://www.researchgate.net/publication/41459436 (accessed on 25 July 2018).
  60. Vollero, A.; Conte, F.; Siano, A.; Covucci, C. Corporate social responsibility information and involvement strategies in controversial industries. Corp. Soc. Responsib. Environ. Manag. 2019, 1, 141–151. [Google Scholar] [CrossRef]
  61. Wilson, A.; West, C. The marketing of unmentionables. Harv. Bus. Rev. 1981, 1, 1–102. [Google Scholar]
  62. Waller, D.S. A proposed response model for controversial advertising. J. Promot. Manag. 2005, 11, 3–15. [Google Scholar] [CrossRef]
  63. Jo, H.; Na, H. Does CSR reduce firm risk? Evidence from controversial industry sectors. J. Bus. Ethics 2012, 110, 441–456. [Google Scholar] [CrossRef]
  64. Hasseldine, J.; Salama, A.; Toms, S. Quantity versus quality: The impact of environmental disclosures on the reputations of UK PLCs. Br. Account. Rev. 2005, 37, 231–248. [Google Scholar] [CrossRef]
  65. Kilian, T.; Hennigs, N. Corporate social responsibility and environmental reporting in controversial industries. Eur. Bus. Rev. 2014, 26, 79–101. [Google Scholar] [CrossRef]
  66. Cai, Y.; Jo, H.; Pan, C. Doing well while doing bad? CSR in controversial industry sectors. J. Bus. Ethics 2012, 108, 467–480. [Google Scholar] [CrossRef]
  67. Byrd, J.W.; Hickman, K.; Baker, C.R.; Cohanier, B. Corporate social responsibility reporting in controversial industries. Int. Rev. Account. Bank. Financ. 2017, 8, 1–14. [Google Scholar] [CrossRef]
  68. Bagna, E.; Dicuonzo, G.; Perrone, A.; Dell’Atti, V. The value relevance of brand valuation. Appl. Econ. 2017, 49, 5865–5876. [Google Scholar] [CrossRef]
  69. Newsweek. Available online: https://www.newsweek.com/newsweek-green-rankings-2017-methodology-739761 (accessed on 1 September 2018).
  70. Reputation Institute. Available online: https://www.reputationinstitute.com/csr-reptrak (accessed on 4 September 2018).
  71. Sustainalytics. Yahoo Finance Expands Offerings as Only Free Provider of Sustainability Scores, Across Desktop and Mobile Web. Available online: https://www.sustainalytics.com/press-release/yahoo-finance- adds-sustainability-scores/ (accessed on 10 October 2018).
  72. Corporate Knights. Available online: https://www.corporateknights.com/reports/global-100/ (accessed on 24 August 2018).
  73. Kepes, B. It’s Not So Complicated—Facebook And Sustainability. Forbes Media, 2014. Available online: https://www.forbes.com/sites/benkepes/2014/10/10/its-not-so-complicated-facebook-and-sustainability/#3b7988fc9f62 (accessed on 10 October 2014).
Figure 1. Evolution of the scores obtained in the four CSR rankings per company. The X-axis represents the years of the period of study; The Y-axis draws as percentage the CSR scores (form 0 to 100%) by ranking to each company.
Sustainability 11 01598 g001aSustainability 11 01598 g001bSustainability 11 01598 g001c
Table 1. Temporal evolution of the average value of brands according to international valuation rankings (in thousands of $).
YearAccentureAppleCiscoFacebookGoogleHPIBMIntelMicrosoftOracleSamsungSAPSony
201820,914223,79525,10698,986192,827261557,24031,223124,95527,19061,45731,7699316
201718,953175,322 23,13079,995165,58511,78061,67627,24999,82924,90143,89127,6628325
201615,841184,16621,53956,382150,20817,02656,83126,14387,29222,72651,49423,1418233
201514,023181,85720,751 39,110123,55021,38864,83726,27083,41023,95049,53828,4977846
201413,994123,80821,81019,969111,63421,01773,76622,92071,37422,50950,03522,3639401
201312,987123,56418,77914,49786,36419,43976,35524,05158,29820,05839,92820,5178597
201212,432110,04117,79319,32775,01523,56476,88425,64260,10520,56228,41816,79910,004
201111,71672,10717,76319,10270,37030,21368,97022,73360,04519,60419,03420,31010,862
201011,10841,37517,139552464,66931,32261,60520,95656,94817,49116,58918,52410,717
Table 2. Sample composition of technology companies.
CompanyHeadquarterCreation DateIndustryFTETotal AssetsNet IncomePEREPSM.C.S.O.
AccentureDublin (Ireland)1989Information Technology Services449,00022,689,8903,445,14923.725.3981,706639,452.5
AppleCupertino (CA, USA)1977Consumer Electronics100,000375,319,00048,351,00015.829.43765,0045,126,201
CiscoSan Jose (CA, USA)1984Communication Equipment72,900108,784,000110,00016.681.93160,2454,983,000
FacebookCalifornia (USA)2004Internet Content & Information30,27584,524,00015,934,00028.925.49460,8702,901,000
GoogleMountain View (CA, USA)1998Internet Content & Information89,058197,295,00012,662,00050.9518.22645,135694,783
HPPalo Alto (CA, USA)1939Consumer Electronics49,00032,913,0002,526,00012.041.5330,4021,649,580
IBMArmonk (NY, USA)1911Information Technology Services366,600125,356,0005,753,00024.46.17140,349932,800
IntelSanta Clara (CA, USA)1968Semiconductors104,200123,249,0009,601,00018.292.04175,5784,701,000
MicrosoftRedmond (WA, USA)1975Software—Infrastructure131,000258,848,00016,571,00026.162.74554,6787,746,000
OracleRedwood (USA)1977Software—Infrastructure137,000137,264,0003,825,00020.822.21194,3724,217,000
SamsungSuwon (South Korea)1938Consumer Electronics320,671283,263,49239,604,9837.625.4284,3096,901,250
SAPWalldorf (Germany)1972Software—Application91,12042,497,0004,018,00017.795.05107,5311,197,000
SonyTokyo (Japan)1946Consumer Electronics128,400169,301,9774,358,25170.970.5448,0521,263,8950
Data on 31 December 2017 taken from companies’ yearly accounts. Total assets, net income, and market capitalization (MC) in thousands of $. Shares outstanding (SO) in $. PER is the price to earning ratio (calculated as Stock Price/EPS). EPS is earnings per share (calculated by net income/number of shares). FTE stands for full-time employees.
Table 3. Number of data provided by the CSR rankings for each year.
Year201820172016201520142013201220112010
No.17 43 4340351022115
Table 4. Number of data provided by the CSR rankings for each brand.
CompanyAccentureAppleCiscoFacebookGoogleHPIBMIntelMicrosoftOracleSamsungSAPSony
No.1419 219172118211917211316
Table 5. Descriptive statistics: scores of the CSR rankings of the companies in the sample for the 2010–2018 period.
Green RankingRepTrakFinance Yahoo Sustainability Global 100
No.Valid79636320
Lost37535396
Mean60.3469.7271.5260.55
Median63.7069.327358.39
Range94.6010.904525.42
Minimum5.4064.504151.60
Maximum10075.408677.02
Table 6. Characterization of open-access corporate social responsibility (CSR) rankings.
RankingSourceMethodologyYear the Ranking Began
Green RankingNewsweekThis uses eight indicators, which are all environmental: energy productivity, greenhouse productivity, water productivity, waste productivity, green revenue score, green pay link, sustainability board committee, and audited environmental metrics. Publishes the top 500 rankings.2010 (except 2013)
CSR RepTrakReputation InstituteThis is based on questions that measure the quality of the workplace, governance, and citizenship. Drivers of CSR are defined by ethics, fairness, and societal impact. Collects information through surveys carried out by a panel of experts. Publishes the top 100 rankings.2012
Finance Yahoo SustainabilityYahoo Finance (Sustaynalitcs)This uses environmental, social, and governance (ESG) ratings of more than 2000 companies on the Stock Exchange. It numerically scores the company for all three ESG categories, and provides an overall score.2014
Global 100 most sustainable corporationsCorporate KnightThis uses 15 indicators, of which five are environmental (energy intensity or productivity, carbon productivity, water productivity, waste productivity, and clean air productivity) and ten are corporate (innovation capacity, percentage of tax paid, CEO-to-average-worker pay, suppliers score, pension fund status, safety performance, employee turnover, leadership diversity, sustainability pay link, and clean capitalism pay link).2015 1
1 This ranking has been published since 2005 and ranks from 1 to 100 companies in it, but it was not until 2015 when it incorporated scores from 1% to 100%.
Table 7. Temporal evolution of the coefficient of variation of the scores of the CSR rankings for each company.
Company2012201320142015201620172018
Accenture 4.1410.2410.795.72
Apple7.69 9.0012.708.158.51
Cisco25.57 5.887.186.3112.1437.26
Facebook 0.922.651.891.84
Google36.93 2.055.094.241.61
HP9.74 7.6611.722.033.476.47
IBM8.57 2.494.865.174.84
Intel20.27 3.925.276.723.887.47
Microsoft106.77 6.4510.1225.567.88
Oracle136.59 4.283.4017.2315.40
Samsung17.77 9.035.176.036.5927.72
Sap 2.805.367.193.05
Sony86.18 21.1053.745.753.28
Table 8. Regression models for the 2010–2018 study period.
Models12345678910
All CompaniesAccentureAppleCiscoFacebookGoogleIntelMicrosoftSamsungSAP
Constant60.3771.1867.7066.8719.7551.967.570.2764.3162.44
RepTrak9.27 *** 22.1 *
Global 100 −12.51 * −15.278 *
Finance Yahoo Sustainability11.30 *** −11.70 **11.92 ***28.85 *** 20.86 *** 9.08 *15.72 *
Adjusted R214.10%33.20%31.60%32.90%79.80%32.50%58.30%20%17.20%32.80%
N22614192191621192115
CI3.062.683.253.452.612.923.452.953.142.80
VIF1.182111111111
The dependent variable was the score of the CSR rankings. The independent dichotomic variables were the four rankings (with a value of 1 if the ranking scored this company and/or year, and 0 otherwise). ***, **, and * are the 0.5%, 1% and 5% error levels, respectively. CI is the condition index which, in all the obtained models, presented a low level. VIF is the inflation factor of variance, with a low level in all the models. Thus, there was no multicollinearity among variables.
Table 9. Annual regression models.
Models111213
201620152014
Constant55.7855.7544.83
RepTrak15.12 **13.79 ***23.86 ***
Global 100
Finance Yahoo Sustainability15.36 ***15.25 ***25.39 ***
Adjusted R229.80%36.50%47.50%
N434035
CI2.622.803.09
VIF1.1751.2231.310
The dependent variable was the score of the CSR rankings. The independent dichotomic variables were the four rankings (with a value of 1 if the ranking scored this company and/or year, and 0 otherwise). *** and ** are the 0.5% and 1% error levels, respectively. CI is the condition index which, in all the obtained models, presented a low level. VIF is the inflation factor of variance, with a low level in all the models. Thus, there was no multicollinearity among variables.
Table 10. The regression model results for Finance Yahoo Sustainability in 2018.
Model14
Finance Yahoo Sustainability
Constant76.33
Level of controversy 4−12.33 *
Adjusted R245.90%
N13
CI1.86
VIF1.0
The dependent variable was the score of the companies in Finance Yahoo Sustainability in 2018. The independent dichotomic variables were the five levels of controversy (with a value of 1 if the company had this level, and 0 otherwise). * is the 5% error levels, respectively. CI is the condition index and VIF is the inflation factor of variance, both with a low level. Thus, there was no multicollinearity among variables.

