Long-Term Regional Environmental Risk Assessment and Future Scenario Projection at Ningbo, China Coupling the Impact of Sea Level Rise

Abstract
1. Introduction
2. Methodology
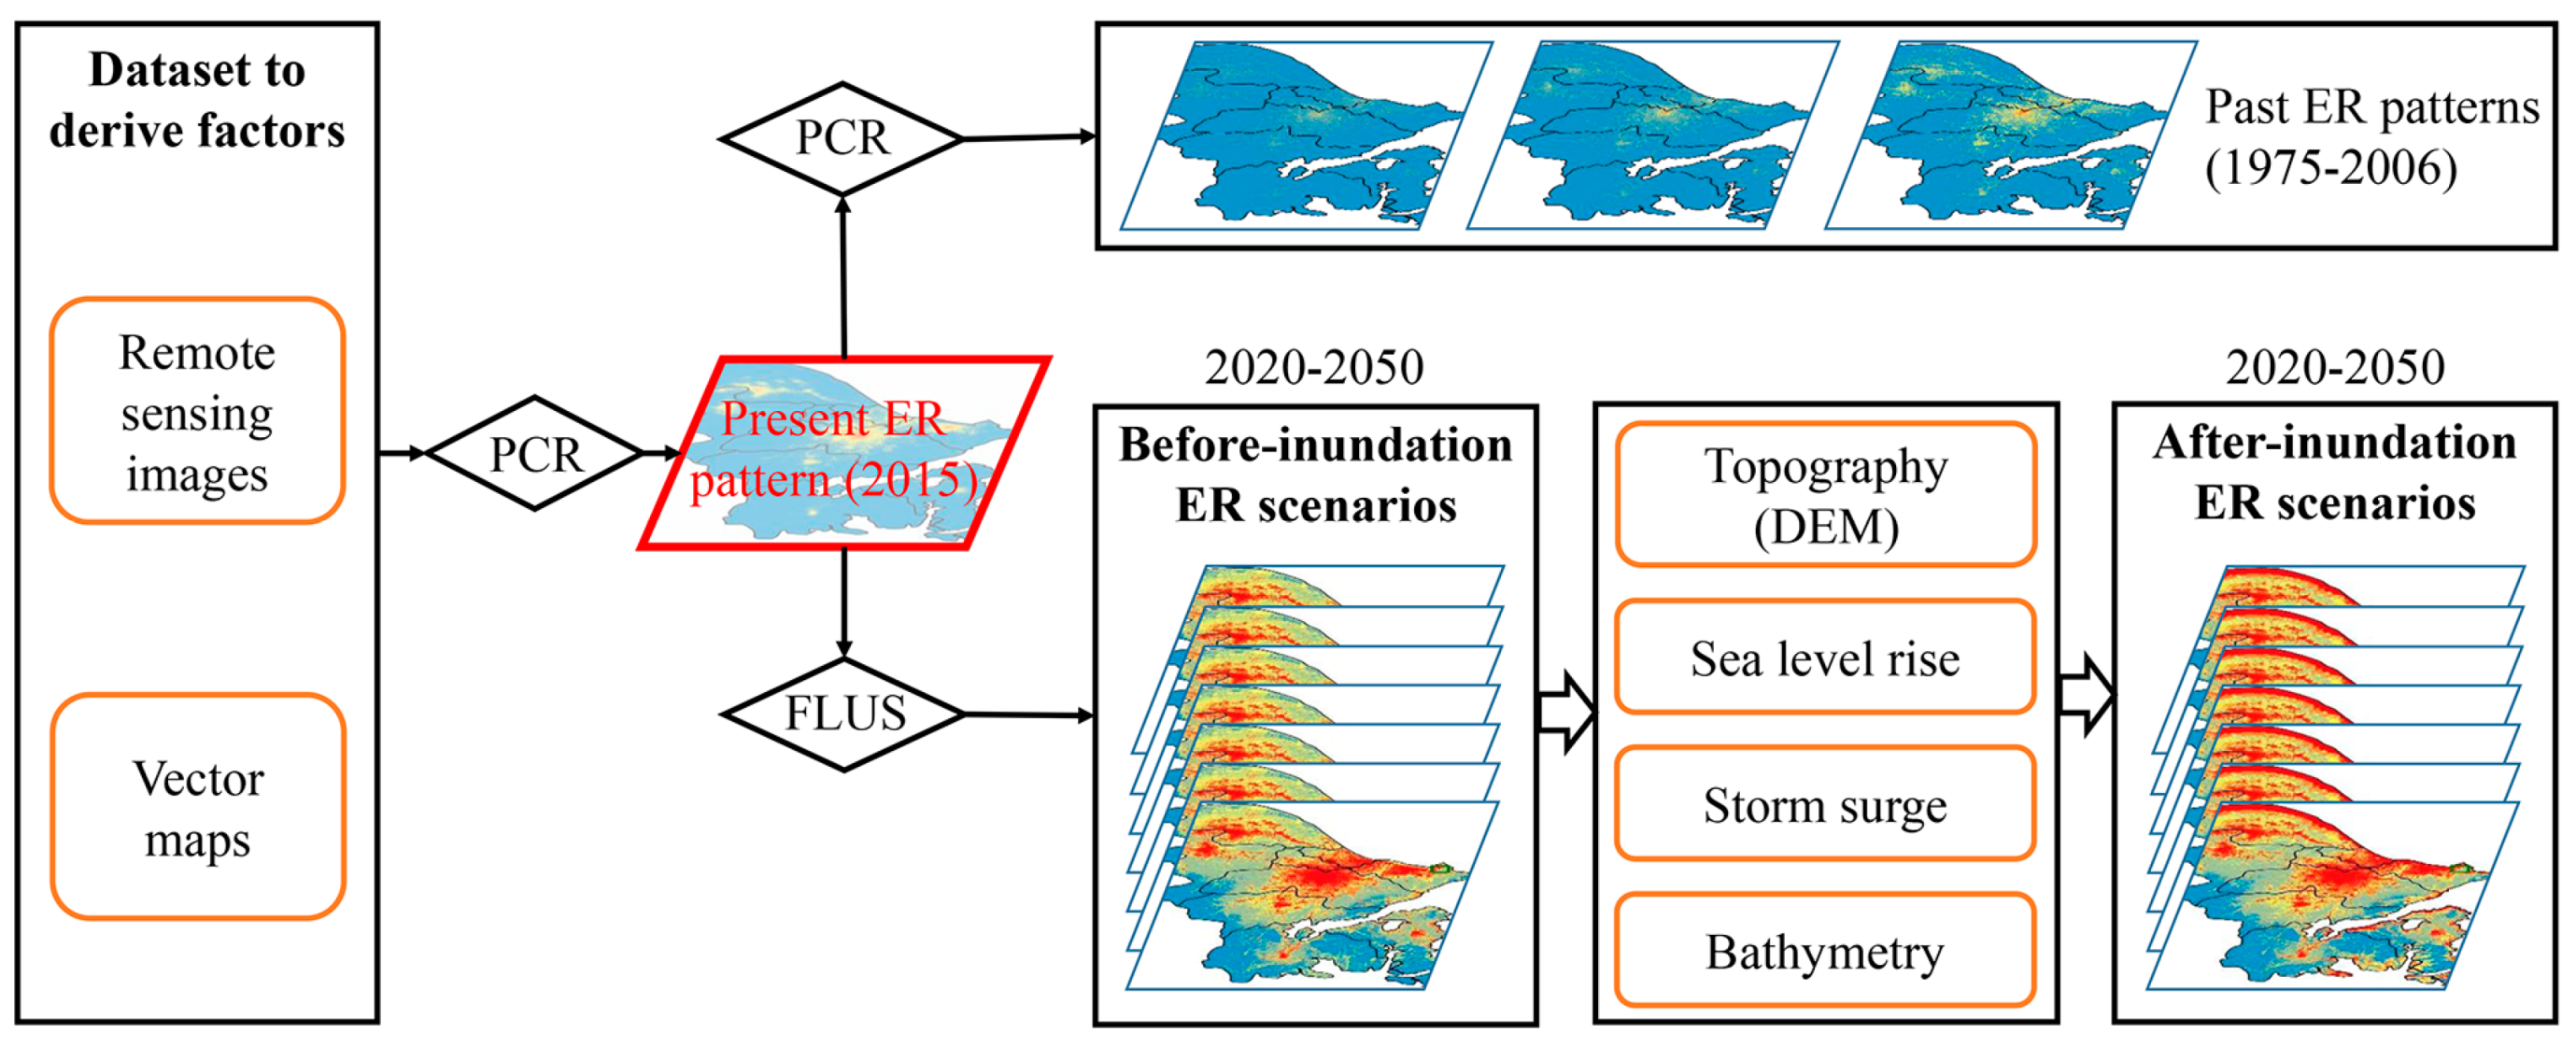
2.1. Procedure
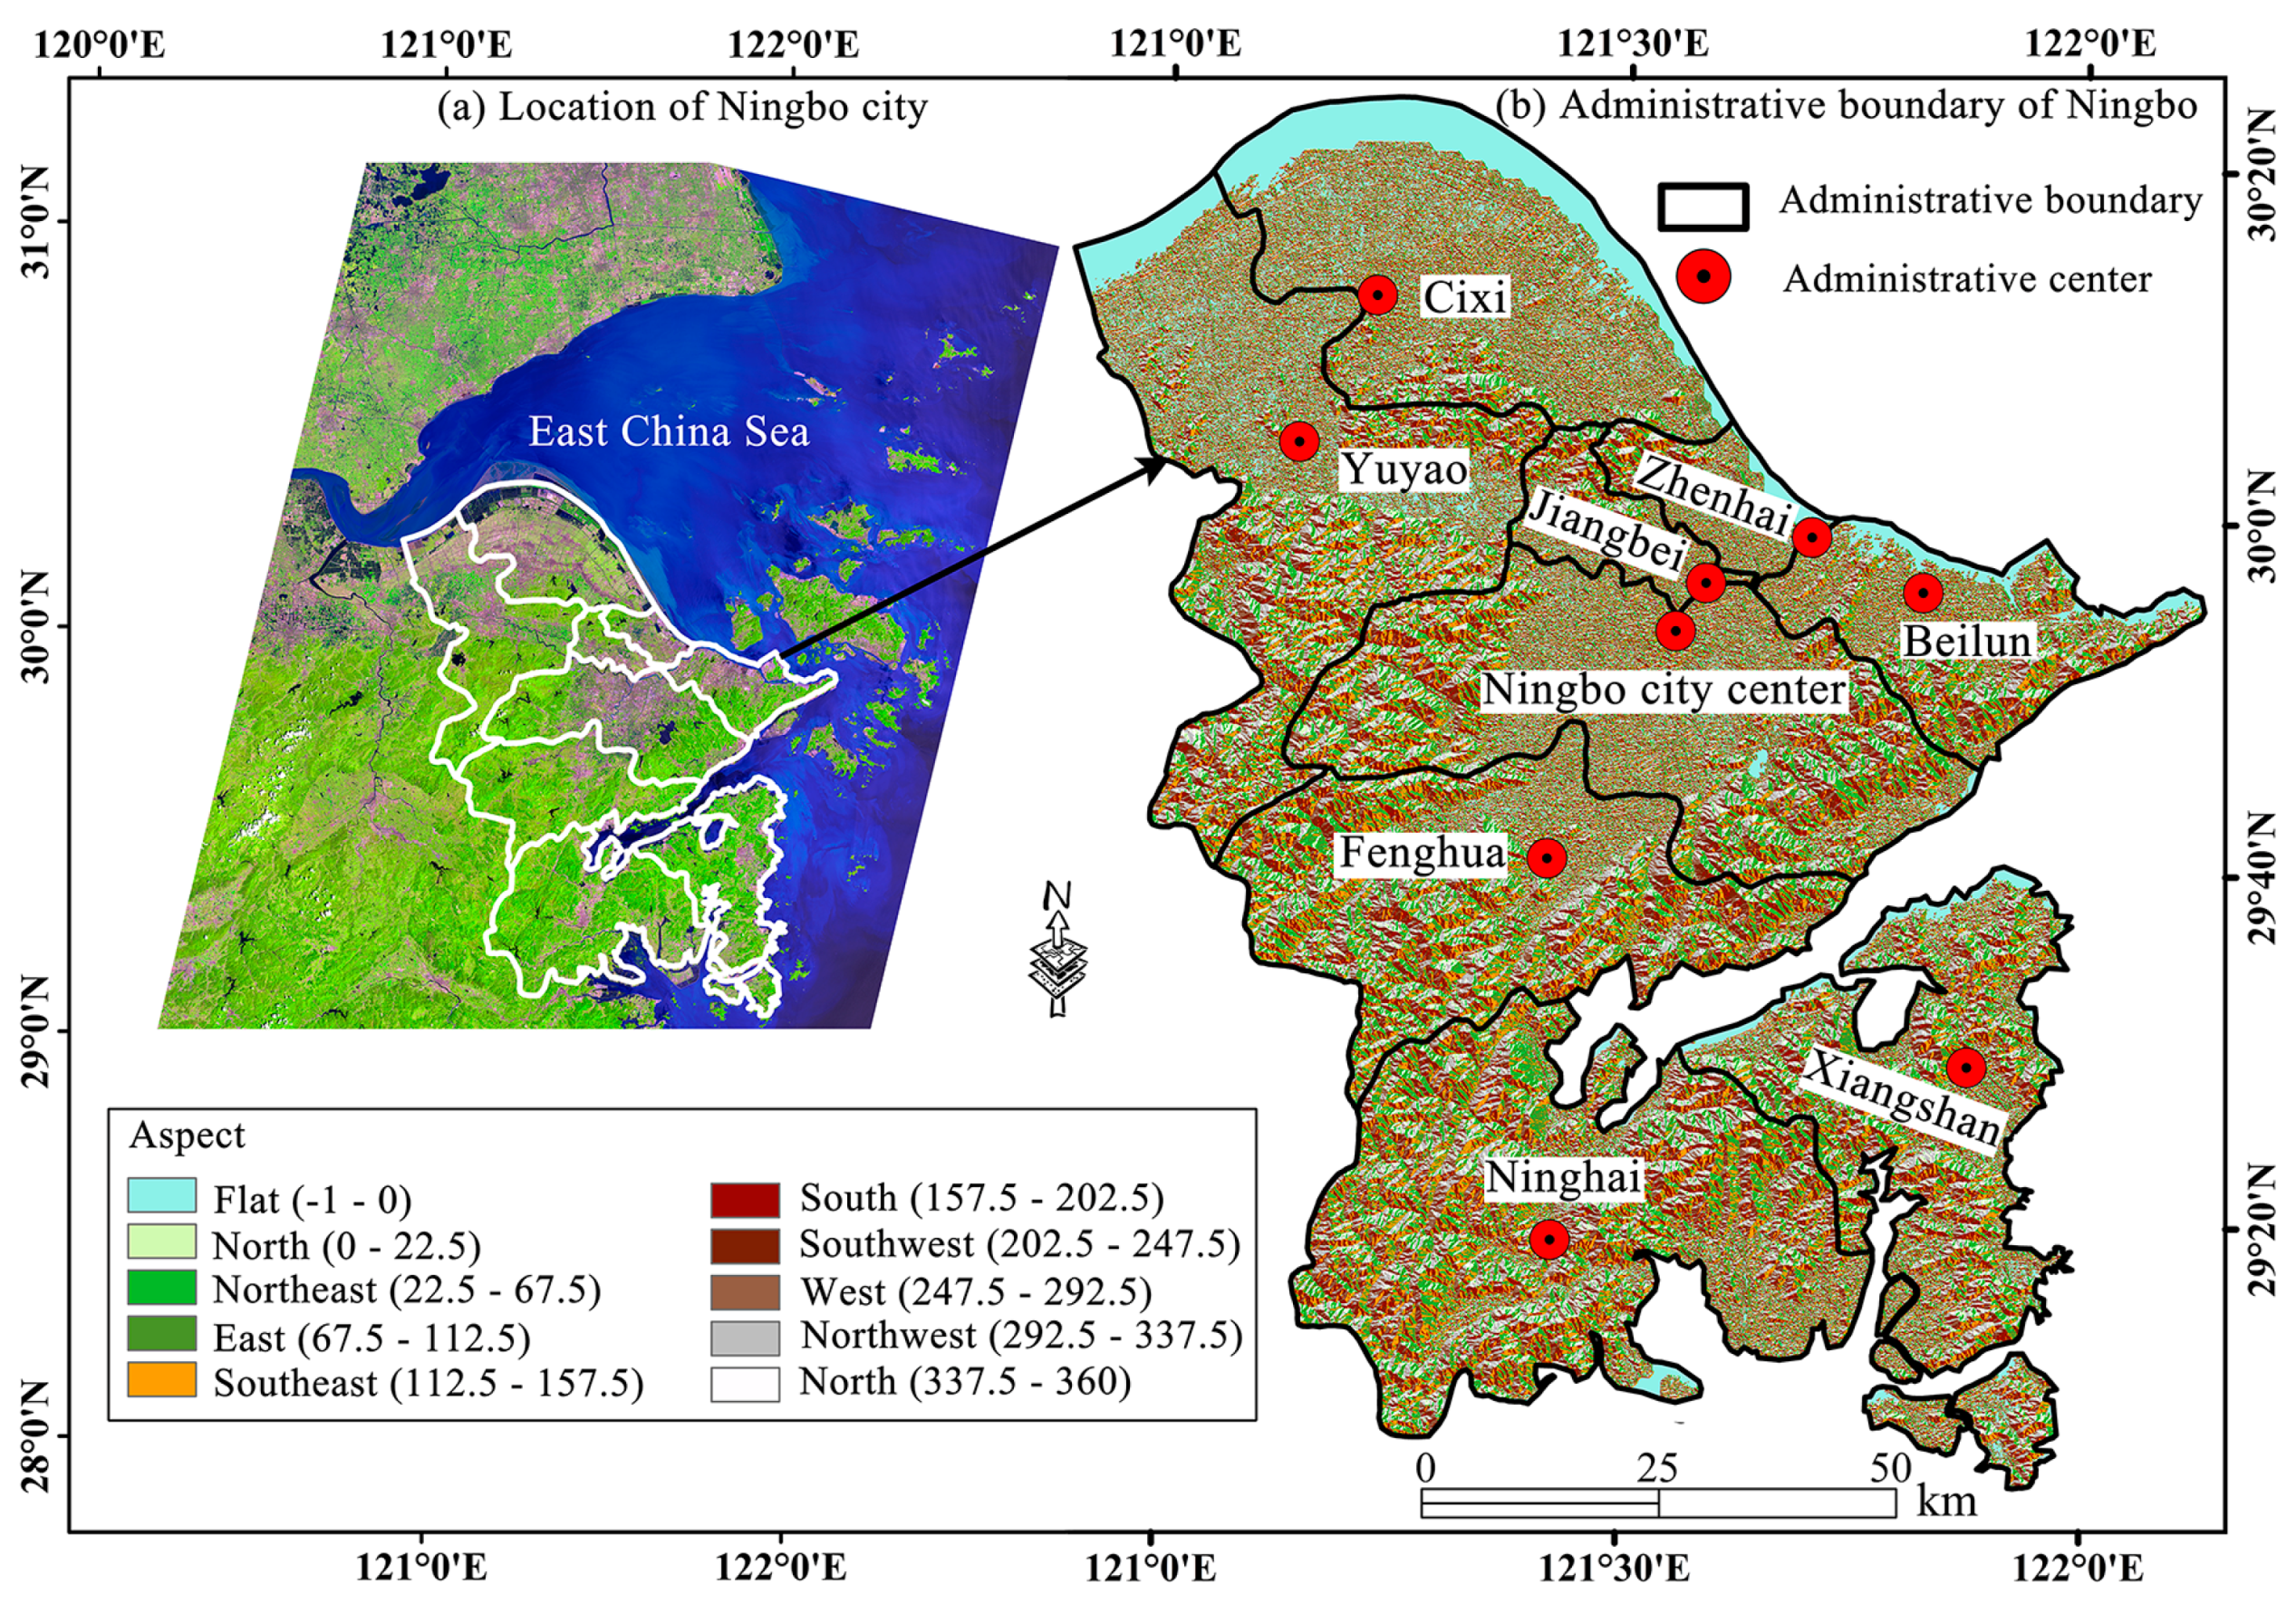
2.2. Study Area and Input Data
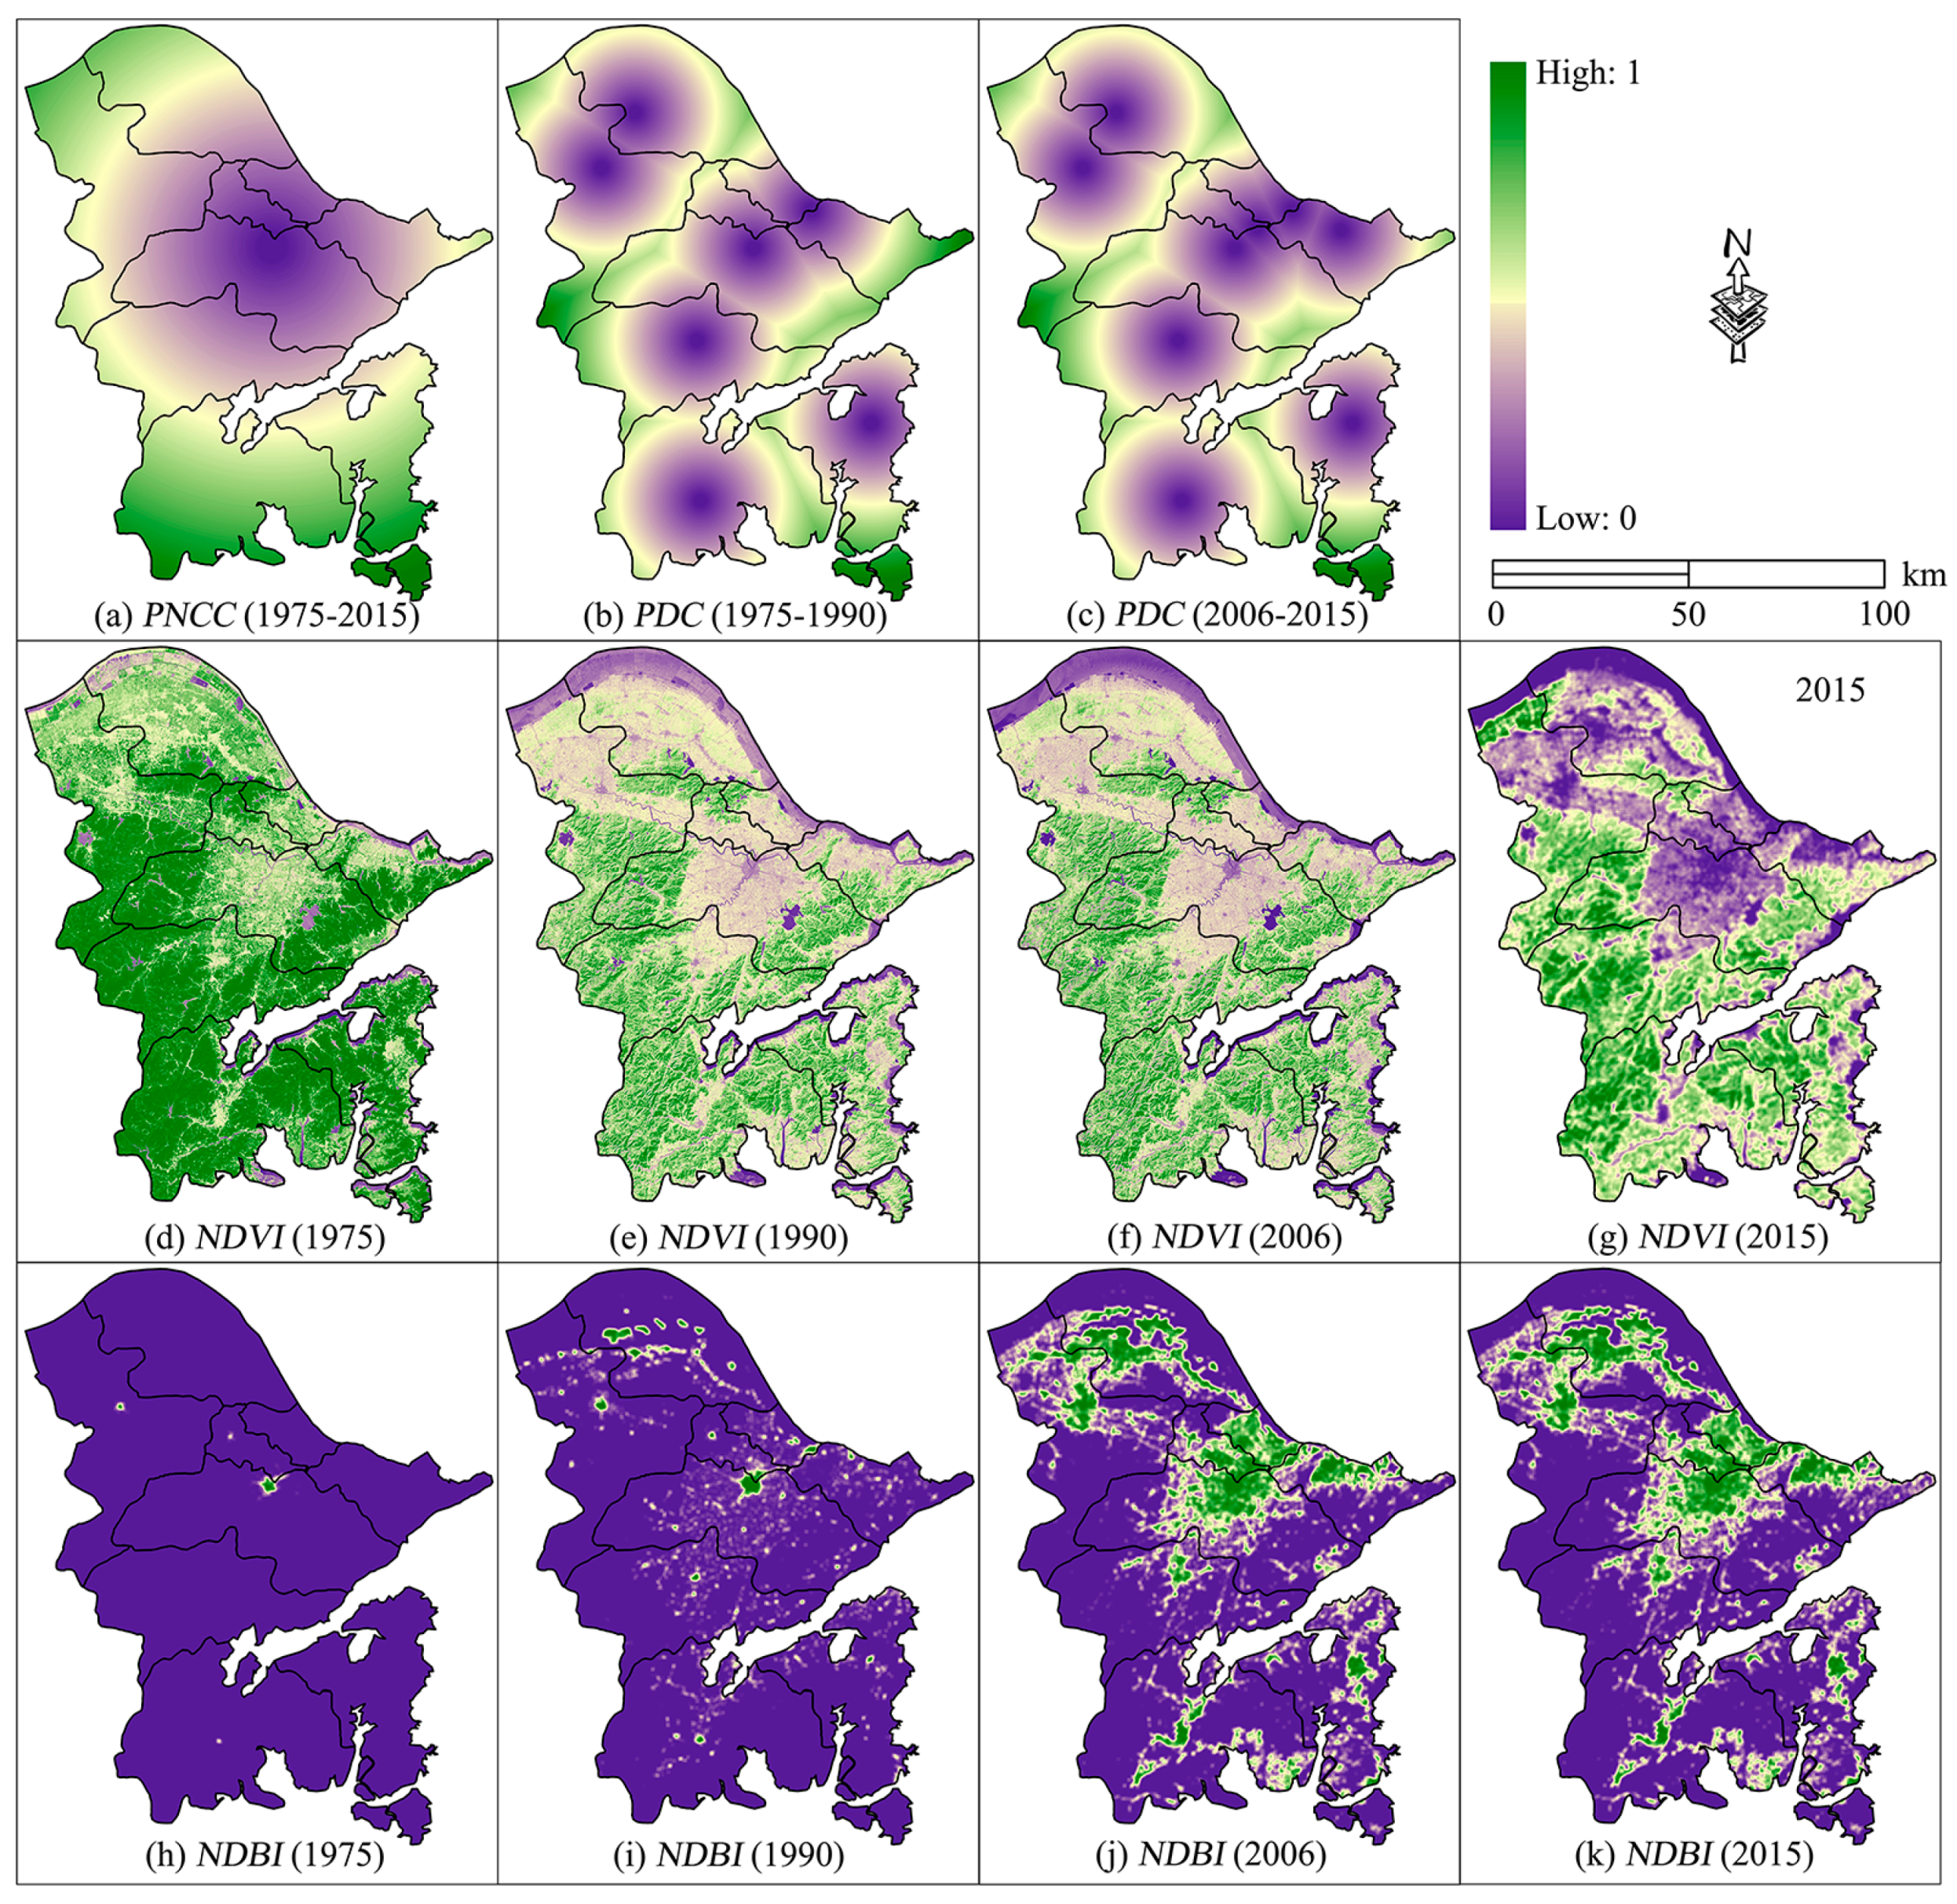
2.3. Input Variables
2.4. RER Assessment and Projection Methods
2.4.1. Definition of Five-Level RER Score
2.4.2. Principal Component Analysis (PCA)
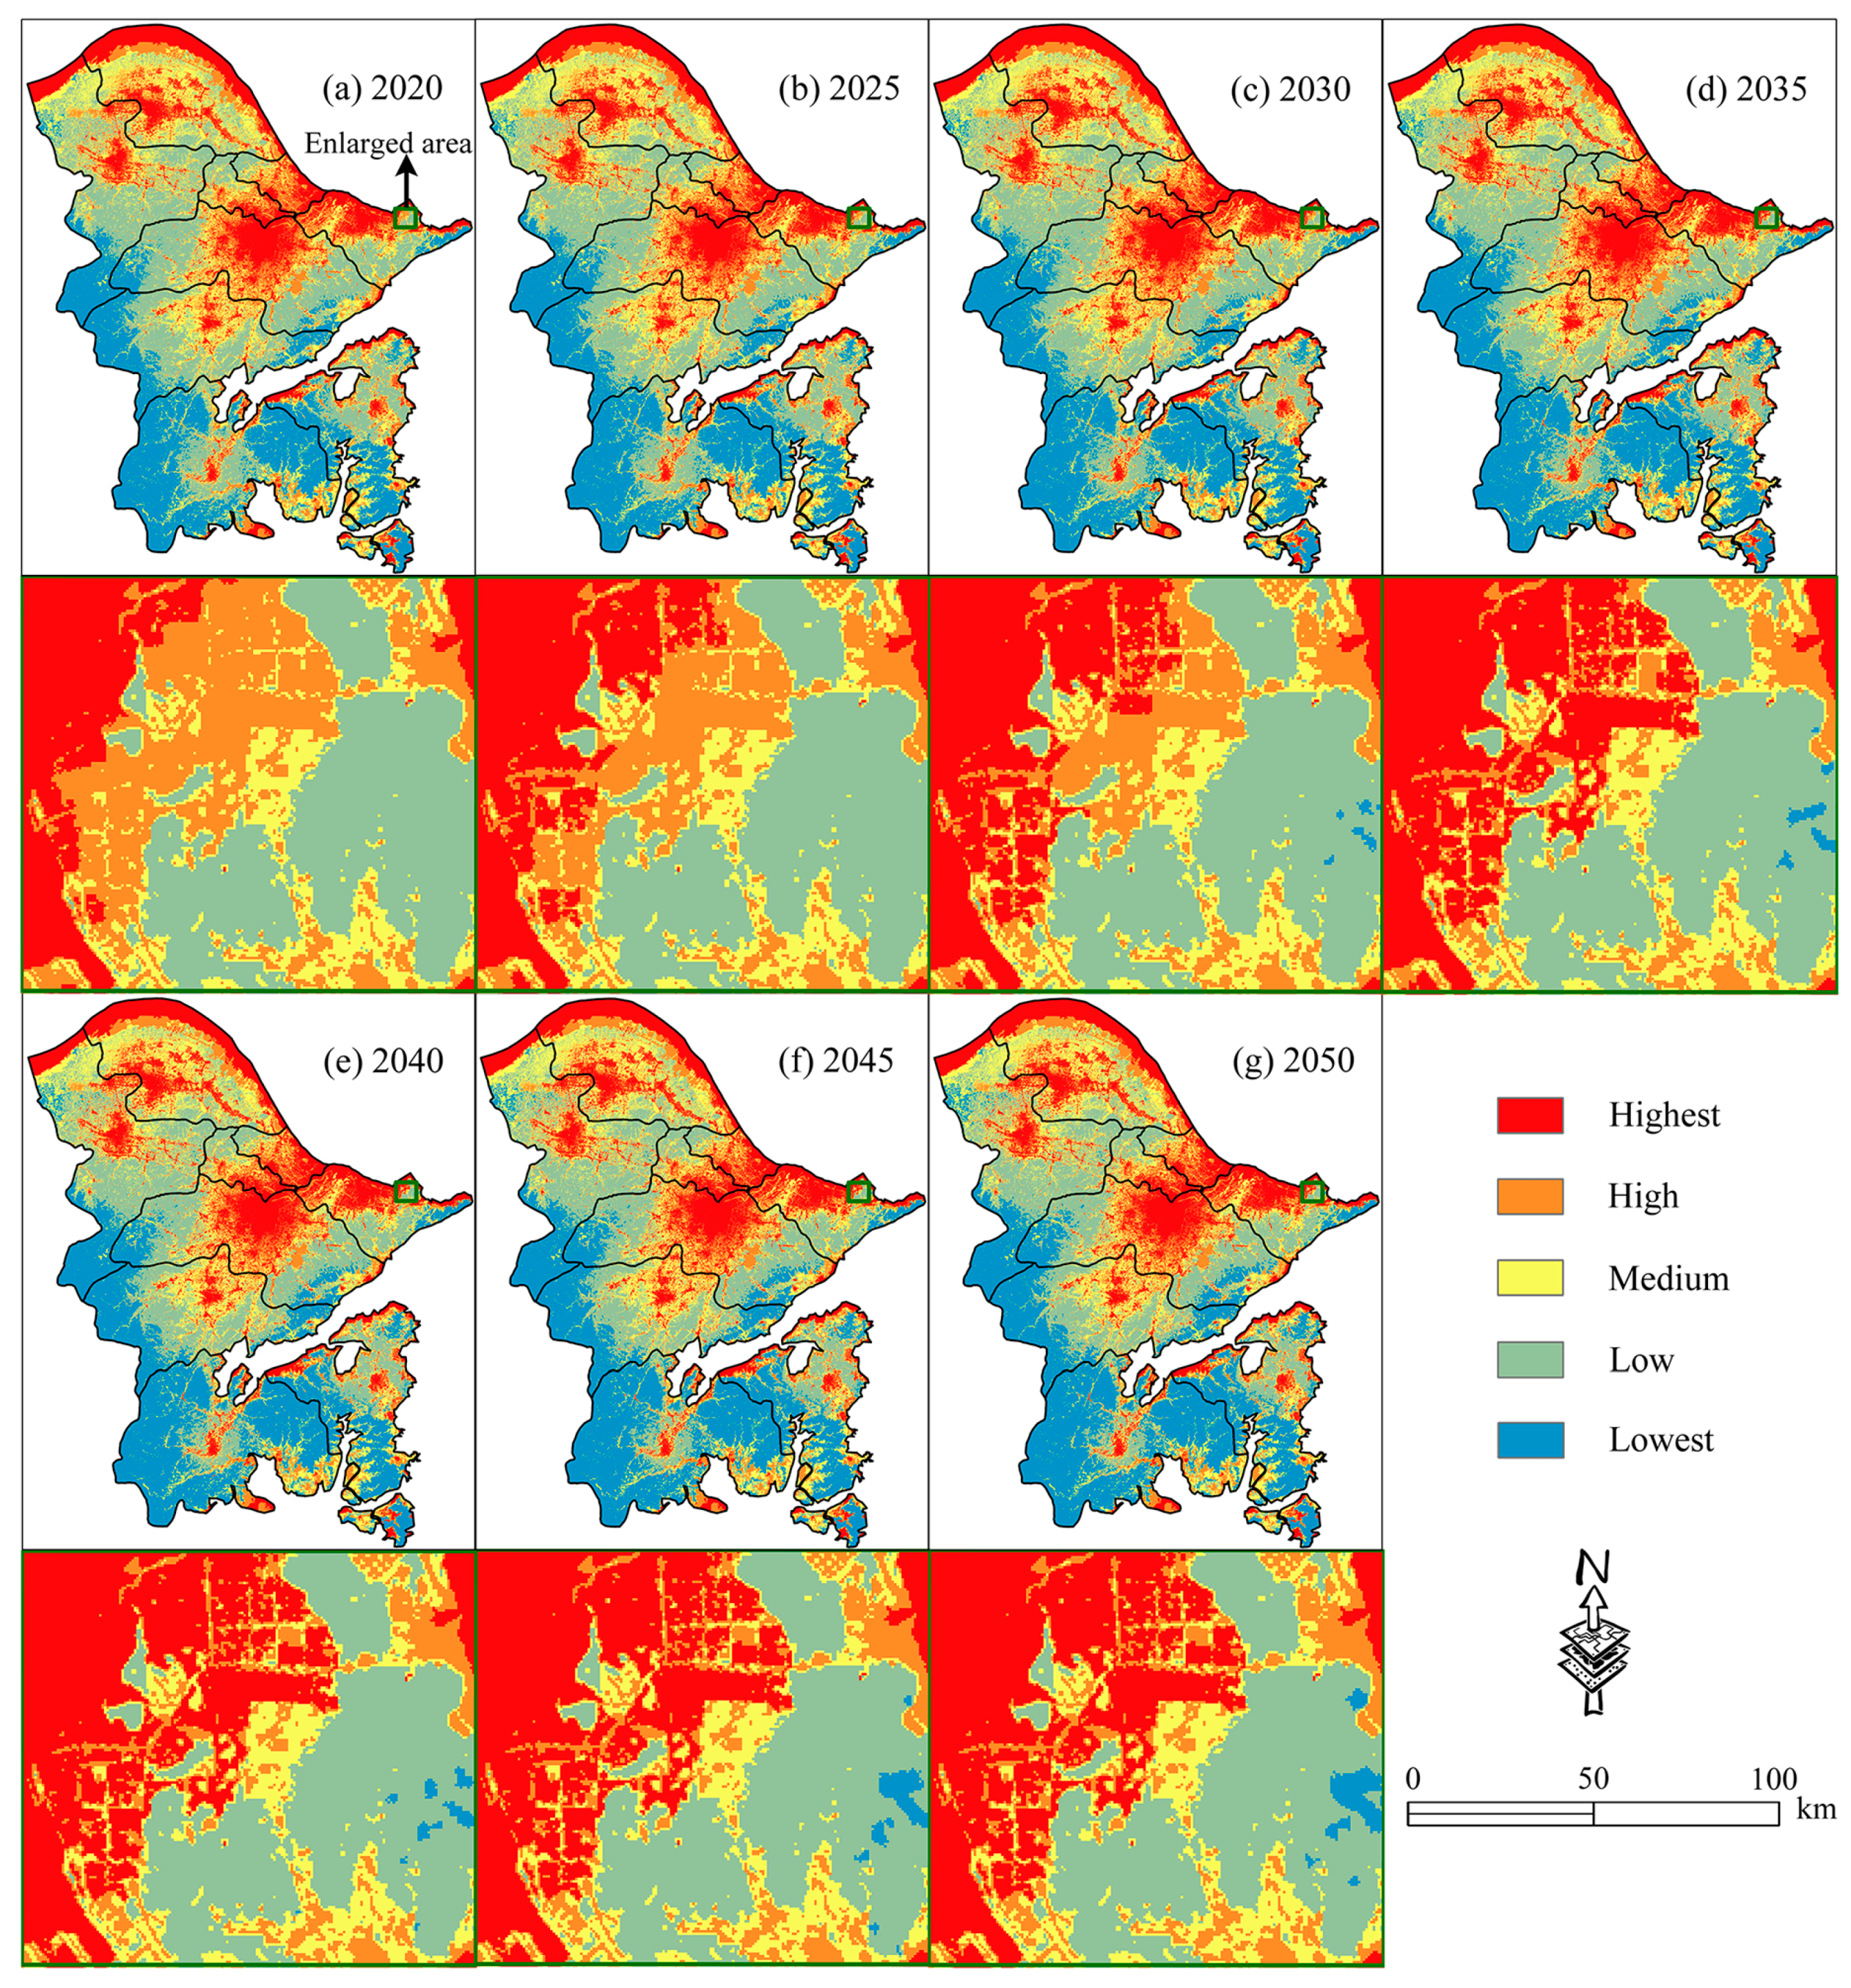
2.4.3. Projection Method of RER Scenarios
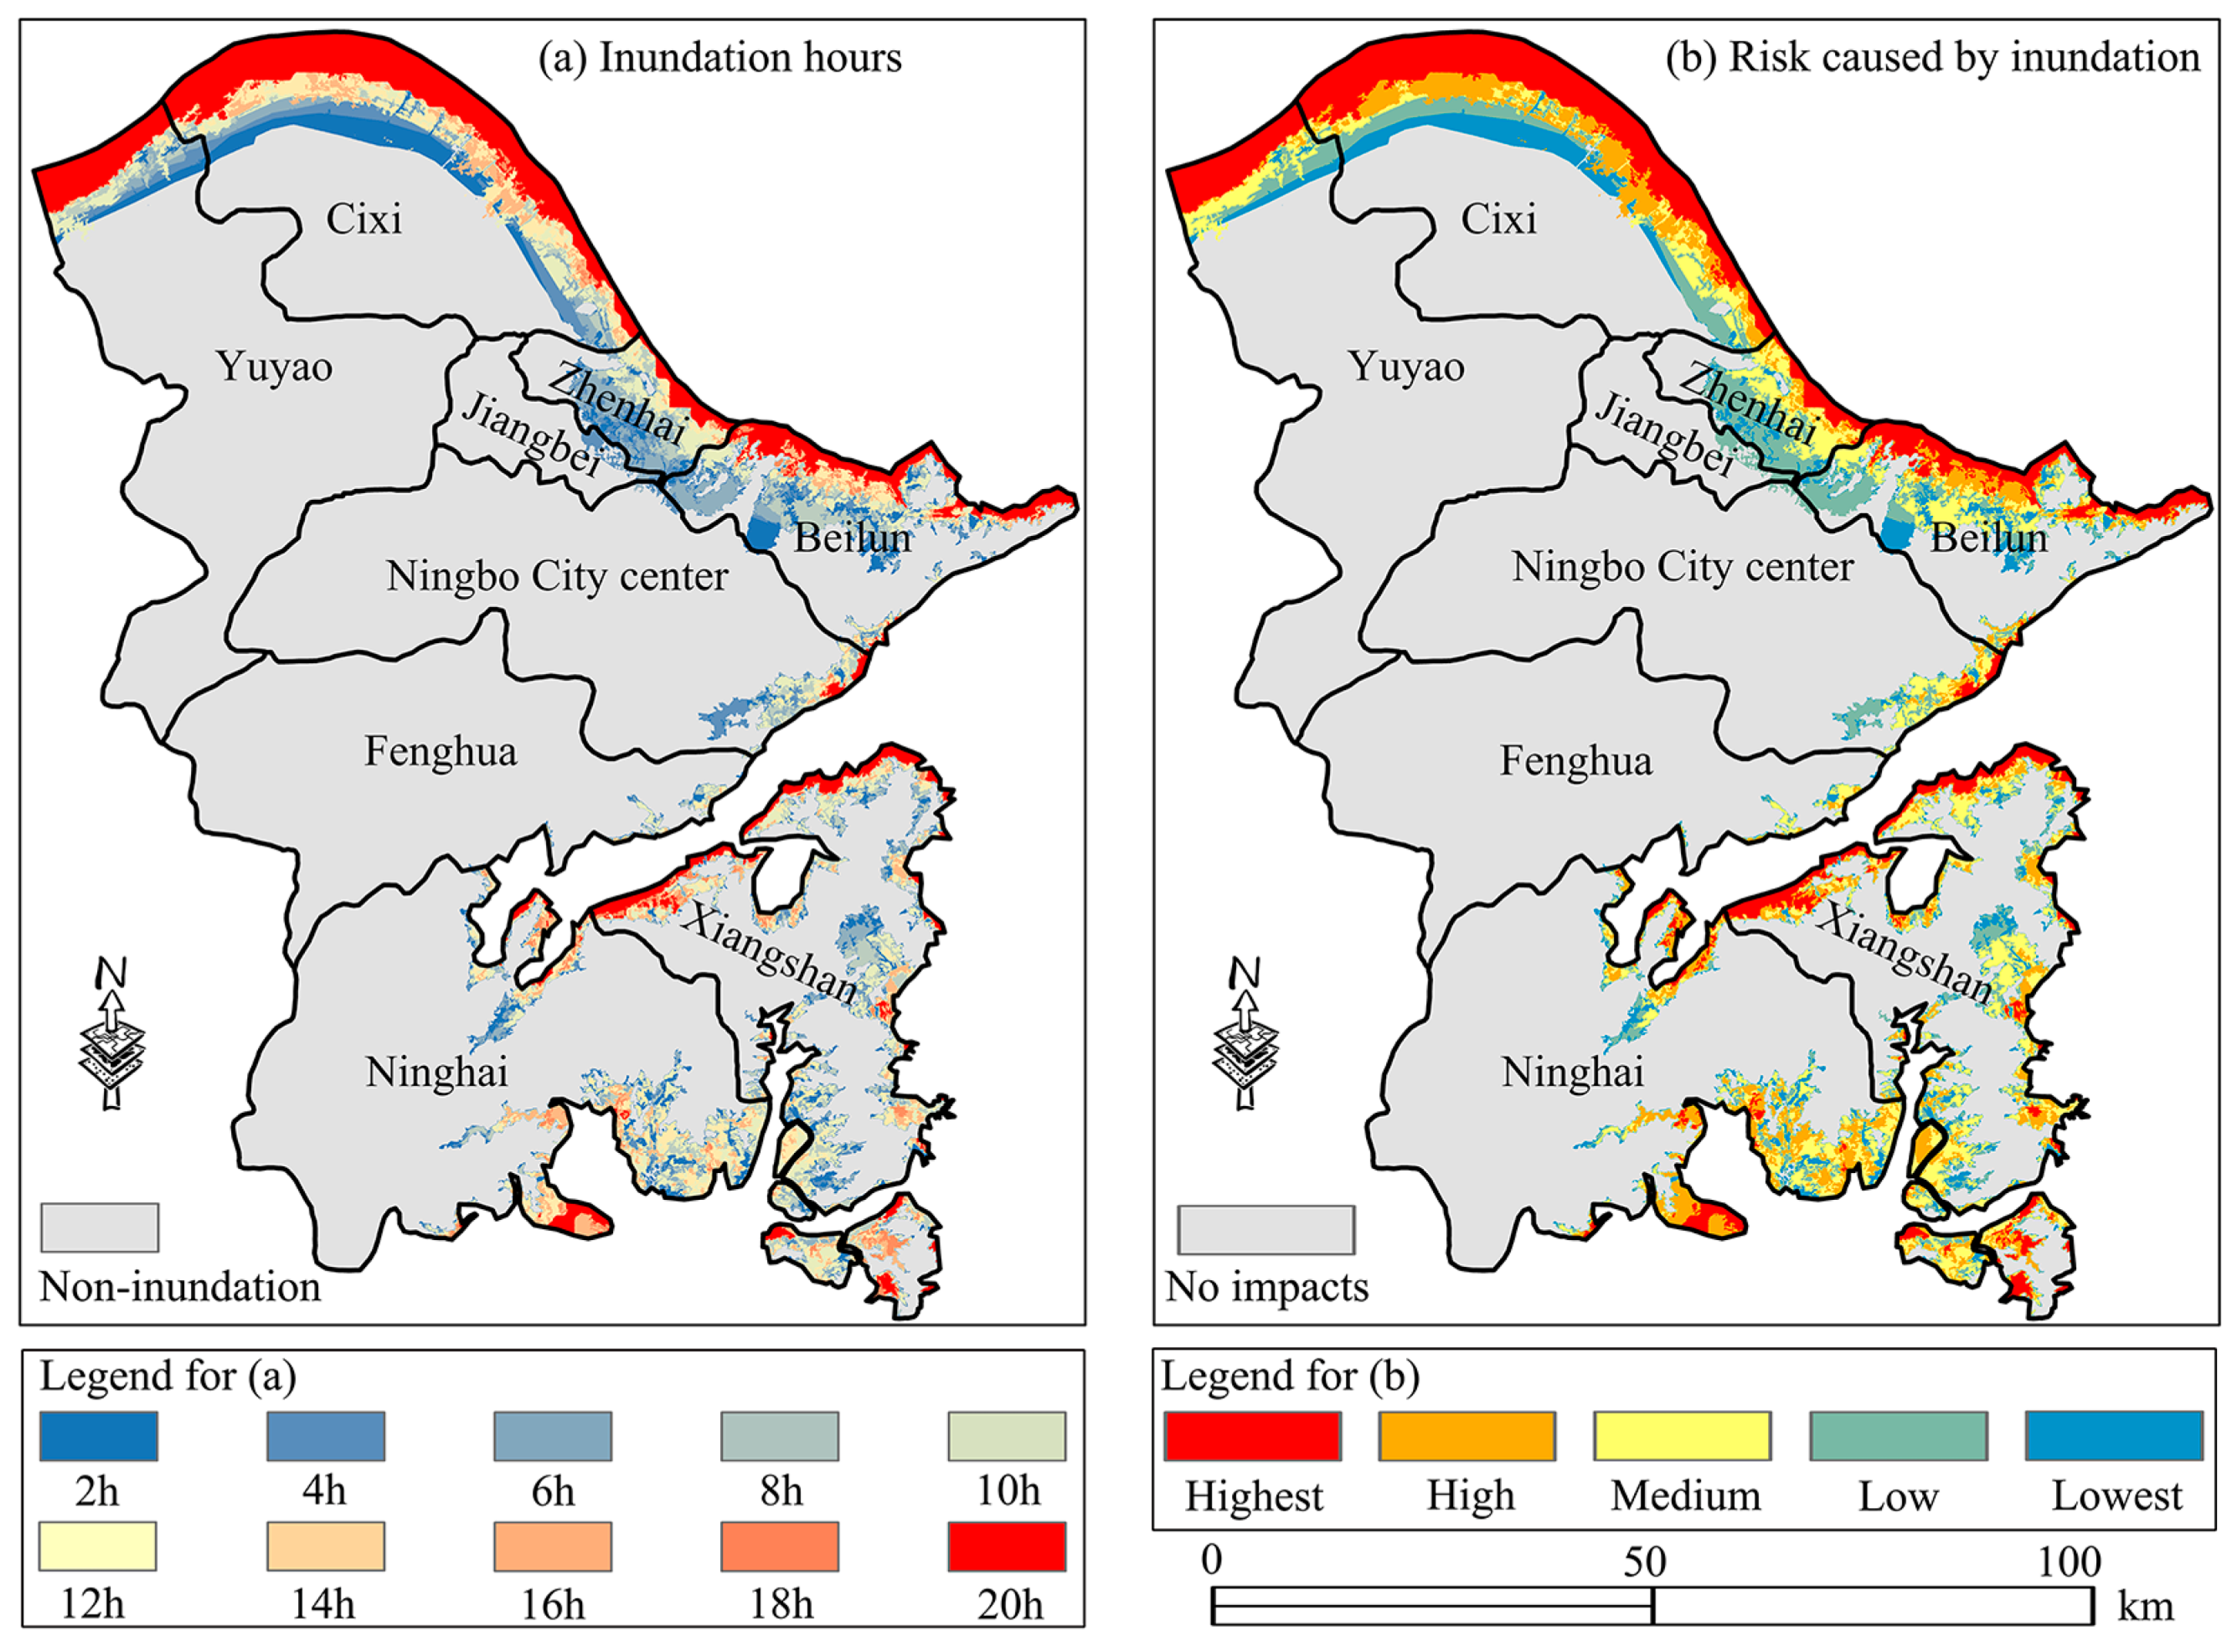
2.5. SLR Inundation Analysis
3. Results
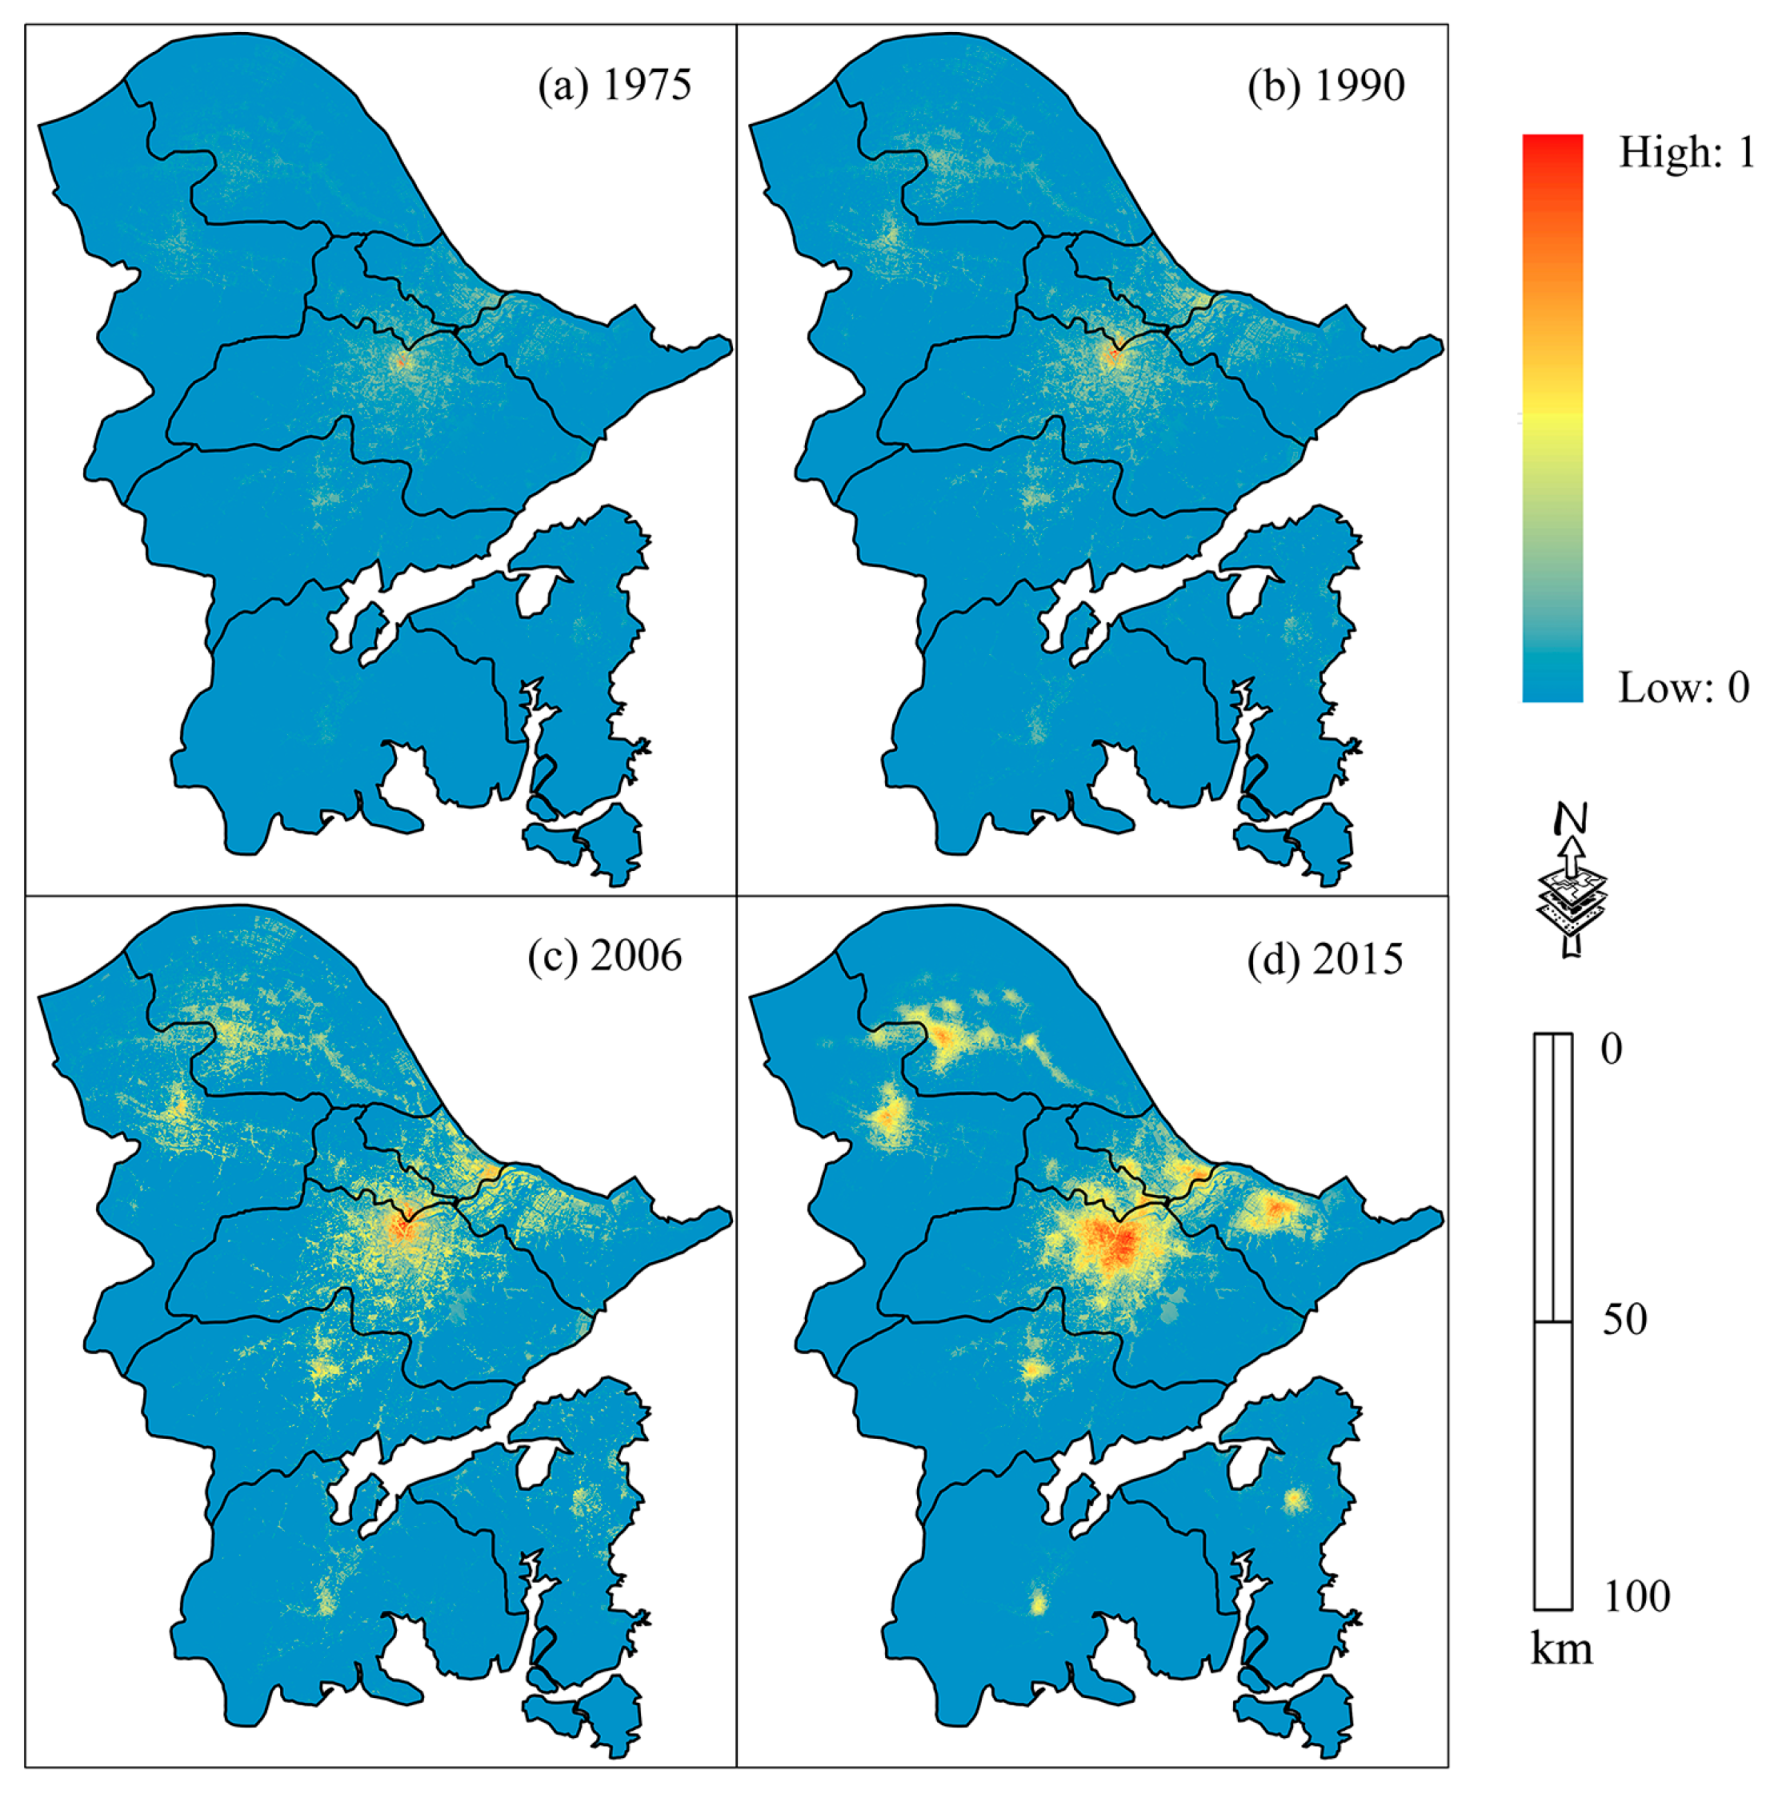
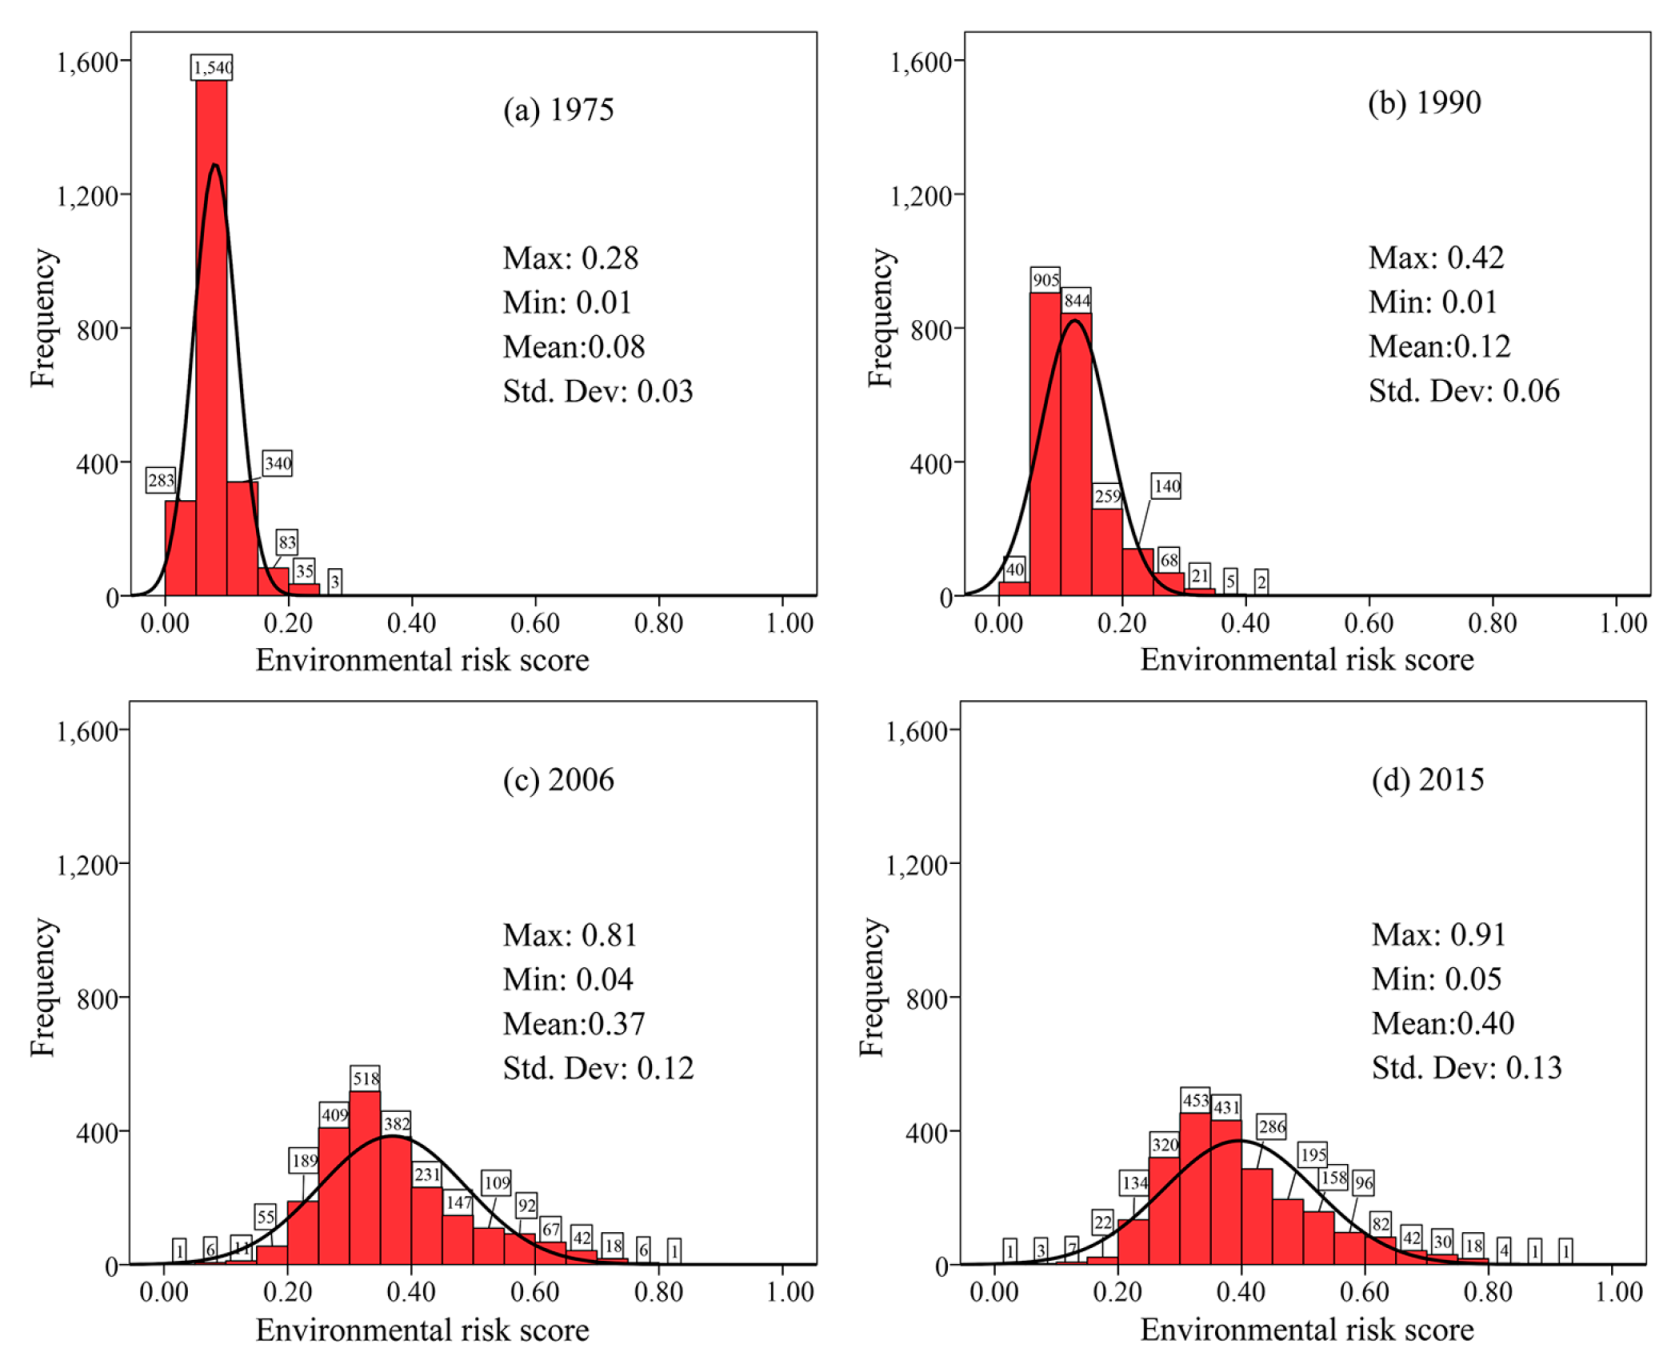
3.1. RER Spatial Patterns and Disparity
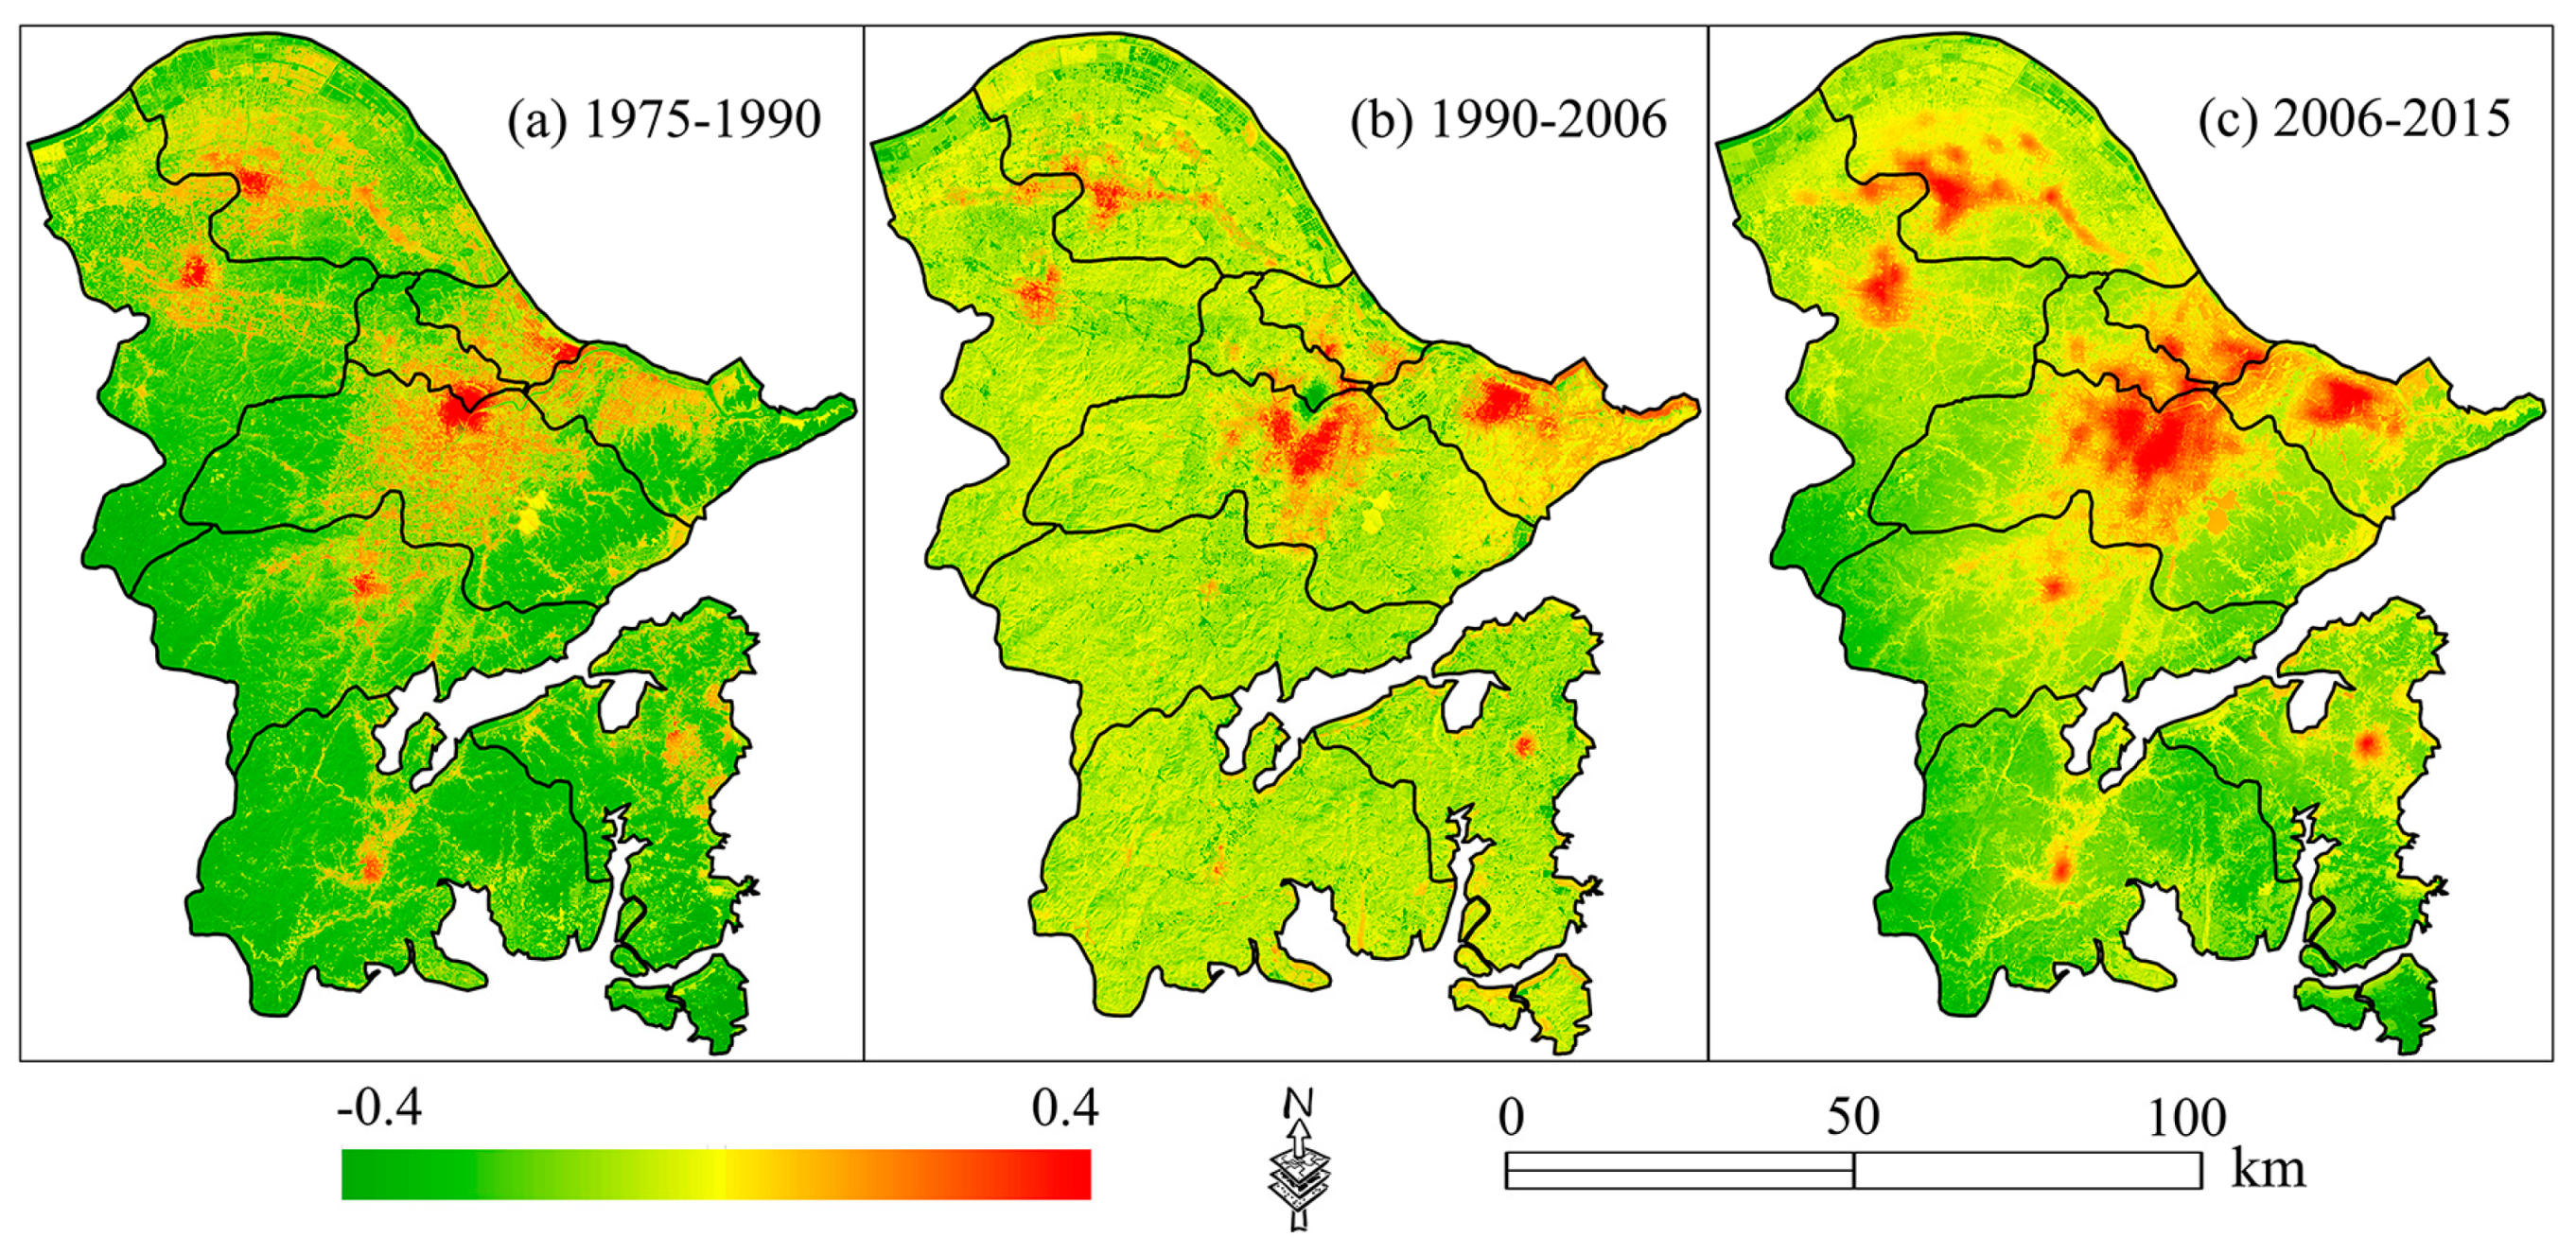
3.2. Changes in RER Patterns
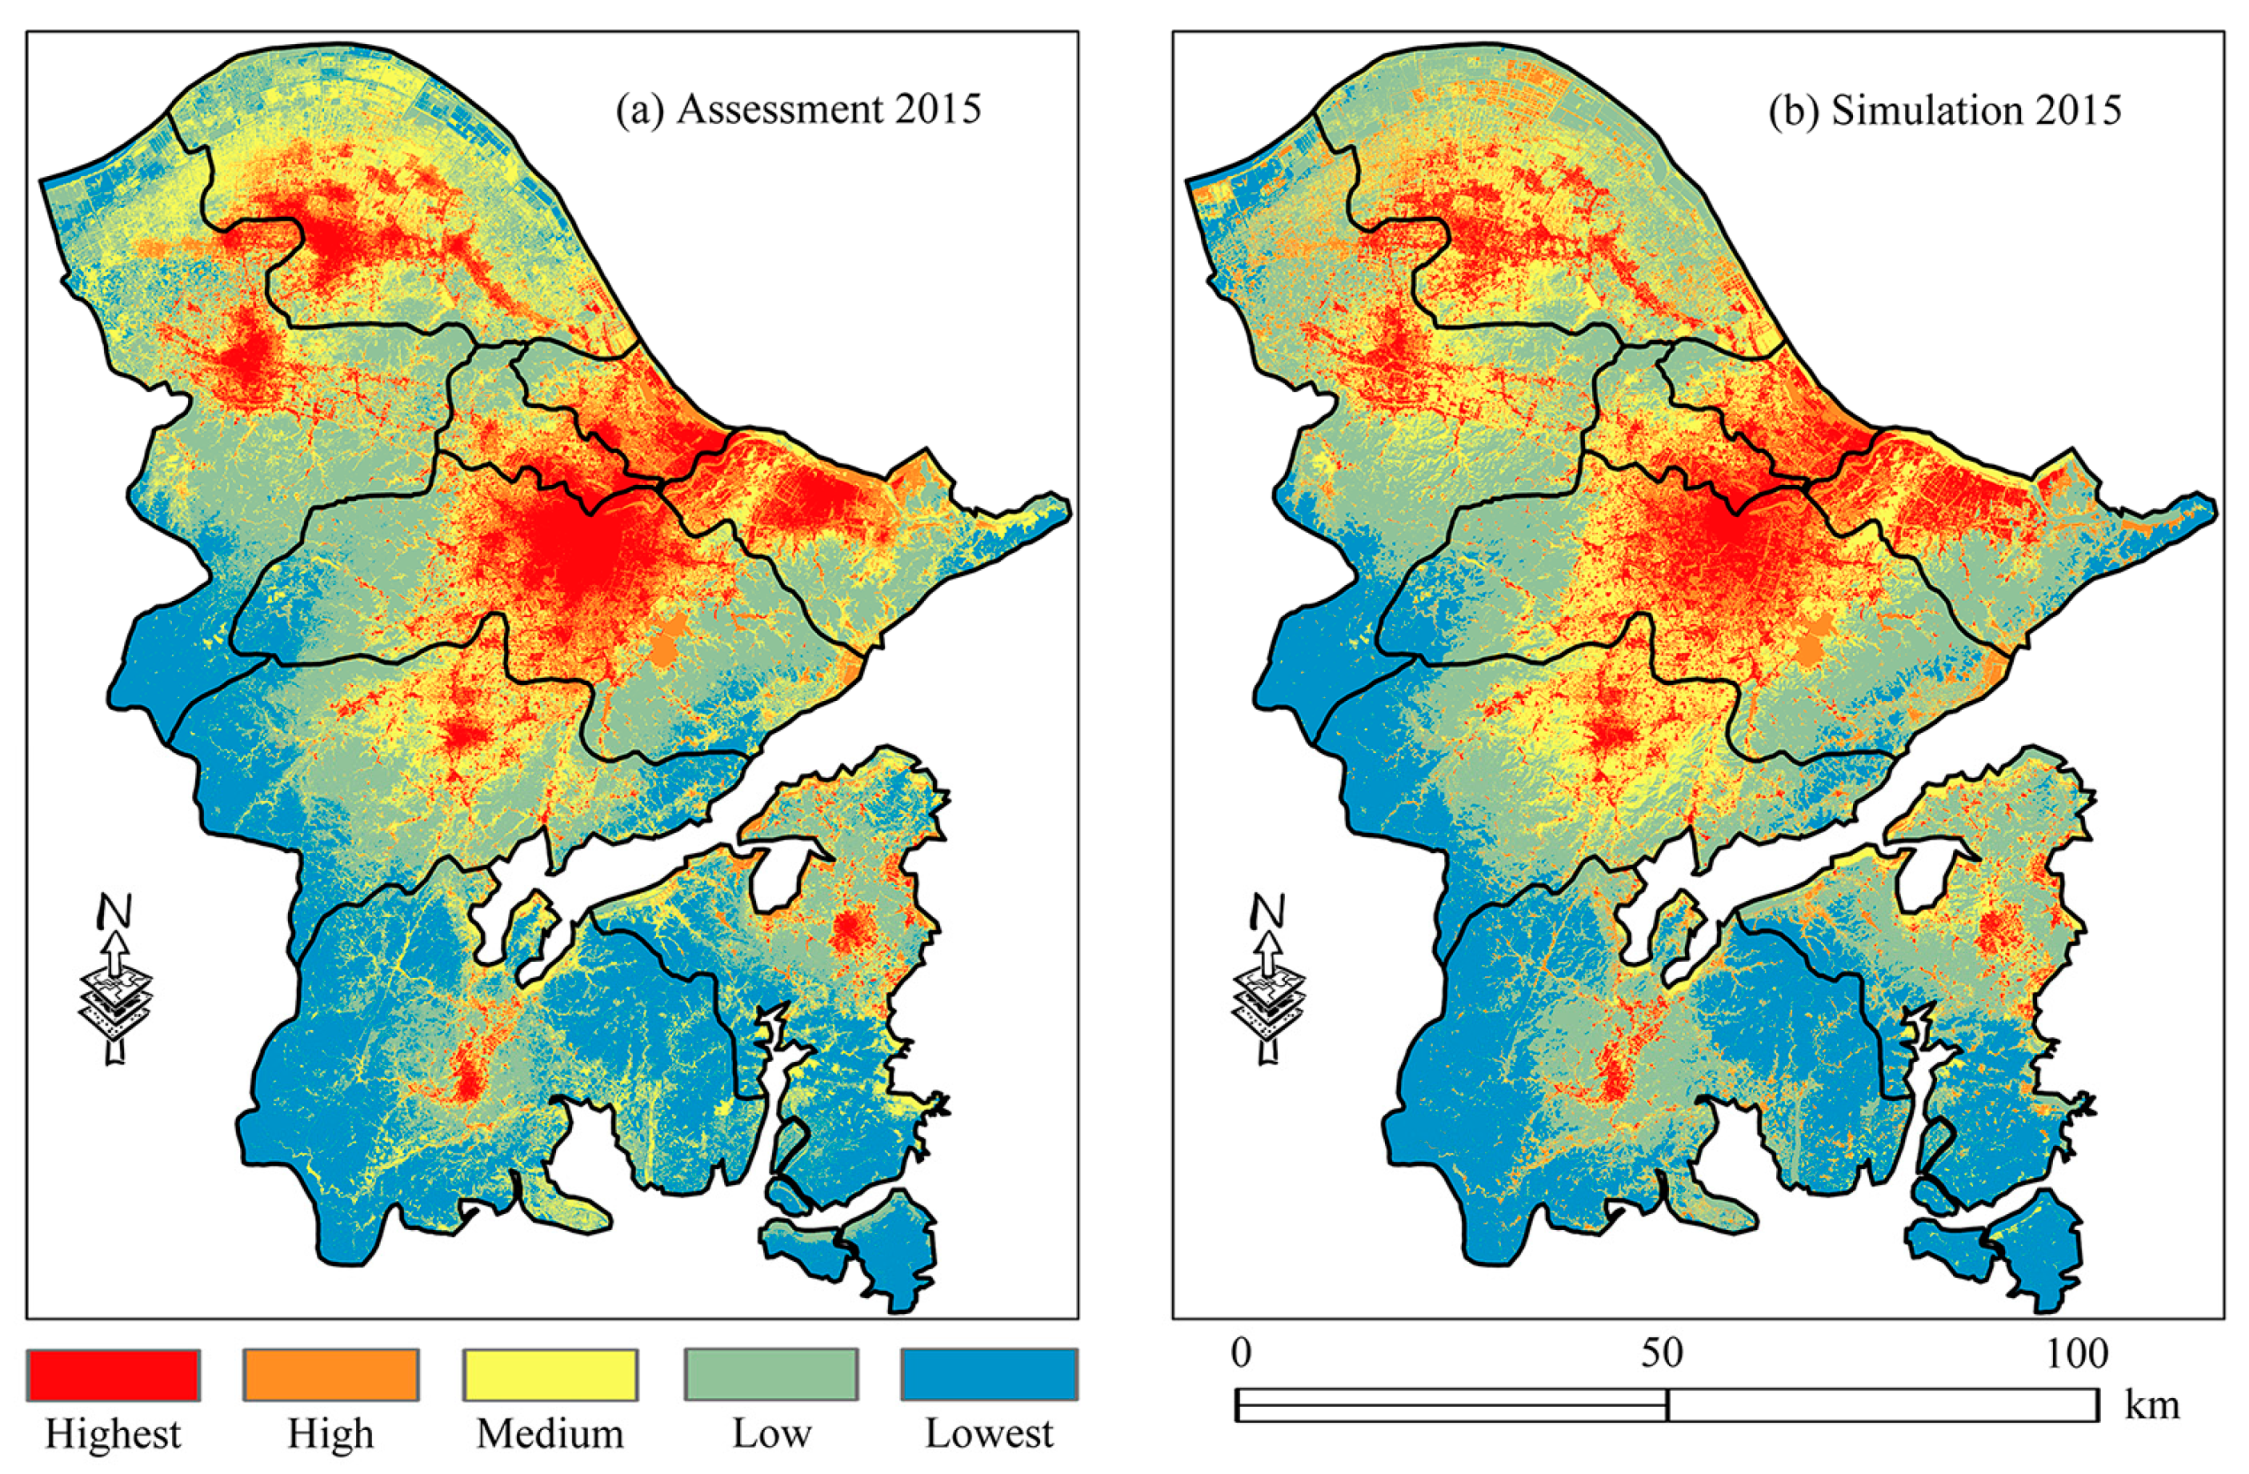
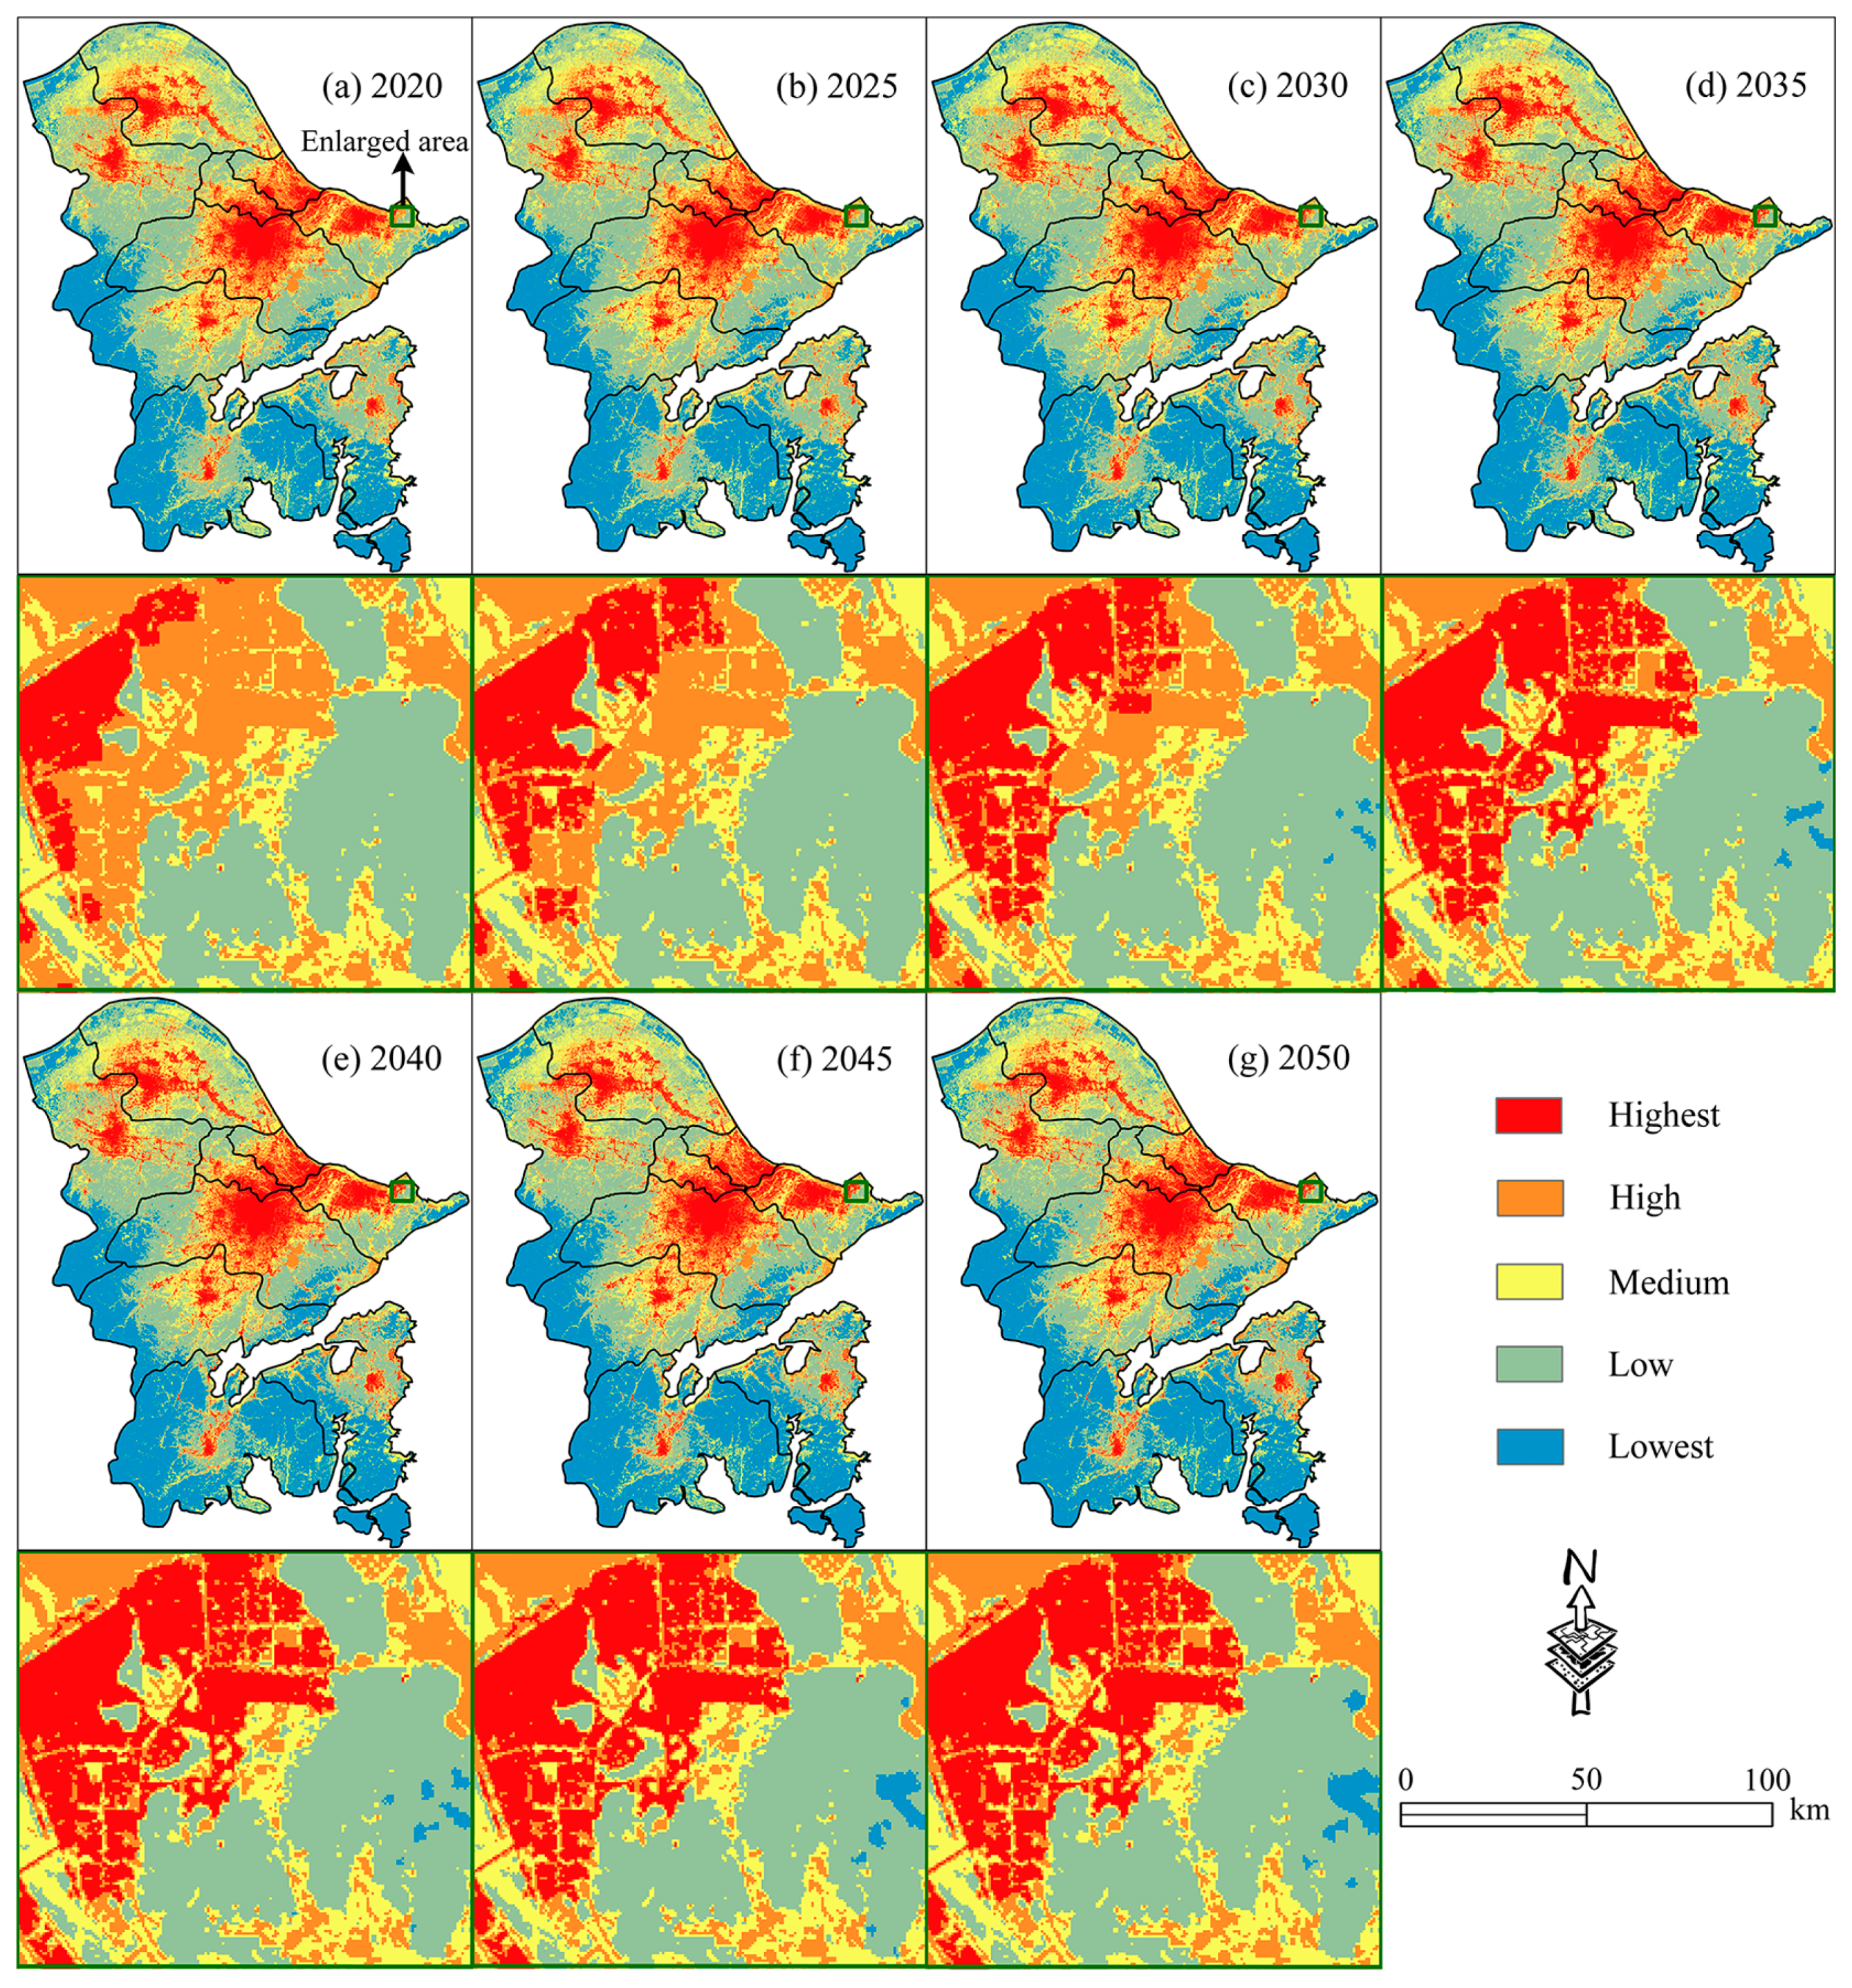
3.3. Future RER Scenarios
3.4. Impact of Storm Surge on RER
4. Discussion
4.1. Our Contribution towards RER Assessment
4.2. Major Findings and Additional Explanations
4.3. Limitations and Implications
5. Conclusions
Author Contributions
Funding
Conflicts of Interest
References
- Covello, V.T.; Merkhofer, M.W. Risk Assessment Methods: Approaches for Assessing Health and Environmental Risks; Plenum Press: New York, NY, USA, 2013; p. 317. [Google Scholar]
- Piers, B.; Piers, B.; Terry, C.; Ian, D.; Ben, W. At Risk: Natural Hazards, People’s Vulnerability and Disasters; Routledge: Abingdon, UK, 2004. [Google Scholar]
- Defries, R.S.; Rudel, T.; Uriarte, M.; Hansen, M. Deforestation driven by urban population growth and agricultural trade in the twenty-first century. Nat. Geosci. 2010, 3, 178–181. [Google Scholar] [CrossRef]
- Liddle, B. Age-structure, urbanization, and climate change in developed countries: Revisiting stirpat for disaggregated population and consumption-related environmental impacts. Popul. Environ. 2010, 31, 317–343. [Google Scholar] [CrossRef]
- Huang, Q.; Zheng, X.; Hu, Y. Analysis of land-use emergy indicators based on urban metabolism: A case study for Beijing. Sustainability 2015, 7, 7473–7491. [Google Scholar] [CrossRef]
- Cecchini, M.; Zambon, I.; Pontrandolfi, A.; Turco, R.; Colantoni, A.; Mavrakis, A.; Salvati, L. Urban sprawl and the ‘olive’ landscape: Sustainable land management for ‘crisis’ cities. Geojournal 2018, 84, 237–255. [Google Scholar] [CrossRef]
- Harley, C.D.G.; Randall Hughes, A.; Hultgren, K.M.; Miner, B.G.; Sorte, C.J.B.; Thornber, C.S.; Rodriguez, L.F.; Tomanek, L.; Williams, S.L. The impacts of climate change in coastal marine systems. Ecol. Lett. 2006, 9, 228–241. [Google Scholar] [CrossRef] [PubMed]
- Nicholls, R.J.; Cazenave, A. Sea level rise and its impact on coastal zones. Science 2010, 328, 1517–1520. [Google Scholar] [CrossRef] [PubMed]
- Xu, L.; Liu, G. The study of a method of regional environmental risk assessment. J. Environ. Manag. 2009, 90, 3290–3296. [Google Scholar] [CrossRef]
- Zhang, C.; Li, Y.; Xiong, S.; Lu, X.; Zhu, X. Regional environmental risk assessment and management guide for rapid urbanization process of a city cluster in China. Hum. Ecol. Risk Assess. Int. J. 2015, 22, 283–301. [Google Scholar] [CrossRef]
- Meng, X.; Zhang, Y.; Yu, X.; Bai, J.; Chai, Y.; Li, Y. Regional environmental risk assessment for the Nanjing chemical industry park: An analysis based on information-diffusion theory. Stoch. Environ. Res. Risk Assess. 2014, 28, 2217–2233. [Google Scholar] [CrossRef]
- Gretchen, G. Regional risk zonation of environmental pollution on marine and coastal zone. J. Mar. Environ. Eng. 2018, 10, 97–107. [Google Scholar]
- Wang, B.; Cheng, H. Regional Environmental Risk Assessment and Zoning Based on Matrix Method. In Proceedings of the International Conference on Multimedia Technology, Hangzhou, China, 26–28 July 2011; pp. 1644–1647. [Google Scholar]
- Albanese, S.; Vivo, B.D.; Lima, A.; Frattasio, G.; Kříbek, B.; Nyambe, I.; Majer, V. Prioritising environmental risk at the regional scale by a gis aided technique: The zambian copperbelt province case study. J. Geochem. Explor. 2014, 144, 433–442. [Google Scholar] [CrossRef]
- Jiang, S.; Zhai, Y.; Leng, S.; Wang, J.; Teng, Y. A hive model for regional integrated environmental risk assessment: A case study in China. Hum. Ecol. Risk Assess. Int. J. 2015, 22, 1002–1028. [Google Scholar] [CrossRef]
- Minolfi, G.; Albanese, S.; Lima, A.; Tarvainen, T.; Fortelli, A.; Vivo, B.D. A regional approach to the environmental risk assessment–human health risk assessment case study in the campania region. J. Geochem. Explor. 2016, 184, 400–416. [Google Scholar] [CrossRef]
- Narimisa, M.R.; Narimisa, M.R. The research of environmental impact assessment for oil refineries in Iran based on AHP and GIS. J. Hum. Cult. Stud. 2016, 1, 1396–1416. [Google Scholar]
- Jozi, S.A.; Shafiee, M.; Moradimajd, N.; Saffarian, S. An integrated shannon’s entropy-topsis methodology for environmental risk assessment of helleh protected area in Iran. Environ. Monit. Assess. 2012, 184, 6913–6922. [Google Scholar] [CrossRef] [PubMed]
- Sadiq, R.; Husain, T. A fuzzy-based methodology for an aggregative environmental risk assessment: A case study of drilling waste. Environ. Model. Softw. 2005, 20, 33–46. [Google Scholar] [CrossRef]
- Feng, Y.; Liu, Y.; Liu, Y. Spatially explicit assessment of land ecological security with spatial variables and logistic regression modeling in Shanghai, China. Stoch. Environ. Res. Risk Assess. 2017, 31, 2235–2249. [Google Scholar] [CrossRef]
- Feng, Y.; Yang, Q.; Tong, X.; Chen, L. Evaluating land ecological security and examining its relationships with driving factors using GIS and generalized additive model. Sci. Total Environ. 2018, 633, 1469–1479. [Google Scholar] [CrossRef]
- Sampath, D.M.R.; Boski, T.; Loureiro, C.; Sousa, C. Modelling of estuarine response to sea-level rise during the holocene: Application to the Guadiana Estuary–SW Iberia. Geomorphology 2015, 232, 47–64. [Google Scholar] [CrossRef]
- Webb, A.P.; Kench, P.S. The dynamic response of reef islands to sea-level rise: Evidence from multi-decadal analysis of island change in the central Pacific. Glob. Planet. Chang. 2010, 72, 234–246. [Google Scholar] [CrossRef]
- Stralberg, D.; Brennan, M.; Callaway, J.C.; Wood, J.K.; Schile, L.M.; Jongsomjit, D.; Kelly, M.; Parker, V.T.; Crooks, S. Evaluating tidal marsh sustainability in the face of sea-level rise: A hybrid modeling approach applied to san francisco bay. PLoS ONE 2011, 6, e27388. [Google Scholar] [CrossRef]
- McLeod, E.; Poulter, B.; Hinkel, J.; Reyes, E.; Salm, R. Sea-level rise impact models and environmental conservation: A review of models and their applications. Ocean Coast. Manag. 2010, 53, 507–517. [Google Scholar] [CrossRef]
- Wahl, T.; Jain, S.; Bender, J.; Meyers, S.D.; Luther, M.E. Increasing risk of compound flooding from storm surge and rainfall for major us cities. Nat. Clim. Chang. 2015, 5, 1093. [Google Scholar] [CrossRef]
- Mevik, B.-H.; Wehrens, R.; Liland, K.H. PLS: Partial least squares and principal component regression. Available online: https://cran.r-project.org/web/packages/pls/index.html (accessed on 14 March 2019).
- Akgun, A.; Kıncal, C.; Pradhan, B. Application of remote sensing data and gis for landslide risk assessment as an environmental threat to Izmir city (west Turkey). Environ. Monit. Assess. 2012, 184, 5453–5470. [Google Scholar] [CrossRef]
- Aydi, A.; Zairi, M.; Dhia, H.B. Minimization of environmental risk of landfill site using fuzzy logic, analytical hierarchy process, and weighted linear combination methodology in a geographic information system environment. Environ. Earth Sci. 2013, 68, 1375–1389. [Google Scholar] [CrossRef]
- Santini, M.; Caccamo, G.; Laurenti, A.; Noce, S.; Valentini, R. A multi-component gis framework for desertification risk assessment by an integrated index. Appl. Geogr. 2010, 30, 394–415. [Google Scholar] [CrossRef]
- Ali-Akbarpour, M.; Mohammadbeigi, A.; Tabatabaee, S.H.R.; Hatam, G. Spatial analysis of eco-environmental risk factors of cutaneous leishmaniasis in southern Iran. J. Cutan. Aesthet. Surg. 2012, 5, 30–35. [Google Scholar]
- Lahr, J.; Kooistra, L. Environmental risk mapping of pollutants: State of the art and communication aspects. Sci. Total Environ. 2010, 408, 3899–3907. [Google Scholar] [CrossRef]
- Wang, M.; Bai, Y.; Chen, W.; Markert, B.; Peng, C.; Ouyang, Z. A GIS technology based potential eco-risk assessment of metals in urban soils in Beijing, china. Environ. Pollut. 2012, 161, 235–242. [Google Scholar] [CrossRef]
- Feng, Y.; Liu, Y.; Tong, X. Comparison of metaheuristic cellular automata models: A case study of dynamic land use simulation in the Yangtze River delta. Comput. Environ. Urban Syst. 2018, 70, 138–150. [Google Scholar] [CrossRef]
- Liu, X.; Liang, X.; Li, X.; Xu, X.; Ou, J.; Chen, Y.; Li, S.; Wang, S.; Pei, F. A future land use simulation model (FLUS) for simulating multiple land use scenarios by coupling human and natural effects. Landsc. Urban Plan. 2017, 168, 94–116. [Google Scholar] [CrossRef]
- Feng, Y. Modeling dynamic urban land-use change with geographical cellular automata and generalized pattern search-optimized rules. Int. J. Geogr. Inf. Sci. 2017, 31, 1198–1219. [Google Scholar]
- Liang, X.; Liu, X.; Li, X.; Chen, Y.; Tian, H.; Yao, Y. Delineating multi-scenario urban growth boundaries with a ca-based flus model and morphological method. Landsc. Urban Plan. 2018, 177, 47–63. [Google Scholar] [CrossRef]
- Wu, Y.; Chen, Y.; Deng, X.; Hui, E.C.M. Development of characteristic towns in china. Habitat Int. 2018, 77, 21–31. [Google Scholar] [CrossRef]
- Ningbo Municipal Statistics Burean. Ningbo Statistical Yearbook in 2015; Ningbo Municipal Statistics Burean: Ningbo, China, 2016.
- Liu, R.; Borthwick, A.G. Measurement and assessment of carrying capacity of the environment in Ningbo, China. J. Environ. Manag. 2011, 92, 2047–2053. [Google Scholar] [CrossRef]
- Wang, D.; Luo, Z.; Zhang, X.; Lin, L.; Du, M.; Laing, G.D.; Yan, C. Occurrence, distribution and risk assessment of estrogenic compounds for three source water types in Ningbo city, China. Environ. Earth Sci. 2015, 74, 5961–5969. [Google Scholar] [CrossRef]
- Feng, Y.; Yang, Q.; Hong, Z.; Cui, L. Modelling coastal land use change by incorporating spatial autocorrelation into cellular automata models. Geocarto Int. 2016, 33, 470–488. [Google Scholar] [CrossRef]
- Zheng, Q.; Yang, X.; Wang, K.; Huang, L.; Shahtahmassebi, A.R.; Gan, M.; Weston, M.V. Delimiting urban growth boundary through combining land suitability evaluation and cellular automata. Sustainability 2017, 9, 2213. [Google Scholar] [CrossRef]
- Wang, H.; Long, H.; Li, X.; Yu, F. Evaluation of changes in ecological security in china’s qinghai lake basin from 2000 to 2013 and the relationship to land use and climate change. Environ. Earth Sci. 2013, 72, 341–354. [Google Scholar] [CrossRef]
- Liu, X.; Li, X.; Chen, Y.; Tan, Z.; Li, S.; Ai, B. A new landscape index for quantifying urban expansion using multi-temporal remotely sensed data. Landsc. Ecol. 2010, 25, 671–682. [Google Scholar] [CrossRef]
- Liu, Y.; Feng, Y. Simulating the impact of economic and environmental strategies on future urban growth scenarios in Ningbo, China. Sustainability 2016, 8, 1045. [Google Scholar] [CrossRef]
- Zheng, R.; Liu, Y.; Dong, Y.; Zhu, G. Appraisal of land resources security in guangzhou based on major function regionalization. Acta Geogr. Sin. 2009, 6, 654–664. [Google Scholar]
- Hopping, K.A.; Yeh, E.T.; Harris, R.B. Linking people, pixels, and pastures: A multi-method, interdisciplinary investigation of how rangeland management affects vegetation on the Tibetan plateau. Appl. Geogr. 2018, 94, 147–162. [Google Scholar] [CrossRef]
- Zheng, Y.; Ren, C.; Xu, Y.; Wang, R.; Ho, J.; Lau, K.; Ng, E. GIS-based mapping of local climate zone in the high-density city of Hong Kong. Urban Clim. 2017, 24, 419–448. [Google Scholar] [CrossRef]
- Wellmann, T.; Haase, D.; Knapp, S.; Salbach, C.; Selsam, P.; Lausch, A. Urban land use intensity assessment: The potential of spatio-temporal spectral traits with remote sensing. Ecol. Indic. 2018, 85, 190–203. [Google Scholar] [CrossRef]
- Wenskovitch, J.; Crandell, I.; Ramakrishnan, N.; House, L.; Leman, S.; North, C. Towards a systematic combination of dimension reduction and vlustering in visual analytics. IEEE Trans. Vis. Comput. Graph. 2018, 24, 131–141. [Google Scholar] [CrossRef]
- Sui, L.; Zheng, J.; Yu, J.; Wang, X. Comprehensive evaluation on shale fracability using principal component analysis. Electron. J. Geotech. Eng. 2015, 20, 5965–5976. [Google Scholar]
- Halmy, M.W.A.; Gessler, P.E.; Hicke, J.A.; Salem, B.B. Land use/land cover change detection and prediction in the north-western coastal desert of Egypt using markov-ca. Appl. Geogr. 2015, 63, 101–112. [Google Scholar] [CrossRef]
- State Ocean Administration of China. The Bulletin of Sea Level in China in 2011. Available online: http://www.soa.gov.cn/zwgk/hygb/zghpmgb/201211/t20121105_5568.html (accessed on 5 May 2018).
- Shi, Y. Trends of natural disasters in china under global warming. J. Nat. Disaster 1996, 5, 102–116. [Google Scholar]
- Ravela, S.; Neumann, J.E.; Verly, C.; Ludwig, L.C.; Emanuel, K.A. Risks of coastal storm surge and the effect of sea level rise in the red river delta, Vietnam. Sustainability 2015, 7, 6553–6572. [Google Scholar]
- Yu, G.; Zhang, S.; Yu, Q.; Fan, Y.; Zeng, Q.; Wu, L.; Zhou, R.R.; Nan, N.; Zhao, P. Assessing ecological security at the watershed scale based on RS/GIS: A case study from the Hanjiang River basin. Stoch. Environ. Res. Risk Assess. 2014, 28, 307–318. [Google Scholar] [CrossRef]
- He, T.; Yang, Z.; Tao, L.; Shen, Y.; Fu, X.; Qian, X.; Zhang, Y.; Yong, W.; Xu, Z.; Zhu, S. Ambient air pollution and years of life lost in Ningbo, China. Sci. Rep. 2016, 6, 22485. [Google Scholar] [CrossRef]
- Liu, Y.L.; Feng, Y.H.; Zhe, Z.; Zhang, Q.W.; Su, S.L. Socioeconomic drivers of forest loss and fragmentation: A comparison between different land use planning schemes and policy implications. Land Use Policy 2016, 54, 58–68. [Google Scholar] [CrossRef]
- McKinsey Global Institute. Preparing for China’s Urban Billions. Available online: https://www.Mckinsey.Com/mgi/overview (accessed on 5 May 2018).
- Feng, Y.; Liu, Y.; Tong, X. Spatiotemporal variation of landscape patterns and their spatial determinants in shanghai, china. Ecol. Indic. 2018, 87, 22–32. [Google Scholar] [CrossRef]


| Raw Data | Type | Date | Description | Provider |
|---|---|---|---|---|
| Administrative maps | Graphic | 1990, 2006 | Administrative boundaries and centers | National Catalogue Service for Geographic Information (www.webmap.cn) |
| Landsat-1 (MSS) | Image | 1975.2 | A remote sensing image for assessing vegetation coverage and built-up area | Open Spatial Data Sharing Project (ids.ceode.ac.cn) |
| Landsat-5 (TM) | Image | 1990.6 | A remote sensing image for assessing vegetation coverage and built-up area | Open Spatial Data Sharing Project (ids.ceode.ac.cn) |
| Landsat-5 (TM) | Image | 2006.3 | A remote sensing image for assessing vegetation coverage and built-up area | Open Spatial Data Sharing Project (ids.ceode.ac.cn) |
| Landsat-8 (OLI) | Image | 2015.1 | A remote sensing image for assessing vegetation coverage and built-up area | Open Spatial Data Sharing Project (ids.ceode.ac.cn) |
| ASTER GDEM | Image | 2010.7 | A map of Ningbo terrain | Geospatial Data Cloud (gscloud.cn) |
| Variable | Meaning | Purpose |
|---|---|---|
| PNCC | Proximity to Ningbo City center | Produce the distance to the Ningbo City center and evaluate its impact on the environments. |
| PDC | Proximity to district centers | Produce the distances to the district centers and evaluate their impact on the environments. |
| NDBI | Normalized difference built-up index | Produce the built-up density and evaluate its impact on the environments. |
| NDVI | Normalized difference vegetation index | Produce the vegetation coverage and evaluate its impact on the environments. |
| Item | Method | Indicator |
|---|---|---|
| Definition of five-level RER | Score classification | Lowest risk [0.0, 0.2), low risk [0.2, 0.4), medium risk [0.4, 0.6), high risk [0.6, 0.8), and highest risk [0.8, 1.0] |
| RER assessment method | Principal component analysis (PCA) | Total cumulative variance |
| RER projection method | Cellular automata (FLUS) | Kappa, overall accuracy, producer’s accuracy, user’s accuracy, omission error, and commission error |
| ER Level | Overall Accuracy (%) | Kappa Coefficient (%) | Producer’s Accuracy (%) | User’s Accuracy (%) | Omission Error (%) | Commission Error (%) |
|---|---|---|---|---|---|---|
| Highest | 77.9 | 77.3 | 88.9 | 88.8 | 11.1 | 11.2 |
| High | 69.4 | 64.6 | 30.6 | 35.4 | ||
| Medium | 71.1 | 71.2 | 28.9 | 28.8 | ||
| Low | 81.3 | 81.3 | 18.7 | 18.7 | ||
| Lowest | 85.3 | 88.3 | 14.7 | 11.7 |
| Year | Percentage at Each RER Level | ||||
|---|---|---|---|---|---|
| Highest | High | Medium | Low | Lowest | |
| 2015 | 9.1 | 10.8 | 21.6 | 35.5 | 23.1 |
| 2020 | 10.0 | 10.1 | 21.0 | 34.4 | 24.5 |
| 2025 | 11.0 | 9.5 | 20.4 | 33.3 | 25.8 |
| 2030 | 12.0 | 8.9 | 19.7 | 32.2 | 27.2 |
| 2035 | 13.0 | 8.3 | 19.1 | 31.0 | 28.6 |
| 2040 | 13.9 | 7.7 | 18.5 | 30.0 | 29.9 |
| 2045 | 14.9 | 7.1 | 17.8 | 28.9 | 31.3 |
| 2050 | 15.9 | 6.5 | 17.1 | 27.9 | 32.6 |
| Flooding Hour | Flooding Area (km2) Corresponding to Different Bathymetry | |||||||||
|---|---|---|---|---|---|---|---|---|---|---|
| 1 m | 2 m | 3 m | 4 m | 5 m | 6 m | 7 m | 8 m | 9 m | 10 m | |
| 2 | 503.6 | 61.2 | 172.7 | 218.9 | 275.3 | 231.2 | 217.8 | 192.1 | 100.0 | 132.0 |
| 4 | 0 | 503.6 | 61.2 | 172.7 | 218.9 | 275.3 | 231.2 | 217.8 | 192.1 | 100.0 |
| 6 | 0 | 0 | 503.6 | 61.2 | 172.7 | 218.9 | 275.3 | 231.2 | 217.8 | 192.1 |
| 8 | 0 | 0 | 0 | 503.6 | 61.2 | 172.7 | 218.9 | 275.3 | 231.2 | 217.8 |
| 10 | 0 | 0 | 0 | 0 | 503.6 | 61.2 | 172.7 | 218.9 | 275.3 | 231.2 |
| 12 | 0 | 0 | 0 | 0 | 0 | 503.6 | 61.2 | 172.7 | 218.9 | 275.3 |
| 14 | 0 | 0 | 0 | 0 | 0 | 0 | 503.6 | 61.2 | 172.7 | 218.9 |
| 16 | 0 | 0 | 0 | 0 | 0 | 0 | 0 | 503.6 | 61.2 | 172.7 |
| 18 | 0 | 0 | 0 | 0 | 0 | 0 | 0 | 0 | 503.6 | 61.2 |
| 20 | 0 | 0 | 0 | 0 | 0 | 0 | 0 | 0 | 0 | 503.6 |
| Total | 503.6 | 564.8 | 737.5 | 956.4 | 1231.7 | 1462.9 | 1680.7 | 1872.8 | 1972.8 | 2104.8 |
| No Impact (km2) | Affected Area (km2) | Total Area (km2) | ||||
|---|---|---|---|---|---|---|
| Highest | High | Medium | Low | Lowest | ||
| 7064.8 | 564.8 | 391.6 | 506.5 | 409.8 | 231.9 | 9169.4 |
| Year | Percentage (%) | ||||
|---|---|---|---|---|---|
| Highest | High | Medium | Low | Lowest | |
| 2020 | 15.6 | 13.0 | 20.9 | 29.7 | 20.8 |
| 2025 | 16.1 | 12.4 | 21.0 | 28.9 | 21.6 |
| 2030 | 16.7 | 11.9 | 20.9 | 28.1 | 22.4 |
| 2035 | 17.4 | 11.3 | 20.8 | 27.2 | 23.3 |
| 2040 | 17.6 | 11.0 | 20.8 | 26.4 | 24.2 |
| 2045 | 17.7 | 11.0 | 20.8 | 25.5 | 25.0 |
| 2050 | 17.7 | 11.0 | 20.7 | 24.7 | 25.9 |
© 2019 by the authors. Licensee MDPI, Basel, Switzerland. This article is an open access article distributed under the terms and conditions of the Creative Commons Attribution (CC BY) license (http://creativecommons.org/licenses/by/4.0/).
Share and Cite
Feng, Y.; Yang, Q.; Tong, X.; Wang, J.; Chen, S.; Lei, Z.; Gao, C. Long-Term Regional Environmental Risk Assessment and Future Scenario Projection at Ningbo, China Coupling the Impact of Sea Level Rise. Sustainability 2019, 11, 1560. https://doi.org/10.3390/su11061560
Feng Y, Yang Q, Tong X, Wang J, Chen S, Lei Z, Gao C. Long-Term Regional Environmental Risk Assessment and Future Scenario Projection at Ningbo, China Coupling the Impact of Sea Level Rise. Sustainability. 2019; 11(6):1560. https://doi.org/10.3390/su11061560
Chicago/Turabian StyleFeng, Yongjiu, Qianqian Yang, Xiaohua Tong, Jiafeng Wang, Shurui Chen, Zhenkun Lei, and Chen Gao. 2019. "Long-Term Regional Environmental Risk Assessment and Future Scenario Projection at Ningbo, China Coupling the Impact of Sea Level Rise" Sustainability 11, no. 6: 1560. https://doi.org/10.3390/su11061560
APA StyleFeng, Y., Yang, Q., Tong, X., Wang, J., Chen, S., Lei, Z., & Gao, C. (2019). Long-Term Regional Environmental Risk Assessment and Future Scenario Projection at Ningbo, China Coupling the Impact of Sea Level Rise. Sustainability, 11(6), 1560. https://doi.org/10.3390/su11061560