Abstract
Understanding what controls wetland vegetation community composition is vital to conservation and biodiversity management. This study investigates the factors that affect wetland plant communities and distribution in the Tumen River Basin, Northeast China, an internationally important wetland for biodiversity conservation. We recorded floristic composition of herbaceous plants, soil properties, and microclimatic variables in 177, 1 × 1 m2 quadrats at 45 sites, located upstream (26), midstream (12), and downstream (7) of the Basin. We used TWINSPAN to define vegetation communities and canonical correspondence analysis (CCA) to examine the relationships between environmental and biological factors within the wetland plant communities. We recorded 100 plant species from 93 genera and 40 families in the upstream, 100 plant species from 57 genera and 31 families in the midstream, and 85 plant species from 76 genera and 38 families in the downstream. Higher species richness was recorded upstream of the River Basin. The plant communities and distribution were influenced by elevation, soil properties (total potassium, pH, and available phosphorus), and microclimate variables (surface temperature, precipitation, average temperature, sunshine hours, and relative humidity). More than any other factor, according to our results, elevation strongly influenced the structure of wetland plant communities. These findings support prevailing models describing the distribution of wetland plants along environmental gradients. The determination of the relationship between soil and plants is a useful way to better understand the ecosystem condition and can help manage the wetland ecosystem.
1. Introduction
Freshwater wetlands are one of the most productive ecosystems and are indispensable for the countless benefits or “ecosystem services” they provide, such as biodiversity support, food and building materials, flood abatement, freshwater supply, and carbon sequestration [1,2,3]. Plant communities play key roles in maintaining wetland functions, and understanding the ecology of these communities is an important component of wetland conservation. Thus, information on the factors that govern community assembly rule and distribution is required [4]. Such information can particularly benefit restoration programs, particularly in regard to choosing suitable species/communities to initiate re-vegetation [5] as well as site improvement in degraded wetlands [6,7].
Many factors typically influence plant wetland communities. Among these, elevation, disturbance, and soil properties are prominent in the literature [8,9,10]. Still, the existing studies yield mixed results, from which no generalization emerges. One body of literature found a greater influence of soil properties such as soil moisture, salt content [11], soil organic matter [12], nitrate-N [13], and soil microbial communities [14]. Another body of research revealed that, more than soil properties, geographical attributes are more influential. For example, [8] and [15] highlighted the contribution of elevation and spatial factors, respectively, in governing plant community assembly in wetlands. Other studies found a stronger influence of hydrology [16,17], although this relation may not be clear since hydrology may also influence soil properties which itself is impacted upon by geographic location. Overall, the literature suggests that (i) changes in environmental variables can have important effects on species composition and establishment, though stochastic processes may also be operating [18,19], and (ii) the driving factors affecting wetland plant communities could be site specific and depend on the actual plant community [20].
China has lost 23% of freshwater marshes, 16.1% of lakes, 15.3% of rivers, and 51.2% of coastal wetlands as well as the services associated with these ecosystems [21]. The wetland area in the Tumen River Basin of China, characterized by its abundant biodiversity, has not been exempt from anthropogenic disturbance. The total area of wetlands here has markedly dropped off due to reclamation (e.g., construction of golf course), resulting in soil desertification and fertility loss [22]. Climate change has further accelerated wetland desiccation in the area [23]. This factor has led to significant changes in precipitation and temperature, which determine plant distribution patterns. Accordingly, as a previous study has shown, the annual average rainfall decreased by 127.4 mm and the annual average temperature increased by 2.27 °C over the past 50 years in the Tumen River area [22].
Previous studies on wetland ecology in the area have focused on wetland ecosystem health assessment, the effects of land use changes on ecosystem services, and land use dynamics [22,24], as well as the effects of wetland vegetation on soil microbial composition [14]. However, the community assembly rule and distribution of wetland plants in the Tumen River Basin still remains poorly understood. This information could be particularly important in designing wetland restoration and species conservation programs. Here, we investigate the plant communities in wetlands at upstream, midstream, and downstream locations within the Tumen River basin. Our study was motivated by two questions: what factors structure wetland plant communities in the Tumen River Basin? Are plant communities structured by similar factors at different levels of the basin?
2. Materials and Methods
2.1. Study Area
The study site (Tumen River Basin) is situated on the northeastern part of Jilin Province, China (41°59′47″–44°30′42″ N, 127°27′43″–131°18′33″ E), sharing boundaries with D. P. R. Korea and Russia (Figure 1). It is characterized by a typical temperate monsoon climate, with a mean annual precipitation of 400–650 mm. The average annual temperature is 2–6 °C, and maximum and minimum temperatures are 38 °C and −34 to −23 °C, respectively. The upstream area of the River Basin, encompasses the south of An’tu County and Helong City, and the Chinese side of Changbai Mountain. The first tributary, the Hongqi River, flows through the area. The midstream area is located in Wangqing County, south of Dunhua City, Yanji City, Longjing City, Tumen City and north of Helong City. The rivers Ga’ya, Bu’er hatong, Hailan, Yanji, and Chaoyang flow through the area. The downstream area contains Hunchun City [22]. This area is of great importance for conservation, as it is a transient habitat for endangered migratory birds. Dominant plants are herbaceous species such as Acorus calamus, Equisetum arvense, and Deyeuxia angustifolia etc.
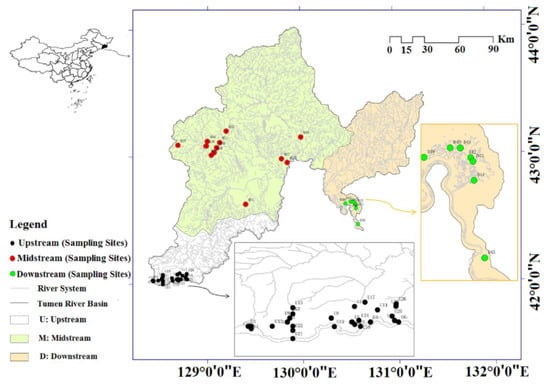
Figure 1.
Geographical positon of the study area.
2.2. Data Collection
All data samples were conducted during August of 2011, the month when plant growth is most productive in Jinlin Province [25]. Sample vegetation quadrats of 1 m2 were established at 26 sites upstream (five 1 m2 quadrats at each of 8 sites and three at each site of 18 sites), 12 sites midstream (five and three 1 m2 quadrats at six sites), and 7 sites downstream (five 1 m2 quadrats at each site) of the Tumen River Basin [26]. A total of 177 quadrats were sampled across 45 sites. All quadrats were established within 10 m from streams and other water bodies.
At each site, five quadrats were positioned in open ground and three quadrats in a narrow strip 25 m apart [27,28] to sample herbaceous plants. In each habitat, the relative foliage cover on each quadrat by visual(in percentage), number of individuals, and density and frequency of each plant species were quantitatively estimated using random quadrat methods [29]. A professional botanist helped identify the plants in the field.
Three soil columns (0–15 cm depth) were taken from each quadrat, and combined to form one aggregated sample. The compounded soil samples were divided into two subsamples, one sample to be assessed for soil water content (SWC) and sealed in a polyvinyl bag; another for soil properties (soil organic matter (SOM), total nitrogen (TN), available nitrogen (AN), total phosphorus (TP), available phosphorus (AP), total potassium (TK), available potassium (AK), and soil pH (pH)) and sieved through a 2-mm mesh sieve and root fragments removed. All samples were transported to the Soil Laboratory of Yanbian University and stored at 5 °C.
Elevation (ELV) and climatic data were recorded at each site in the sampled area. Meteorological data were collected from the Jilin Province Meteorological Agency, China during the 2011 field season. The climatic information of each sampling area was based on the data of the meteorological stations in the administrative district where the sampling sites are located. These data included land surface temperature (ST), precipitation (PRE), average temperature (AT), sunshine hours (SH), and relative humidity (RH). Finally, all of the data were treated as environmental variables in this analysis.
2.3. Vegetation Data Analysis
The importance value index (IVi) of vegetation in each sample plot was calculated as follows:
where DRi, FRi, CRi are the relative density, the relative frequency, and the relative cover rate of species i, respectively [30]. Additionally, the Sørenson’s similarity index (SSI) was calculated by the following formula:
where Ui and Uj are the number of species in sample units i and j, respectively, and Ui&j is the number of species common to sample units i and j [31].
The species diversity indices applied in this study are Patrich’s R, Shannon-Wiener’s H, a complement of Simpon’s index D, and Pielou’s evenness index E [32]. The formulae for the calculation methods of these indices are shown in Table 1. Four indices were selected for the estimation of species diversity, because they have low or moderate sensitivity to sample size and have been widely used in the literature [33].

Table 1.
Formulae for the measurement of species diversity.
2.4. Soil Properties Analyses
Soil properties were analyzed through conventional approaches [34,35]. SWC (g of water per 100 g dry soil) was analyzed by oven-drying for 48 h at 105 °C. SOM (g/kg dry soil) was measured by the heated potassium dichromate and concentrated H2SO4 oxidation method. pH was measured on a 1:2.5 (w/v) soil-water mixture by a pH meter. AN (mg/kg dry soil) was analyzed with alkaline hydrolysis and diffusion. TN (g/kg dry soil) was calculated using the semi-trace Kjeldahl method. AP (mg/kg dry soil) was analyzed by NaHCO3 and the silica-molybdenum blue colorimetry method. AK (mg/kg dry soil) was measured with NH4OAc extraction and flame photometric spectrophotometry. TP was analyzed with a spectrophotometer after wet digestion with H2SO4-HClO4 (GB7852-87). TK was measured by the HF- HClO4 melt flamer method.
2.5. Floristic Analysis
Floristic data were analyzed by a series of multivariate techniques. TWINSPAN analysis is a numerical method for the classification of vegetation belonging to similar groups, allowing the determination of homogenous groups [36]. This process was undertaken initially to define vegetation groups (communities), followed by canonical correspondence analysis (CCA) (conducted with CANOCO Windows 4.5 [37]), to illustrate the correlations between environmental variables and defined plant communities.
A data matrix of environmental factors (arranged in a 14 variable x 177 quadrat data matrix) and vegetation communities (arranged in a 284 species x 177 quadrat data matrix) was established. The WinTWINS (Version. 2.3, Centre for Ecology and Hydrology & University of South Bohemia, Huntingdon Ceske Budejovice, Czech Republic) computer program [38] was used to classify and ordinate the vegetation data in the gradient of environmental factors.
The significance of the resulting ordination was evaluated by a Monte Carlo test (1000 permutations). Prior to the analysis, all variables were assessed for normality, and cooperating interval transformation analysis was performed [39]. All ordinations, including CCA and principal component analysis (PCA), were performed using CANOCO version 4.5 [37].
All statistical analyses were conducted in Microsoft Excel 2010 and SPSS 19.0. Differences among groups (upstream, midstream, and downstream) in diversity indices were assessed by one-way analysis of variance (ANOVA). The least significant difference (LSD) test was used to contrast the means at p < 0.05. Pearson’s product moment correlation coefficient was used to express the significance of a linear relationship between multiple parameters [40].
3. Results
3.1. Species Composition and Diversity Indices
The 177 sample quadrats yielded a total of 284 taxa of plants, from 148 genera and 62 families. One hundred taxa were found in the upstream area, from 93 genera and 40 families, and 100 taxa were in the midstream area from 57 genera and 31 families. Eighty-five taxa in the downstream area belonged to 76 genera and 38 families.
Sørenson’s similarity index (SSI) was calculated to compare similarity among three different areas within family and genera level. Additionally, the results indicated that the similarity of family and genera is decreasing generally from upstream to downstream (Table 2).
Table 2.
Sørenson’s similarity index (SSI) of family and genera of the Tumen River Basin.
Figure 2 demonstrates the change of wetland plant diversity from upstream to downstream, as depicted by the four diversity indices. Species richness displayed a fluctuating rising tendency from top to bottom, and species rose from less to more. The dominance and diversity index illustrated a minor fluctuating rising tendency, and the evenness index did not change markedly.
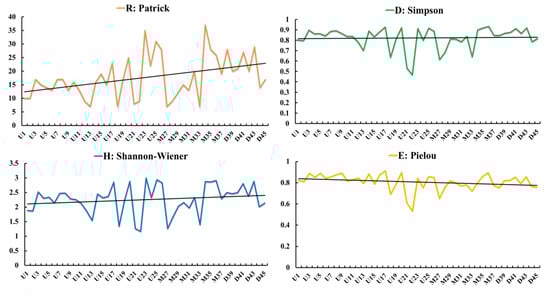
Figure 2.
Plots of differing indices of plant diversity in the upstream (U), midstream (M) and downstream (D) portions of the Tumen River Basin.
3.2. TWINSPAN
The TWINSPAN results analyzing 177 quadrats are presented in Table A1, Table A2 and Table A3 of Appendix A.
Vegetation in the study area was classified into eight main groups in upstream, five main groups in midstream and three main groups in downstream. Each group differs from the others in its environmental needs. All groups are shown in Table 3.
Table 3.
Wetland plant species groups obtained by TWINSPAN.
3.3. Canonical Correspondence Analysis
In this study, we found a gradient length greater than 4 standard deviations (SD), indicating the appropriateness of CCA. In CCA, arrows represent environmental factors, with arrow length proportional to the strength of the effect of each factor. The direction of the vector indicates a negative or positive correlation between the factor and the axes, and the angle between two vectors reflects the degree of correlation between variables.
The results of the CCA ordination of plant and environmental data from 45 sites are shown in Table 4 and Figure 3. The eigenvalue of the strong first axis was 0.897, while that of the second axis was 0.807. As shown in Table 4, the first axis (eigenvalue = 0.897) accounted for 8.0% of the variation of species data, and the 99.3% coefficient of correlation of the environment-species is by far the most important.
Table 4.
Results of CCA analysis for vegetation factors in the study area.
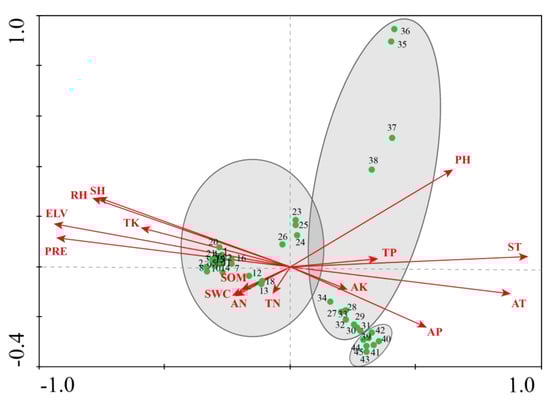
Figure 3.
Canonical correspondence analysis (CCA) results—ordination of all communities in relation to environmental factors within the Tumen River Basin.
The first CCA axis was negatively correlated with ELV, TK, PRE, SH and RH (p < 0.001), but positively correlated with soil pH, AP, ST and AT (p < 0.01) (Table 5).
Table 5.
Correlation between environmental variables and CCA ordination axes.
Table 6 shows the relationships of each environmental variable through Pearson coefficients. Among the 14 environmental factors, ELV played an indispensable role in many environmental factors: there was a negative correlation with pH, ST, and AT, and a strong positive correlation with TK, PRE, SH, and RH. Additionally, TN displayed a strongly positive correlation with SOM, AN, and SWC. TP had a strong positive correlation with AP, but a strong negative correlation with TK. Meanwhile, SOM was positively correlated with AN and SWC. The AN was positively corrected with SWC. AP showed a positive correlation with ST, whereas there was a clear negative correlation with PRE. Furthermore, meteorological factors had a significantly positive and negative correlation with each other.
Table 6.
Pearson correlation coefficients between the environmental variables (PCA).
From left to right along the first CCA axis in the ordination diagram (Figure 3), the ELV decreased gradually, the content of TK, PRE, SH, and RH decreased by degrees whereas the soil pH, AP, ST, and AT slowly increased. From bottom to top along the second axis, the soil pH increased only sparingly, while other environmental factors show no obvious trends. This indicates that environmental factors (specifically ELV, TK, PRE, SH, RH, pH, AP, ST, AT) strongly influence the plant species community within the study area. In addition, the results of the Monte Carlo test showed that, among all potentially influential factors, ELV (p = −0.9335, p < 0.001) indirectly affects the diversity and structure of plant communities along with other major factors.
The 45 sites are plotted along axes 1 and 2 (Figure 3). Three plant community groups could be identified according to the pattern of aggregation along the environmental axes.
Group 1, containing Carex loliacea, Carex heterolepis, Rhododendron lapponicum, Deyeuxia angustifolia, Carex subpediformis, Equisetum arvense, and Saussurea sclerolepis, was found in the upstream area of the Tumen River Basin. The ELV, TK, PRE, SH, and RH are relatively high in the upstream area, and pH, AP, ST, AT are relatively low. The distribution of the plant community in the area upstream of the Tumen River Basin is mainly affected by ELV and meteorological factors. Changes with differences in temperature and precipitation have a great influence on the distribution of the wetland plant community. These two factors affect the sub-surface water level, and the composition of wetland plant species changes and results in plant community succession. In addition, the distribution of wetland plants was influenced by TK, pH, SOM, TN, and AN. In particular, these factors (SOM, TN, and AN) indicated essential positive correlations with wetland plant community distribution. The wetland plant community high in SOM, TN and AN defined significant differences on the CCA ordination graph (Figure A1).
Group 2, containing Carex pseudo-curaica, Carex arnellii, Cyperus nipponicus, Deyeuxia angustifolia, Equisetum arvense, and Polygonum hydropiper, was found in the midstream area of the basin, where the pH, AP, ST, and AT are relatively high, and ELV, TK, PRE, SH, and RH are relatively low. The pH is the most effective for describing the distribution of vegetation in the midstream area of the Tumen River Basin (Figure A2).
Group 3, containing Aeginetia indica, Acorus calamus, and Carex magnoutriculata, was found in the downstream area of the basin, where ELV, TK, PRE, SH, and RH are low, and the pH, AP, ST, and AT are relatively high. Compared with the upstream and midstream areas, the wetland plant communities in the downstream area are concentrated on the right of the CCA ordination graph, and highlight relatively small differences in the environment (Figure A3).
4. Discussion
We investigated the relationships between wetland plant communities and environmental factors in the Tumen River Basin upstream, midstream, and downstream. Communities were strongly structured by the environment, suggesting that stochastic processes may have little influence in delineating communities in this system. Around 60% of the variance explained the relation between the environment and species distribution, and we speculate that the remainder might be in part explained by biotic factors such as competition and facilitation [41]. Plant communities at different levels of the basin were determined by different environmental factors. Upstream communities were mostly affected by elevation, precipitation, and total potassium, whereas midstream and downstream communities appear to be mostly structured by soil properties such as available potassium and available phosphorus. This suggests that the plant communities are limited by different soil properties and this was reflected in the index of similarity of plant communities between the three areas.
Corroborating the results of previous studies [8,9,10], elevation and soil fertility played important roles in structuring the wetland plant community within our study area. Community distribution was most strongly correlated with nine major environmental factors (elevation, total potassium, soil pH, available phosphorous, surface temperature, precipitation, average temperature, sunshine hours and relative humidity). Among these, elevation is one of the most important factors because it can affect soil chemistry, surface temperature, precipitation, sunshine hours, relative humidity, average temperature, water depth during flood events, and soil moisture, all of which indirectly affect the diversity and structure of plant communities in wetlands [42]. Soil characteristics could be particularly strong predictors of species diversity and composition in harsh environmental conditions, poorly developed soils [27], and in heterogeneous environments where the spatial distribution of plant species depends on a specific niche [43]. For example, the diversity and distribution of plant species are associated with soil available nitrogen and phosphorus [44], soil moisture and nutrients [45,46], as well as soil chemistry (soil pH, calcium, and organic carbon) [47,48]. An earlier study revealed a strong linkage between plant communities and soil microbial communities in the Tumen River Basin [14], and although not investigated here it is possible that soil microbial composition varies with altitude. After all, the variation in altitude from upstream to downstream within the basin is 1029 m.
Some sampling sites with relatively lower diversity at upstream and midstream sections of the basin could be explained by recent anthropogenic disturbances (e.g., construction of golf courses in the midstream and some industrial factories in the upstream). Conversely, some sites in the downstream were relatively species-rich because of the protection afforded by a conservation area (e.g., site D45 is near wetland reserve of Lotus Lake). These could explain why there are differences in community composition. We developed a scheme for wetland plant community conservation according to different types of results in three different areas in the basin.
Finally, it must also be noted that some complex scientific issues were not addressed in our paper. For example, plant degradation of wetlands in response to environmental drivers was outside the scope of our work, as was the role of landscape factors in determining community variation. There is, therefore, a pressing need for ongoing investigation to gain further ecological knowledge of the Tumen River Basin.
5. Conclusions
Our results confirmed that plant community and distribution in the Tumen River Basin were impacted by elevation, soil properties (total potassium, pH, and available phosphorus), and microclimate variables. Knowledge of the influence of soil properties on the plant communities can be utilized in restoration programs where the choice of suitable species/communities is required in revegetation. This study increases our understanding of the distribution patterns of wetland plants and the dominating environmental aspects in the basin, and could provide a theoretical basis for the design of sustainable protection and reclamation of wetland ecological environments [23].
Author Contributions
X.Z. and F.J. collected and processed the data, performed analysis, and wrote the paper. N.R. wrote the introduction. W.Z and C.H. conceived and designed the study. All authors reviewed and edited the draft, approved the submitted manuscript, and agreed to be listed and accepted the version for publication.
Funding
The work was supported by the National Natural Science Foundation of China [Grant Nos. 4183000048 and 41771109], Jilin provincial science and Technology Department Project [Grant No. 20180101002JC] and the Open Fund of the State Environmental Protection Key Laboratory of Wetland Ecology and Vegetation Restoration, Northeast Normal University [Grant No. 130028630].
Acknowledgments
The authors are thankful to G.L. Cao and W.L. Xu for field assistance. We would like to thank Y. Natuhara at Graduate School of Environmental Studies, Nagoya University for his support. We also thank Z.M. Wang of the Institute of Applied Ecology, Chinese Academy of Science for his valuable comments on the manuscript.
Conflicts of Interest
The authors declare no conflict of interest.
Appendix A

Figure A1.
CCA results—ordination of upstream communities in relation to environmental factors within the Tumen River Basin.

Figure A2.
CCA results –ordination of midstream communities in relation to environmental factors within the Tumen River Basin.

Figure A3.
CCA results—ordination of downstream communities in relation to environmental factors within the Tumen River Basin.
Table A1.
TWINSPAN of the vegetation cover in 94 quadrats and 100 species in upstream.
Table A1.
TWINSPAN of the vegetation cover in 94 quadrats and 100 species in upstream.
| Species | Sampling Sites (U) | LSD |
|---|---|---|
| 01110000110000111122212222 | ||
| 12387389012456467501293456 | ||
| 11 | 11--1--------------------- | 000000 |
| 13 | -111---------------------- | 000000 |
| 30 | --1----------------------- | 000000 |
| 37 | 1------------------------- | 000000 |
| 44 | -11----------------------- | 000000 |
| 54 | -1------------------------ | 000000 |
| 100 | -1111-1------------------- | 000000 |
| 135 | -11-----1------------1---- | 000001 |
| 71 | ---1----------1------1---- | 00001 |
| 2 | ---------------------1---- | 000100 |
| 5 | ----------------11---1---- | 000100 |
| 15 | ------------------111----- | 000100 |
| 19 | ------------------1-1----- | 000100 |
| 21 | --------------------1----- | 000100 |
| 25 | ------------------1------- | 000100 |
| 27 | ------------------11------ | 000100 |
| 36 | ------------------1------- | 000100 |
| 59 | ----------------11111----- | 000100 |
| 69 | ---------------11111-1---- | 000100 |
| 85 | ------------------1--1---- | 000100 |
| 96 | --------------1--11-1----- | 000100 |
| 107 | ---------------1-1-11----- | 000100 |
| 134 | ---------------1111--1---- | 000100 |
| 146 | ------------------1--1---- | 000100 |
| 67 | --------------1--1-------- | 000101 |
| 121 | --------------11111--1---- | 000101 |
| 98 | ---------1-11-111111-1---- | 00011 |
| 102 | ----1-1-------1111-------- | 00011 |
| 50 | -111-111--11-1------------ | 001000 |
| 142 | --1--1---1---------------- | 001000 |
| 144 | 1---1-----11-1------------ | 001000 |
| 53 | -------111--1111111------- | 001001 |
| 62 | ----1111111-1111111111---- | 001001 |
| 88 | -----11111111111111--1---- | 001001 |
| 145 | -----1--1-1111-11-1--1---- | 001001 |
| 4 | -----1-------------------- | 001010 |
| 16 | ----1111111111--111------- | 001010 |
| 17 | -----1-------------------- | 001010 |
| 18 | -----11-1--1-------------- | 001010 |
| 29 | ----1--------------------- | 001010 |
| 38 | ----1111111111111--------- | 001010 |
| 39 | ----1--------------------- | 001010 |
| 51 | -----1-------------------- | 001010 |
| 52 | ----1-11---11------------- | 001010 |
| 65 | ----111111-11-1----------- | 001010 |
| 101 | ------1-11---------------- | 001010 |
| 123 | -----1111-1111---1-------- | 001010 |
| 124 | ------------11------------ | 001010 |
| 132 | ----11111111111----------- | 001010 |
| 12 | ----------------1--------- | 001011 |
| 42 | ----------------1--------- | 001011 |
| 7 | ----1-11---1----1--------1 | 00110 |
| 133 | ----11-----11-1111-------1 | 00110 |
| 139 | 1---111111----1------1---1 | 00110 |
| 45 | --------------111-----1--- | 00111 |
| 129 | 11--111111111111111---111- | 00111 |
| 28 | ------------------1--11--- | 01 |
| 35 | ---------------1111-1-111- | 01 |
| 112 | -------------------11--1-- | 01 |
| 140 | ----1-----------------11-- | 100 |
| 117 | ------------------1---11-1 | 10100 |
| 1 | ----------------------11-- | 10101 |
| 3 | -------------------------1 | 10101 |
| 6 | ------------------------11 | 10101 |
| 8 | ------------------------1- | 10101 |
| 10 | ----------------------11-- | 10101 |
| 14 | ----------------------1--- | 10101 |
| 20 | -------------------------1 | 10101 |
| 22 | ----------------------1--- | 10101 |
| 23 | ----------------------1--- | 10101 |
| 24 | -------------------------1 | 10101 |
| 26 | ------------------------1- | 10101 |
| 31 | ----------------------11-- | 10101 |
| 32 | ----------------------1--- | 10101 |
| 33 | ----------------------1--- | 10101 |
| 34 | -------------------------1 | 10101 |
| 40 | ----------------------1--- | 10101 |
| 41 | ----------------------11-- | 10101 |
| 43 | ----------------------1--- | 10101 |
| 46 | -------------------------1 | 10101 |
| 47 | ------------------------1- | 10101 |
| 48 | ------------------------1- | 10101 |
| 49 | ----------------------111- | 10101 |
| 56 | ----------------------1-1- | 10101 |
| 84 | ----------------------1111 | 10101 |
| 87 | -----------------------1-1 | 10101 |
| 90 | ------------------------11 | 10101 |
| 92 | ----------------------1-1- | 10101 |
| 114 | ----------------------1111 | 10101 |
| 118 | -----------------------111 | 10101 |
| 119 | ----------------------11-- | 10101 |
| 120 | ------------------------11 | 10101 |
| 122 | ----------------------11-- | 10101 |
| 131 | ----------------------11-- | 10101 |
| 136 | ----------------------11-- | 10101 |
| 137 | ----------------------1111 | 10101 |
| 138 | ------------------------11 | 10101 |
| 141 | ------------------------11 | 10101 |
| 86 | ---1------------------1111 | 1011 |
| 9 | -1-1-------------------1-- | 11 |
| 00000000000000000000001111 | ||
| 0000111111111111111111 | ||
| 000000000000011111 | ||
| 000000000011100001 | ||
| 0111111111 | ||
| 0000001111 |
Table A2.
TWINSPAN of the vegetation cover in 48 quadrats and 100 species in midstream.
Table A2.
TWINSPAN of the vegetation cover in 48 quadrats and 100 species in midstream.
| Species | Sampling Sites (M) | LSD |
|---|---|---|
| 223233333333 | ||
| 783901245678 | ||
| 4 | -------1---- | 00000 |
| 9 | -------1---- | 00000 |
| 10 | -------1---- | 00000 |
| 12 | -------1---- | 00000 |
| 24 | -------1---- | 00000 |
| 37 | -------1---- | 00000 |
| 47 | -------1---- | 00000 |
| 51 | -------1---- | 00000 |
| 52 | -------1---- | 00000 |
| 53 | -------1---- | 00000 |
| 67 | -------1---- | 00000 |
| 72 | -------1---- | 00000 |
| 73 | -------1---- | 00000 |
| 74 | -------1---- | 00000 |
| 76 | -------1---- | 00000 |
| 77 | -------1---- | 00000 |
| 106 | -1-----1---- | 00001 |
| 25 | ------11---- | 0001 |
| 90 | ------11---- | 0001 |
| 114 | ------11---- | 0001 |
| 41 | ----1111---- | 00100 |
| 49 | ----1111---- | 00100 |
| 83 | ---111-1---- | 00100 |
| 97 | ----1111---- | 00100 |
| 13 | ---1111----- | 001010 |
| 21 | ----1-1----- | 001010 |
| 28 | ---1-1------ | 001010 |
| 32 | ------1----- | 001010 |
| 54 | -----11----- | 001010 |
| 99 | ----111----- | 001010 |
| 14 | --1---1----- | 001011 |
| 36 | --1--------- | 001011 |
| 19 | -1---------- | 001100 |
| 27 | 1-1111-----1 | 001100 |
| 30 | 1111-------- | 001100 |
| 43 | -1---------- | 001100 |
| 44 | 1----------- | 001100 |
| 57 | 111-111----- | 001100 |
| 63 | -1---------- | 001100 |
| 66 | 11-1111----- | 001100 |
| 69 | 1--1-------- | 001100 |
| 113 | 1-11111----- | 001100 |
| 31 | -1-1--11---- | 001101 |
| 103 | -1-1--11---- | 001101 |
| 50 | ---1111---11 | 00111 |
| 112 | ----1-1----1 | 00111 |
| 11 | -------11--- | 01 |
| 45 | -1-1----1-1- | 01 |
| 93 | ----1-111-11 | 01 |
| 110 | --1----1---1 | 01 |
| 107 | -------1--11 | 10 |
| 1 | ---------1-- | 11 |
| 2 | --------1--- | 11 |
| 3 | -----------1 | 11 |
| 5 | --------11-- | 11 |
| 6 | --------1--- | 11 |
| 7 | -----------1 | 11 |
| 8 | --------1--- | 11 |
| 15 | ----------1- | 11 |
| 16 | --------1--- | 11 |
| 17 | ---------11- | 11 |
| 18 | -----------1 | 11 |
| 20 | --------1111 | 11 |
| 22 | ---------1-- | 11 |
| 23 | ----------1- | 11 |
| 26 | ---------1-- | 11 |
| 29 | ----------1- | 11 |
| 33 | ---------1-- | 11 |
| 34 | ---------1-- | 11 |
| 35 | -----------1 | 11 |
| 38 | ---------1-1 | 11 |
| 39 | ---------1-- | 11 |
| 40 | ----------1- | 11 |
| 42 | ----------1- | 11 |
| 46 | --------11-1 | 11 |
| 48 | ----------11 | 11 |
| 55 | ----------11 | 11 |
| 56 | -----------1 | 11 |
| 58 | ---------1-- | 11 |
| 59 | --------1--- | 11 |
| 60 | --------1--- | 11 |
| 61 | ---------1-- | 11 |
| 62 | --------1--- | 11 |
| 64 | ---------1-- | 11 |
| 65 | ---------1-- | 11 |
| 68 | ---------1-- | 11 |
| 70 | ----------1- | 11 |
| 71 | --------1--- | 11 |
| 75 | --------11-1 | 11 |
| 78 | --------1--- | 11 |
| 82 | --------1-11 | 11 |
| 85 | ----------11 | 11 |
| 88 | --------11-- | 11 |
| 89 | --------11-1 | 11 |
| 91 | --------1--1 | 11 |
| 92 | --------11-1 | 11 |
| 105 | --------11-1 | 11 |
| 109 | --------11-1 | 11 |
| 111 | --------1111 | 11 |
| 115 | --------11-1 | 11 |
| 000000001111 | ||
| 00000001 | ||
| 0011111 | ||
| 01111 |
Table A3.
TWINSPAN of the vegetation cover in 35 quadrats and 85 species in downstream.
Table A3.
TWINSPAN of the vegetation cover in 35 quadrats and 85 species in downstream.
| Species | Sampling Sites (D) | LSD |
|---|---|---|
| 4344444 | ||
| 0912345 | ||
| 1 | 1------ | 00000 |
| 14 | 1------ | 00000 |
| 25 | 1------ | 00000 |
| 29 | 1------ | 00000 |
| 40 | 1------ | 00000 |
| 44 | 1------ | 00000 |
| 54 | 1------ | 00000 |
| 57 | 1------ | 00000 |
| 60 | 1------ | 00000 |
| 80 | 1------ | 00000 |
| 2 | 11----- | 00001 |
| 5 | 1---1-- | 00001 |
| 7 | 1-1---- | 00001 |
| 28 | 1-111-- | 0001 |
| 67 | 111---- | 0001 |
| 75 | 1-11--- | 0001 |
| 84 | 11-11-- | 0001 |
| 32 | 11111-- | 0010 |
| 3 | --1---- | 0011 |
| 9 | ---11-- | 0011 |
| 10 | ----1-- | 0011 |
| 11 | --1---- | 0011 |
| 16 | --1---- | 0011 |
| 19 | ----1-- | 0011 |
| 20 | --1-1-- | 0011 |
| 22 | --1-1-- | 0011 |
| 24 | -1--1-- | 0011 |
| 27 | ----1-- | 0011 |
| 31 | ---1--- | 0011 |
| 33 | -1111-- | 0011 |
| 37 | --1---- | 0011 |
| 41 | --1---- | 0011 |
| 45 | --1---- | 0011 |
| 46 | ----1-- | 0011 |
| 47 | ---1--- | 0011 |
| 51 | -1--1-- | 0011 |
| 53 | ----1-- | 0011 |
| 56 | -1--1-- | 0011 |
| 58 | ----1-- | 0011 |
| 59 | -1----- | 0011 |
| 61 | ----1-- | 0011 |
| 64 | ---1--- | 0011 |
| 65 | --1---- | 0011 |
| 68 | ----1-- | 0011 |
| 69 | -1----- | 0011 |
| 70 | ----1-- | 0011 |
| 71 | ---1--- | 0011 |
| 72 | -111--- | 0011 |
| 73 | -1--1-- | 0011 |
| 74 | --1---- | 0011 |
| 78 | -1-11-- | 0011 |
| 81 | --1-1-- | 0011 |
| 82 | ---1--- | 0011 |
| 83 | --1---- | 0011 |
| 85 | ----1-- | 0011 |
| 23 | 11111-1 | 01 |
| 35 | 1-1111- | 01 |
| 38 | -111--1 | 01 |
| 79 | 111--1- | 01 |
| 4 | --11-1- | 10 |
| 17 | -1-1--1 | 10 |
| 26 | ---11-1 | 10 |
| 30 | -11---1 | 10 |
| 76 | --1-1-1 | 10 |
| 43 | 1-1--1- | 110 |
| 6 | -1---1- | 1110 |
| 21 | -1---1- | 1110 |
| 62 | ---1-1- | 1110 |
| 8 | ------1 | 1111 |
| 12 | -----1- | 1111 |
| 13 | ----111 | 1111 |
| 15 | ------1 | 1111 |
| 18 | -----1- | 1111 |
| 34 | ------1 | 1111 |
| 36 | -----1- | 1111 |
| 39 | ------1 | 1111 |
| 42 | -----1- | 1111 |
| 48 | ------1 | 1111 |
| 49 | ------1 | 1111 |
| 50 | ------1 | 1111 |
| 52 | -----1- | 1111 |
| 55 | ------1 | 1111 |
| 63 | -----1- | 1111 |
| 66 | -----11 | 1111 |
| 77 | ------1 | 1111 |
| 0000011 | ||
| 01111 |
References
- Revenga, C.; Brunner, J.; Henninger, N.; Kassem, K.; Payne, R. Freshwater Ecosyst; World Resources Institute: Washington, DC, USA, 2000. [Google Scholar]
- Lambert, A. Economic Valuation of Wetlands: An Important Component of Wetland Management Strategies at the River Basin Scale. Available online: http://archive.ramsar.org/cda/en/ramsar-news-archives-2003-economic-valuation-of/main/ramsar/1-26-45-86%5E16205_4000_0__ (accessed on 9 February 2019).
- Momblanch, A.; Connor, J.D.; Crossman, N.D.; Paredes-Arquiola, J.; Andreu, J. Using ecosystem services to represent the environment in hydro-economic models. J. Hydrol. 2016, 538, 293–303. [Google Scholar] [CrossRef]
- Cornwell, W.K.; Ackerly, D.D. Community assembly and shifts in plant trait distributions across an environmental gradient in coastal California. Ecol. Monogr. 2009, 79, 109–126. [Google Scholar] [CrossRef]
- Kirwan, M.L.; Megonigal, J.P. Tidal wetland stability in the face of human impacts and sea-level rise. Nature 2013, 504, 53. [Google Scholar] [CrossRef] [PubMed]
- Boldt-Burisch, K.; Naeth, M.A.; Schneider, B.U.; Hüttl, R.F. Linkage between root systems of three pioneer plant species and soil nitrogen during early reclamation of a mine site in Lusatia, Germany. Restor. Ecol. 2015, 23, 357–365. [Google Scholar] [CrossRef]
- Srivastava, N.K.; Ram, L.C.; Masto, R.E. Reclamation of overburden and lowland in coal mining area with fly ash and selective plantation: A sustainable ecological approach. Ecol. Eng. 2014, 71, 479–489. [Google Scholar] [CrossRef]
- Welch, B.A.; Davis, C.B.; Gates, R.J. Dominant environmental factors in wetland plant communities invaded by Phragmites australis in East Harbor, Ohio, USA. Wetl. Ecol. Manag. 2006, 14, 511–525. [Google Scholar] [CrossRef]
- Isacch, J.P.; Costa, C.S.B.; Rodríguez-Gallego, L.; Conde, D.; Escapa, M.; Gagliardini, D.A.; Iribarne, O.O. Distribution of saltmarsh plant communities associated with environmental factors along a latitudinal gradient on the south-west Atlantic coast. J. Biogeogr. 2006, 3, 888–900. [Google Scholar] [CrossRef]
- Gaudet, C.L.; Keddy, P.A. Competitive performance and species distribution in shortline plant communities: A comparative approach. Ecology 1995, 76, 280–291. [Google Scholar] [CrossRef]
- Rath, K.M.; Rousk, J. Salt effects on the soil microbial decomposer community and their role in organic carbon cycling: A review. Soil Biol. Biochem. 2015, 81, 108–123. [Google Scholar] [CrossRef]
- Bahrami, B.; Ghorbani, A.; Jafari, M.; Rezanezhad, F.; Esmali, A. Investigation of Relation Vegetation and Some Soil Physico-Chemical Characteristics in Three Rangeland Habitats. Open J. Ecol 2017, 7, 336. [Google Scholar] [CrossRef]
- Green, E.K.; Galatowitsch, S.M. Effects of Phalaris arundinacea and nitrate-N addition on the establishment of wetland plant communities. J. Appl. Ecol. 2002, 39, 134–144. [Google Scholar] [CrossRef]
- Qin, L.; Jiang, M.; Tian, W.; Zhang, J.; Zhu, W. Effects of wetland vegetation on soil microbial composition: A case study in Tumen River Basin, Northeast China. Chin. Geogr. Sci 2017, 27, 239–247. [Google Scholar] [CrossRef]
- Zhou, D.; Luan, Z.; Guo, X.; Lou, Y. Spatial distribution patterns of wetland plants in relation to environmental gradient in the Honghe National Nature Reserve, Northeast China. J. Geogr. Sci. 2012, 22, 57–70. [Google Scholar] [CrossRef]
- Tan, Z.; Zhang, Q.; Li, M.; Li, Y.; Xu, X.; Jiang, J. A study of the relationship between wetland vegetation communities and water regimes using a combined remote sensing and hydraulic modeling approach. Hydrol. Res. 2016, 47, 278–292. [Google Scholar]
- Timoney, K. Factors influencing wetland plant communities during a flood-drawdown cycle in the Peace-Athabasca Delta, northern Alberta, Canada. Wetlands 2008, 28, 450–463. [Google Scholar] [CrossRef]
- Legendre, P.; Mi, X.; Ren, H.; Ma, K.; Yu, M.; Sun, I.; He, F. Partitioning beta diversity in a subtropical broad-leaved forest of China. Ecology 2009, 90, 663–674. [Google Scholar] [CrossRef]
- Weiher, E.; Keddy, P.A. The assembly of experimental wetland plant communities. Oikos 1995, 73, 323–335. [Google Scholar] [CrossRef]
- Yang, Z.; Liu, X.; Zhou, M.; Ai, D.; Wang, G.; Wang, Y.; Chu, C.; Lundholm, J.T. The effect of environmental heterogeneity on species richness depends on community position along the environmental gradient. Sci. Rep. 2015, 5, 15723. [Google Scholar] [CrossRef]
- Gong, P.; Niu, Z.; Cheng, X.; Zhao, K.; Zhou, D.; Guo, J.; Liang, L.; Wang, X.; Li, D.; Huang, H. China’s wetland change (1990–2000) determined by remote sensing. Sci. Chin. Earth Sci. 2010, 53, 1036–1042. [Google Scholar] [CrossRef]
- Zheng, X.J.; Sun, P.; Zhu, W.H.; Xu, Z.; Fu, J.; Man, W.D.; Li, H.L.; Zhang, J.; Qin, L. Landscape dynamics and driving forces of wetlands in the Tumen River Basin of China over the past 50 years. Landsc. Ecol. Eng. 2017, 13, 237–250. [Google Scholar] [CrossRef]
- Li, F.; Gao, H.; Zhu, L.; Xie, Y.; Yang, G.; Hu, C.; Chen, X.; Deng, Z. Foliar nitrogen and phosphorus stoichiometry of three wetland plants distributed along an elevation gradient in Dongting Lake, China. Sci. Rep. 2017, 7, 2820. [Google Scholar] [CrossRef] [PubMed]
- Li, B.; Liu, Z.; Nan, Y.; Li, S.; Yang, Y. Comparative Analysis of Urban Heat Island Intensities in Chinese, Russian, and DPRK Regions across the Transnational Urban Agglomeration of the Tumen River in Northeast Asia. Sustainability 2018, 10, 2637. [Google Scholar] [CrossRef]
- Dong, Z.; Wang, Z.; Liu, D.; Song, K.; Li, L.; Jia, M.; Ding, Z. Mapping wetland areas using Landsat-derived NDVI and LSWI: A case study of West Songnen Plain, Northeast China. J. Indian Soc. Remote Sens. 2014, 42, 569–576. [Google Scholar] [CrossRef]
- Li, W.; Ouyang, Z.; Meng, X.; Wang, X. Plant species composition in relation to green cover configuration and function of urban parks in Beijing, China. Ecol. Res. 2006, 21, 221–237. [Google Scholar] [CrossRef]
- Jafari, M.; Chahouki, M.Z.; Tavili, A.; Azarnivand, H.; Amiri, G.Z. Effective environmental factors in the distribution of vegetation types in Poshtkouh rangelands of Yazd Province (Iran). J. Arid Environ. 2004, 56, 627–641. [Google Scholar] [CrossRef]
- Wang, J.; Wang, H.; Cao, Y.; Bai, Z.; Qin, Q. Effects of soil and topographic factors on vegetation restoration in opencast coal mine dumps located in a loess area. Sci. Rep. 2016, 6, 22058. [Google Scholar] [CrossRef] [PubMed]
- Sakata, Y.; Craig, T.P.; Itami, J.K.; Yamasaki, M.; Ohgushi, T. Parallel environmental factors drive variation in insect density and plant resistance in the native and invaded ranges. Ecology 2017, 98, 2873–2884. [Google Scholar] [CrossRef] [PubMed]
- Zemunik, G.; Turner, B.L.; Lambers, H.; Laliberté, E. Increasing plant species diversity and extreme species turnover accompany declining soil fertility along a long-term chronosequence in a biodiversity hotspot. J. Ecol. 2016, 104, 792–805. [Google Scholar] [CrossRef]
- Zarin, D.J.; Guo, H.; Enu-Kwesi, L. Methods for the assessment of plant species diversity in complex agricultural landscapes: Guidelines for data collection and analysis from the PLEC Biodiversity Advisory Group (PLEC-BAG). PLEC News Views 1999, 13, 3–16. [Google Scholar]
- Hsieh, T.; Ma, K.; Chao, A. iNEXT: An R package for rarefaction and extrapolation of species diversity (Hill numbers). Methods Ecol. Evol. 2016, 7, 1451–1456. [Google Scholar] [CrossRef]
- García, R.R.; Miñarro, M. Role of floral resources in the conservation of pollinator communities in cider-apple orchards. Agric. Ecosyst. Environ. 2014, 183, 118–126. [Google Scholar] [CrossRef]
- Liu, G.S.; Jiang, N.H.; Zhang, L.D. Analysis of Soil Physical and Chemical Properties and Description of Soil Profiles; China Standard Press: Beijing, China, 1996; p. 85. (In Chinese) [Google Scholar]
- Feng, R.Z.; Long, R.J.; Shang, Z.H.; Ma, Y.S.; Dong, S.K.; Wang, Y.L. Establishment of Elymus natans improves soil quality of a heavily degraded alpine meadow in Qinghai-Tibetan Plateau, China. Plant Soil 2010, 327, 403–411. [Google Scholar] [CrossRef]
- Murillo-Pacheco, J.I.; Rös, M.; Escobar, F.; Castro-Lima, F.; Verdú, J.R.; López-Iborra, G.M. Effect of wetland management: Are lentic wetlands refuges of plant-species diversity in the Andean–Orinoco Piedmont of Colombia? PeerJ 2016, 4, e2267. [Google Scholar] [CrossRef]
- Ter Braak, C.J.; Smilauer, P. CANOCO Reference Manual and CanoDraw for Windows User’s Guide: Software for Canonical Community Ordination (Version 4.5). Ithaca: Microcomputer Power. 2002. Available online: www.canoco.com (accessed on 18 June 2011).
- Hill, M.; Šmilauer, P. TWINSPAN for Windows Version 2.3; Centre for Ecology and Hydrology & University of South Bohemia: Huntingdon and Ceske Budejovice, Czech Repubic, 2005. [Google Scholar]
- Ren, L.; He, L.; Lu, H.; Chen, Y. Monte Carlo-based interval transformation analysis for multi-criteria decision analysis of groundwater management strategies under uncertain naphthalene concentrations and health risks. J. Hydrol. 2016, 539, 468–477. [Google Scholar] [CrossRef]
- Li, X.G.; Li, F.M.; Zed, R.; Zhan, Z.Y. Soil physical properties and their relations to organic carbon pools as affected by land use in an alpine pastureland. Geoderma 2007, 139, 98–105. [Google Scholar] [CrossRef]
- Callaway, R.M.; Walker, L.R. Competition and facilitation: A synthetic approach to interactions in plant communities. Ecology 1997, 78, 1958–1965. [Google Scholar] [CrossRef]
- Hejda, M.; Hanzelka, J.; Kadlec, T.; Štrobl, M.; Pyšek, P.; Reif, J. Impacts of an invasive tree across trophic levels: Species richness, community composition and resident species’ traits. Divers. Distrib. 2017, 23, 997–1007. [Google Scholar] [CrossRef]
- Valladares, F.; Bastias, C.C.; Godoy, O.; Granda, E.; Escudero, A. Species coexistence in a changing world. Front. Plant Sci. 2015, 6. [Google Scholar] [CrossRef]
- Wardle, D.A.; Gundale, M.J.; Jäderlund, A.; Nilsson, M.-C. Decoupled long-term effects of nutrient enrichment on aboveground and belowground properties in subalpine tundra. Ecology 2013, 94, 904–919. [Google Scholar] [CrossRef]
- Cavagnaro, T.R. Soil moisture legacy effects: Impacts on soil nutrients, plants and mycorrhizal responsiveness. Soil Biol. Biochem. 2016, 95, 173–179. [Google Scholar] [CrossRef]
- Zhang, X.; Zhang, J.; Li, L.; Zhang, Y.; Yang, G. Monitoring citrus soil moisture and nutrients using an iot based system. Sensors 2017, 17, 447. [Google Scholar] [CrossRef] [PubMed]
- Urbanová, M.; Šnajdr, J.; Baldrian, P. Composition of fungal and bacterial communities in forest litter and soil is largely determined by dominant trees. Soil Biol. Biochem. 2015, 84, 53–64. [Google Scholar] [CrossRef]
- Walker, K.J.; Preston, C.D.; Boon, C.R. Fifty years of change in an area of intensive agriculture: Plant trait responses to habitat modification and conservation, Bedfordshire, England. Biodivers. Conserv. 2009, 18, 3597. [Google Scholar] [CrossRef]
© 2019 by the authors. Licensee MDPI, Basel, Switzerland. This article is an open access article distributed under the terms and conditions of the Creative Commons Attribution (CC BY) license (http://creativecommons.org/licenses/by/4.0/).