Article

Remote Observation in Habitat Suitability Changes for Waterbirds in the West Songnen Plain, China

1
Key Laboratory of Wetland Ecology and Environment, Northeast Institute of Geography and Agroecology, Chinese Academy of Sciences, Changchun 130102, China
2
University of Chinese Academy of Sciences, Beijing 100049, China
3
Department of Earth Sciences, Indiana University-Purdue University, Indianapolis, IN 46202, USA
4
College of Mining Engineering, North China University of Science and Technology, Tangshan 063210, China
5
College of Computer and Information, Fujian Agriculture and Forestry University, Fuzhou 350002, China
*
Author to whom correspondence should be addressed.
Sustainability 2019, 11(6), 1552; https://doi.org/10.3390/su11061552
Submission received: 7 January 2019 / Revised: 2 March 2019 / Accepted: 5 March 2019 / Published: 14 March 2019

Abstract

:
Being one of the most important habitats for waterbirds, China’s West Songnen Plain has experienced substantial damage to its ecosystem, especially the loss and degradation of wetlands and grasslands due to anthropogenic disturbances and climate change. These occurrences have led to an obvious decrease in waterbird species and overall population size. Periodic and timely monitoring of changes in habitat suitability and understanding the potential driving factors for waterbirds are essential for maintaining regional ecological security. In this study, land cover changes from 2000 to 2015 in this eco-sensitive plain were examined using Landsat images and an object-based classification method. Four groups of environmental factors, including human disturbance, water situation, food availability, and shelter safety, characterized by remote sensing data were selected to develop a habitat suitability index (HSI) for assessing habitat suitability for waterbirds. HSI was further classified into four grades (optimum, good, general, and poor), and their spatiotemporal patterns were documented from 2000 to 2015. Our results revealed that cropland expansion and wetland shrinkage were the dominant land cover changes. Waterbird habitat areas in the optimum grade experienced a sharp decline by 7195 km2. The habitat area in good suitability experienced reduction at a change rate of −8.64%, from 38,672 km2 to 35,331 km2. In addition, waterbird habitats in the general and poor grades increased overall by 10.31%. More specifically, the total habitat areas with optimum suitable grade, in five national nature reserves over the study region, decreased by 12.21%, while habitat areas with poor suitable grade increased by 3.89%. Changes in habitat suitability could be largely attributed to the increase in human disturbance, including agricultural cultivation from wetlands and grasslands and the expansion of built-up lands. Our findings indicate that additional attention should be directed towards reducing human impact on habitat suitability for sustainable ecosystems.

Graphical Abstract

1. Introduction

Waterbirds represent sensitive indicators of ecosystem change and are symbolic ecological assets in wetlands [1]. A habitat provides an important place for waterbirds to rest, forage, nest, breed, and defend from natural enemies [2]. Intensive human activities and global climate change have deeply affected waterbirds’ biodiversity and their habitats, mainly by altering the ecosystem’s structure over the past decades [3,4,5]. Many species have experienced population decline—even extinction—and the number of waterbirds in the wild has drastically decreased owing to habitat degradation and fragmentation caused by these changes [6]. It has been reported that 85% of threatened bird species are in danger, globally [7]. Habitat suitability assessment is thus critical for habitat management and waterbirds protection [8]. Understanding waterbird habitat requirements, determining the factors that alter habitat suitability, and managing their remaining habitats, are becoming increasingly important.
A series of environmental variables, at varying scales, affect waterbird habitats [9]. One of the primary factors affecting habitat suitability is land cover change [10,11]. Recent studies have revealed that changes in natural ecosystems (wetland, woodland, and grassland) due to urbanization [12] and agricultural disturbance [13], can directly affect habitat suitability for waterbirds, in the context of breeding areas, food provisions, and resting regions [14]. The hydrological variability caused by climate change and building of dams for agriculture has greatly affected water supply to waterbird habitats [8]. Expansion of cropland and built-up land enhances human disturbance to waterbird habitats [7]. These changes raise a number of issues for waterbird habitats, indicating the lack of suitable habitats for waterbirds. Therefore, understanding land cover changes and their impact on waterbird habitats is beneficial for strategic planning in relation to ecosystem management for waterbirds conservation, in addition to the quick and effective assessment of habitat suitability.
Geographic information systems (GIS) and remote sensing (RS) have been widely used for waterbirds habitat studies [15,16,17]. With the favorable repeat cycle, Landsat time series data can provide both the latest images and historical datasets at different scales to monitor current field status and detect temporal changes in surface features [18,19]. Remote sensing data also exhibit great potential for monitoring waterbird habitats, because they can be measured directly as a proxy for factors influencing habitat suitability. For example, the normalized difference vegetation index (NDVI) as a proxy for ecosystem greenness [20], satellite-based slope data indicating shelter condition affecting habitat suitability [21], and density of settlements representing a direct impact of human disturbance on waterbird habitats [8], have been used extensively as predictors of waterbirds habitat characteristics. Hence, remote-sensing is favored for assessing change in waterbird habitats’ suitability. Furthermore, several habitat suitability models, including generalized linear models (GLM) [22,23], ecological niche factor analysis (ENFA) [24], and resource-based models [25], have been used as useful habitat assessment tools by conservation planners. Material collection for species distribution or habitat characteristics in these models is often expensive and time-consuming. Moreover, they rarely provide comprehensive spatial information of interest areas. Compared to these models, a habitat suitability index (HSI) model was attractive for assessing spatially heterogeneous habitat suitability for waterbirds because integrating remote sensing data with GIS techniques makes it more feasible, visible, and accurate [26,27].
Located in the central part of Northeast China, the West Songnen Plain (WSP), is an important part of the East Asian–Australasian Flyway for migratory waterbirds [28]. The significant amount of natural resources makes the region a breeding ground and habitat for a large number of red-crowned cranes, oriental white storks, gulls, wild ducks, and other waterbird species [29]. However, the study area is located in a temperate semi-arid continental monsoon climate zone and an agricultural-pastoral transitional belt. The natural ecosystem in this area is very sensitive to climate change and human activities [30], which significantly affects habitat suitability for waterbirds. Particularly after the year 2000, to address the demand for more economic income and food supply for the rapidly growing population, human disturbance in waterbird habitats, such as cropland reclamation, built-up land expansion, commercial activities, oil exploitation, etc., has been drastic [30,31]. Although previous studies have attempted to assess habitat suitability for waterbirds at different scales, changes in suitability and their driving forces in the whole region over a long period have not been investigated. In order to support sustainable ecosystem management and waterbirds conservation, we aimed to (1) examine land cover change, especially wetland loss and cropland expansion, in WSP between 2000 and 2015, (2) quantify changes in suitable waterbird habitats through developing a revised HSI, and (3) determine the factors driving changes in habitat suitability for waterbirds.

2. Materials and Methods
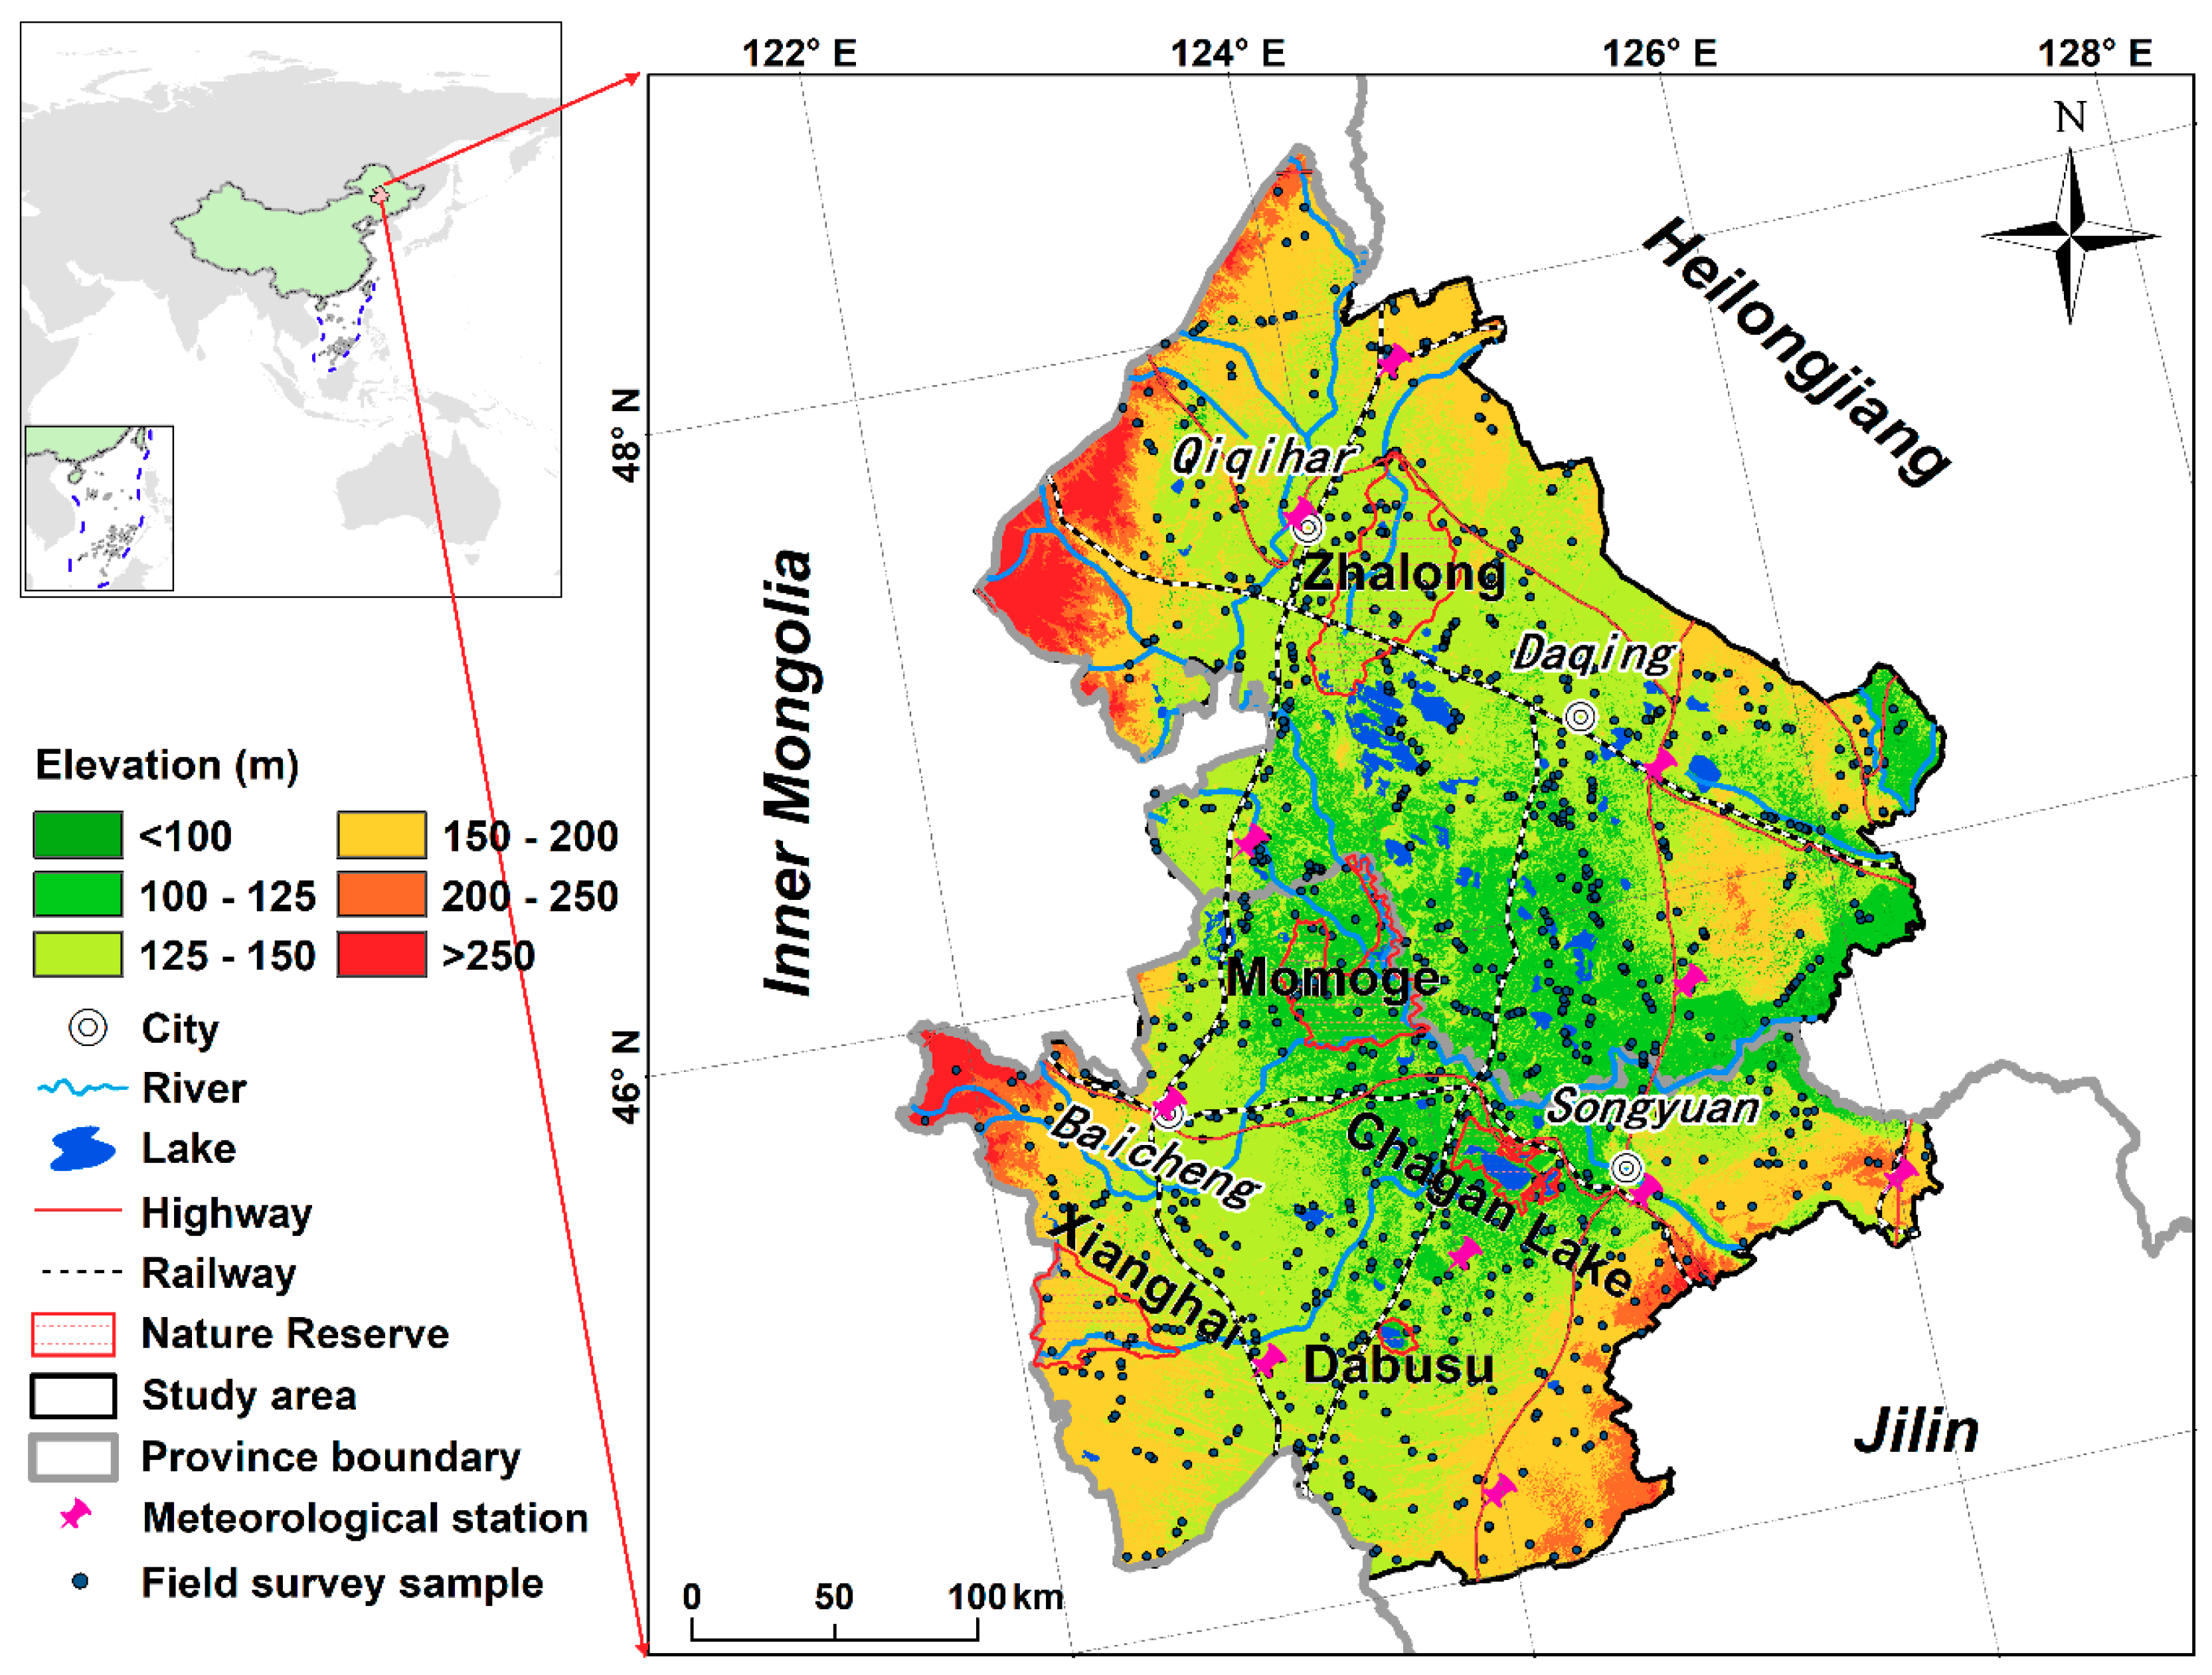
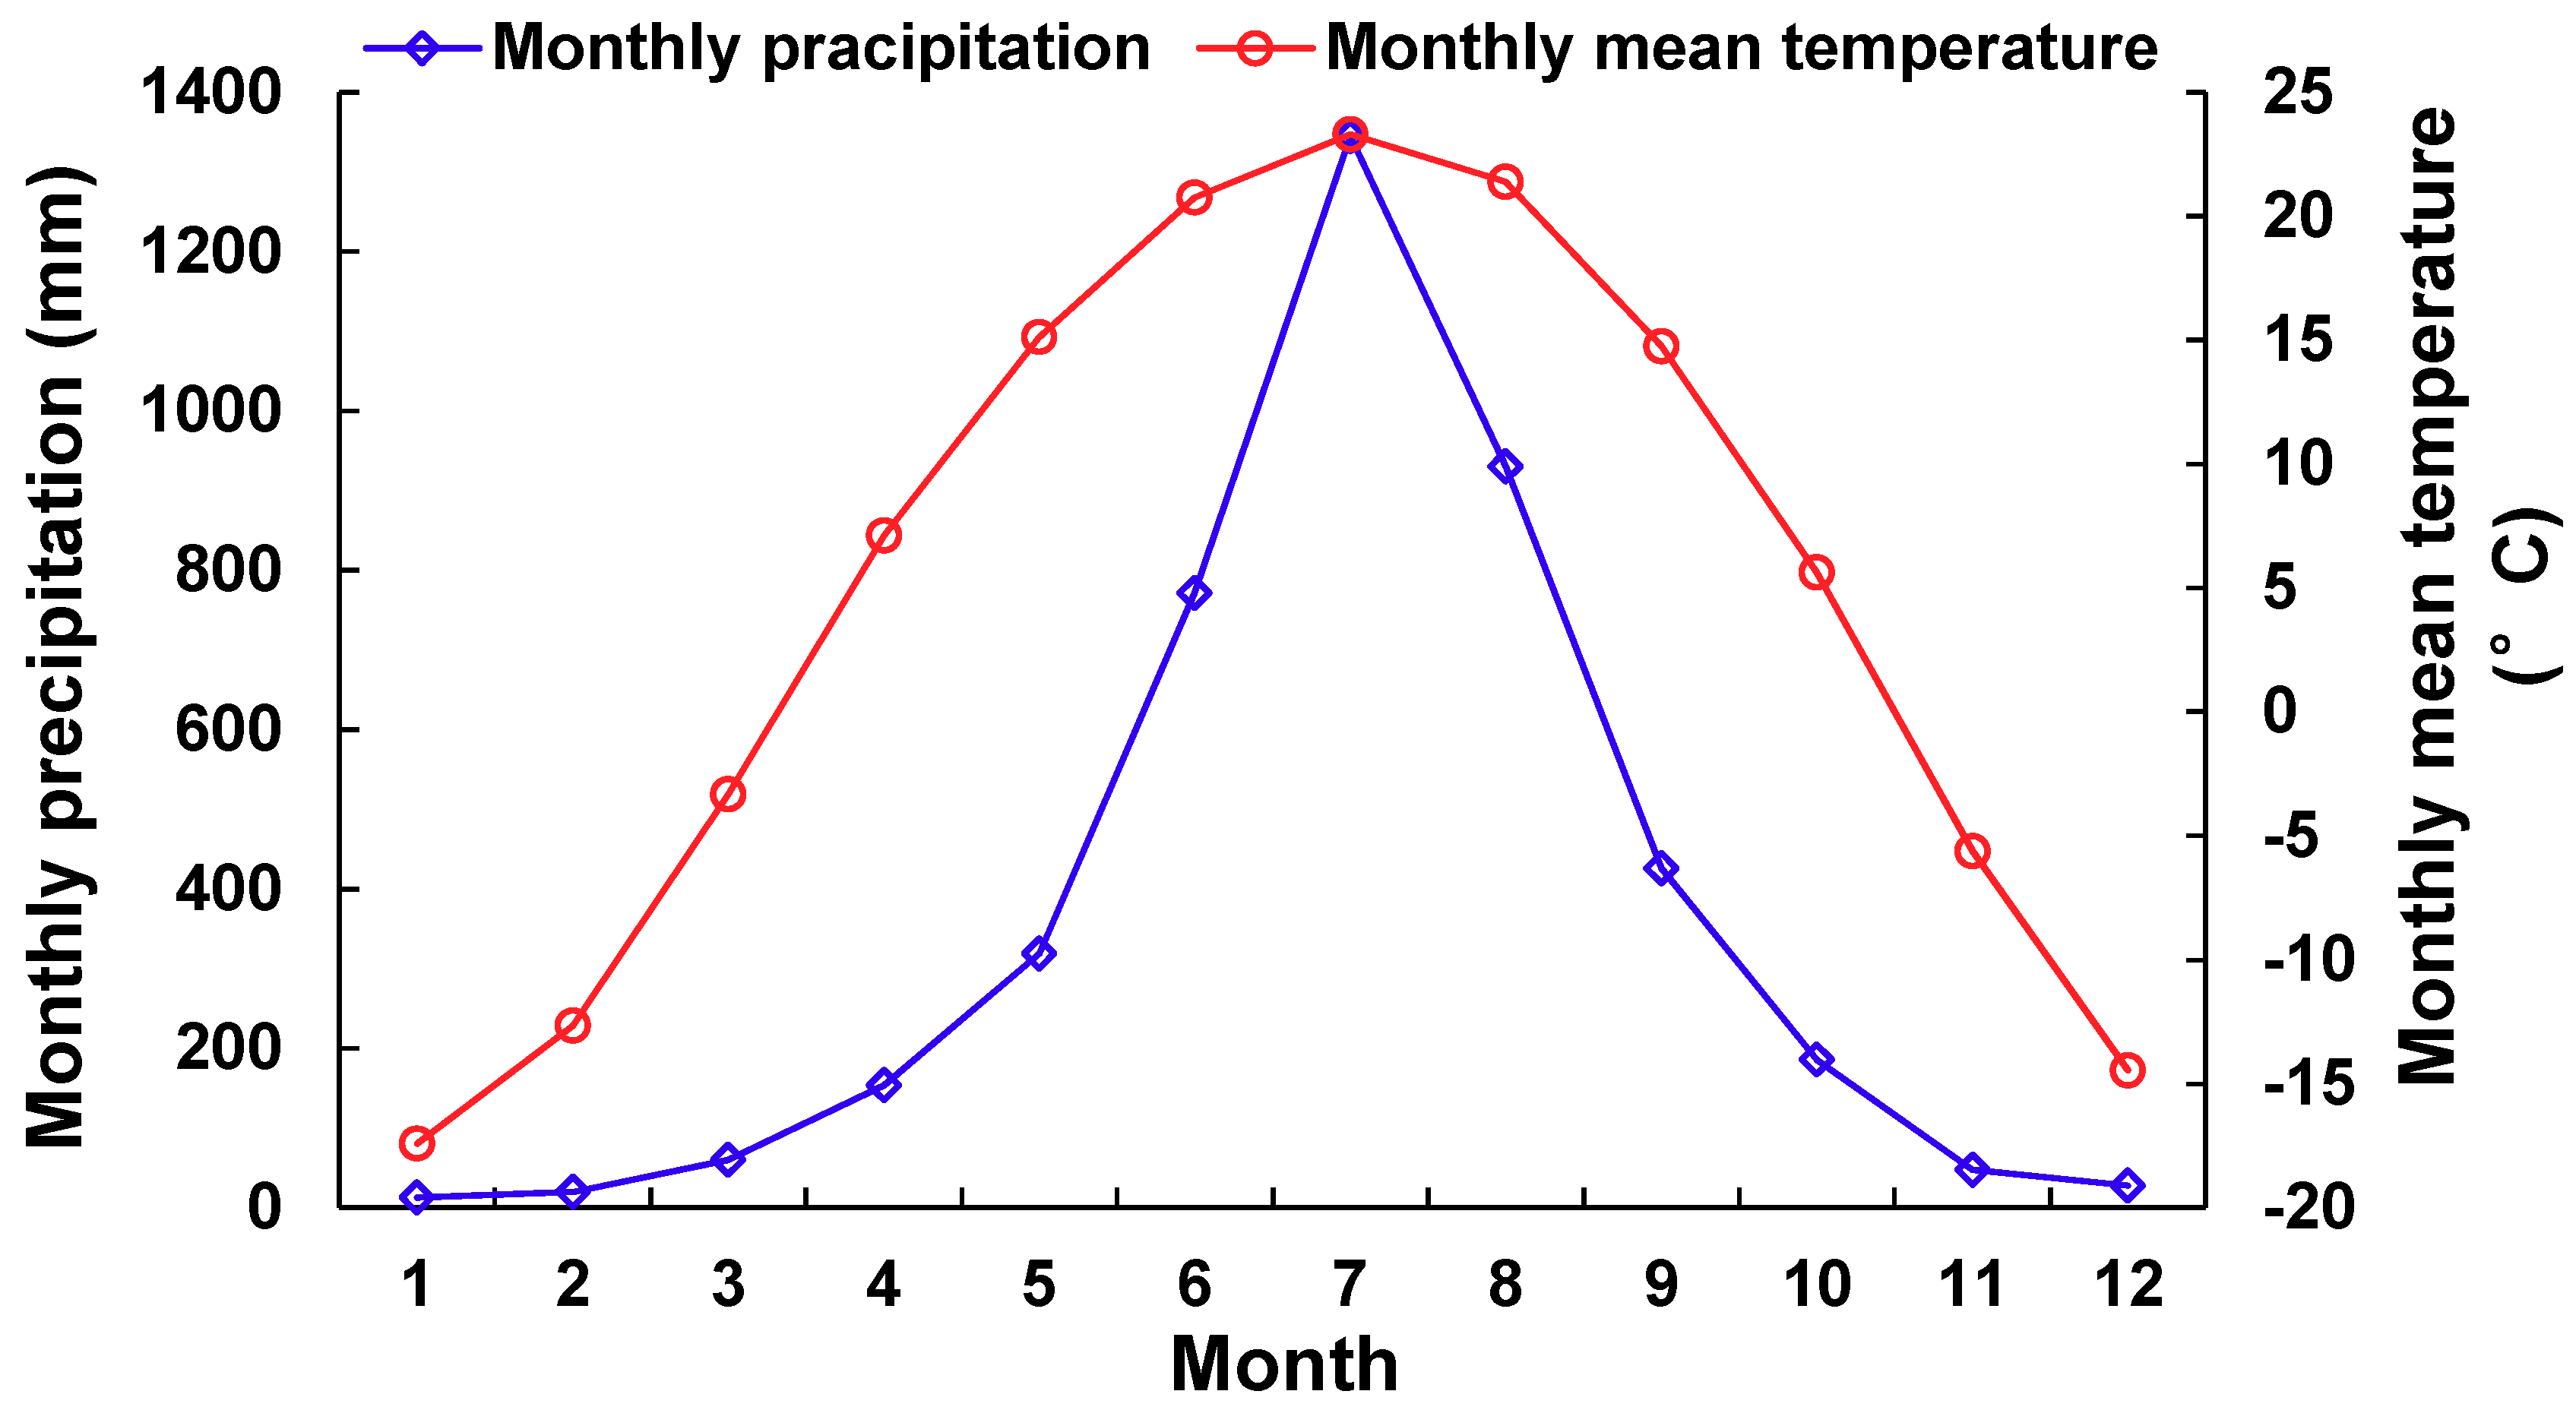
2.1. Study Area

The WSP (44°00′–48°35′ N, 121°36′–126°36′ E) is situated on a semi-arid, sub-humid, pastoral and agricultural transitional band in the central Northeast China. Twenty-two counties, with an area of 101 × 103 km2, were included in the study area west of Jilin and Heilongjiang (Figure 1). The WSP is a low plain below 250 m above sea level, where alluvial is mostly from the Nenjiang River, Songhua River, and their tributaries. Its slopes are predominantly less than 10°. It has a unique temperate monsoon climate consisting of a windy spring, hot and rainy summer, dry and warm autumn, and long, cold, and dry winter in this area, with a mean annual temperature of 2–6 °C, and annual evaporation of 1200–1900 mm. The high temperatures and rains make the vegetation grow vigorously from July to September, providing sufficient food and effective shelter for waterfowl, which is the main season for waterbirds to inhabit (Figure 2). Annual precipitation is less than annual evaporation. Moreover, monthly and annual variations in precipitation are evident. The average annual rainfall is 350–650 mm, of which, 80% is concentrated from May to September—decreasing from east to west. The main wetland type is marsh, which is distributed around rivers and lakes. Lush grasses and rich organic bases provide an indispensable food resource and hidden conditions for bird migration [31]. Five wetland national nature reserves (NNRs), i.e., Zhalong, Momoge, Chagan Lake, Xianghai, and Dabusu, which exist over the WSP are located in the East Asian-Australasian Flyway. Three of these NNRs are listed by the Ramsar Convention Bureau as wetlands of international significance for waterbirds conservation. Zhalong (NO. 549) and Xianghai NNRs (NO. 548) were listed in 1992, and Momoge NNR (NO. 2188) was listed in 2013. Almost 150 bird types exist in these reserves, which account for more than 50% of the total waterbird species number.

2.2. Data Sources and Pre-Processing

2.2.1. Remote Sensing Data

Landsat images in 2000 (thematic mapper data, TM) and 2015 (operational land imager data, OLI), with a 30 m spatial resolution, were acquired from the United States Geological Survey (USGS, http://glovis.usgs.gov/) to examine spatiotemporal patterns of land cover in the WSP. Eleven cloud-free images were acquired each year to cover the study region. Image acquisition occurred predominantly from July to September, when plants are actively growing, because it is easier to identify land cover types during this period. Landsat images were a composite of band blue, band green, band red, band nir (near infrared), band swir (shortwave infrared) 1 and 2, wherein the wavelength range of band swir 1 and 2 in the Landsat TM and OLI images were different. Before land cover classification, all images were calibrated to remove atmospheric and light factor effects from the objects’ reflectance using the Fast Line-of-sight Atmospheric Analysis of Spectral Hypercubes module (FLAASH, a module in ENVI 4.8 image processing software), which can enhance image brightness and facilitate extraction of the object’s information. All parameters entered into the FLAASH module were set according to the metafile of images. Then these images were geo-rectified to 1:100,000 topographic maps using ground control points (GCPs) to meet the high precision requirements in land cover classification. There were at least 30 evenly distributed GCPs in each scene. The root mean squared error of geometric rectification was controlled within 0.5 pixels.

2.2.2. Field Survey Data

To increase classification accuracy and evaluate the accuracy for each land cover type, a total of 137 and 1292 land cover sample types were collected in July 2014 and August 2015, respectively, using a GPS in field surveys (Figure 1). The datasets contained 140 woodland, 306 wetland, 216 grassland, 253 cropland, 201 water body, 173 built-up land, and 140 barren land samples. We randomly selected 1000 samples for training, which were used to extract feature information and object types for different land covers on satellite images. The remaining 429 samples were used to assess the accuracy of the 2015 classification results. Google Earth and various historical maps provided high-resolution images, which were used to collect 632 ground samples for classification accuracy assessment in 2000. Historic maps were first digitized using the ArcGIS software, before selecting the ground truth points. Images for classification, training and validation samples in 2000 were 443 and 189 points, respectively.
We validated the accuracy assessment of habitat suitability for waterbirds by collecting 28 red-crowned crane nests’ location data in the Zhalong NNR in 2014, and 199 nesting locations for oriental white storks (i.e., Ciconia boyciana)—one of the important waterbirds in the study region—were collected in the Momoge NNR in 2015. Handheld GPS and digital camera were used to determine nest locations.

2.2.3. Socioeconomic Data

Socioeconomic data from 2000 to 2015, including total population, gross domestic product (GDP), and secondary industry production, which were provided by the National Bureau of Statistics of China (NBSC, http://www.stats.gov.cn/), were collected from the Statistical Yearbooks of Jilin Province (NBSC, 2001–2016) and Heilongjiang Province, China (NBSC, 2001–2016), to investigate possible factors impacting changes in habitat suitability for waterbirds.

2.2.4. Meteorological Data

To explore possible impacts of climate change on habitat suitability for waterbirds, we collected meteorological data from all 11 stations throughout the WSP that were provided by the China Meteorological Data Sharing Service System (http://cdc.cma.gov.cn/index.jsp) during 2000–2015. These data were first processed by Kriging interpolation using ArcGIS, then the annual temperature and precipitation data were calculated.

2.2.5. Auxiliary Data

To increase classification accuracy, multi-season remote sensing images, vegetation maps, city maps, lake maps, and the National Road System Database were used as ancillary data during the classification. The Digital Elevation Model (DEM) data with a resolution of 30 m from USGS (http://glovis.usgs.gov) were used to assess shelter safety for waterbirds.

2.3. Classification Methods and Accuracy Assessment

In this study, we classified land cover types for habitat suitability assessment through an object-oriented classification method based on the eCognition Developer 8.64. Compared with the traditional pixel-based method, it has been widely applied to interpret medium-resolution Landsat data to provide higher classification accuracy [32,33,34]. First, we segmented remote sensing images to create interesting, smooth, and homogeneous objects, wherein the effects of salt and pepper were avoided [35,36]. This was performed according to the characteristics of hue, spectral value, texture, shape, and compactness. In the study region, the 20-scale parameter provided an appropriate match between objects and features, through testing and comparing five segmentation scales: 5, 10, 20, 30, and 50. In order to obtain as much spectral information as possible and control the objects’ segmentation shape, shape parameters and compactness were set to 0.1 and 0.8, respectively. According to a series of decision rules, the nearest neighbor classifier and manual editing tools were then used to classify the segmented image objects and correct false judgments, respectively. Under the necessity of study, image objects were classified into woodland, wetland, grassland, water body (i.e., hydrographic nets, including river, canal, lake, and pond), barren land, cropland, and built-up land (including settlement, road, and industrial land). Woodland, wetland, grassland, water body, and barren land were categorized into natural land cover types, while cropland and built-up land were anthropogenic land cover types. Classification results were then assessed through field survey data. We assessed the classification accuracy for each category by calculating producer accuracy, user accuracy, overall accuracy, and the Kappa coefficient using confusion matrices.

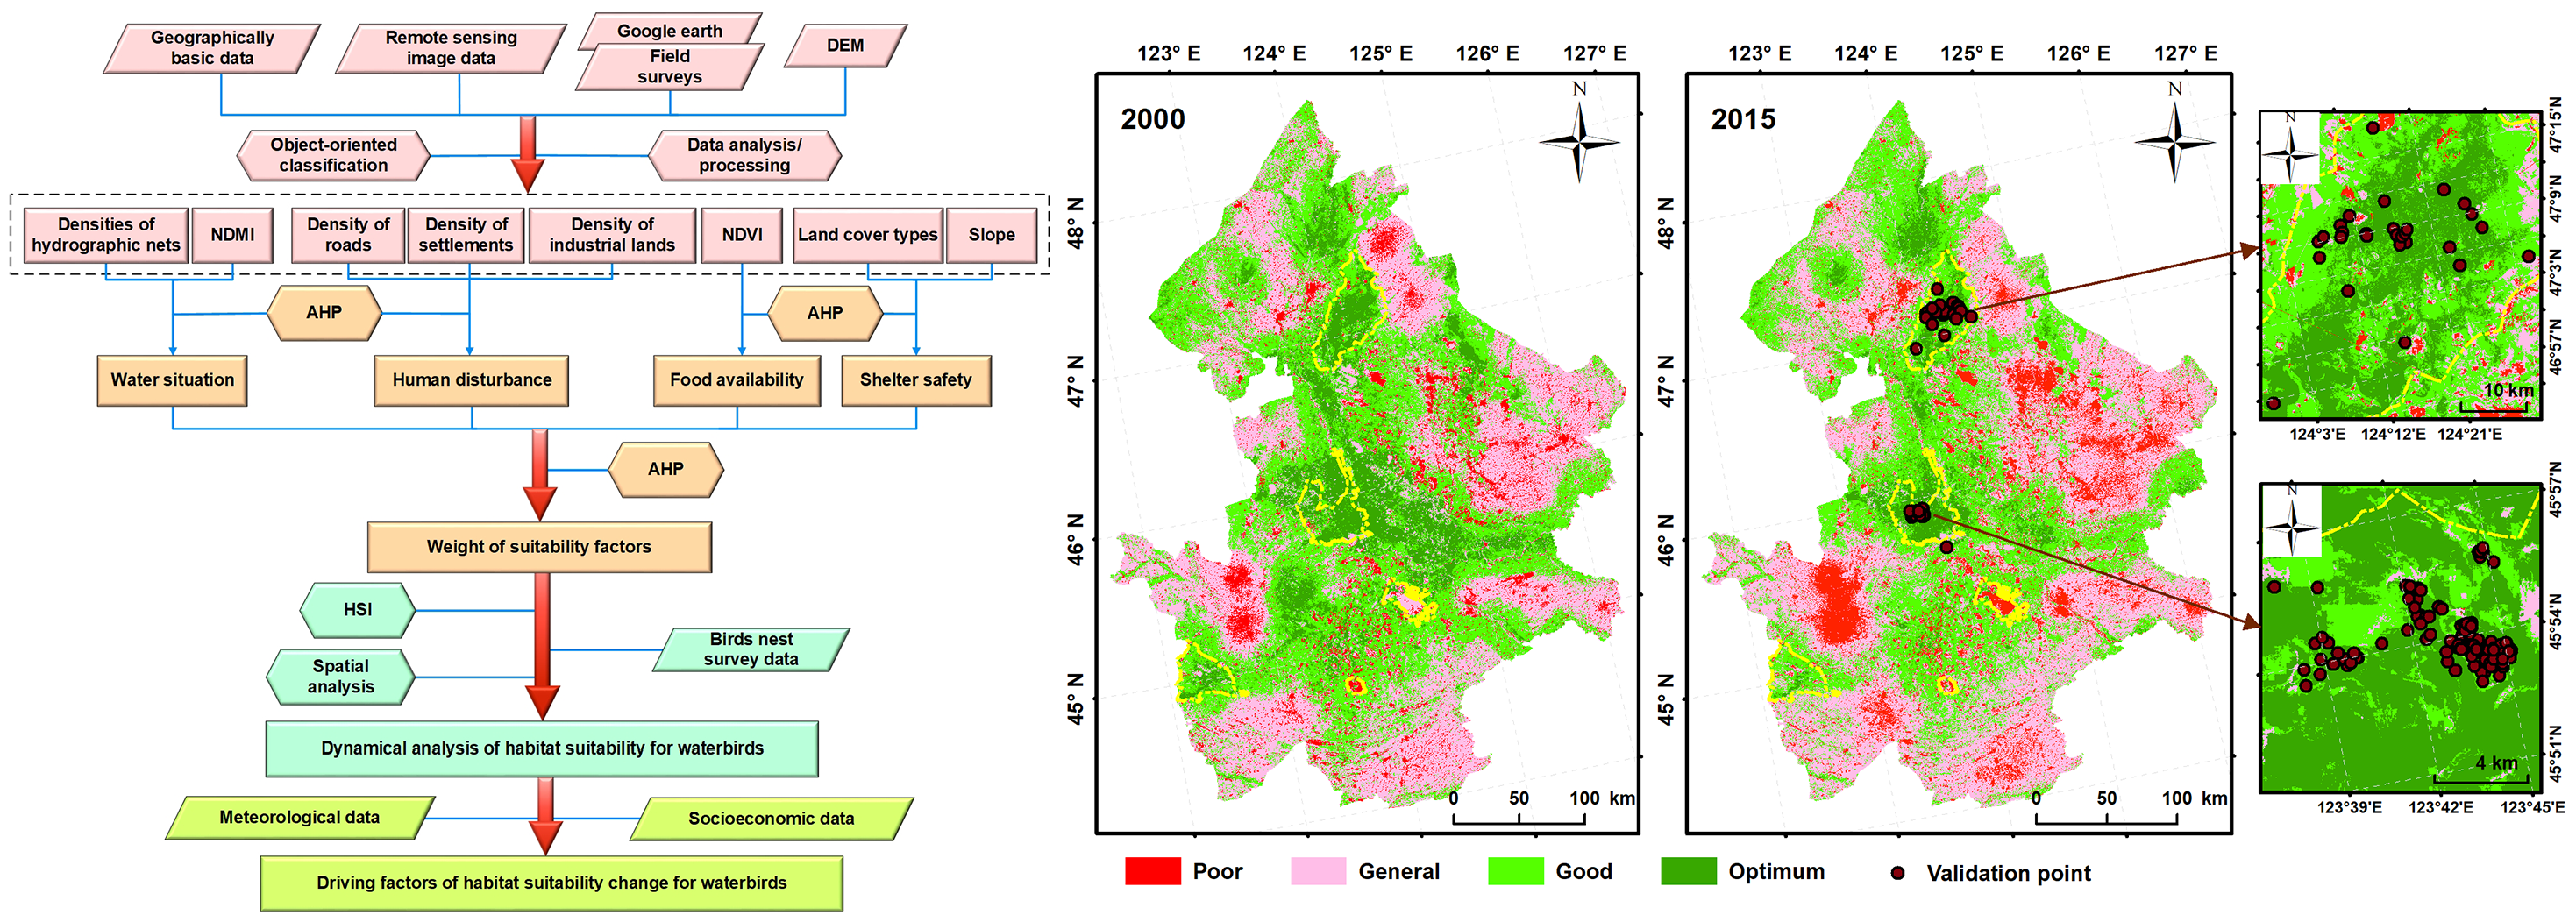
2.4. Methods to Quantify Habitat Suitability for Waterbirds

To quantify changes in habitat suitability for waterbirds in the study region, we extracted vector data on roads, settlements, industrial lands, ponds, lakes, rivers, and canals from land cover data. Choosing key suitability factors is vital to the analysis of habitat suitability for waterbirds. Considering essential environmental factors required for waterbirds to inhabit a certain area, four groups of the typical environmental factors directly affecting waterbirds living conditions were selected in accordance with previous studies [27,37,38], which included human disturbances (densities of various built-up lands), food availability (normalized differential vegetation index), water situation (normalized difference moisture index and the densities of hydrographic nets), and shelter safety (land cover types and slope).
Human activities greatly impact on habitat suitability. The distribution of roads, settlements, and industrial lands to some extent reflects the intensity of human activities. In order to assess the impact of human disturbances on habitat suitability for waterbirds, road, settlement, and industrial land density maps were calculated using the spatial analysis function of ArcGIS software, where high densities were equivalent to severe human disturbance.
Rivers, lakes, canals, and ponds provide water for waterbirds’ breeding and inhabiting. In order to assess how the water situation influences habitat suitability for waterbirds, vector data on ponds, lakes, rivers, and canals were used for estimating the densities of hydrographic nets (including river and canal density, lake and pond density) by conducting line and kernel density operation using the spatial analyst tools of ArcGIS. The normalized difference moisture index (NDMI) was used for reflecting soil or vegetation moisture contents in waterbird habitats. Wilson [39] defined NDMI as:
N D M I = R n i r R m i r R n i r + R m i r ,
where N D M I is the normalized difference moisture index, R n i r and R m i r are the reflectance in the near infrared (nir) band and middle-infrared (mir) band, respectively. The mir band is band 5 (swir 1) and band 6 (swir 1) in Landsat TM and Landsat 8 OLI, respectively.
Plants not only serve as a direct food source for waterbirds, but also provide a growing environment for other waterbirds food sources, such as fish, shrimp, shellfish, helminth, and worms. Considering waterbirds diet, a symbolic index representing vegetation growth status and coverage, the normalized difference vegetation index (NDVI) was assumed to reflect food availability for waterbirds [40]. NDVI was calculated using the spectral bands of red (Rred) and near-infrared (Rnir), which were acquired from Landsat image data. The equation for NDVI is as the following:
N D V I = R n i r R r e d R n i r + R r e d ,
where N D V I is the normalized difference vegetation index, Rnir and Rred are the reflectance in the nir and red bands, respectively.
Low-lying and flat wetlands, such as floodplain, provide safe shelter for waterbirds protection from other species. While the slope reflecting the fluctuation of terrain is one of the indexes of habitat shelter, land cover—a relative measure of shelter safety for waterbirds—can reflect the resting constitution [41]. To explore the safety and comfort of shelters for waterbirds, each land cover type was assigned a different value according to the principles that wetland represent the best shelters, followed by woodland, grassland, cropland, water body, and finally barren and built-up lands.
Prior to calculating the index of habitat suitability, these data layers were translated to generate raster-based maps. We standardized all raster data into numerical data using spatial analyst tools, considering unified calculation of qualitative and quantitative data. Finally, the suitability indexes were quantified on a scale of 0–100. The equation for this standardized method is:
S = x x m i n x m a x x m i n ,
where S is the standardized index factor value, x is the index factor value, x m a x is the maximum of the index factor, and x m i n is the minimum of the index factor.
The relative importance of these typical environmental factors to the habitat’s suitability must be determined beforehand. For each factor, we determined weights as a proxy for the importance of these typical environmental factors, using the analytic hierarchy process approach (AHP). The AHP is a general measurement technique for deriving ratio scales from paired comparisons. AHP output is a set of rankings to support decisions regarding a large number of alternatives based on several decision factors per alternative. The method combines the relationships between habitat suitability factors [42]. This process consists of main steps, which include (1) defining decision elements (habitat suitability factors), (2) decision model construction (a linear function adopted to calculate the integrated index), (3) local priorities determination (decomposition and pairwise comparisons), (4) combinining the scales created through the pairwise comparisons to determine how well the options can be expected to meet the goal, and (5) analysis refinement, until a satisfying decision can be made.
After determining reliable and objective weights for these factors using AHP, a waterbirds assessment model and key habitat index directly affecting the foraging and resting of waterbirds were established. The waterbirds habitat suitability index was calculated using the following formula:
H S I = i = 1 n w i f i ,
where H S I is the overall score of habitat suitability; w i and f i are the weight and value of the ith indicator, respectively; and n is the number of the assessment indicators. Habitat suitability for waterbirds was graded as optimum for HSI = 75–100, good for HSI = 50–75, general for HSI = 25–50, and poor for HSI = 0–25. The assessment results were verified using the nest point distributions of waterbirds. An overview of the research approach is shown in Figure 3.

3. Results

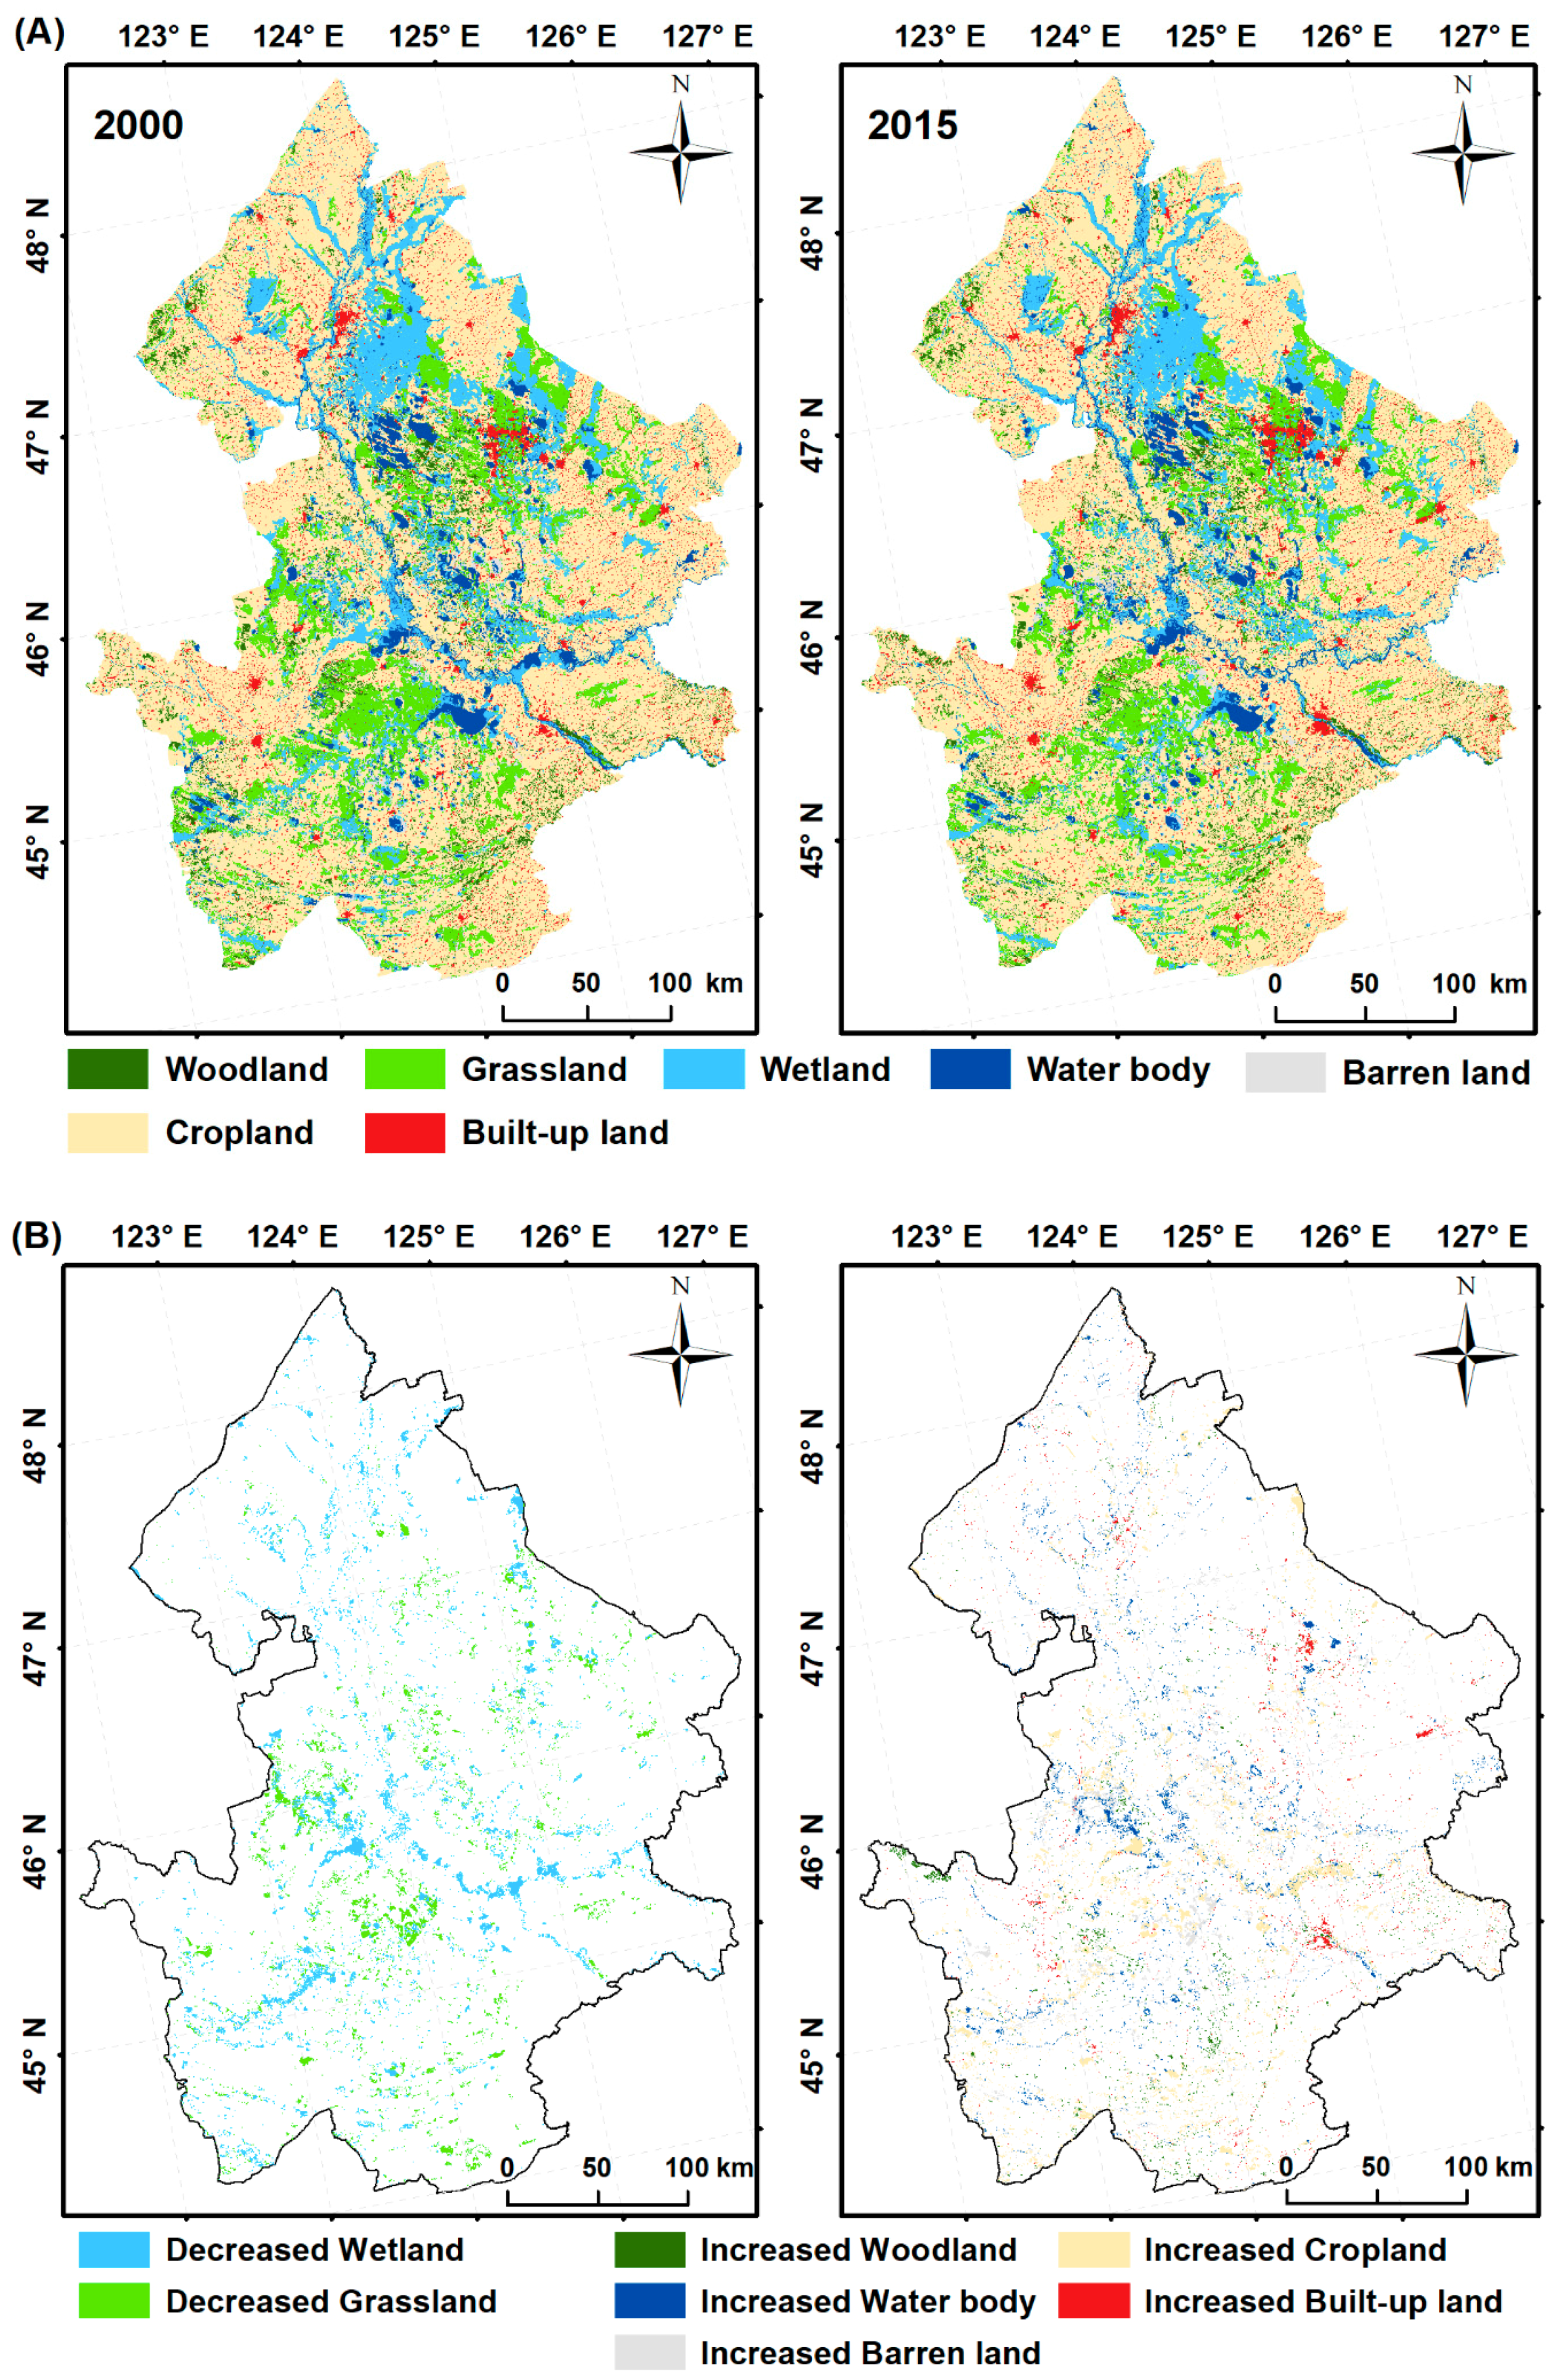
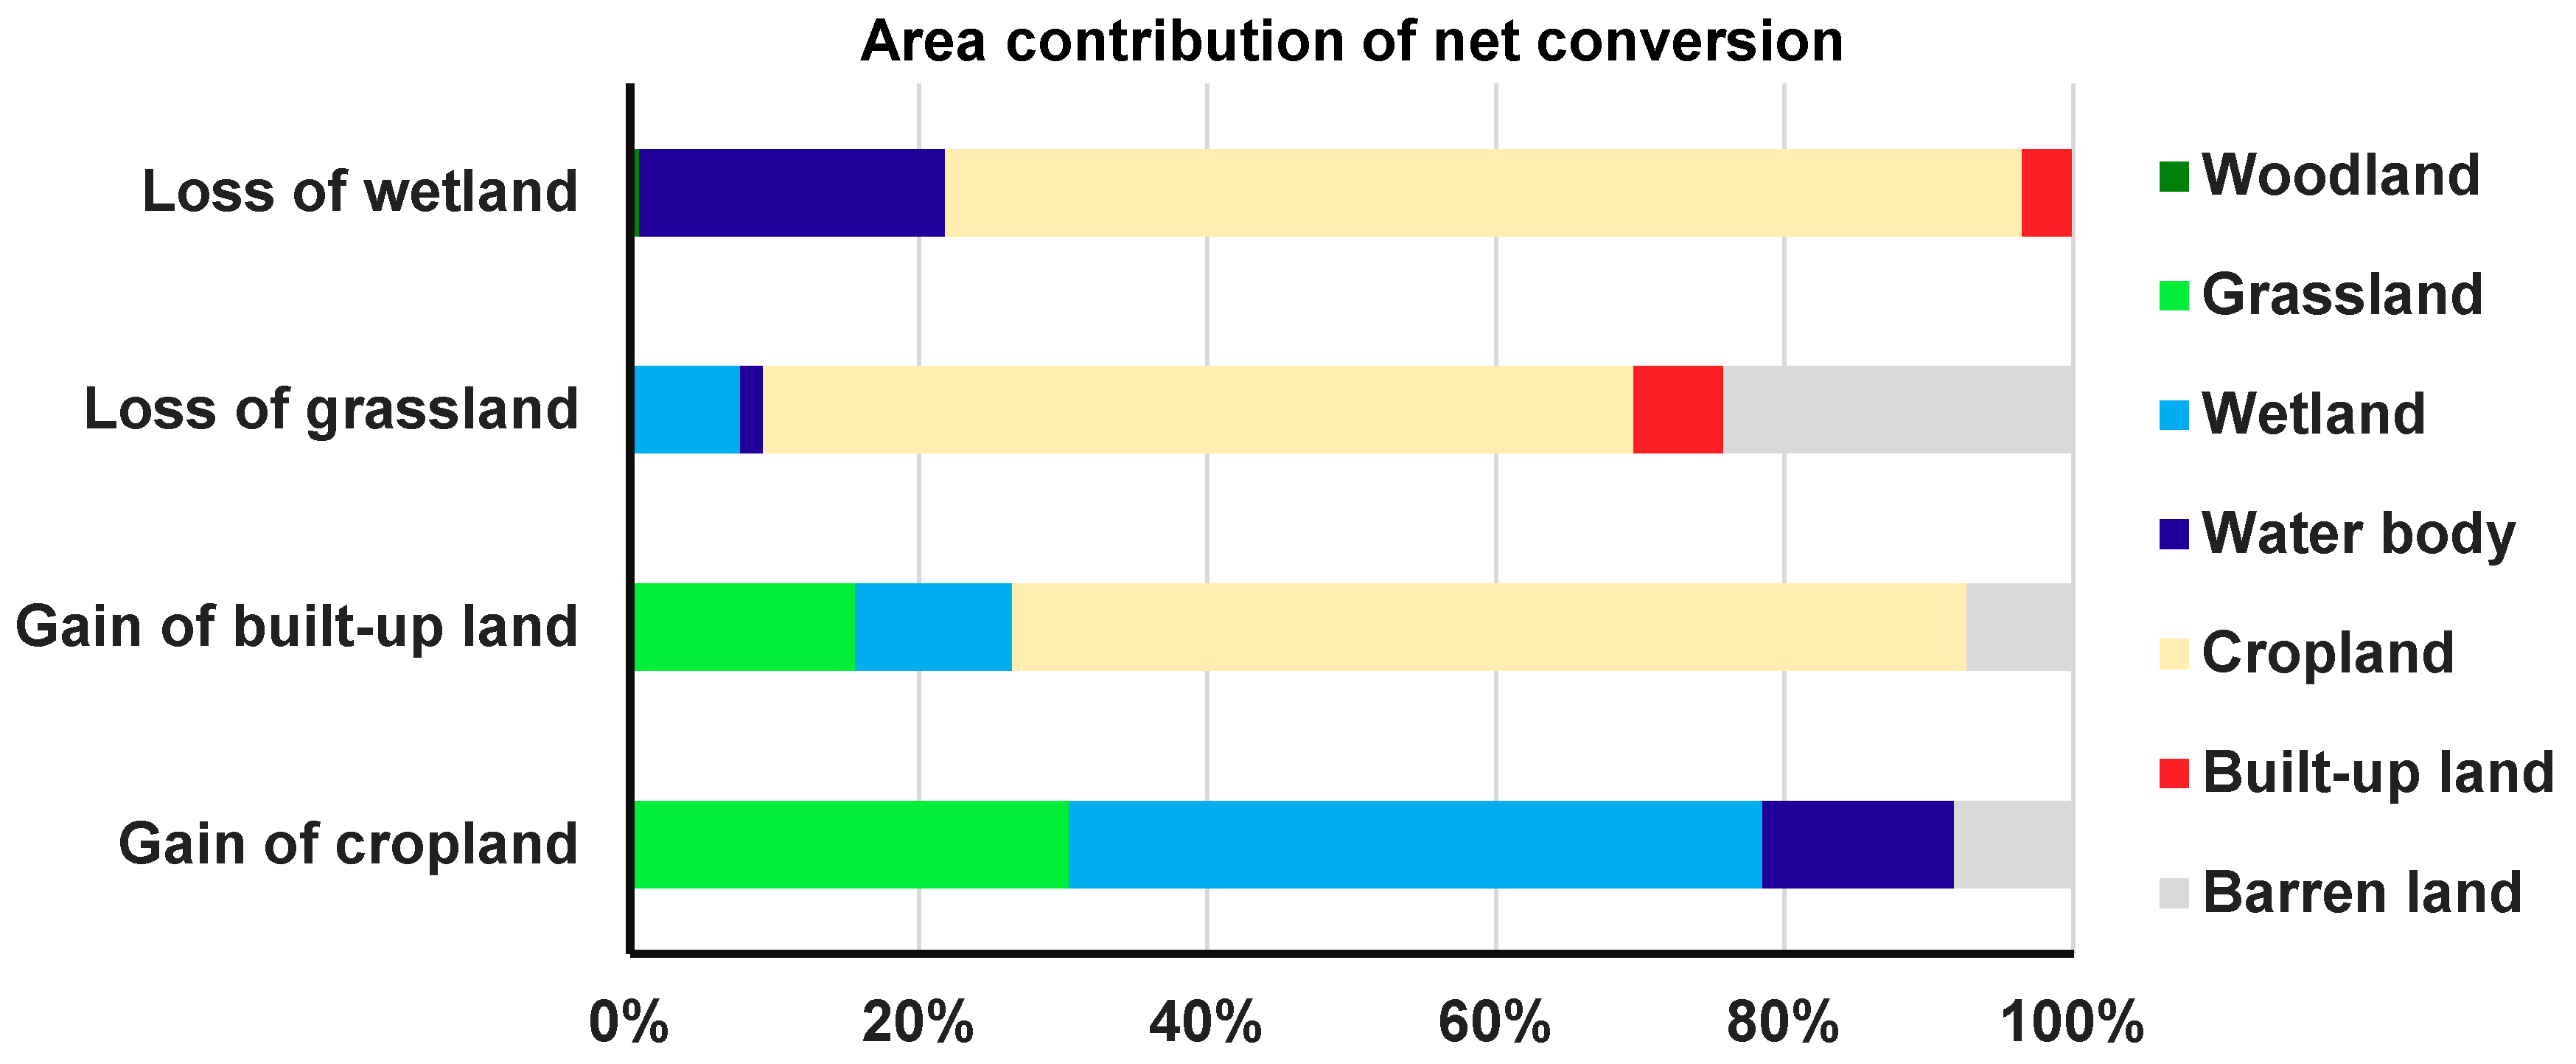
3.1. Land Cover Change in the WSP between 2000 and 2015

Based on field truth samples, the overall accuracy of all land cover types was greater than 89%. The overall accuracy of natural land cover types and anthropogenic land cover types was 87.91% and 92.68%, respectively. User’s accuracies were greater than 86% for natural land cover types and 93% for anthropogenic land cover types. Producer’s accuracies were greater than 82% for natural land cover types and 92% for anthropogenic land cover types. The Kappa coefficients of natural land cover types and anthropogenic land cover types were 0.85 and 0.86, respectively. The Kappa coefficients were larger than 0.80 for all land cover types, indicating significant consistency between classification results and validated samples (Table 1a,b).
The distribution of land cover types showed significant spatial differences (Figure 4A). Wetlands were observed mostly along major rivers and lakes, especially in the northern part. Grasslands were distributed mainly in the central part. Wetland and grassland accounted for 30.39% and 30.88% of natural land cover types, respectively, comprising two dominant natural land cover types. The third largest natural land cover type was water body, accounting for ~16.56% of natural land cover types. Woodlands were mainly found in the northwestern and southeastern regions, occupying 13.29% of natural land cover types. Croplands occupied more than 93.03% of anthropogenic land cover types in 2015 (Table 2), which were also the largest anthropogenic land cover type. Built-up lands were mainly located around major cities, accounting for 6.97% of anthropogenic land cover types. Croplands were the dominant land cover type in the total area, occupying 64.13% (6,512,321 km2) in 2015. Grassland (974,072 km2), wetland (964,976 km2), and water body (522,309 km2) covered 9.59%, 9.50%, and 5.14% of the region’s total area in 2015, respectively. The proportion of woodland, barren land, and built-up land in the study area was very small, accounting for ~4.13%, 2.70%, and 4.81%, respectively (Table 2).
Figure 4b shows the spatial location of decreasing and increasing land cover. Areas of woodland, water body, and barren land increased slightly by 18,248 km2, 4350 km2, and 2304 km2 from 2000 to 2015, respectively (Table 2). Expanded woodlands were mainly distributed in the western and south parts of the study area. Water body expansions were mainly distributed in the central part. Barren land increase was mainly observed in the central and southwestern parts. The corresponding increase was dominated by cropland growth, an increase of 146,458 km2 from the beginning of the period to its end. Croplands increased in almost every part over the study area, especially in the southwestern and central parts. Built-up land had the most significant increase rate (7.87%) from 452,421 km2 in 2000 to 488,016 km2 in 2015, due to the obvious expansion of cities and road construction in the eastern and southeastern parts of the study area.
Being important for waterbird habitats, wetland and grassland in the WSP experienced obvious shrinkage from 2000 to 2015. Wetland and grassland losses can significantly affect the habitat suitability for waterbirds, which had a decrease rate of 10.52% and 8.76%, respectively (Table 2). Our estimates showed a 93,546 km2 and 113,407 km2 net loss of grasslands and wetlands, respectively (Table 2). Grassland loss occurred mainly in the agricultural and pastoral transition areas of the western and central parts. While wetland decrease was also extensive in these regions, decreased wetlands occurred mainly in the southwestern and central parts (Figure 4b).
Anthropogenic land cover, including built-up land and cropland, expanded significantly during the 15-year study period, while grasslands and wetlands suffered serious losses. Figure 5 shows an area contribution of the net conversions for changes among these land covers. Our estimates showed net conversions to cropland and water body accounted for 74.66% and 21.21% of wetlands net loss, respectively. The area categorized as grasslands decreased during 2000–2015 mainly due to its conversion into cropland and barren land, which accounted for 60.26% and 24.24% of grassland net loss, respectively. These data indicate that cropland expansion made a dominant contribution to wetland and grassland losses. Built-up land gains were converted from cropland, grassland, wetland, and barren land, accounting for 66.12%, 15.55%, 10.95%, and 7.38%, respectively. Wetland and grassland contributed to 48.05% and 30.41% of cropland conversion, respectively. The expansion of anthropogenic land cover types caused serious damage to wetlands and grasslands, which are important for waterbird habitats.

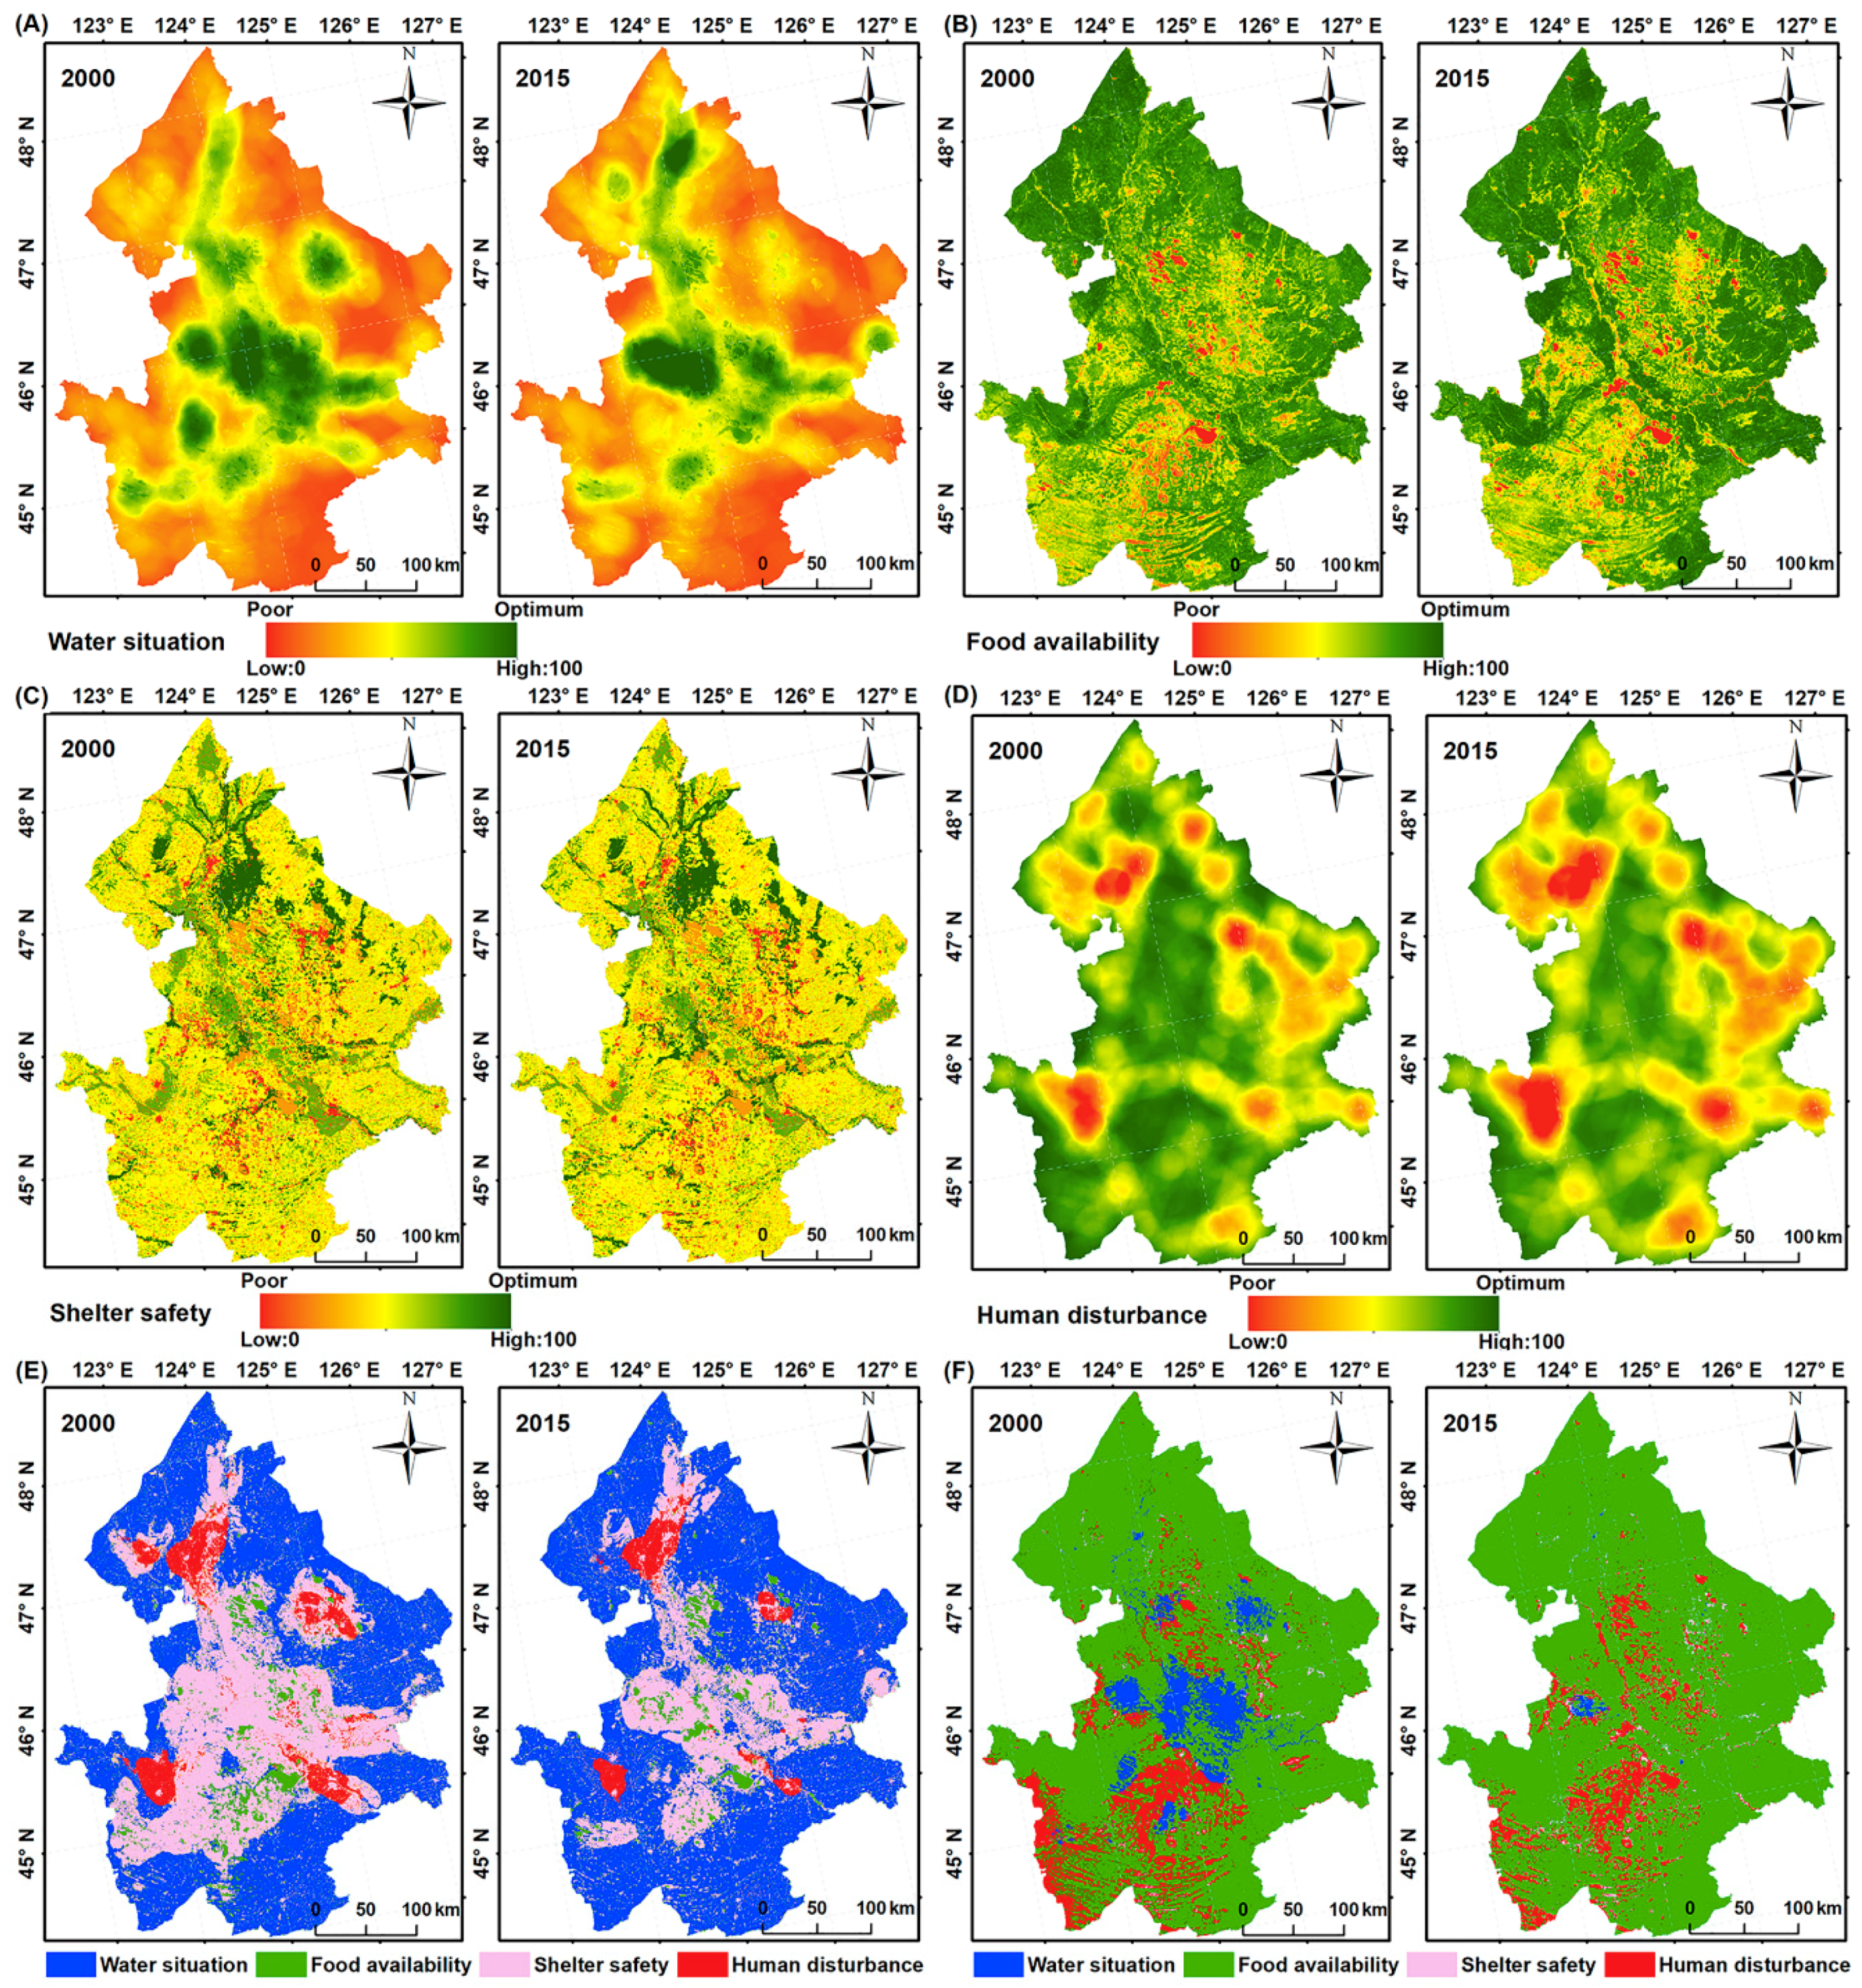
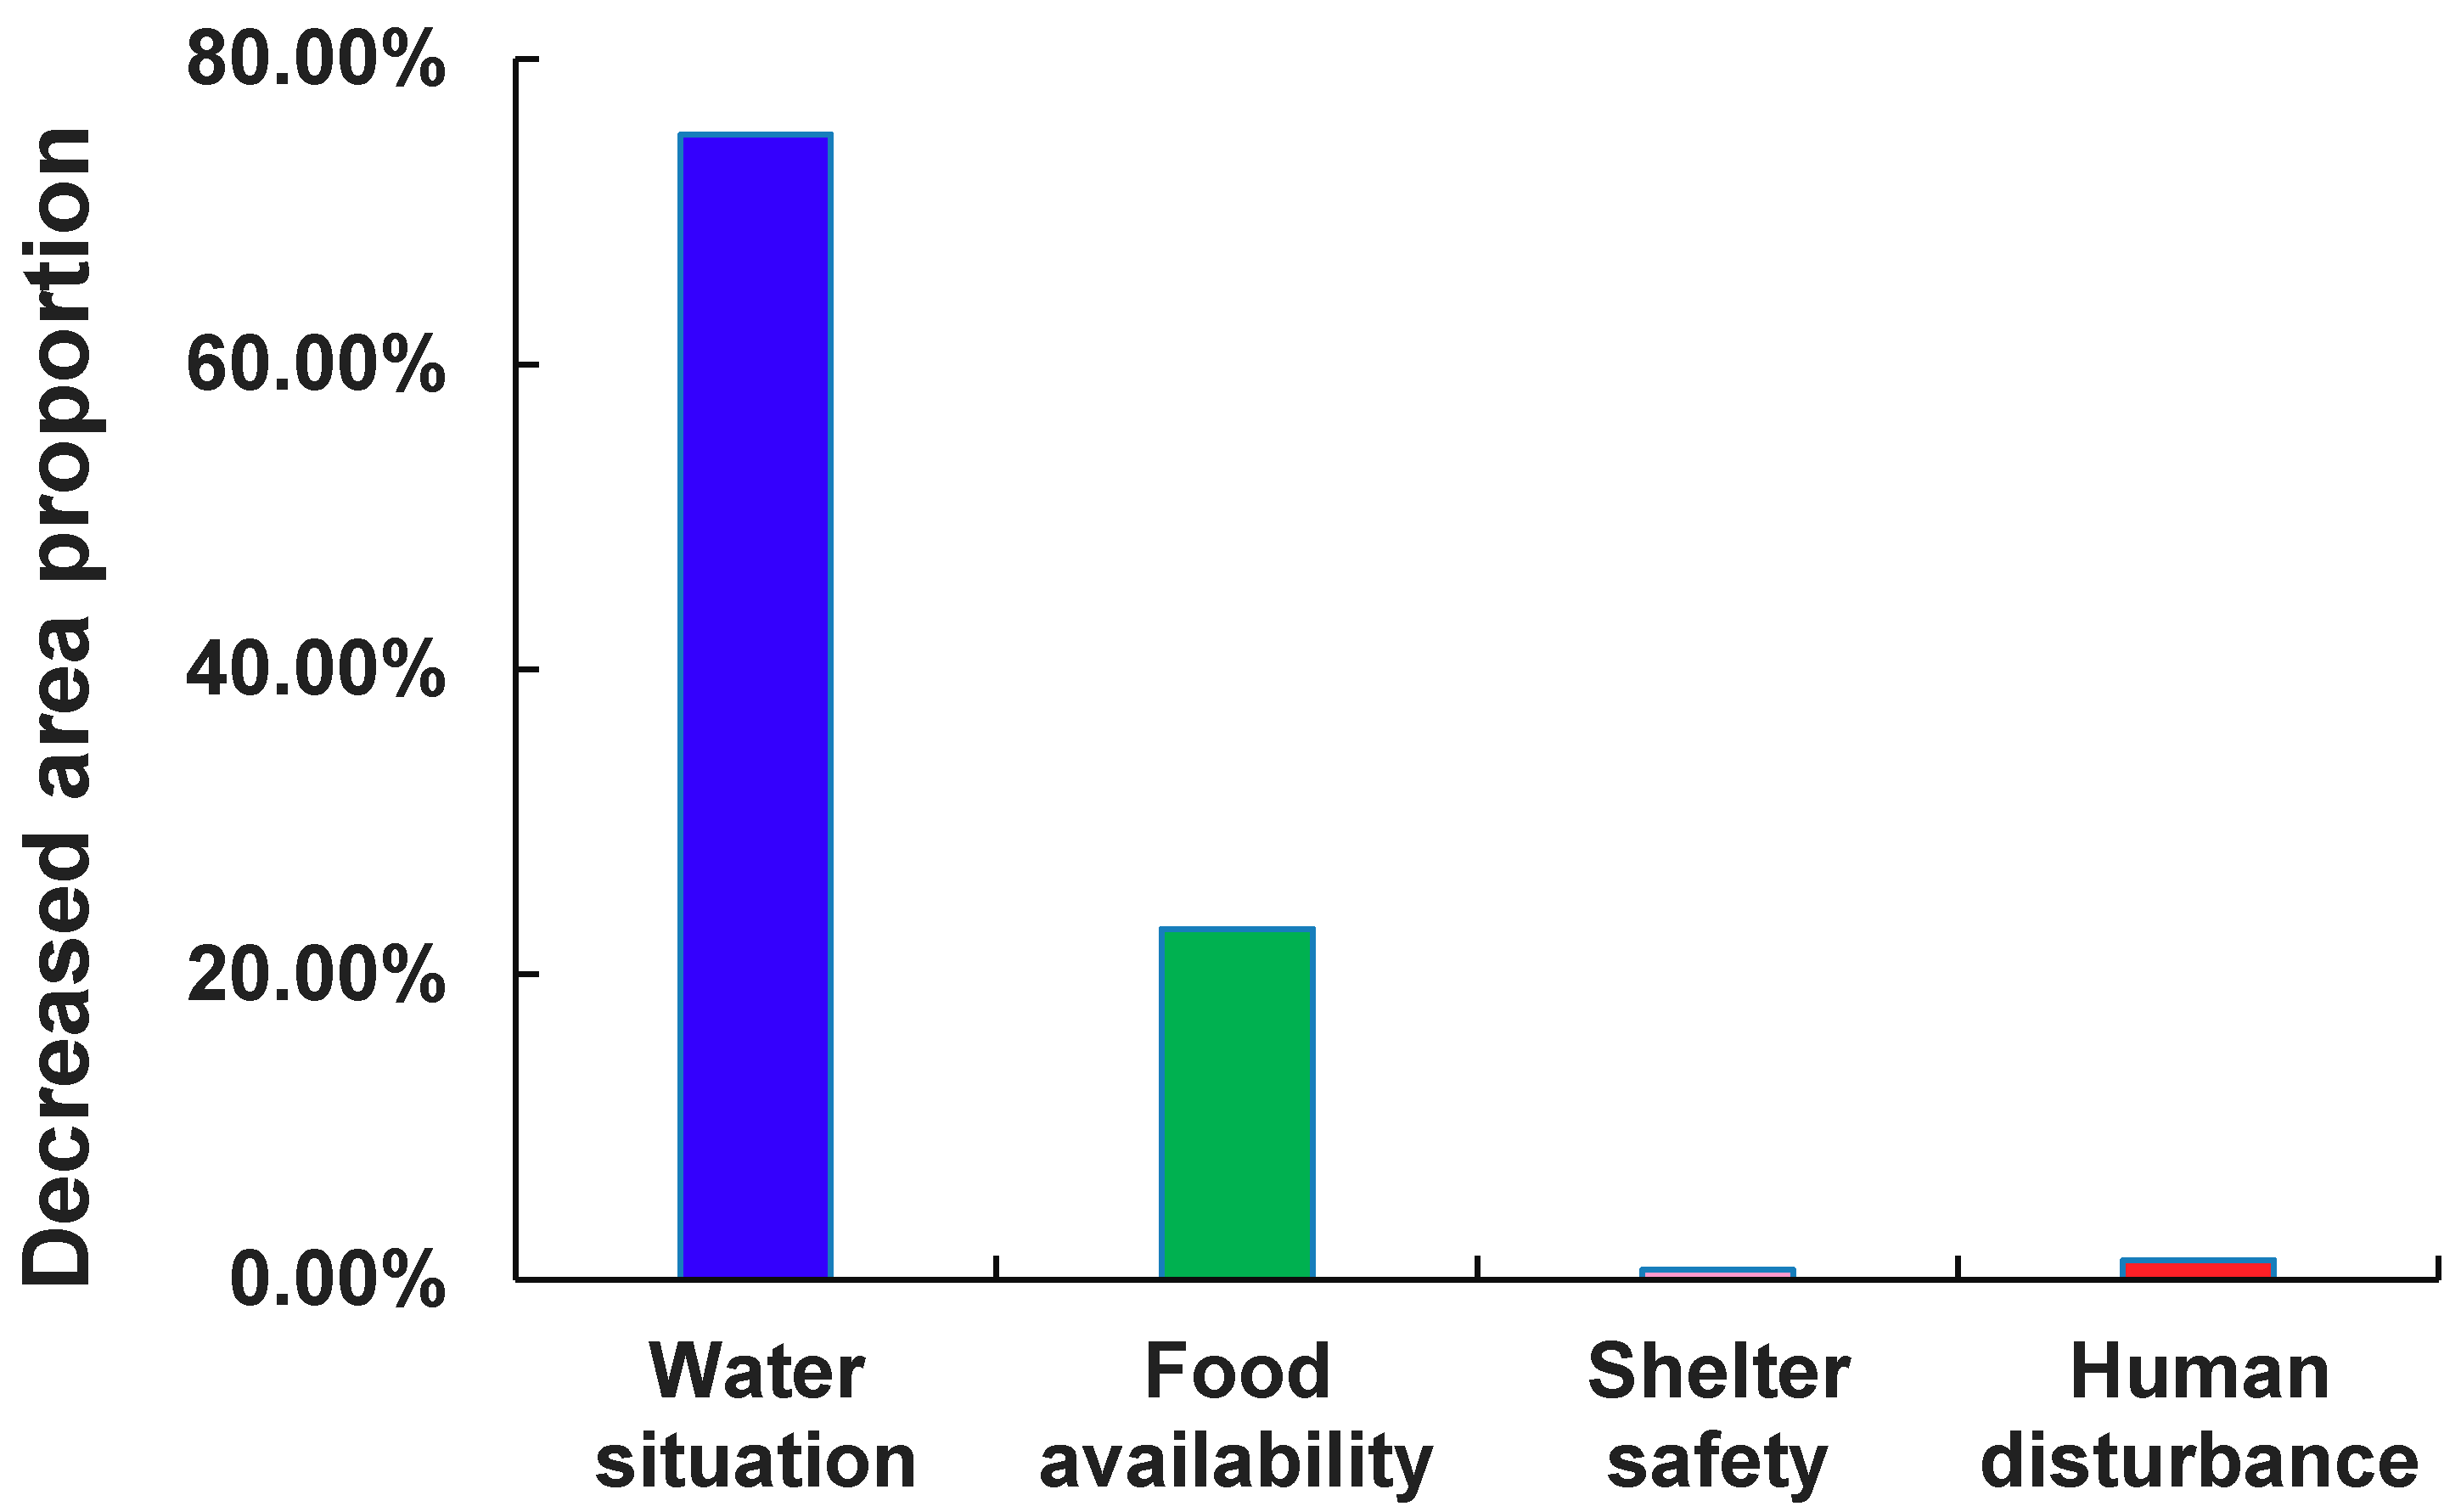
3.2. Patterns and Weights of Various Factors for Assessing Habitat Suitability

Figure 6 illustrates the spatial pattern of habitat suitability factors including water situation, human disturbance, food availability, and shelter safety. There were obvious advantages to the water situation and humidity around main rivers, due to the abundant water sources in the central part over the region (Figure 6a). Similarly, the water supply capacity of hydrographic nets was stronger in the region, where habitat suitability for waterbirds was more favorable than other regions. According to NDVI distribution, areas with poor vegetation growth, such as water, bare land, and regions with a concentrated distribution of built-up lands, food supply capacity was relatively weak. Food supply capabilities in the northern and eastern parts, where better vegetation growth was available, were higher, and correspondingly, habitat suitability for waterbirds was better (Figure 6b). According to land cover types and slope data, shelter conditions with higher safety were distributed in the north part of the study area (Figure 6c). Shelter safety scores in woodland, grassland, and cropland declined in turn. The shelter safety score in grassland was low, and built-up lands had the lowest score. A higher score for these factors (water situation, food availability, shelter safety) represented the habitat suitability for waterbirds. Figure 6d shows that regions with higher road density and more concentrated settlements had a stronger impact on habitats compared to other parts. Central areas were consisted mainly of wetlands and grasslands, where human activities had little impact. These regions presented a high grade of habitat suitability for waterbirds. Higher human disturbance factor values reflected worse areas for waterbirds to inhabit.
Figure 6e,f shows the spatial patterns of factors giving the lowest and the highest contribution to the HSI. It reveals that the most important contributing factor of HSI in the central part of the study area was water situation in 2000, and the lowest contributing factor of HSI was shelter safety. Compared with 2000, the influence of water situation on HSI significantly decreased, replaced by human disturbance and food availability.
Table 3 presents the AHP results of each factor’s weight for assessing waterbird habitats. We found that water and food were more important than human disturbance and shelter safety. The weight for both water situation and food availability was 0.3. The weight for both human disturbance and shelter safety was 0.2. Hydrographic nets were important factors in water situation, and their weight was 0.65. The weight of NDMI in water situation was 0.35. The weight of settlement was 0.5—the most important factor in human disturbance. Weights of other human disturbance factors (road and industrial land) were 0.35 and 0.15, respectively. The weight of land cover type was 0.75, which was more important than the slope factor in shelter safety.

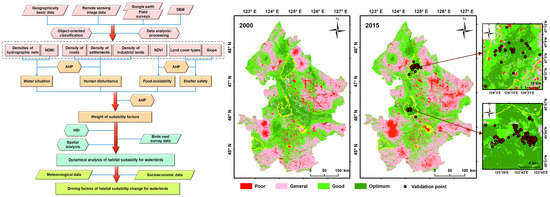
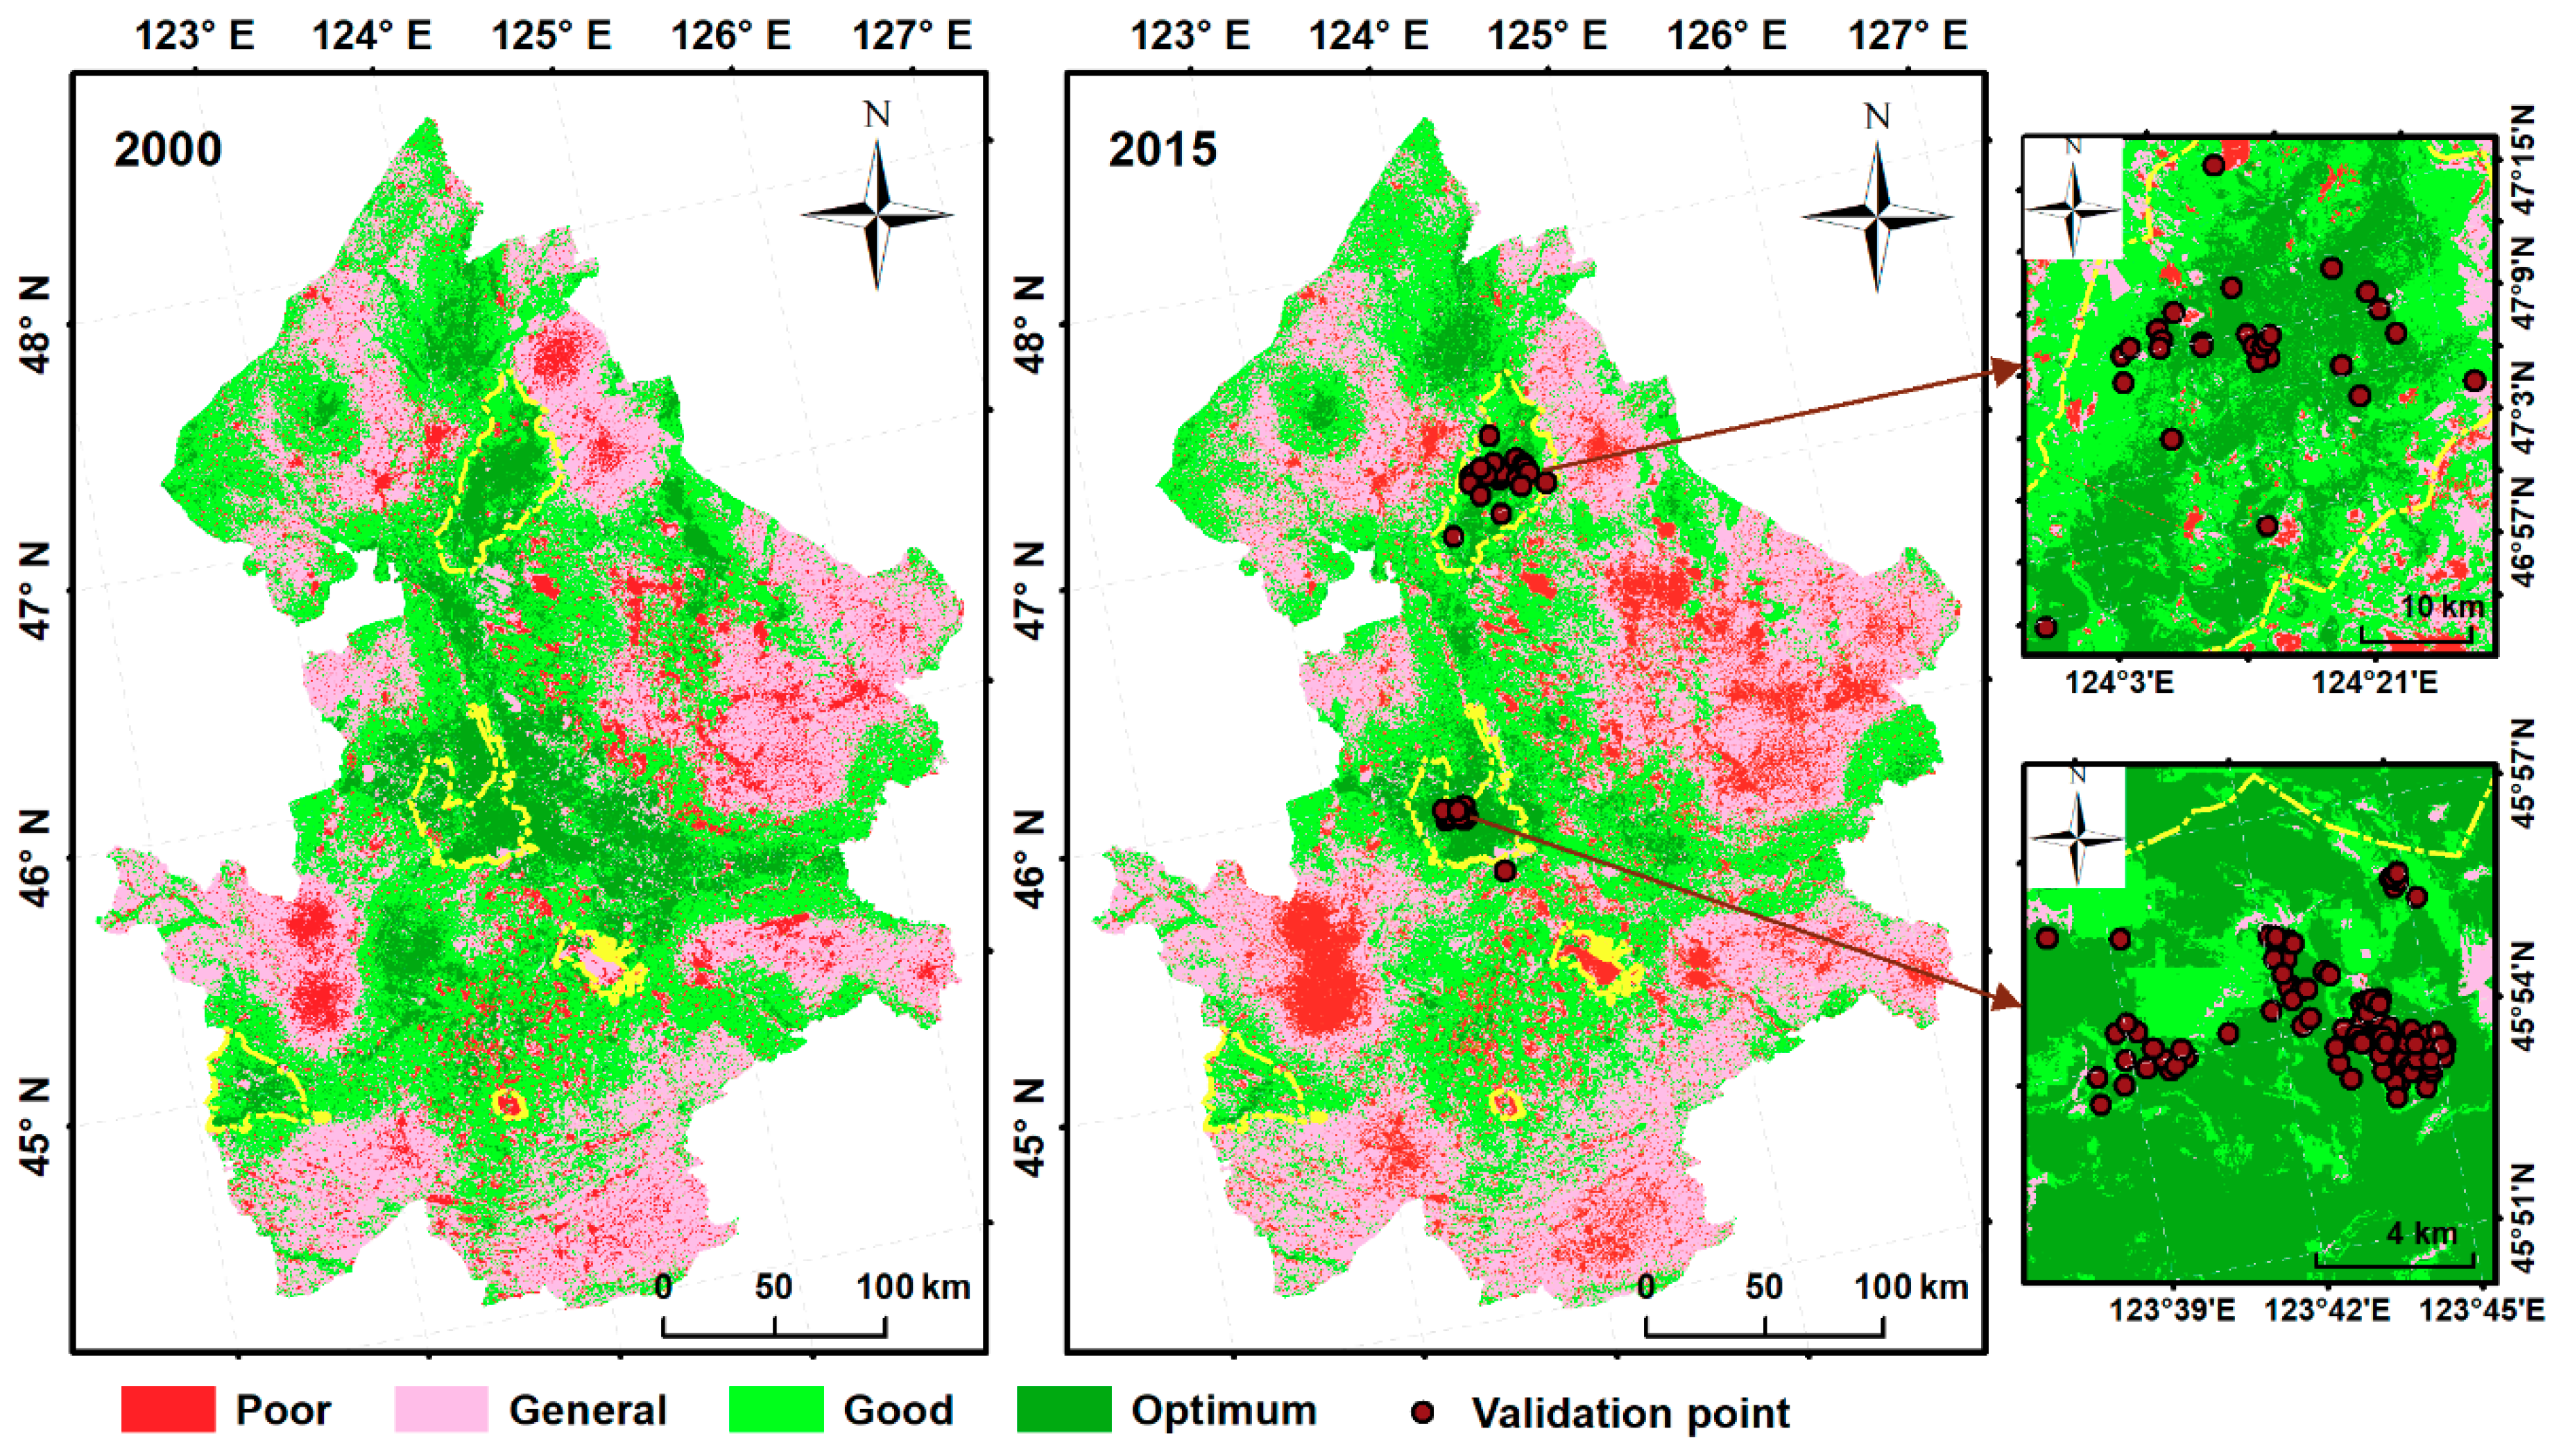
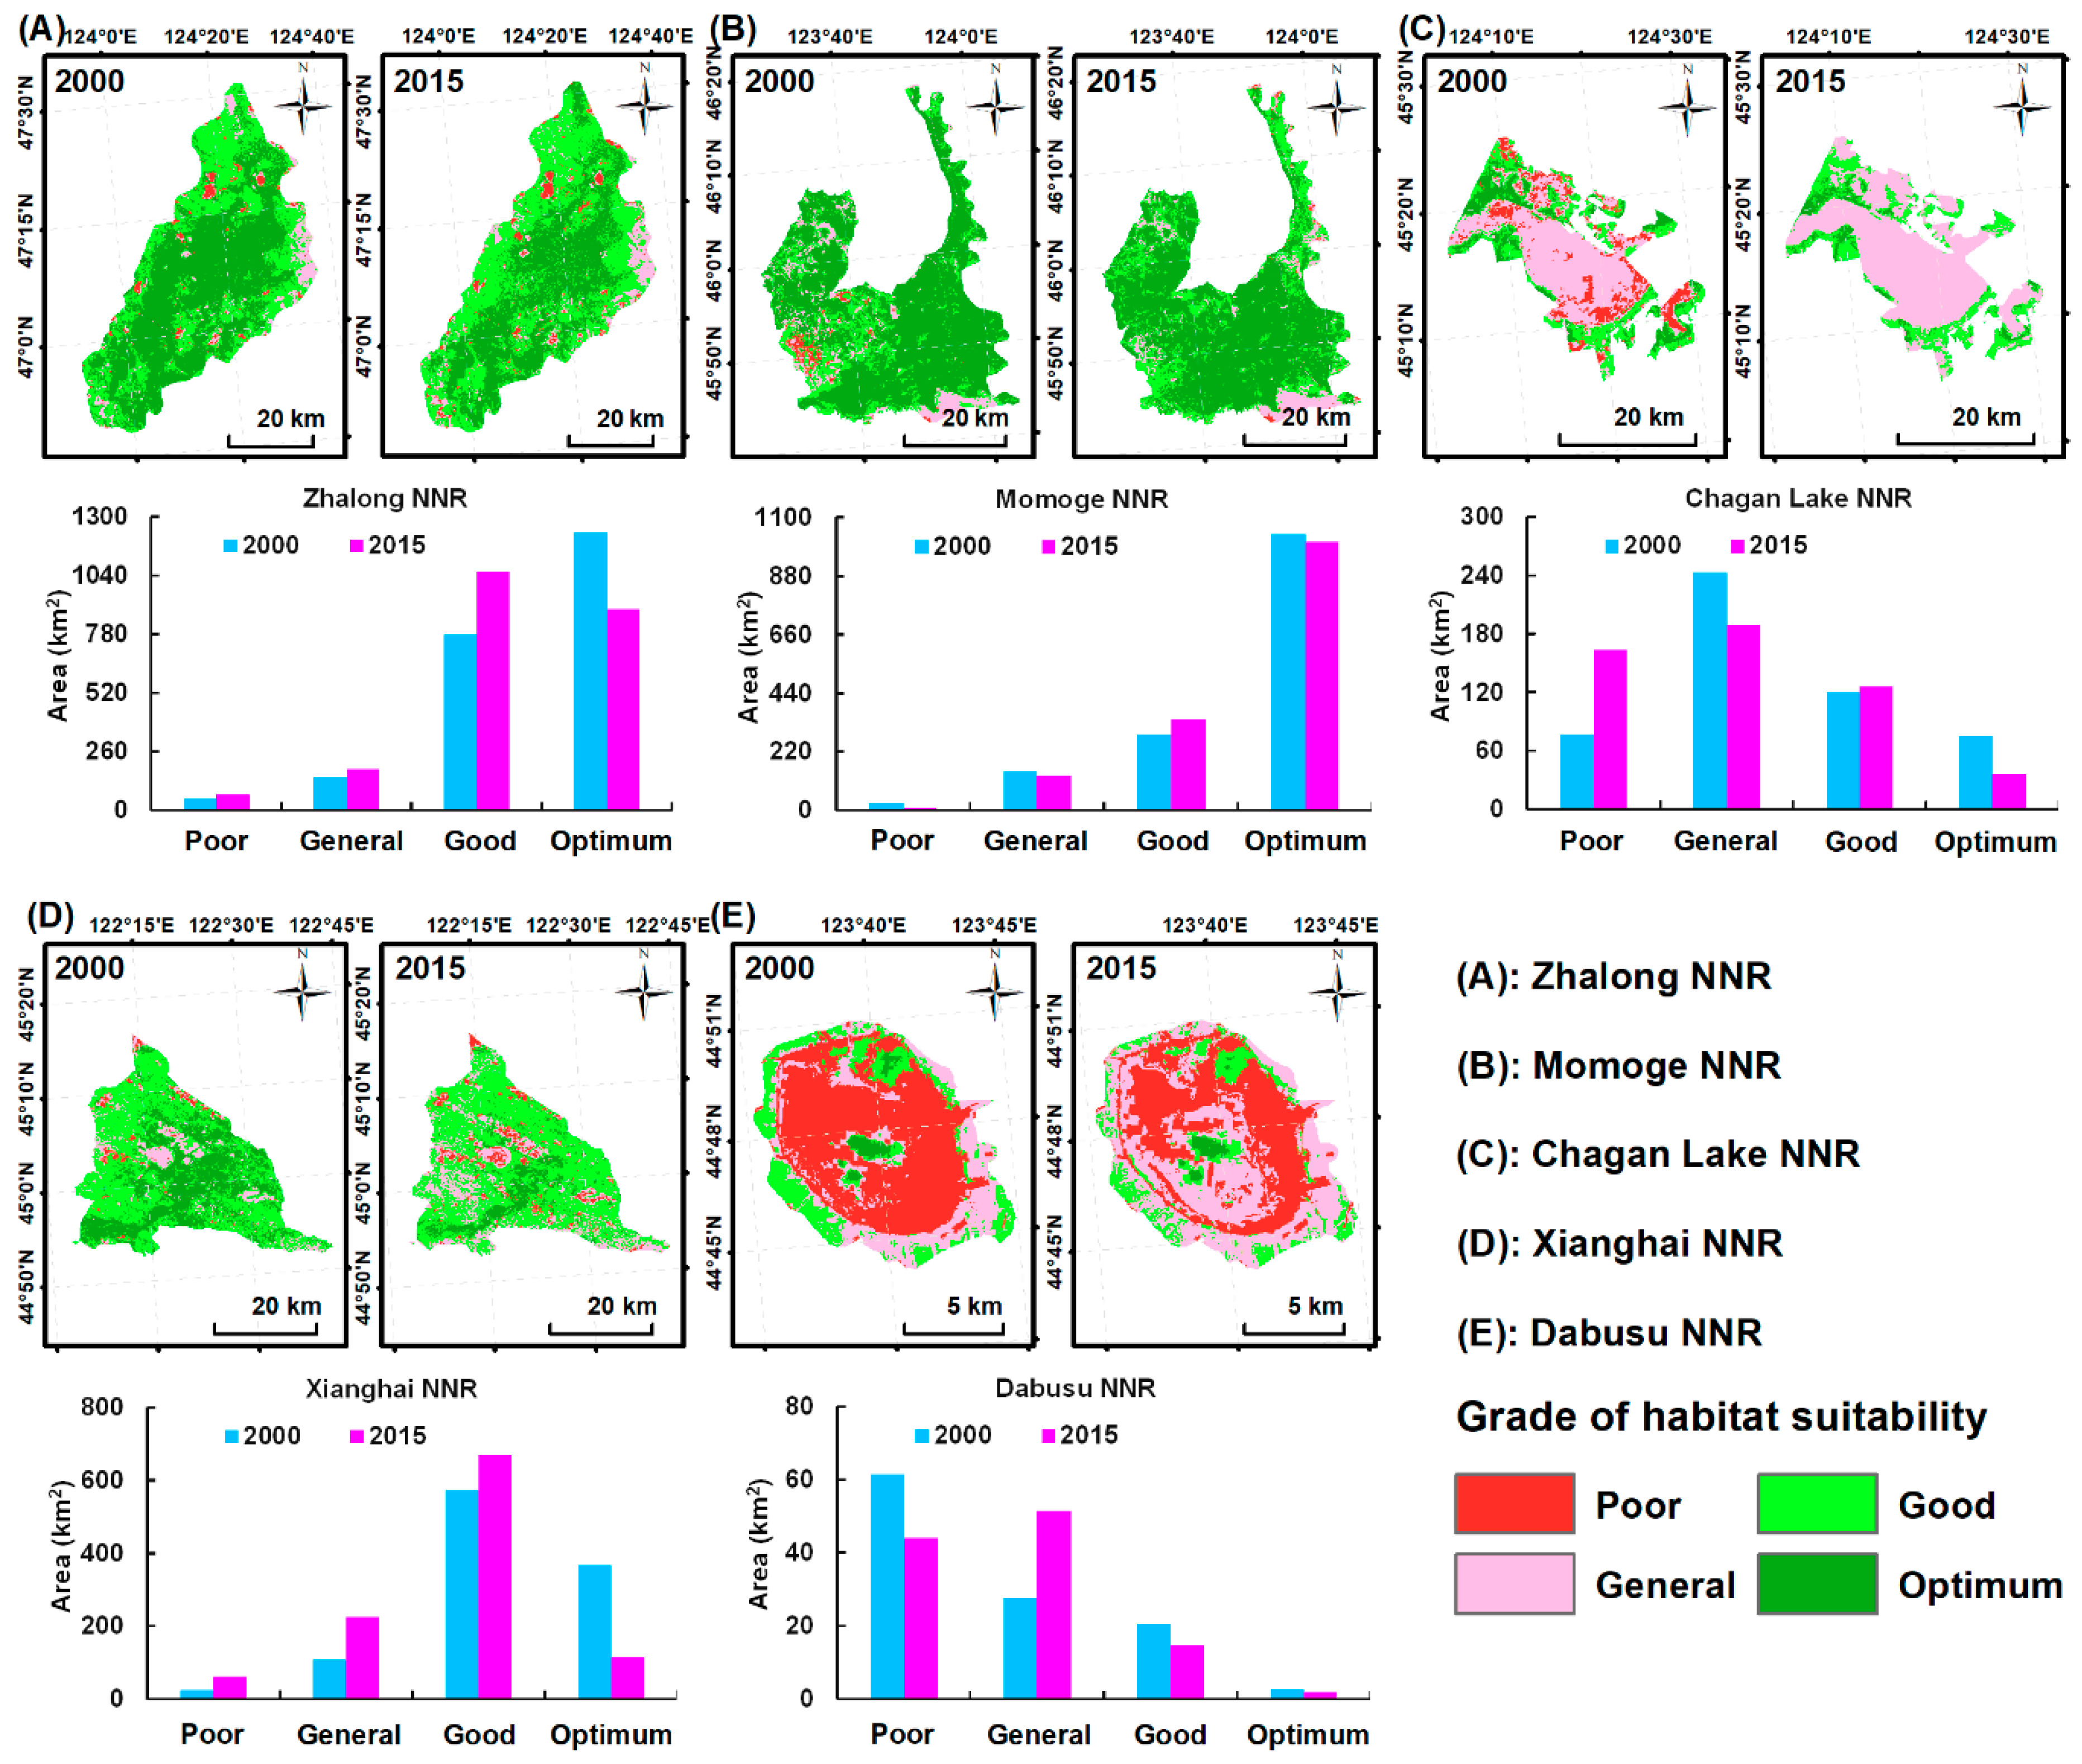
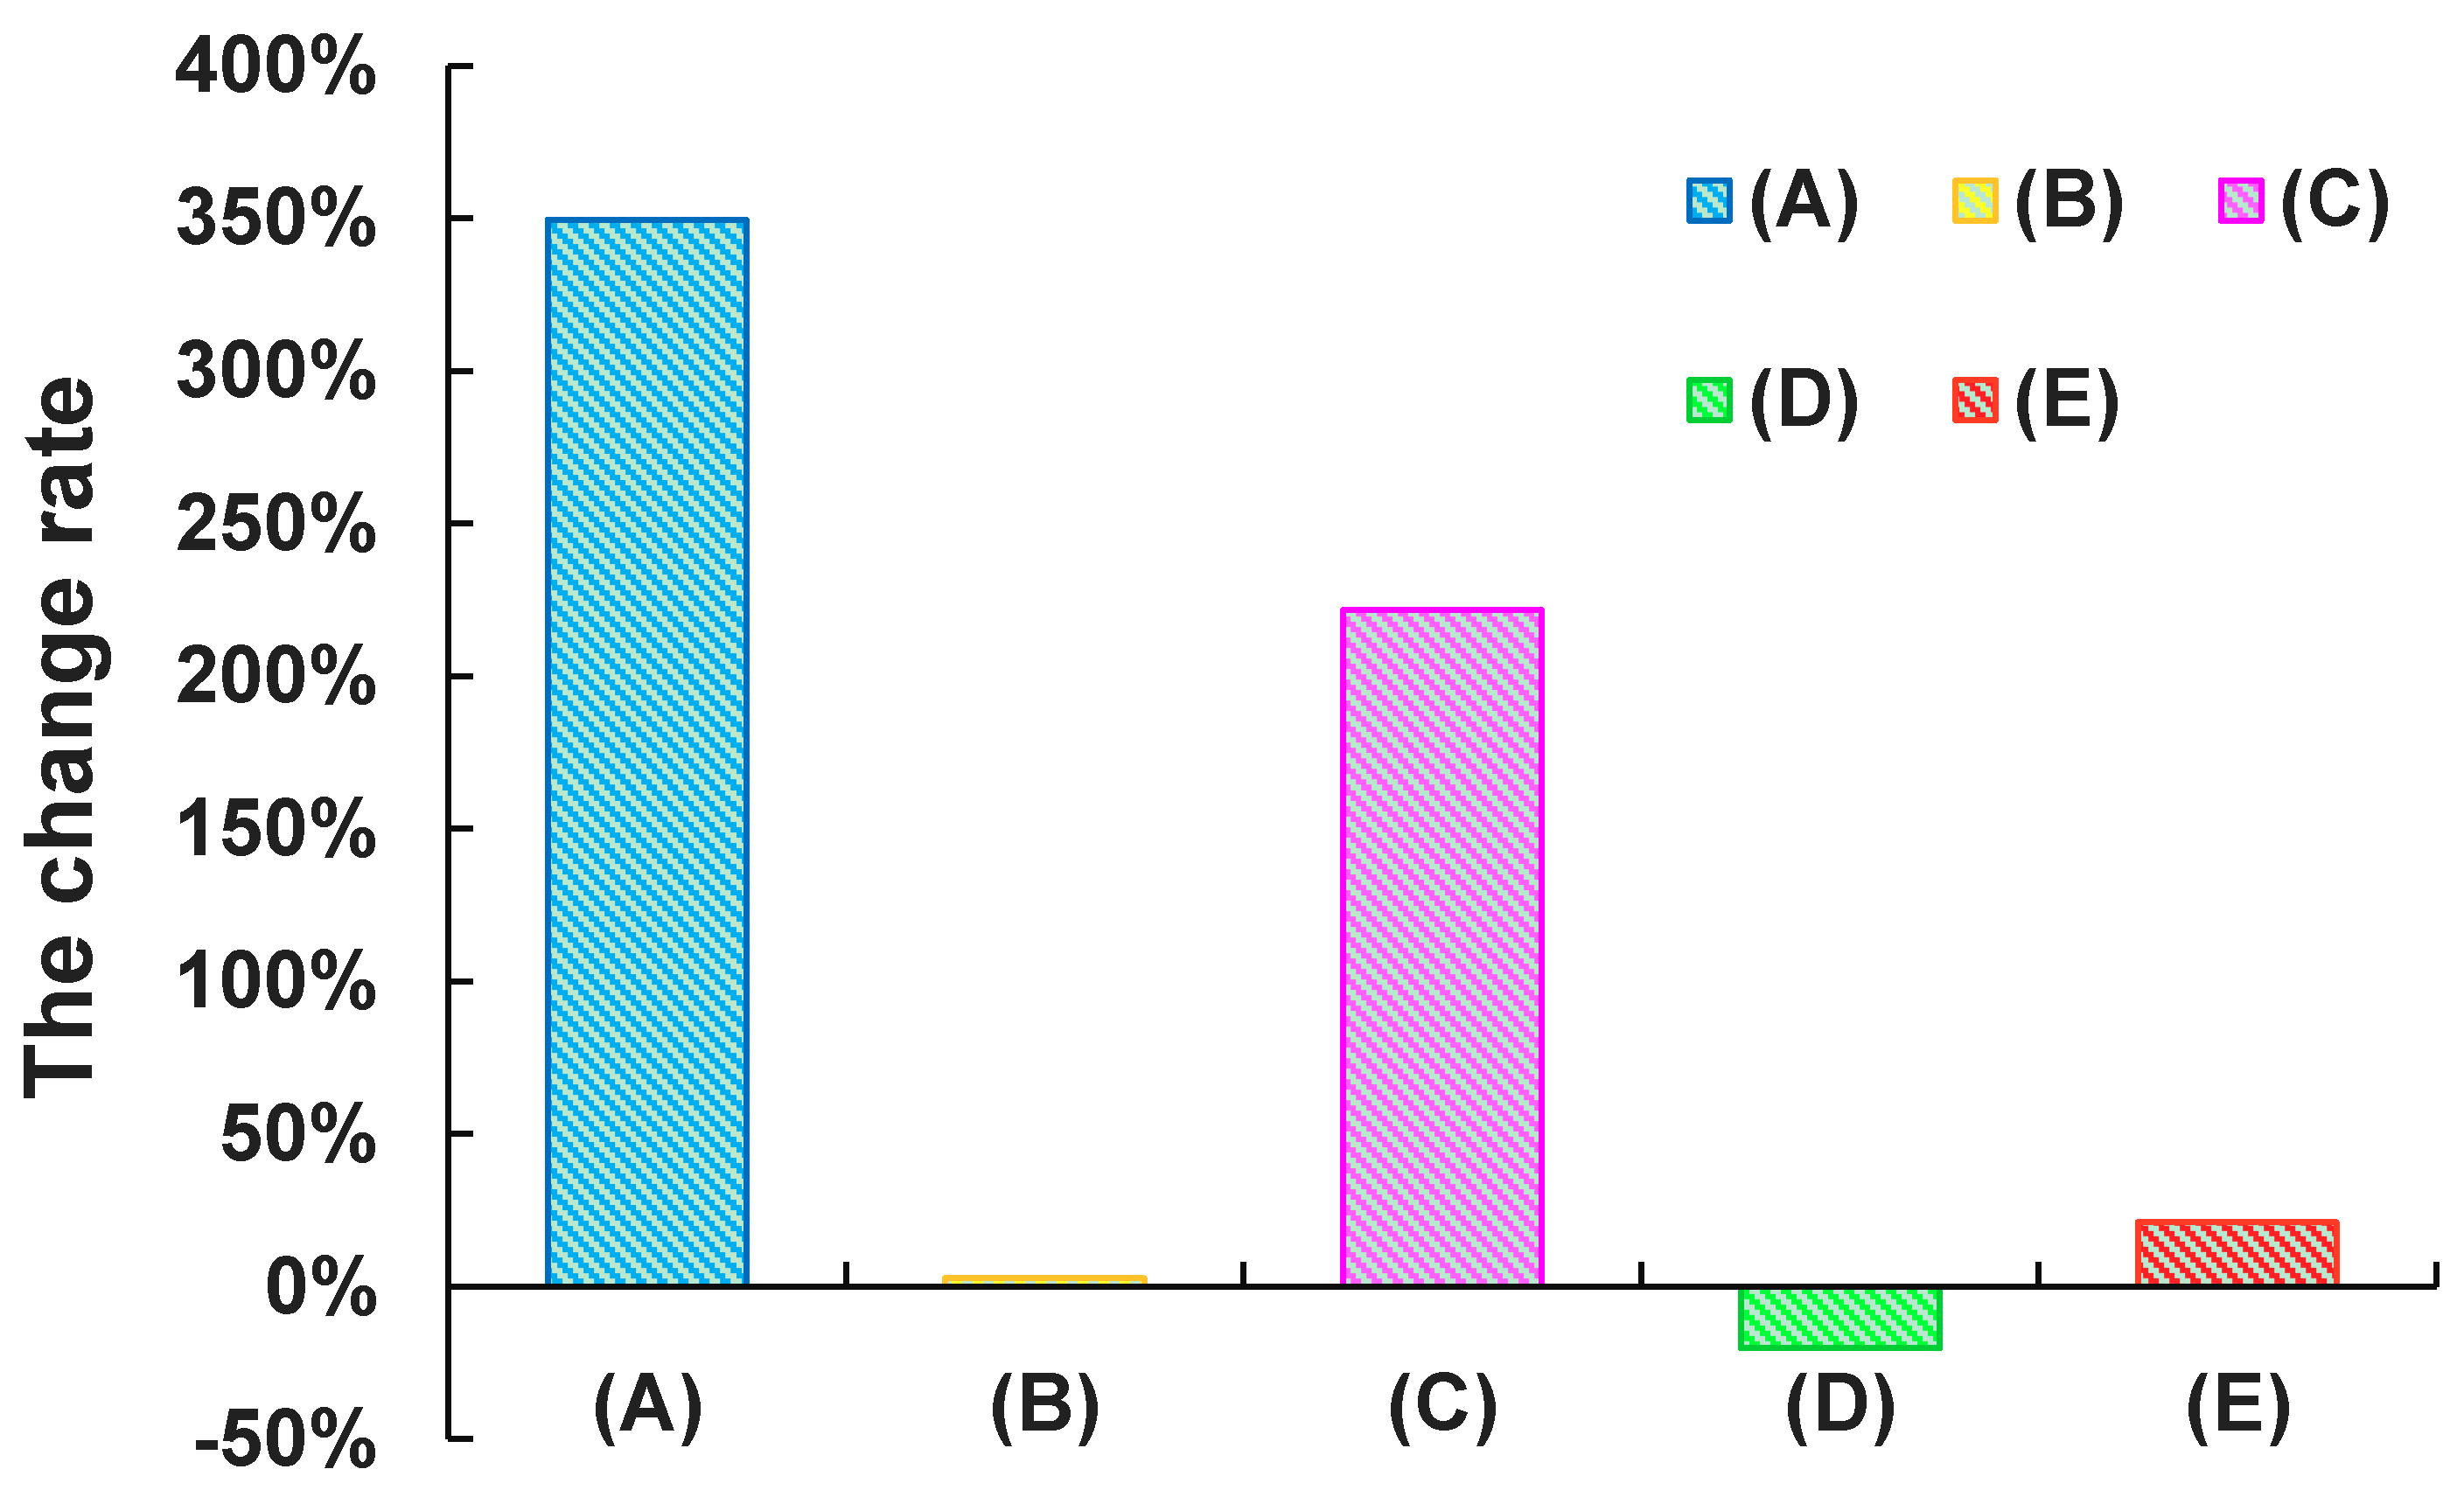
3.3. Spatiotempral Changes in Habitat Suitability for Waterbirds

The verification results based on 227 waterbird nesting locations reflected the evaluation’s rationality. As a result, 217 nests located in the habitat had an optimum suitable grade and the remaining 10 nest points were in the good habitat grade.
Habitats with optimum suitability for waterbirds were mainly distributed in the central part of the WSP, where wetlands were widespread around rivers and lakes (Figure 7). This grade area was 613,225 km2, accounting for 6.00% of the total study area in 2015. Compared to 2000, areas of optimum habitat in the south and west parts of the study area decreased. The general grade habitat had the largest area (4,642,477 km2) and accounted for 45.42% of the total area. The second-largest was the good habitat, accounting for 34.57% of the study area. Poor grade habitat areas were estimated at 1,432,133 km2, accounting for 14.01% of the whole study area. Compared to habitats with optimum and good grades, general and poor habitats mainly existed in broader areas where croplands were the dominant land cover type. Areas of these grades increased in the eastern and southwestern parts of the study area.
Table 4 shows habitat areas with poor and general suitability grades, which increased by 464,233 km2 and 590,531 km2 from 2000 to 2015, respectively. Habitat areas with good grade decreased by 334,037 km2, whereas, those with optimum grade occupied the least coverage with a sharp decrease between 2000 (13.04%) and 2015 (6.00%). The change rates of habitat suitability for waterbirds for grades poor, general, good, and optimum were 47.96%, 14.57%, −8.64%, and −53.99%, respectively. Optimum habitats were mostly converted into good suitable habitats (90.17%). In contrast, during 2000–2015 general habitats increased by 5905.31 km2, and good habitats became the primary source of net increase in general habitats. The increase in poor habitats occurred mainly at the expense of general habitat loss (90.94%).
Analyzing reduction of the four factors in the degraded area of habitat suitability for waterbirds, it was found that the proportion of water situation reduction is the highest, and the area is 75.06% of the area where the habitat suitability for waterbirds is deteriorated. Followed by the area where the food availability value decreased by 23%. It shows that the contribution of water situation to the deterioration of habitat suitability for waterbirds is the highest (Figure 8).
As the major wetland distribution region, the suitability of waterbird habitats in the five NNRs dramatically changed (Figure 9). Habitat areas with the optimum suitability grade in Zhalong and Xianghai NNRs, two sites of international importance for waterbirds conservation, decreased dramatically from 2000 to 2015. The Ramsar site showed a slight decline of 2808 km2 in optimum grade habitats of the Momoge NNR. Most optimum habitats across the three NNRs were located around wetlands. In addition, optimum habitats in Chagan Lake and Dabusu NNRs decreased over the 15-year study period. Among the five NNRs, habitat areas with a good suitability grade increased, except those in the Dabusu NNR. The decrease in good and optimum habitats was mainly distributed in grasslands and wetlands surrounding lakes or along the rivers. General habitat areas increased in Zhalong, Xianghai, and Dabusu NNRs, whereas they decreased in Momoge and Chagan Lake NNRs.
Total change areas for the different habitat suitability grades in the five NNRs are shown in Table 5. In 2015, optimum habitats covered 38.10% of the total NNR area. Good habitats were the first large area, occupying 40.96% of the total NNR area. Habitats with general and poor suitability grades accounted for an additional 12.64% and 8.30% of the total NNR area, respectively. From 2000 to 2015, optimum habitats exhibited the largest decrease by 65,840 km2—from 271,336 km2 in 2000 to 205,496 km2 in 2015. Simultaneously, habitats with poor, general, and good suitability grades increased, with poor habitats changing the most, at a rate of 88.30%. Habitats with good suitability grades for the five NNRs showed a slight area increase of 438 km2 from 2000 to 2015.

4. Discussion

4.1. Remote Sensing Data and Habitat Assessing Methods

Satellite images clearly revealed land cover patterns and changes during the study period (Figure 4), which are important steps required for assessing ecosystem services, such as habitat suitability for waterbirds. Landsat imagery with fine spatial resolution and long-time span can provide historical data support for assessing ecosystem changes, as they can characterize long-term environmental changes at different scales. Several scholars have studied ecosystem change in the WSP using satellite image data [30,43]. However, since the Landsat TM ceased working in 2013, little research has been conducted on ecosystems in the WSP. In this study, Landsat OLI images ensured successful monitoring of the long-term land cover changes with continuous remote sensing data, thus providing data support for waterbird protection and ecosystem management. This study presents an effective approach for assessing habitat suitability for waterbirds by integrating satellite data and GIS techniques. Using this approach, our assessment results confirm that remote sensing data improve the assessment factors of habitat suitability for waterbirds on a large spatial scale, and thus advances in remote sensing technologies are well positioned to improve the HSI model’s assessment accuracy.
Hydrographic net densities have been frequently used as a proxy for water situation in assessing habitat suitability for waterbirds. Positive effects have been found between these indicators and habitat suitability for waterbirds [8,21,27]. However, these indicators do not fully consider land surface moisture, which is a very important factor for waterbird nesting [7], especially for waterbirds that nest in trees or grass far from water. Therefore, improved habitat suitability assessment can be achieved if multidimensional water situation indicators are considered, such as environmental humidity, not only hydrographic nets [44]. In this study, we used a band combination of Landsat images to extract NDMI, a sensitive indicator of the water situation, to reflect land surface moisture content around waterbird habitats. Combining NDMI with hydrographic net density can fully reflect the water environment in the study area, and provide more accurate information on water situations for assessing habitat suitability for waterbirds. Additionally, habitat suitability of waterbirds is closely related to water quality. Clear water can maintain enough aquatic plants and provide adequate food and shelter for migratory birds. Migratory waterbirds can respond to changes in food resources in the lake and adjust their migration routes according to changes in lake water quality. Therefore, water quality may be a complementary research direction for the research on the assessment of habitat suitability for waterbirds.
Although we have considered as many factors as possible to achieve an accurate assessment, the final assessment results using the current HSI model require further validation. Foraging and nesting locations for waterbirds have been extensively used for such purposes, in order to evaluate the assessment accuracy of habitat suitability. For example, Wang et al. (2015) validated habitat suitability for waterbirds accuracy results using 12 nesting locations in China’s Sanjiang Plain [27]. Dong et al. (2013, 2015) collected 28 waterbird nests over the WSP and 12 stopovers in the Bielahong Watershed, to perform a similar validation [21,45]. These studies used a limited number of nest points due to the difficulty in accessing waterbird nests that are near or floating in water areas. In this paper, 227 waterbird nesting sites were collected to validate the remote assessment of habitat suitability, indicating that a more rigorous verification was performed.

4.2. Change of Habitat Suitability Affected by Natural and Anthropogenic Disturbances

The WSP supports important habitats for much rare wildlife under national priority protection. Monitoring changes in habitat suitability and discussing the factors that alter it are crucial for protecting waterbird habitats. Previous studies on the impacts of climate change on waterbird habitats have revealed that the amount of wetland areas available for waterbirds has been greatly reduced due to the drier conditions [46,47]. In our study area, there has been a slight change in annual mean temperature and a fluctuating upward trend in annual precipitation during the past 15 years (Figure 10). Although the warm and humid climate is conducive to vegetation growth, our results, however, suggest that wetland shrinkage in the study area has led to a decrease in optimum and good habitats for waterbirds. We conclude that various human disturbances impose more adverse impacts on habitat suitability than single natural factors in the WSP.
Previous studies have implied that economic development and population growth indirectly lead to extensive loss of natural land cover, and cropland expansion, ultimately causing habitat loss and fragmentation, increasing pressure on natural resources for wild species [48,49]. Based on the Statistical Yearbooks from 2001 to 2016, both the secondary industry production and the gross domestic product (GDP) have had a dramatic boost, and the total population in this area increased by 29,630 thousand. Rapid economic development during the past decade has greatly changed regional land cover [7,30], which is an important reason for changes to habitat suitability for waterbirds. As we estimated, cropland areas increased from 6,365,862 km2 in 2000 to 6,512,321 km2 in 2015, and the expanded croplands were transformed mainly from wetlands (Table 2 and Figure 5). Furthermore, in order to meet the increasing demand for installations from the increasing population and industrial development, the area of built-up land increased by 35,595 km2 from 2000 to 2015. Agricultural cultivation and built-up land expansion were identified as leading factors for disappearing wetlands and their weakened waterbird habitats [19,27]. This was also confirmed as food sources, water sources, and sheltered environment for waterbirds were negatively affected by the degradation and loss of available wetland resources. Even in the five NNRs, habitat suitability was still damaged, due to conservation effectiveness decline caused by wetlands loss [50]. Similar increasing trends for unsuitable waterbird habitats (general and poor habitat), GDP, and secondary industry production were found in this study. In contrast, decreasing trends were found for waterbird habitat areas in good and optimum grades (Figure 11). These trends further indicate that anthropogenic disturbances pose a great threat to habitat suitability for waterbirds. Therefore, effective regulations and local management are required to improve natural ecosystems and waterbird habitats.

5. Conclusions

Habitat suitability for waterbirds is impacted by land cover type. In this paper, we examined land cover changes, and conducted an assessment of changes to habitat suitability for waterbirds by developing a HSI model driven by remote sensing data. As estimated, habitats with optimum and good grades decreased in the area by ~10.31%, while habitat areas with general and poor grades expanded by 590,531 and 464,233 km2 from 2000 to 2015, respectively. Wetland loss and degradation resulting from agricultural cultivation and social-economic developments have led to the decline in suitable habitat areas for waterbirds in the WSP. The threat of anthropogenic disturbances to habitat suitability for waterbirds in the five NNRs was no exception. The findings of this study are expected to help in protecting waterbirds, and developing scientific policies or decisions for sustainable ecosystem management.

Author Contributions

All authors have contributed substantially and uniquely to the work reported. Y.T. and D.M. conceived and designed the research and Y.T. processed the data, and wrote the manuscript draft. Z.W. and L.L. helped to design the framework of this research and reviewed the manuscript. M.L. and C.L. analyzed the data; M.J. contributed socioeconomic materials. M.L. contributed to the meteorological data. Y.T. and W.M. took part in the field data collection.

Funding

This study was jointly supported by the National Key R&D Program of China (2016YFA0602301, 2016YFC0500201, and 2016YFC0500408), the National Natural Science Foundation of China (41771383), and the funding from Youth Innovation Promotion Association, Chinese Academy of Sciences (2017277, 2012178).

Acknowledgments

The remote sensing data were provided by NASA (National Aeronautics and Space Administration) and USGS (United States Geological Survey). The socioeconomic data were provided by NBSC (National Bureau of Statistics of China). The meteorological data were provided by the China Meteorological Data Sharing Service System. In addition, we are grateful to the anonymous reviewers and editors of the journal for their valuable comments which helped to improve the quality of the original submission.

Conflicts of Interest

The authors declare no conflict of interest.

References

  1. Jrw, R.; Colloff, M.J.; Arthur, A.D.; Mcginness, H.M. Influence of Catchment Condition and water resource development on waterbird assemblages in the Murray-Darling Basin, Australia. Biol. Conserv. 2013, 165, 25–34. [Google Scholar]
  2. Cumming, G.S.; Paxton, M.; King, J.; Beuster, H. Foraging guild membership explains variation in waterbird responses to the hydrological regime of an arid-region flood-pulse river in Namibia. Freshw. Biol. 2012, 57, 1202–1213. [Google Scholar] [CrossRef]
  3. Brook, B.W.; Sodhi, N.S.; Bradshaw, C.J.A. Synergies among extinction drivers under global change. Trends Ecol. Evol. 2008, 23, 453–460. [Google Scholar] [CrossRef] [PubMed]
  4. Cardador, L.; Cáceres, M.D.; Giralt, D.; Bota, G.; Aquilué, N.; Arroyo, B.; Mougeot, F.; Cantero-Martínez, C.; Viladomiu, L.; Rosell, J. Tools for exploring habitat suitability for steppe birds under land use change scenarios. Agric. Ecosyst. Environ. 2015, 200, 119–125. [Google Scholar] [CrossRef] [Green Version]
  5. Naeem, S.; Zavaleta, E. The functions of biological diversity in an age of extinction. Science 2012, 336, 1401–1406. [Google Scholar] [CrossRef] [PubMed]
  6. Rolland, V.; Hostetler, J.A.; Hines, T.C.; Johnson, F.A.; Percival, H.F.; Oli, M.K. Effects of harvest and climate on population dynamics of northern bobwhites in south Florida. Wildl. Res. 2011, 38, 396–407. [Google Scholar] [CrossRef]
  7. Zhang, Y.; Wang, Z.; Ren, C.; Yu, H.; Dong, Z.; Lu, C.; Mao, D. Changes in habitat suitability for waterbirds of the Momoge Nature Reserve of China during 1990–2014. J. Environ. Eng. Landsc. Manag. 2017, 25, 367–378. [Google Scholar] [CrossRef]
  8. Tang, X.; Li, H.; Xu, X.; Yang, G.; Liu, G.; Li, X.; Chen, D. Changing land use and its impact on the habitat suitability for wintering Anseriformes in China’s Poyang Lake region. Sci. Total Environ. 2016, 557–558, 296–306. [Google Scholar] [CrossRef] [PubMed]
  9. Bradley, B.A.; Olsson, A.D.; Wang, O.; Dickson, B.G.; Pelech, L.; Sesnie, S.E.; Zachmann, L.J. Species detection vs. habitat suitability: Are we biasing habitat suitability models with remotely sensed data? Ecol. Model. 2012, 244, 57–64. [Google Scholar] [CrossRef]
  10. Seoane, J.; Justribó, J.H.; García, F.; Retamar, J.; Rabadán, C.; Atienza, J.C. Habitat-suitability modelling to assess the effects of land-use changes on Dupont’s lark Chersophilus duponti: A case study in the Layna Important Bird Area. Biol. Conserv. 2005, 128, 241–252. [Google Scholar] [CrossRef]
  11. Torres, R.; Gasparri, N.I.; Blendinger, P.G.; Grau, H.R. Land-use and land-cover effects on regional biodiversity distribution in a subtropical dry forest: A hierarchical integrative multi-taxa study. Reg. Environ. Chang. 2014, 14, 1549–1561. [Google Scholar] [CrossRef]
  12. Bolca, M.; Turkyilmaz, B.; Kurucu, Y.; Altinbas, U.; Esetlili, M.T.; Gulgun, B. Determination of impact of urbanization on agricultural land and wetland land use in in Balçovas’ Delta by remote sensing and GIS technique. Environ. Monit. Assess. 2007, 131, 409–419. [Google Scholar] [CrossRef] [PubMed]
  13. Zou, Y.; Wang, L.; Xue, Z.; Mingju, E.; Jiang, M.; Lu, X.; Yang, S.; Shen, X.; Liu, Z.; Sun, G. Impacts of Agricultural and Reclamation Practices on Wetlands in the Amur River Basin, Northeastern China. Wetlands 2017, 38, 383–389. [Google Scholar] [CrossRef]
  14. Brandis, K.J.; Bino, G.; Spencer, J.A.; Ramp, D.; Kingsford, R.T. Decline in colonial waterbird breeding highlights loss of Ramsar wetland function. Biol. Conserv. 2018, 225, 22–30. [Google Scholar] [CrossRef]
  15. Krivtsov, V. Investigations of indirect relationships in ecology and environmental sciences: A review and the implications for comparative theoretical ecosystem analysis. Ecol. Model. 2004, 174, 37–54. [Google Scholar] [CrossRef]
  16. Store, R.; Jokimäki, J. A GIS-based multi-scale approach to habitat suitability modeling. Ecol. Model. 2003, 169, 1–15. [Google Scholar] [CrossRef]
  17. Wang, X.D.; Zhong, X.H.; Liu, S.Z.; Liu, J.G.; Wang, Z.Y.; Li, M.H. Regional assessment of environmental vulnerability in the Tibetan Plateau: Development and application of a new method. J. Arid. Environ. 2008, 72, 1929–1939. [Google Scholar] [CrossRef]
  18. Lu, C.Y.; Gu, W.; Dai, A.H.; Wei, H.Y. Assessing habitat suitability based on geographic information system (GIS) and fuzzy: A case study of Schisandra sphenanthera Rehd. et Wils. in Qinling Mountains, China. Ecol. Model. 2012, 242, 105–115. [Google Scholar] [CrossRef]
  19. Tian, Y.; Luo, L.; Mao, D.; Wang, Z.; Li, L.; Liang, J. Using Landsat images to quantify different human threats to the Shuangtai Estuary Ramsar site, China. Ocean Coast. Manag. 2017, 135, 56–64. [Google Scholar] [CrossRef]
  20. Rhew, I.C.; Vander, S.A.; Kearney, A.; Smith, N.L.; Dunbar, M.D. Validation of the normalized difference vegetation index as a measure of neighborhood greenness. Ann. Epidemiol. 2011, 21, 946–952. [Google Scholar] [CrossRef] [PubMed]
  21. Dong, Z.; Wang, Z.; Liu, D.; Li, L.; Ren, C.; Tang, X.; Jia, M.; Liu, C. Assessment of habitat suitability for waterbirds in the West Songnen Plain, China, using remote sensing and GIS. Ecol. Eng. 2013, 55, 94–100. [Google Scholar] [CrossRef]
  22. Osborne, P.E.; Alonso, J.C.; Bryant, R.G. Modelling Landscape-Scale Habitat Use Using GIS and Remote Sensing: A Case Study with Great Bustards. J. Appl. Ecol. 2001, 38, 458–471. [Google Scholar] [CrossRef]
  23. Vasconcelos, R.P.; Pape, O.L.; Costa, M.J.; Cabral, H.N. Predicting estuarine use patterns of juvenile fish with Generalized Linear Models. Estuar. Coast. Shelf Sci. 2013, 120, 64–74. [Google Scholar] [CrossRef]
  24. Strubbe, D.; Broennimann, O. Niche conservatism in non-native birds in Europe: Niche unfilling rather than niche expansion. Glob. Ecol. Biogeogr. 2013, 22, 962–970. [Google Scholar] [CrossRef]
  25. Cardador, L.; De Caceres, M.; Bota, G.; Giralt, D.; Casas, F.; Arroyo, B.; Mougeot, F.; Cantero-Martinez, C.; Moncunill, J.; Butler, S.J.; et al. A resource-based modelling framework to assess habitat suitability for steppe birds in semiarid Mediterranean agricultural systems. PLoS ONE 2014, 9, e92790. [Google Scholar] [CrossRef] [PubMed]
  26. Reza, M.I.H.; Abdullah, S.A.; Nor, S.B.M.; Ismail, M.H. Integrating GIS and expert judgment in a multi-criteria analysis to map and develop a habitat suitability index: A case study of large mammals on the Malayan Peninsula. Ecol. Indic. 2013, 34, 149–158. [Google Scholar] [CrossRef]
  27. Wang, Z.; Mao, D.; Li, L.; Jia, M.; Dong, Z.; Miao, Z.; Ren, C.; Song, C. Quantifying changes in multiple ecosystem services during 1992–2012 in the Sanjiang Plain of China. Sci. Total Environ. 2015, 514, 119–130. [Google Scholar] [CrossRef] [PubMed]
  28. Yong, D.L.; Jain, A.; Liu, Y.; Iqbal, M.; Choi, C.Y.; Crockford, N.J.; Millington, S.; Provencher, J. Challenges and opportunities for transboundary conservation of migratory birds in the East Asian-Australasian flyway. Conserv. Biol. 2017, 32, 740–743. [Google Scholar] [CrossRef] [PubMed]
  29. Zhou, L.; Xue, W.; Zhu, S.; Shan, K.; Chen, J. Foraging habitat use of oriental white stork (Ciconia boyciana) recently breeding in China. Zool. Sci. 2013, 30, 559. [Google Scholar] [CrossRef] [PubMed]
  30. Wang, Z.; Huang, N.; Luo, L.; Li, X.; Ren, C.; Song, K.; Chen, J.M. Shrinkage and fragmentation of marshes in the West Songnen Plain, China, from 1954 to 2008 and its possible causes. Int. J. Appl. Earth Obs. Geoinf. 2011, 13, 477–486. [Google Scholar] [CrossRef]
  31. Wang, Z.; Song, K.; Zhang, B.; Liu, D.; Ren, C.; Luo, L.; Yang, T.; Huang, N.; Hu, L.; Yang, H.; et al. Shrinkage and fragmentation of grasslands in the West Songnen Plain, China. Agric. Ecosyst. Environ. 2009, 129, 315–324. [Google Scholar] [CrossRef]
  32. Ceccarelli, T.; Smiraglia, D.; Bajocco, S.; Rinaldo, S.; Angelis, A.D.; Salvati, L.; Perini, L. Land cover data from Landsat single-date imagery: An approach integrating pixel-based and object-based classifiers. Eur. J. Remote Sens. 2013, 46, 699–717. [Google Scholar] [CrossRef]
  33. Frohn, R.C.; Autrey, B.C.; Lane, C.R.; Reif, M. Segmentation and object-oriented classification of wetlands in a karst Florida landscape using multi-season Landsat-7 ETM+ imagery. Int. J. Remote Sens. 2011, 32, 1471–1489. [Google Scholar] [CrossRef]
  34. Vieira, M.A.; Formaggio, A.R.; Rennó, C.D.; Atzberger, C.; Aguiar, D.A.; Mello, M.P. Object Based Image Analysis and Data Mining applied to a remotely sensed Landsat time-series to map sugarcane over large areas. Remote Sens. Environ. 2012, 123, 553–562. [Google Scholar] [CrossRef]
  35. Carleer, A.P. Comparison of very high spatial resolution satellite image segmentations. Photogramm. Eng. Remote Sens. 2015, 5238, 1285–1294. [Google Scholar]
  36. Jia, M.; Wang, Z.; Li, L.; Song, K.; Ren, C.; Liu, B.; Mao, D. Mapping China’s mangroves based on an object-oriented classification of Landsat imagery. Wetlands 2014, 34, 277–283. [Google Scholar] [CrossRef]
  37. Matchett, E.L.; Fleskes, J.P. Projected Impacts of Climate, Urbanization, Water Management, and Wetland Restoration on Waterbird Habitat in California’s Central Valley. PLoS ONE 2017, 12, e0169780. [Google Scholar] [CrossRef] [PubMed]
  38. Xia, S.; Liu, Y.; Chen, B.; Jia, Y.; Zhang, H.; Liu, G.; Yu, X. Effect of water level fluctuations on wintering goose abundance in Poyang Lake wetlands of China. Chin. Geogr. Sci. 2016, 27, 248–258. [Google Scholar] [CrossRef]
  39. Wilson, E.H.; Sader, S.A. Detection of forest harvest type using multiple dates of Landsat TM imagery. Remote Sens. Environ. 2002, 80, 385–396. [Google Scholar] [CrossRef]
  40. Tang, Z.; Fang, J.; Sun, J.; Gaston, K.J. Effectiveness of Protected Areas in Maintaining Plant Production. PLoS ONE 2011, 6, e19116. [Google Scholar] [CrossRef] [PubMed]
  41. Brotons, L.; Thuiller, W.; Araújo, M.B.; Hirzel, A.H. Presence-absence versus presence-only modelling methods for predicting bird habitat suitability. Ecography 2004, 27, 437–448. [Google Scholar] [CrossRef]
  42. Ludwig, D.F.; Iannuzzi, T.J. Habitat equivalency in urban estuaries: An analytical hierarchy process for planning ecological restoration. Urban Ecosyst. 2006, 9, 265–290. [Google Scholar] [CrossRef]
  43. Wang, Y.; Huang, F. Identification and analysis of ecosystem functional types in the west of Songnen Plain, China, based on moderate resolution imaging spectroradiometer data. J. Appl. Remote Sens. 2015, 9, 096096. [Google Scholar] [CrossRef]
  44. Mcdonald, A.J.; Gemmell, F.M.; Lewis, P.E. Investigation of the Utility of Spectral Vegetation Indices for Determining Information on Coniferous Forests. Remote Sens. Environ. 1998, 66, 250–272. [Google Scholar] [CrossRef]
  45. Dong, Z.; Wang, Z.; Yang, X. Changes in Suitable Waterbirds’ Habitats from 1990 to 2010 in the Bielahong Watershed of Northeast China. J. Indian Soc. Remote Sens. 2015, 43, 599–607. [Google Scholar] [CrossRef]
  46. Carvalho, D.; Horta, P.; Raposeira, H.; Santos, M.; Luís, A.; Cabral, J.A. How do hydrological and climatic conditions influence the diversity and behavioural trends of water birds in small Mediterranean reservoirs? A community-level modelling approach. Ecol. Model. 2013, 257, 80–87. [Google Scholar] [CrossRef]
  47. Withey, P.; van Kooten, G.C. The effect of climate change on optimal wetlands and waterfowl management in Western Canada. Ecol. Econ. 2011, 70, 798–805. [Google Scholar] [CrossRef]
  48. Lesmerises, F.; Dussault, C.; St-Laurent, M.-H. Wolf habitat selection is shaped by human activities in a highly managed boreal forest. For. Ecol. Manag. 2012, 276, 125–131. [Google Scholar] [CrossRef]
  49. Xiaofeng, L.; Yi, Q.; Diqiang, L.; Shirong, L.; Xiulei, W.; Bo, W.; Chunquan, Z. Habitat evaluation of wild Amur tiger (Panthera tigris altaica) and conservation priority setting in north-eastern China. J. Environ. Manag. 2011, 92, 31–42. [Google Scholar] [CrossRef] [PubMed]
  50. Lu, C.; Wang, Z.; Li, L.; Wu, P.; Mao, D.; Jia, M.; Dong, Z. Assessing the conservation effectiveness of wetland protected areas in Northeast China. Wetl. Ecol. Manag. 2016, 24, 1–18. [Google Scholar] [CrossRef]
Figure 1. Location of the WSP (West Songnen Plain).
Sustainability 11 01552 g001
Figure 2. The seasonality of precipitation and temperature in the WSP.
Sustainability 11 01552 g002
Figure 3. Overview of the research approach.
Sustainability 11 01552 g003
Figure 4. The spatial distribution and changes in land cover over the WSP in 2000 and 2015. (a) Spatial distribution of land cover types in 2000 and 2015. (b) Decreased (left) and increased (right) land cover from 2000 to 2015.
Sustainability 11 01552 g004
Figure 5. Area contribution of net conversions to changes in main land cover types during 2000–2015.
Sustainability 11 01552 g005
Figure 6. Spatial distribution of factors affecting habitat suitability for waterbirds in 2000 and 2015. (a) Water situation; (b) Food availability; (c) Shelter safety; (d) Human disturbance; (e) Spatial pattern of factors gave the lowest contributions to the HSI (Habitat suitability index); and (f) Spatial pattern of factors gave the highest contributions to the HSI.
Sustainability 11 01552 g006
Figure 7. Spatial distribution maps of habitat suitability for waterbirds over the WSP in 2000 and 2015.
Sustainability 11 01552 g007
Figure 8. Contribution of factors to deteriorate in HSI during 2000–2015.
Sustainability 11 01552 g008
Figure 9. Comparison of habitat suitability mapping in 2000 and 2015 for five NNRs in the WSP. The histogram shows areas of each habitat suitability grade for waterbirds in 2000 and 2015, in Zhalong, Momoge, Chagan Lake, Xianghai, and Dabusu NNRs (NNRs: National Nature Reserves).
Sustainability 11 01552 g009
Figure 10. Climatic changes in the WSP during 2000–2015.
Sustainability 11 01552 g010
Figure 11. The change rate of socio-economic development and HSI in the WSP from 2000 to 2015. (a) Gross domestic product; (b) Total population; (c) Secondary industry production; (d) Habitat area in optimum and good grade; (e) Habitat area in general and poor grade.
Sustainability 11 01552 g011
Table 1. (a) Confusion matrices of natural land cover types in the WSP (West Songnen Plain); (b) Confusion matrices of anthropogenic land cover types in the WSP.
(a)
Ground TruthClassification Results
WoodlandWetlandGrasslandWater BodyBarren LandCroplandBuilt-Up LandTotal
Woodland3920004045
Wetland0802403089
Grassland3658030070
Water body0405600060
Barren land0020360442
Total429262603974306
User accuracy92.86%86.96%93.55%93.33%92.31%---
Producer Accuracy86.67%89.89%82.86%93.33%85.71%---
Overall accuracy 87.91% Kappa = 0.85
(b)
Ground TruthClassification Results
WoodlandWetlandGrasslandWater BodyBarren LandCroplandBuilt-Up LandTotal
Cropland0030069375
Built-up land0000304548
Total003036948123
User accuracy-----100.00%93.75%-
Producer Accuracy-----92.00%93.75%-
Overall accuracy 92.68% Kappa = 0.86
Table 2. Areas and changes in seven land covers from 2000 to 2015 (km2, with percentage).
Land CoverTotal Area2000–2015 Change
20002015Change AreaChange Rate
Woodland4010.50 4192.98 182.48 4.55%
(3.95%)(4.13%)
Grassland10,676.18 9740.72 −935.46 −8.76%
(10.51%)(9.59%)
Wetland10,783.84 9649.76 −1134.07 −10.52%
(10.62%)(9.50%)
Water body5179.59 5223.09 43.50 0.84%
(5.10%)(5.14%)
Barren land2715.642738.6823.040.85%
(2.67%)(2.70%)
Cropland63,658.62 65,123.21 1464.58 2.30%
(62.69%)(64.13%)
Built-up land4524.214880.16355.95 7.87%
(4.46%)(4.81%)
Table 3. Factor weights for habitat suitability for waterbirds in the WSP.
Objective LevelCriterion LevelIndex Level
Factors1 WeightsIndicators2 Weights
Habitat suitability analysis in the WSPWater situation0.3Density of hydrographic net0.65
NDMI0.35
Human disturbance0.2Density of road0.35
Density of settlement0.5
Density of industrial land0.15
Food availability0.3NDVI1
Shelter safety0.2The land cover type0.75
Slope0.25
1 Weights in criterion level are proxies of importance for these typical environmental factors to objective level. 2 Weights in index level are proxies of importance for these indicators in index level to factors in criterion level.
Table 4. The area (km2) and change in each grade of habitat suitability for waterbirds in 2000 and 2015.
HSIArea (km2)2000–2015 Change2000–2015 Net Conversion Area (km2)
20002015Change Area (km2)Change RatePoorGeneralGoodOptimum
Poor9678.9914,321.334642.3347.96%----
9.47%14.01%
General40,519.4646,424.775905.3114.57%4220.75---
39.65%45.42%
Good38,671.6735,331.3−3340.37−8.64%364.74 9467.45--
37.84%34.57%
Optimum13,327.656132.25−7195.41−53.99%55.68 651.916487.87-
13.04%6.00%
Table 5. The total area (km2) and change rate in each suitability grade at the five NNRs in 2000 and 2015 (NNR: National Nature Reserve).
HSIArea (km2)2000–2015 Change
20002015Change Area (km2)Change Rate
Poor23,76844,75620,98888.30%
4.41%8.30%
General67,104681.5110471.56%
12.44%12.64%
Good177,095220,89443824.73%
32.84%40.96%
Optimum271,336205,496−6584−24.27%
50.31%38.10%

