Article

A Hybrid Multi-Criteria Decision-Making Model for Evaluating Companies’ Green Credit Rating

1
Department of Finance, Ling Tung University, Taichung 40852, Taiwan
2
Department of Agronomy, National Chung Hsing University, Taichung 40227, Taiwan
*
Author to whom correspondence should be addressed.
These authors contributed equally to this work.
Sustainability 2019, 11(6), 1506; https://doi.org/10.3390/su11061506
Submission received: 17 January 2019 / Revised: 28 February 2019 / Accepted: 6 March 2019 / Published: 13 March 2019
(This article belongs to the Section Economic and Business Aspects of Sustainability)

Abstract

:
Along with economic development and social progress, environmental issues are increasingly becoming the subject of public concern. Through green credit, banks intentionally direct money into resource-conserving technology development and environmental protection industries, thus, encouraging enterprises to focus on green products. Therefore, establishing a reasonable green credit evaluation mechanism for banks is an important issue. Based on this, this study combines grey relational analysis (GRA), the Decision-Making Trial and Evaluation Laboratory technique (DEMATEL), analytic network process (ANP) and the Technique for Order of Preference by Similarity to Ideal Solution (TOPSIS) to develop a hybrid multi-criteria decision-making (MCDM) model for quantifying data and, thereby, to establish a green credit rating mechanism. In order to verify the model, this study combines credit risk and economic, environmental and social performance evaluation criteria as green credit evaluation criteria. There are 55 high-tech listed companies in Taiwan in 2014 taken as the evaluation objects and conducted for a performance ranking. The empirical results can serve as a reference for financial authorities promoting green finance policies and for investors making investment decisions.

1. Introduction

In recent years, the concept of green sustainable development has been widely considered as an important issue in the world, and the economic orientation has gradually been replaced by the green. Economic transformation and upgrading require financial cooperation and support. Therefore, with green credit as the core, green finance has rapidly accelerated. Financial institutions use green credit as a way to drive economic transformation, are able to effectively resist environmental and social risks and can help transform into a green economy. For a long time, Taiwan’s economic development has been at the expense of the environment, the overexploitation of land and natural resources, the ruthless destruction of ecosystems and the increasingly serious environmental pollution, which ultimately limits the continued development of the economy. In recent years, with the increasing global consensus on the development of green finance, Taiwan’s green finance started relatively late compared to other countries. Although the government emphasizes the development of green finance, it has no specific results. Therefore, since 2015, Taiwan’s commercial banks have incorporated the green credit into their credit policy for the first time. However, there is a lack of evaluation criteria and evaluation methods for green credit. For Taiwan, establishing a suitable green credit decision-making model is an urgent task. Therefore, the main purpose of this study is to establish a set of credit criteria for green credit and to conduct green credit evaluations and ranking with the proposed modified hybrid multi-criteria decision-making (MCDM) model. The results can be provided to the banking industry as a reference for corporate green credit assessment.
A credit rating is one of the most commonly used methods to assess the creditworthiness of a company. Traditional credit assessment methods do not consider that environmental and climate change may affect a company’s credit risk assessment. These factors could lead to a potential impact on a bank’s overall loan risk profile, and thus, traditional methods are not conducive to the development of green finance and green economy. Therefore, establishing a green credit rating model for commercial banks to determine lending policies is an important problem faced by financial institutions.
Traditionally, the banks investigate a company’s financial situation and determines their credit rating. That is, they evaluate the performance of a company through a financial ratio analysis and use this analysis to measure the degree of credit risk. Eccles and Pyburn [1] argued that financial indicators play an important role in measuring company performance, but putting too much emphasis on financial performance also has its disadvantages. Traditional credit rating techniques emphasize the importance of financial indicators but do not include social and environmental factors. Adding these two types of indicators can result in great differences in the credit assessment of companies. Therefore, Weber et al. [2] indicated that financial institutions in Germany integrate corporate environmental performance into the credit risk rating process, and by incorporating sustainability indicators, a bank’s risk management becomes more efficient.
In the 1990s, the concept of sustainable development gradually penetrated in various fields. Driven by environmental protection concepts, the financial industry and the concept of sustainable development became closely related. Based on the close relationship between the financial industry and business operations, the financial industry needs to pay attention to investment projects or whether the project complies with environmental protection policies in the credit decision-making process to avoid financial losses caused by environmental risks.
Green credit has gradually become a trend in most countries and has received more and more support and attention from financial institutions. Among them, “Equator Principles” have become one of the most well-known guidelines for banks. In the June 2013 version of the third version of the Equator Principles, there are 10 Equator Principles (see Appendix A). The Equator Principles require that commercial banks address environmental and social risks in project financing and emphasize the harmonious unity between a company’s environmental protection, social development and economic development. It is a financial industry benchmark for determining, assessing and managing environmental and social risks in projects. Therefore, commercial banks have transformed the operating target of “maximizing shareholder value” into “full consideration to the demands of multi-stakeholder” development. On the Equator Principles website (https://equator-principles.com/), 94 financial institutions in 37 countries have adopted the Equator Principles as a reference for the green credit assessment guidelines. Since 2017, only four banks, including Cathay United Bank Co., Ltd., Taipei, Taiwan; CTBC Bank Co., Ltd., Taipei, Taiwan; E. SUN Commercial Bank, Ltd., Taipei, Taiwan; and Taipei Fubon Commercial Bank have adopted the Equator Principles as a reference for green credit evaluation. In terms of green finance, it has fallen far behind other countries and must catch up. Therefore, for the banking industry, a comprehensive set of green credit assessment criteria and evaluation is urgently needed.
The principles of sustainable development encompass the triple bottom line of thinking—economic, environmental and social aspects. With the development of risk management frameworks such as the Global Reporting Initiative (GRI) Standards and the Equator Principles, the global economy is gradually leading a shift to sustainable development. Through the implementation of green credit, the banking industry guides the flow of funds and resource allocation and achieves sustainable development under the premise of the triple bottom line of the environment, society and economy. Therefore, green credit requires commercial banks to take a “triple bottom line” approach to managing business. That is, commercial banks not only do business to meet the needs of partners but also realize that their behavior must consider society and the environment. When a bank makes a green credit assessment of a company, a number of evaluation criteria must be considered comprehensively. Therefore, the green credit assessment for companies is a MCDM problem.
In previous studies, different MCDM methods have been used in the credit rating decision analysis. Past works have mainly focused on evaluating the financial performance of a company. Rather than using just a single financial ratio, performance evaluation methods have begun to combine patterns of financial indicators and nonfinancial indicators to comprehensively evaluate company performance. Currently, the MCDM method is widely used in evaluating and ranking problems [3,4,5,6].
Lots of MCDM techniques are available in the literature. However, policy makers do not have a specific rule for choosing techniques. This is because different MCDM methods are suited to solving different kinds of problems. In recent years, a hybrid MCDM model combining the Decision-Making Trial and Evaluation Laboratory technique (DEMATEL) with the analytic network process (ANP) and VlseKriterijumska Optimizacija I Kompromisno Resenje (VIKOR) (or Technique for Order of Preference by Similarity to Ideal Solution (TOPSIS)) methods has been widely used in multi-criteria decisions [7,8,9,10]. However, while the above method is suitable for the qualitative analysis of questionnaire data, it cannot be applied to quantitative data. Therefore, this study proposes a modified hybrid MCDM model for quantitative data analysis and applies it to assess banks’ green credit decision analyses.
The aim of this study is to establish a suitable modified hybrid MCDM model that can be used for quantitative data analysis. First, the grey relational analysis (GRA) in grey theory is employed here to measure the degree of correlation between the indicators. Then, we use the DEMATEL method to establish a system structure model. Next, ANP is used to obtain criteria weights. Finally, the TOPSIS method is used for the green credit assessment and to determine the ranking of the companies. According to the abovementioned approach, this study establishes a green credit evaluation model for banks. However, there is always a risk in the evaluation of a model. In order to help reduce this risk, a sensitivity analysis of the model parameters is conducted in this study.
In the past few decades, the electronics industry was an important growth engine for the Taiwanese economy. Taiwan’s electronics industry is a high-tech, high-value-added and capital-intensive industry. It plays an important role in the production process (OEM/ODM) of the global electronics industry supply chain system. Manufacturing processes in the electronics industry consume energy and produce pollution. Moreover, production processes are often accompanied by toxic contamination as well as a high consumption of water and energy. The 1997 Kyoto Protocol focuses on the issue of environmental protection, including governments’ environmental policies and companies’ business strategies, and certain measures must be taken in response. In terms of environmental policy, due to stricter waste emissions standards, many companies face restrictions in production that affect production and production scheduling. Therefore, issues of environmental protection must be considered to maintain business continuity.
In the 21st century, green credit is an important economical means of controlling pollution and protecting the environment. Thus, this type of credit has become an inevitable trend in the future development of banks. In the process of bank financing of companies, an emphasis is placed on environmental protection and ecological environmental governance by directing social and economic resources that can promote the sustainable development of society. A bank can guide social capital flows, prompt companies to take measures to reduce environmental pollution and tap into new energy social, thereby changing social and economic development. Green credit is an important trend in the development of modern finance and is also an effective way for banking financial institutions to fulfill their social responsibility.
Therefore, this study uses Taiwan’s listed electronics companies as the research object to evaluate banks’ work on green credit and to confirm the feasibility of the proposed hybrid MCDM model. The results can be used as a reference for banks in green credit decision-making and for approving companies’ loans. The evaluation procedure of this study consists of several steps as shown in Figure 1.

2. Literature Review

2.1. Previous Studies on the Company’s Credit Evaluation

Green credit refers to the financial institutions in the decision-making process of financing based on a consideration of potential environmental impacts. With the integration of environmental and ecological factors in the credit decision-making systems of banks by focusing on issues of environmental protection and ecology, companies produce high environmental and social benefits, thus supporting the long term development of banks’ credit business.
In previous studies of banks’ credit assessment of companies, many works have emphasized companies’ financial operating performances as a basis for credit decision-making. In recent years, for example, Hsu [11] combined financial ratio variables and the risk-adjusted rate of return on capital (RAROC) as the evaluation criteria and developed a financial performance evaluation model. Bulgurcu [12] applied TOPSIS to evaluate the financial performance of firms in the Turkish automotive industry. Ghadikolaei and Esbouei [13] used the Fuzzy Analytic Hierarchy Process (FAHP), Fuzzy VIKOR, Fuzzy Additive Ratio Assessment (ARAS-F) and Fuzzy Complex Proportional Assessment (Fuzzy COPRAS) to establish a hierarchical financial performance evaluation model. Ghadikolaei et al. [14] conducted FANP and Fuzzy VIKOR rankings of companies based on their financial performance. Moghimi and Anvari [15] used FAHP and the TOPSIS method, along with data from their financial tables and the subsequent ranking of companies. Wang [16] integrated a grey relational analysis and Fuzzy TOPSIS to evaluate financial performance.
A study of green credit by Weber et al. [2] found that the sustainability of a company, as part of its financial performance, influences its creditworthiness. Sun and Wu [17] found that the green credit policy was as likely to increase economic growth as it was to do harm to it. Li [18] designed indicators of environmental credit assessment and built an AHP model for the environmental credit assessment of companies. Xu [19] constructed a Mamlquist green credit growth index to assess the comprehensive productivity performance of the banking and financial industry in China.

2.2. The Application of Hybrid MCDM Methods

A bank’s green credit rating of companies is a multi-criteria decision-making problem. The main characteristics of a multi-criteria decision making model are the ability to evaluate multiple attributes, selections and rankings. Different multi-criteria decision making techniques have been developed, each with its own advantages and disadvantages [20]. In recent years, a hybrid MCDM model has been widely used in various fields. The most common hybrid MCDM model uses the VIKOR (TOPSIS) technique based on DEMATEL and ANP to solve the problem of conflicting criteria. As part of this hybrid model, the DEMATEL technique used a questionnaire survey as a tool of analysis, and investigated the relationships and strengths among assessment criteria. The DANP (DEMATEL-based ANP) method was used to determine the relative weights of the assessment criteria. Finally, VIKOR (TOPSIS) was used to obtain the final ranking of alternatives.
Recently, the hybrid MCDM model was successfully applied in the field of evaluation and selection. Büyüközkan and Çifçi [21] integrated fuzzy DEMATEL, fuzzy ANP and fuzzy TOPSIS to evaluate green suppliers. Ou Yang et al. [22] combined VIKOR, DEMATEL and ANP to evaluate the risk controls. Alimardani et al. [8] established a novel hybrid MCDM model including DEMATEL, ANP and TOPSIS for agile supply chains. Alam-Tabriz et al. [7] combined DEMATEL, ANP and TOPSIS to solve a supplier selection problem. Kuan and Chen [9] combined DEMATEL, ANP and VIKOR to evaluate the technological innovation capabilities of enterprises. Shen et al. [10] used DEMATEL, ANP and VIKOR for glamor stock selection.
Both the TOPSIS and VIKOR methods are suitable for solving decision making problems. However, TOPSIS is one of the most popular and well-known decision-making methods [23,24,25]. Therefore, this study combines the DEMATEL, ANP and TOPSIS methods for evaluating the green credit rating of companies.

3. Methodology

3.1. Sample Selection

In stakeholder theory, in order to achieve sustainable development objectives, enterprises need stakeholders’ support and recognition. Therefore, enterprises should take the initiative to share the burden of social responsibility. The corporate social responsibility (CSR) is a combination of social responsibility and business strategy which can effectively enhance a company’s future competitiveness and is also the source of the company’s future competitiveness. Currently in Taiwan, the only media assessment mechanisms for corporate social responsibility are CommonWealth Magazine’s “Corporate Citizenship Awards” and Global Views Monthly’s “Corporate Social Responsibility Award”. Among the winning companies, high-tech industry companies are the largest winners. However, the environmental impact of the high-tech electronics industry is not less than that of traditional industries. Moreover when it comes to the use of energy, resources, chemicals and heavy metals, the high-tech industry is worse. Therefore, this study examines green credit by researching the high-tech industry in Taiwan.
A CSR report gives the main, central idea of how a company can achieve sustainable development. This kind of report also mainstreams the nonfinancial performance information disclosure of companies worldwide. However, Taiwan’s law does not require a company to publish a corporate social responsibility report and disclosure. Therefore, there are not many CSR reports in Taiwan [26]. This study uses the “Industrial Sustainable Development Clearinghouse” web site (https://proj.ftis.org.tw/isdn/Report) to assess Taiwan’s high-tech industry-listed companies that have voluntarily disclosed CSR reports as the research object. After excluding companies with incomplete data, we selected 55 of Taiwan’s high-tech industry-listed companies in 2014 as the research sample.

3.2. The Evaluation Criteria for Green Credit Policy

For the purpose of providing a comprehensive assessment of the companies’ green credit rating, this study covers financial and nonfinancial (such as credit risk, business growth, corporate social responsibility and environmental protection) performance assessment criteria and uses a triple bottom line (TBL) framework as the evaluation criteria. Therefore, as described below, this study selects companies’ credit risk and economic, social and environmental performance criteria as the assessment criteria for green credit rating based on the previous literature and TBL. Thus, a framework was proposed for the identification of the evaluation criteria and for ranking the green credit of companies, as given in Figure 2. The description of the evaluation criteria are as follows.

3.2.1. Credit Risk Evaluation Criteria

The big three credit rating agencies are S&P, Moody’s and Fitch Ratings; in Taiwan, Taiwan Ratings and Taiwan Corporate Credit Risk Index (TCRI) provide credit ratings for financial institutions. Moreover, in Taiwan, the Taiwan Economic Journal reports on companies’ overall risk assessment and offers a corporate credit risk indicator database. A company’s credit risk is given a credit score from 1–10: the larger the number, the higher the level of credit risk. If the level is 10, it means that the company has closed down on risk. Based on the recommendations of previous studies [27,28,29], this study uses TCRI as a measure of companies’ credit risks.

3.2.2. Economic Performance Indicators

The CEO of VanCity mentioned that when a corporation considers business strategy and corporate development, TBL should be defined as the financial, social and environmental performance [30]. However, though a company’s economic performance includes its financial performance, in order to fully reflect the impact of business on the economy, many researchers [31,32,33] have suggested considering both the financial and nonfinancial performances. Therefore, in this study, economic performance is measured by using financial and nonfinancial performance indicators.
Different industries have different performance indicators. Based on a previous work [34], this study adopts financial ratios as financial performance evaluation indicators, which are grouped into three categories: operating ability, solvency and profitability, with 21 financial ratios. Operating ability includes the total asset turnover ratio, accounts receivable turnover, inventory turnover, fixed asset turnover, turnover of net worth, days-A/R turnover and days-inventory turnover. Solvency includes the cash flow adequacy ratio, cash reinvestment ratio, current ratio, quick ratio, long-term capital ratio, times interest earned, operation income/capital, and pretax income/capital. Profitability includes the return on assets, return on equity, profit margin, operating margin, net profit margin and earnings per share. The descriptions of the 21 financial indicators on the three categories are listed in Table 1.
We also consider nonfinancial performance measures, such as measures for risk and innovation capacity. In this study, we adopt risk measurement, including the degree of operating leverage (DOL), the degree of financial leverage (DFL) and RAROC, and the innovation capacity, including research and design (R&D) expenditure and total sales, as indicators to evaluate nonfinancial performance [11,35].

3.2.3. Social Performance Indicators

Sustainable development issues focus on the environmental component, but social factors and business stakeholders also apply moral pressure, forcing companies to pay more attention to the social dimension of sustainable development. Corporate social performance is a value of nonfinancial performance and is also considered as a part of the operating performance. Many researchers have attempted to investigate the link between corporate social performance and financial performance and have found a significant relationship between the two. Moreover, the social impact hypothesis, good management theory, and stakeholder contract costs theory also suggest that good corporate social performance may enhance companies’ financial performances. That is, a good sustainability performance positively impacts a company’s financial performance.
In the past, researchers have used various proxy measures to evaluate corporate social performance [36], such as the Fortune corporate reputation index, KLD (Kinder, Lydenberg and Domini Inc.) index and corporate social responsibility (CSR) ratings. However, the proxy measures of corporate social performance are mostly subjective and are based on qualitative data. In Taiwan, no such data regarding social performance is available. Therefore, the main constraint to carrying out research related to corporate social performance is the availability of data. Karagiorgos [37] mentioned that, in many studies, the measure of CSR is commonly referred to as the corporate social performance. Rundle-Thiele et al. [38] suggested that evaluating the corporate social performance would require the evaluation of CSR programs and policies. Fauzi et al. [39] mentioned that corporate social performance has the same meaning as CSR. Based on the finding of the abovementioned study, we use CSR to measure the corporate social performance.
The type of report is the main way to disclose nonfinancial performance information. Whether it is called sustainability reporting or CSR reporting, such a reporting is a key trend in global business development. The aim of CSR reporting is to disclose a company’s environmental, economic and social performance. In the past, many studies have shown that social and environmental disclosures affect stakeholders [40]. Karagiorgos [37] applied a content analysis to CSR annual reports to measure CSR. Yılmaz [41] used CSR disclosures as a proxy measure indicator of social performance. Therefore, in this study, we adopt CSR disclosures as a proxy indicator to measure social performance.

3.2.4. Environmental Performance Indicators

Porter [42] pointed out that environmental pressures encourage companies to face environmental issues, and the better the environmental performance of the company is, the higher the evaluation of future profitability of the investing public. Maxwell et al. [43] mentioned that companies can enhance corporate competitiveness by adopting a proactive environmental strategy to improve environmental performance [44].
Complete information on the environmental expenditure can illustrate a company’s investment in environmental protection and rational allocation. King and Lenox [45] showed that less polluting companies may have better financial performance. López-Gamero et al. [46] also showed that by reducing the generation of pollution and increasing environmental expenditures, companies can improve their environmental performance, make more profits and achieve better financial performance. Wang et al. [47] analyzed the environmental expenditures of chemical industry companies to determine which ones had better financial performance and to test the relationship between environmental expenditures and firm performance. In other studies [47,48,49,50,51], environmental expenditures were used as a proxy for environmental protection. Therefore, we also adopted environmental expenditures as one of the indicators to measure corporate environmental performance.
Verrecchia [52] showed that good environmental performance by a company reduces future environmental costs, and this environmental information disclosure is good news to investors. Therefore, when a company has good environmental performance, it should disclose more environmental information. Environmental public information can help investors understand a company’s concern for the environment. Under pressure from regulatory requirements, environmental information disclosure is an important part of business [53,54]. Therefore, this study uses environmental information disclosure as one of the indicators to measure corporate environmental performance.
In 1992, the World Business Council for Sustainable Development (WBCSD) described eco-efficiency (i.e., a win-win in both economic and ecological efficiency) as a business strategy for sustainable development. Thus, eco-efficiency has become a new environmental concept of sustainable development in the global industry and gradually attracted the attention of companies and governments. Eco-efficiency indicators are mainly used to assess companies’ resource productivity performances, providing managers with a reference when making strategic decisions. Such indicators are also an important communication tool among company managers and other internal or external stakeholders. Therefore, this study uses eco-efficiency indicators to measure corporate environmental performance.
Eco-efficiency indicators are ratios of product or service value/environmental impact. This study uses four such indicators to measure environmental impact: energy consumption, water consumption, waste generation and emissions of greenhouse gases. Finally, we use the average eco-efficiency indicator as one of the proxies to measure corporate environmental performance.

3.3. Data Source

This study investigates traditional credit assessment criteria by adding environmental variables, CSR variables and risk variables as the measure of the green credit evaluation criteria. In order to verify the feasibility of the proposed hybrid MCDM model, we collected various evaluation indicator data. Among them, the data of 21 financial indicators, R&D expenditures, DOL and DFL were taken from the Taiwan Economic Journal (TEJ) Data Bank. The TCRI data was provided by the Taiwan Corporate Credit Risk Index. The RAROC values were obtained from the VaR system of TEJ. The CSR reports are taken from the “Industrial Sustainable Development Clearinghouse” website.

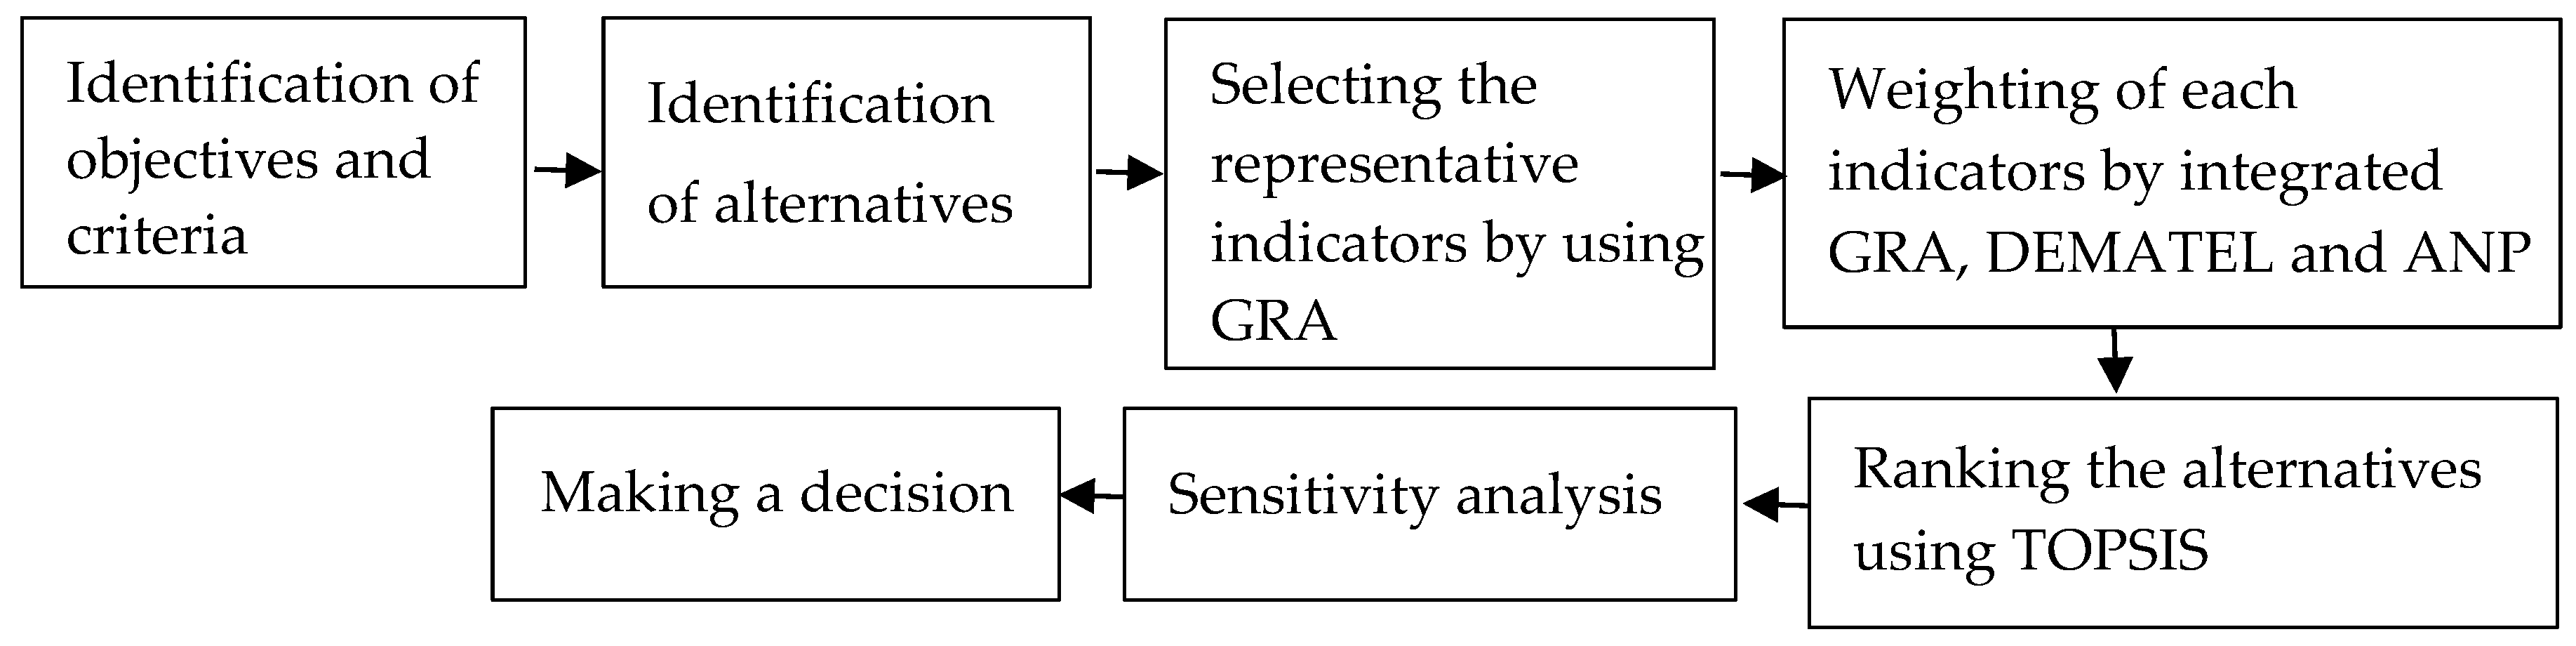
3.4. The Proposed Hybrid MCDM Model

This study proposes a quantitative evaluation model, which combines the GRA, DEMATEL, ANP and TOPSIS approaches to evaluate the green credit rating of companies. GRA is a kind of quantitative analysis used to evaluate the relative closeness to the ideal solution for each alternative. Based on the degree of similarity or dissimilarity between two alternatives used to measure the degree of proximity between the two alternatives, the closer the distance between the real object and ideal object is, the greater the degree of correlation. The DEMATEL method was mainly developed to solve scientific and human affair problems, to help better understand the world’s problems and to obtain solutions. DEMATEL can effectively clarify the causal relationship and can reveal the relationships between various indicators. This method uses matrix calculation to obtain the casual relationships and to impact the strength. The ANP method uses pairwise comparisons to measure the mutual influence of each index system and specific indicators of weight. MCDM can help decision makers with a limited number of possible scenarios to evaluate and select a scenario consistent with ideal decision-making and to obtain a rank ordering of the possible options based on the characteristics of the various attributes of each scenario [55].
This study combines GRA, DEMATEL, ANP and TOPSIS to establish a comprehensive green credit decision model for quantifying data. The flowchart of the proposed framework is summarized in Figure 3. The operation steps are given as follows [27]:
Step 1: Apply GRA to measure the degree of correlation between the indicators.
At the first step of the study, 21 financial ratios into three categories were chosen to be used as financial performance evaluation indicators. A financial performance evaluation with all 21 ratios makes calculations hard. Moreover, the correlation between the indicators in the group is high, selecting indicators that represent the characteristics of the group from each group helps to clarify the relationship between the indicators, and it is easier to evaluate the results. For the above reasons, it is important to reduce the financial ratios. The GRA is used to select the representative financial ratios for the three categories to measure the companies’ financial performances [56]. The main reason for choosing the GRA is its computational flexibility, the small amount of data and the uncertainty of the distribution type of the data [57,58]. In the grey theory, there are two kinds of major of GRA, localized GRA and globalized GRA [59]. According to the suggestion in Wang [60], we used the globalized GRA to select the performance evaluation representative indicators (financial ratios). The globalized GRA procedure is described as follows:
  • Establish the original sequence X i = { x 1 ( 1 ) , , x i ( k ) } , where i = 1 , 2 , , m   k = 1 , 2 , , n .
  • Before attempting grey relational analysis, the original experimental data must be normalized. Normalization can be done according to whether the indicators are the larger-the-better, the smaller-the-better or the nominal-the-better criterion. In this step, all the representative financial ratios are normalized in the range between zero and one. There are methods of data normalization [61]:
    (1)
    Larger-the-better: Upper-bound effectiveness measuring.
    x i * ( k ) = x i ( k ) min [ x i ( k ) ] max [ x i ( k ) ] min [ x i ( k ) ]
    where max [ x i ( k ) ] is the maximum value of x i ( k ) , min [ x i ( k ) ] is the minimum value of x i ( k ) and x i * ( k ) is the value after grey relational generation.
    (2)
    Smaller-the-better: Lower-bound effectiveness measuring
    x i * ( k ) = max [ x i ( k ) ] x i ( k ) max [ x i ( k ) ] min [ x i ( k ) ]
    (3)
    Nominal-the-better: Moderate effectiveness measuring
    x i * ( k ) = | x i ( k ) x o b | max [ x i ( k ) ] x o b
    where x o b  is the objective value of xi(k).
    After the normalization of the data, we can obtain the normalized data matrix D = [ x i * ( k ) ] m × n .
  • Calculation of the grey relational coefficient
    For a sequence comparison, when any one sequence x i ( k ) can be used as a reference sequence, another sequence x j ( k ) acts as a comparative sequence.
    Then, the globalized grey relational coefficient is defined as
    γ ( x i ( k ) ,    x j ( k ) ) = Δ min + ς Δ max Δ i j ( k ) + ς Δ max
    where Δ i j ( k ) = | x i ( k ) x j ( k ) | , Δ min = min i min k | x i ( k ) x j ( k ) | , Δ max = max i max k | x i ( k ) x j ( k ) | , k = 1 , 2 , , n , i = 1 , 2 , , m , j k , ς is the distinguishing coefficient and ς [ 0 , 1 ] . In general, the distinguishing coefficient ς is set as 0.5 [27].
  • Calculation of the grey relational grade
    The grey relational grade for a series of Xi can be expressed as [62]
    Γ i j = Γ ( X i , X j ) = 1 n k = 1 n γ ( x i ( k ) , x j ( k ) )
  • Calculation of the grey relational matrix.
    Based on the grey relational grade, a grey relational matrix can be obtained,
    R m × n = [ Γ 11 Γ 12 Γ 1 n Γ 21 Γ 22 Γ 2 n Γ m 1 Γ m 2 Γ m n ] m × n
    where Γ i j represents the degree of correlation between x i ( k ) and x j ( k ) sequences.
Step 2: Use GRA-DEMATEL to investigate the relationships between indicators.
One of the purposes of this paper is to combine the GRA with DEMATEL to allow the DEMATEL method to be applied to the analysis of quantitative data. This study integrates credit risk evaluation, economic performance, social performance and environmental performance indicators and obtains the grey relational matrix by the globalized GRA procedure (Equations (1)–(6)) and then fits well into the concept of the DEMATEL method to obtain the GRA-DEMATEL procedure. The GRA-DEMATEL procedure can be summarized in the following steps:
1. Set up the initial direct-relation matrix.
Follow the basic concept of DEMATEL. When the degree of influence of the criteria is known, the factors associated with each other can be represented by a matrix, called the direct relation matrix T . Following the above concepts, this study uses the grey relational matrix (Equation (6)) instead of the direct-relation matrix in DEMATEL and uses the degree of the effect of criterion i on criterion j . The diagonal element is set as 0.
Each value of the matrix T ( γ i j ) represents the level of influence that criteria i has on criteria j . Therefore,
T = [ 0 γ 12 γ 13 γ 1 m γ 21 0 γ 23 γ 2 m γ 31 γ 32 0 γ 3 m γ n 1 γ n 2 γ n 3 0 ]
2. Calculation of the normalized direct-relation matrix
Calculate the normalized initial direct-relation matrix X , by X = λT, where
λ = 1 max 1 i m ( j = 1 m γ i j )
3. Calculation of the total-relation matrix
Because lim k X k = O , O is a zero matrix, we can derive the total-relation matrix Z as
Z = lim k ( X + X 2 + + X k ) = X ( I X ) 1
where I is the identity matrix.
Step 3: Construct the supermatrix of the DANP [63].
Here, we use the GRA-DEMATEL combined with the ANP to determine the weights of the indicators. Apply the total-relation matrix of GRA-DEMATEL in the supermatrix of ANP. By Equation (11), we can obtain the total-relation matrix Z,
Z = [ t 11 t 1 j t 1 m t i 1 t i j t i m t n 1 t n j t n m ]
After normalizing the matrix Z , we obtain the normalization matrix Zs,
Z s = [ t 11 / d 1 t 1 j / d 1 t 1 m / d 1 t i 1 / d i t i j / d i t i m / d i t n 1 / d n t n j / d n t n m / d n ] = [ t 11 s t 1 j s t 1 m s t i 1 s t i j s t i m s t n 1 s t n j s t n m s ]
where d i = j = 1 m t i j .
By transposing the normalization matrix, we can obtain supermatrix W,
W = ( Z s ) = [ t 11 s t i 1 s t n 1 s t 1 j s t i j s t n j s t 1 m s t i m s t n m s ] = [ w 11 w i 1 w n 1 w 1 j w i j w n j w 1 m w i m w n m ]
Step 4: Calculate the weighted supermatrix
The weighted supermatrix can be obtained as follows:
W w = [ t 11 s × w 11 t 1 j s × w i 1 t 1 m s × w n 1 t i 1 s × w 1 j t i j s × w i j t i m s × w n j t n 1 s × w 1 m t n j s × w i m t n m s × w n m ] .  
Step 5: Determine the weights of evaluation criteria.
Use the ANP method to obtain the limit supermatrix, lim W w k , until the supermatrix has converged and becomes a long-term stable supermatrix. This stable convergence value is the relative weight of the evaluation criteria.
Step 6: Establish a normalized evaluation matrix based on the TOPSIS method.
After the weights of the indicators were determined using the GRA-DEMATEL combined with the ANP, the TOPSIS was used to evaluate and rank the company’s green credit performance.
If a decision matrix is made for a set of n criteria and m alternatives, then the normalized value r i j is calculated by using Equations (1)–(3), where i = 1 , 2 , , m , j = 1 , 2 , , n and r i j is the i th attribute in the j th evaluation attribute of the normalized value.
Step 7: Construct the weighted normalized decision matrix.
The weighted normalized decision matrix is calculated as
v i j = w i × r i j
where w i represents the weight of the i th criterion and the data obtained from Step 5.
Step 8: Determine the positive ideal ( A + ) and negative-ideal ( A ) solutions.
Determine the positive ideal solution and negative-ideal solution, respectively:
A + = { ν 1 + , ν 2 + , , ν n + } = { ( m a x i v i j | j B ) , ( m i n i v i j | j C ) | i = 1 , 2 , , m }
A = { ν 1 , ν 2 , , ν n } = { ( m i n i v i j | j B ) , ( m a x i v i j | j C ) | i = 1 , 2 , , m }
where B is the set of benefit type attributes and C is the set of cost type attributes.
Step 9: Calculate the separation measures using the m-dimensional Euclidean distance.
To measure the distance of each alternative, use the positive ideal solution and the negative ideal solution, respectively:
s i + = j = 1 n ( v i j v j + ) 2 , i = 1 , 2 , , m
s i = j = 1 n ( v i j v j ) 2 , i = 1 , 2 , , m
Step 10: Calculate the relative closeness to the ideal solution and rank the alternatives.
We compute the relative closeness coefficient ( C i * ) of each alternative with respect to the positive ideal solution, as defined below:
C i * = S i S i + S i +
where 0 C i * 1 and the larger the coefficient value, the better the performance of the alternatives.

3.5. Sensitivity Analysis

The purpose of a sensitivity analysis is mainly to examine whether the data have a significant impact on the results. Using a weight sensitivity analysis, Moghassem and Fallahpour [64] and Moghassem [65] showed whether all the weights of the criteria, 5%, 10%, 15% and 20%, tend to increase or decrease by repeating the TOPSIS approach. Other studies have shown that weight has great effects on the results of TOPSIS [66]. Therefore, based on the findings of Moghassem and Fallahpour [64] and Moghassem [65], this study performs a weight sensitivity analysis.

4. Empirical Results

4.1. The Results of Banks’ Green Credit Decision-Making

In order to analyze the banks’ green credit decisions, this study uses economic (21 financial indicators and R&D expenditure), social (CSR disclosure), environmental (eco-efficiency indicators, environmental expenditure and environmental information disclosure) and credit risk (TCRI, RAROC, DOL and DFL) as the bank’s evaluation criteria to measure the companies’ green credit. Firstly, a globalized GRA was used to select the representative indicators of financial performance among the 21 financial indicators. Then, the representative financial, social, environmental and credit risks indicators were integrated to establish the decision matrix. Using the integrated globalized GRA-DEMATEL method, we can determine the degree of influence of each evaluation indicator. Then, a globalized GRA-DEMATEL with ANP was adopted to determine the relative weight of each evaluation indicator. Finally, a globalized GRA-DEMATEL-ANP with the TOPSIS method was applied for the evaluation and ranking of the 55 high-tech industry-listed companies in Taiwan. By using a sensitivity analysis, we can understand the impact of the weight change on the performance rankings. The detailed calculation procedure is described in Appendix B.

4.1.1. The Selection of Representative Financial Indicators

This study uses financial ratios which are among the most popular and widely used in financial statement analyses. The selected ratios can be divided into three categories: profitability (6 indicators), operating ability (7 indicators) and solvency (8 indicators), as a measure of a company’s financial performance criteria. However, a high correlation exists between financial indicators within each category. Thus, following the performance score method proposed by Feng and Wang [67], we apply a globalized GRA with category characteristics to select representative financial indicators from each category, as a measure of financial performance.
First, in order to make the initial sequence data comparable, based on the characteristics of evaluation indicators, we normalized the financial indicators using Equations (1)–(3). Among the 21 financial indicators, the O 6 (days-A/R turnover) and O 7 (days-inventory turnover) variables have the following characteristics: the smaller-the-better. The rest of the variables are the larger-the-better. Then, substituting the data obtained from normalization into Equations (4)–(6), we can obtain the three categories, profitability, operating ability and solvency, of the grey relational matrix, as shown in Table A2 in Appendix B. By setting the threshold value at 0.7 [34], we can calculate the performance score for each evaluation indicator. For the profitability category, we selected three indicators, including P 1 (return on assets), P 2 (return of equity) and P 5 (net profit margin). For the operating ability category, we selected two indicators, O 5 (turnover of net worth) and O 7 (days-inventory turnover). Finally, in the solvency category, we selected the following four indicators: S 3 (current ratio), S 5 (long-term capital ratio), S 6 (times interest earned) and S 7 (oper. income/capital).

4.1.2. Integrating Globalized GRA and DEMATEL to Calculate the Degree of the Relationship between Two Indicators

This study uses a globalized GRA to obtain the degree of correlation between two evaluation indicators and to establish a direct-relation matrix. Using a combination of nine representative financial indicators, R&D expenditure, CSR discourse, eco-efficiency indicators, environmental expenses, environmental information discourse, TCRI, RAROC, DOL and DFL, we have a total of 18 evaluation indicators. All the above indicators are summarized in Table 2. Among them, O7, TCRI, DOL and DFL have the following characteristics: the smaller-the-better. Therefore, based on Equations (1)–(3), the raw data can be normalized to the range of 0 and 1. Then, through Equations (4)–(6), we can obtain the grey relational matrix and the diagonal value is set to 0 to establish a direct-relation matrix T . Using the DEMATEL method, the total-relation matrix Z can be obtained by Equations (7)–(10), as seen in Appendix B.

4.1.3. Integrating Globalized GRA-DEMATEL and ANP to Calculate the Weights of Evaluation Indicators

From the results of the total-relation matrix, we can obtain the degree of influence between two evaluation indicators. Then, we use the software “Super Decision 2.2” to directly input the resulting data so as to compare the degree of influence of indicators mapped by the integration of a globalized GRA and the DEMATEL method (Equation (20)). By using the Super Decision package, the weighted supermatrix (WW) was calculated, which is a 18 × 18 matrix, as seen in Appendix B.
We can obtain the limited supermatrix by multiplying the weighted supermatrix by itself multiple times. When the supermatrix results in a fixed convergence of the extreme values, the relative weight for each indicator can be obtained. The results are presented in Table A3 in Appendix B.

4.1.4. Using the TOPSIS Method to Evaluate and Rank High-Tech Industry Listed Companies

Through Steps 6 to 10, we can obtain the green credit performance and ranking of the 55 high-tech industry-listed companies in Taiwan. First, we establish the evaluation matrix based on the 18 evaluation indicators. Then, the raw data can be normalized based on Equations. (1)–(3). We can obtain the normalized decision matrix R, which is a 55 × 18 matrix, as seen in Appendix B.
In this study, we integrated a globalized GRA, DEMATEL and the ANP method to obtain the weights of 18 evaluation indicators. The results are shown in Table 3. Then, in accordance with Step 7, substituting the weights of 18 evaluation indicators into Equation (14), we can obtain the weighted normalized decision matrix V, as seen in Appendix B.
Through Step 8 (Equation (15) and (16)), we can obtain the positive idea solution and the negative idea solution. Finally, applying Equations (17)–(19), we can obtain the distance ( S i + and S i ) and relative closeness coefficient ( C i * ) of each company. Then, we rank the 55 high-tech industry-listed companies based on the value of C i * . A larger value of C i * represents a more superior company. The results are presented in Table 3.
The results of Table 3 show that, among the 55 high-tech industry-listed companies in Taiwan in 2014, the value of C i * for company F14 is 0.52285, which is the highest value. That is, company F14 had the best green credit evaluation performance. The empirical results also show that the value of C i * for company F34 is 0.37513, which is the lowest value among the 55 listed companies, representing the worst green credit evaluation performance. As seen in Table 3, the more front rankings of the companies, the better the green credit evaluation performance is; this shows that, among the business activities of companies, its impact on the environment and social issue is relatively low. When financial institutions and banks offer green credit loan to companies, they can give a lower interest rate. Conversely, if a company has a low ranking, when financial institutions and banks offer green credit loans to the company, they can give a higher interest rate.

4.2. The Results of Sensitivity Analysis

Weight is an important factor when using the TOPSIS method to rank alternatives. In order to verify the weight stability of the proposed integrative globalized GAR-DEMATEL-ANP-TOPSIS process, Based on the sensitivity analysis described in Section 3.3, in this study, the weights are increased or decreased by 5%, 10%, 15% and 20%. The results are shown in Table A4 in Appendix C. By substituting the results of the weight (Table A4) in the TOPSIS method (Equations (14)–(19)), we can calculate the 55 companies’ ranking results using a sensitivity analysis, as shown in Table A5 in Appendix C.
Ballı and Korukoğlu [68] and Chakraborty et al. [69] suggested using both the Spearman and Kendall tau correlation tests to examine the correlation of two rankings (the results of Table 3 and Table A5). The calculated results show that the Spearman correlations and the Kendall coefficient were 0.981 and 0.9, respectively. The results indicate a strong positive relationship between the two rankings. That is, the evaluation results changed little when the value of weighting was adjusted, and therefore, the proposed weighting method offers stability. Thus, applying the proposed hybrid MCDM analytical procedure to the analysis of banks’ green credit evaluation decisions is feasible.

5. Conclusions and Future Work

The era of putting too much emphasis on economic development has passed. In the current era of the green revolution, sustainable development has already become a key issue worldwide. Green credit is expected to consciously guide the flow of funds through financial institutions, to reduce the levels of environmental pollution, to protect the ecological balance, to facilitate the conservation of natural resources and to serve as effective mechanisms for the sustainable development of communities.
Traditionally, credit assets (whether investment or credit) are the main source of profit for banks. However, within a bank’s current credit risk evaluation framework, companies’ risks due to changing climates and related environmental problems are not included in the evaluation process. The presence of loopholes in risk identification is not conducive to a bank’s sustainable management and development. Therefore, in order to plug the loopholes in risk identification, this study combines credit risk and economic, environmental and social performance evaluation criteria within banks’ green credit evaluation criteria. This study proposes a combination of globalized GRA, DEMATEL, ANP and the TOPSIS procedure. The proposed procedure is applied using quantitative data in a hybrid MCDM model, thereby establishing a suitable green credit rating mechanism for banks. Moreover, the 55 listed high-tech companies in Taiwan are taken as the evaluation objects to verify the applicability of the green credit rating mechanism. Finally, a weight sensitivity analysis was used to test the stability in this study. The government can use the results as a reference for promoting future green finance reform.
The empirical results of this study show that, under an integrated environment, taking into account corporate social responsibility and credit risk evaluation criteria, companies F14, F25 and F4 are the top three green credit performers in Taiwan’s high-tech industry. Banks and financial institutions should give lower interest rates on credit funds to support these low power, low-pollution companies. The worst three are ranked as follows: F53, F48 and F34. Through high interest rates, banks and financial institutions can limit the financing of high pollution and high energy consumption companies. The results of a weight sensitivity analysis show that the proposed hybrid MCDM model offers stability.
In terms of practical meaning, through the publication of this study, we can help Taiwan’s banking industry establish a set of green credit evaluation criteria for quantitative data as a reference for future loans to businesses. The results of the green credit assessment of enterprises in the same industry are conducive to the development of green credit in the banking industry. The higher the green credit rating, the lower the interest on loans is and the higher the priority loans given to companies are. Conversely, a lower-ranking company gives a lower amount of loans or no loans. For investors, in addition to paying attention to the company’s financial information, we should pay more attention to nonfinancial investment information. The empirical results will enable investors to better understand the performance of the company’s sustainable development and to provide investors with more forward-looking information on the company’s operational performance, which can be a more complete assessment of the company’s real operating conditions. The assessment results can also serve as a reference for the government to promote green finance and to assist the green energy technology industry to obtain medium and long-term funds. In the academic sense, the previous literatures show that the DEMATEL method is used for the analysis of qualitative data. However, the combination of GRA and DEMATEL can be applied to the analysis of quantitative data. The proposed modified hybrid MCDM model can also be applied to the evaluation and ranking of quantitative data for green credit.
In terms of research restrictions, because the green credit of Taiwan’s banking industry is still in its infancy, it is impossible to know the credit criteria adopted, and this paper is a quantitative study and does not include types of variables in questionnaires, so it cannot include all the evaluation indicators proposed by previous literatures. Furthermore, because Taiwanese companies have not fully disclosed their CSR reports, they are unable to conduct green credit assessments for all companies in the same industry.
In recent years, the green credit has been become an international trend. However, in Taiwan, this kind of credit is still in its infancy. Thus, data related to environmental variables, CSR variables and credit risk variables, which can affect green credit performances, are not available. In the future, by adding more variables to the proposed decision analysis process, researchers can make the green credit rating decision-making process more credible. Apart from the high-tech industry, the proposed hybrid MCDM model can also be used in other industries such as manufacturing, biotechnology and pharmaceuticals.

Author Contributions

C.-C.Y., S.-L.O. and L.-C.H. conceived, designed, and wrote together this article. Conceptualization, L.-C.H.; Methodology, S.-L.O. and L.-C.H.; Software, C.-C.Y. and S.-L.O.; Writing—Original Draft Preparation, C.-C.Y., S.-L.O. and L.-C.H.; Writing-Review & Editing, C.-C.Y., S.-L.O. and L.-C.H.

Funding

The authors would like to thank the National Science Council of the Republic of China, Taiwan for financially supporting this research under Contract No. MOST 104-2410-H-275-005.

Conflicts of Interest

The authors declare no conflict of interest.

Appendix A. List of Equator Principles

In the June 2013 version of the third version of the Equator Principles, there are 10 Equator Principles that are shown in Table A1.
Table A1. A list of Equator Principles.
PrincipleStatement of PrinciplesMain Contents
Principle 1Review and Categorisation When a project is proposed for financing, it is reviewed and classified according to the magnitude of its potential environmental and social risks and impacts.
Principle 2 Environmental and Social Assessment For all projects, the relevant environmental and social risks and impacts of the proposed project
Principle 3 Applicable Environmental and Social Standards The assessment process should address compliance with the relevant host country laws, regulations and permits that pertain to environmental and social issues.
Principle 4 Environmental and Social Management System and Equator Principles Action Plan An Environmental and Social Management System (ESMS) must be developed or maintained by the client.
Principle 5 Stakeholder Engagement The client requires a demonstration of effective stakeholder engagement as an ongoing process in a structured and culturally appropriate manner with affected communities.
Principle 6 Grievance Mechanism The client requires the establishment of a grievance mechanism designed to receive and facilitate the resolution of concerns and grievances.
Principle 7 Independent Review For all projects, an independent consultant, not directly associated with the client, will carry out an Independent Review of the assessment documentation.
Principle 8 Covenants For all projects, the client will covenant in the financing documentation a compliance with all relevant host country environmental and social laws, regulations and permits in all material respects.
Principle 9 Independent Monitoring and Reporting To assess the project compliance with the Equator Principles and to ensure ongoing monitoring and reporting after Financial Closure and over the life of the loan.
Principle 10 Reporting and Transparency The Equator Principles Financial Institutions (EPFI) will report publicly on transactions that have reached financial closure and on its Equator Principles implementation processes and experience, taking into account appropriate confidentiality considerations.

Appendix B. Results in Detail

This study proposed a hybrid MCDM model that integrated globalized GRA, DEMATEL, ANP and TOPSIS to assess banks’ green credit decision analysis. The procedure is as follows:
  • As mentioned in Section 4, we collected 21 financial indicators by using a globalized GRA to obtain the grey relational matrix, as shown in Table A2. According to Reference [34], we selected 9 indicators (see Section 4.1).
    Table A2. The grey relational matrix.
    Table A2. The grey relational matrix.
    Profitability
    P 1 P 2 P 3 P 4 P 5 P 6
    P 1 10.62610.64320.85730.84920.7821
    P 2 0.693110.59540.66180.65590.6644
    P 3 0.70830.595410.75110.75740.7391
    P 4 0.86240.60200.701010.93840.7997
    P 5 0.85780.60290.71360.939910.7981
    P 6 0.80990.64030.71920.82080.81541
    Operating ability
    O 1 O 2 O 3 O 4 O 5 O 6 O 7
    O 1 10.7320.77620.77860.86590.57030.4863
    O 2 0.726610.75980.70210.7260.56790.4805
    O 3 0.77820.766810.76520.80380.53710.4568
    O 4 0.78070.71020.765210.82390.49370.4237
    O 5 0.86560.73080.80160.821810.5340.4596
    O 6 0.56350.56790.52670.48310.527610.7176
    O 7 0.48940.49110.45680.42370.46350.72541
    Solvency
    S 1 S 2 S 3 S 4 S 5 S 6 S 7 S 8
    S 1 10.71260.71490.70780.63160.50890.75040.7536
    S 2 0.722310.66790.66870.58290.52750.78420.7785
    S 3 0.71960.662610.93750.76720.42320.70520.7087
    S 4 0.71470.66590.938210.76640.42290.70560.7090
    S 5 0.64260.58290.77120.768510.40430.62480.6259
    S 6 0.51160.51760.41980.41670.39510.49340.4898
    S 7 0.72530.75260.67140.66970.57850.455310.9745
    S 8 0.72870.74610.6750.67340.57940.45160.97451
  • To integrate a globalized GRA and DEMATEL, use the selection indicators in Table 2 to establish a direct-relation matrix T . Then, the total-relation matrix Z can be obtained. Sustainability 11 01506 g004
    Z = [ 1.02945 1.11315 1.09355 1.06176 1.11316 1.08043 1.10023 1.07737 1.09355 1.10022 1.01056 1.05579 1.06176 1.07736 1.05578 0.94670 ] 18 × 18 .
  • To integrate a globalized GRA, DEMATEL and ANP, the weighted supermatrix ( W W ) was obtained by using “Super Decision 2.2”. Then, the limit supermatrix can be obtained by the ANP method. A relative weight for each indicator can be obtained by limit supermatrix, as shown in Table A3.
    W W = [ 0.02835 0.06082 0.05855 0.05723 0.02621 0.05902 0.05887 0.05360 0.02667 0.06011 0.05411 0.05810 0.05250 0.03042 0.05652 0.05554 ] 18 × 18 .
    Table A3. The weights of the indicators using a globalized GRA-DEMATEL-ANP.
    Table A3. The weights of the indicators using a globalized GRA-DEMATEL-ANP.
    Indicators P 1 P 2 P 5 S 3 S 5 S 6 S 7 O 5 O 7
    Weights0.057980.059020.057260.05760.05650.051750.058110.057070.05243
    IndicatorsECOCSRDEIDEEDOLDFLRAROCRDETCRI
    Weights0.056250.058720.058480.053630.05150.058870.05450.055380.04495
    Note: P 1 : return on assets, P 2 : return on equity, P 5 : net profit margin S 3 : current ratio, S 5 : long-term capital ratio, S 6 : times interest earned, S 7 : oper. income/capital, O 5 : turnover of net worth, O 7 : days-inventory turnover, ECO: eco-efficiency indicator, CSRD: CSR disclosures, EID: environment information disclosures, EE: environment expenditure, DOL: degree of operating leverage, DFL: degree of financial leverage, RAROC: risk-adjusted rate of return on capital, RDE: R&D expenditure, TCRI: Taiwan corporate credit risk index.
  • Establish the normalized decision matrix R for the TOPSIS analysis. Then, the weighted normalized decision matrix V for each indicator can be calculated.
    R = [ 0.49793 0.29482 0.57488 0.55556 0.49615 0.24748 0.58166 0.66667 0.67180 0.40579 0.67997 0.88889 0.00000 0.11308 0.00000 0.55556 ] 52 × 18 .
    V = [ 0.02887 0.01740 0.03292 0.02497 0.02877 0.01461 0.03331 0.02997 0.03895 0.02395 0.03894 0.03996 0.00000 0.00667 0.00000 0.02497 ] 52 × 18 .
  • Identify the positive idea solution A + = [ 0.05798 , 0.05902 , 0.05726 , , 0.04495 ] 1 × 18 and the negative idea solution A = [ 0 , 0 , 0 , , 0 ] 1 × 18 . Then, calculate the positive and negative ideal solutions ( S i + and S i ) for each company, respectively.
  • 6. Calculate the relative closeness coefficient for each alternative. Then, rank the 55 companies according to the relative closeness coefficients. The results are shown in Table 3.

Appendix C. The Ranking Results of the Sensitivity Analysis

In order to investigate the effect of the combined weight for the ranking results, we conducted a sensitivity analysis to evaluate the influence of weight. The results of the weights of the evaluation indicators used in the sensitivity analysis are shown in Table A4. The ranking results of the sensitivity analysis are shown in Table A5.
Table A4. The weights of evaluation indicators for using in sensitivity analysis.
Indicators P 1 P 2 P 5 S 3 S 5 S 6 S 7 O 5 O 7
Weights0.064070.070820.062990.063360.053680.041400.069730.062780.04981
IndicatorsECOCSRDEIDEEDOLDFLRAROCRDETCRI
Weights0.053440.070460.070180.050950.041200.070640.051780.052610.03596
Table A5. The results of the sensitivity analysis.
CompaniesF1F2F3F4F5F6F7F8F9F10F11F12F13F14
Rank514253143824161171339521
CompaniesF15F16F17F18F19F20F21F22F23F24F25F26F27F28
Rank216463432239153529242030
CompaniesF29F30F31F32F33F34F35F36F37F38F39F40F41F42
Rank172618194753362227828401044
CompaniesF43F44F45F46F47F48F49F50F51F52F53F54F55
Rank50453743125533414925543148

References

  1. Eccles, R.G.; Pyburn, P.F. Creating a comprehensive system to measure performance. Manag. Acc. 1992, 74, 41–44. [Google Scholar]
  2. Weber, O.; Scholz, R.W.; Michalik, G. Incorporating sustainability criteria into credit risk management. Bus. Strateg. Environ. 2010, 19, 39–50. [Google Scholar] [CrossRef]
  3. Aruldoss, M.; Lakshmi, T.M.; Venkatesan, V.P. A survey on multi criteria decision making methods and its applications. Am. J. Inf. Syst. 2013, 1, 31–43. [Google Scholar]
  4. Büyüközkan, G.; Arsenyan, J.; Ertek, G. Evaluation of e-learning web sites using fuzzy axiomatic design based approach. Int. J. Comput. Int. Syst. 2010, 3, 28–42. [Google Scholar] [CrossRef]
  5. Kou, G.; Peng, Y.; Lu, C. MCDM approach to evaluating bank loan default models. Technol. Econ. Dev. 2014, 20, 292–311. [Google Scholar] [CrossRef]
  6. Rostamzadeh, R.; Ismail, K.; Bodaghi Khajeh Noubar, H. An application of a hybrid MCDM method for the evaluation of entrepreneurial intensity among the SMEs: A case study. Sci. World J. 2014, 2014, 703650. [Google Scholar] [CrossRef] [PubMed]
  7. Alam-Tabriz, A.; Rajabani, N.; Farrokh, M. An integrated fuzzy DEMATEL-ANP-TOPSIS methodology for supplier selection problem. Glob. J. Manag. Stud. Res. 2014, 1, 85–99. [Google Scholar]
  8. Alimardani, M.; Rabbani, M.; Rafiei, H. A novel hybrid model based on DEMATEL, ANP and TOPSIS for supplier selection in agile supply chains. Int. J. Serv. Oper. Manag. 2014, 18, 179–211. [Google Scholar] [CrossRef]
  9. Kuan, M.; Chen, Y. A hybrid MCDM framework combined with DEMATEL-based ANP to evaluate enterprise technological innovation capabilities assessment. Decis. Sci. Lett. 2014, 3, 491–502. [Google Scholar] [CrossRef] [Green Version]
  10. Shen, K.Y.; Yan, M.R.; Tzeng, G.H. Combining VIKOR-DANP model for glamor stock selection and stock performance improvement. Knowl. Based Syst. 2014, 58, 86–97. [Google Scholar] [CrossRef]
  11. Hsu, L.C. Investment decision making using a combined factor analysis and entropy-based TOPSIS model. J. Bus. Econ. Manag. 2013, 14, 448–466. [Google Scholar] [CrossRef]
  12. Bulgurcu, B. Financial performance ranking of automotive industry firms in Turkey: Evidence from entropy weighted technique. Int. J. Econ. Financ. 2013, 3, 844–851. [Google Scholar]
  13. Ghadikolaei, A.S.; Esbouei, S.K. Integrating fuzzy AHP and fuzzy ARAS for evaluating financial performance. Bol. Soc. Parana. Mat. 2013, 32, 163–174. [Google Scholar] [CrossRef]
  14. Ghadikolaei, A.S.; Esbouei, S.K.; Antucheviciene, J. Applying fuzzy MCDM for financial performance evaluation of Iranian companies. Technol. Econ. Dev. 2014, 20, 274–291. [Google Scholar] [CrossRef]
  15. Moghimi, R.; Anvari, A. An integrated fuzzy MCDM approach and analysis to evaluate the financial performance of Iranian cement companies. Int. J. Adv. Manuf. Technol. 2014, 71, 685–698. [Google Scholar] [CrossRef]
  16. Wang, Y.J. The evaluation of financial performance for Taiwan container shipping companies by fuzzy TOPSIS. Appl. Soft Comput. 2014, 22, 28–35. [Google Scholar] [CrossRef]
  17. Sun, Y.F.; Wu, C.H. Green credit loan as environmental policy. Environ. Econ. 2010, 1, 68–75. [Google Scholar]
  18. Li, J.L. Enterprises’ environmental credit assessment-from the perspective of financial institutions’ green credit. Adv. Mater. Res. 2012, 361, 1868–1873. [Google Scholar] [CrossRef]
  19. Xu, L. On the evaluation of performance system incorporating “green credit” policies in China’s financial industry. J. Financ. Risk Manag. 2013, 2, 33–37. [Google Scholar] [CrossRef]
  20. Toloie-Eshlaghy, A.; Homayonfar, M. MCDM methodologies and applications: A literature review from 1999 to 2009. Res. J. Int. Stud. 2011, 21, 86–137. [Google Scholar]
  21. Büyüközkan, G.; Çifçi, G. A novel hybrid MCDM approach based on fuzzy DEMATEL, fuzzy ANP and fuzzy TOPSIS to evaluate green suppliers. Expert Syst. Appl. 2012, 39, 3000–3011. [Google Scholar] [CrossRef]
  22. Ou Yang, Y.P.; Shieh, H.M.; Tzeng, G.H. A VIKOR technique based on DEMATEL and ANP for information security risk control assessment. Inf. Sci. 2013, 232, 482–500. [Google Scholar] [CrossRef]
  23. Ding, S.H.; Kamaruddin, S. Assessment of distance-based multi-attribute group decision-making methods from a maintenance strategy perspective. J. Ind. Eng. Int. 2014, 11, 73–85. [Google Scholar] [CrossRef] [Green Version]
  24. Hassan, M.; Kamran, N.; Mohsen, M.C.; Vahidreza, M. Design of a combined fuzzy model in codifying and ranking strategies. Afr. J. Bus. Manag. 2012, 6, 11797–11808. [Google Scholar] [CrossRef]
  25. Stanujkic, D.; Djordjevic, B.; Djordjevic, M. Comparative analysis of some prominent MCDM methods: A case of ranking Serbian banks. Serb. J. Manag. 2013, 8, 213–241. [Google Scholar] [CrossRef] [Green Version]
  26. Ou, Y.C. Using a hybrid decision-making model to evaluate the sustainable development performance of high-tech listed companies. J. Bus. Econ. Manag. 2016, 17, 331–346. [Google Scholar] [CrossRef]
  27. Hsu, L.C.; Ou, S.L.; Ou, Y.C. A comprehensive performance evaluation and ranking methodology under a sustainable development perspective. J. Bus. Econ. Manag. 2015, 16, 74–92. [Google Scholar] [CrossRef]
  28. Hwang, R.C.; Chung, H.; Siao, J.S.; Lin, C.L. Does the local rating agency provide reliable credit ratings? An empirical analysis from an emerging market. J. Fixed Income 2012, 22, 41–51. [Google Scholar] [CrossRef]
  29. Lu, S.L. Assessing the credit risk of bank loans using an extended Markov chain model. J. Appl. Financ. Bank. 2012, 2, 197–223. [Google Scholar]
  30. Norman, W.; MacDonald, C. Getting to the bottom of “triple bottom line”. Bus. Ethics Q. 2004, 14, 243–262. [Google Scholar] [CrossRef]
  31. Fujii, H.; Iwata, K.; Kaneko, S.; Managi, S. Corporate environmental and economic performances of Japanese manufacturing firms: Empirical study for sustainable development. Bus. Strateg. Environ. 2013, 22, 187–201. [Google Scholar] [CrossRef]
  32. Grigoroudis, E.; Orfanoudaki, E.; Zopounidis, C. Strategic performance measurement in a healthcare organization: A multiple criteria approach based on balanced score. Omega 2012, 40, 104–119. [Google Scholar] [CrossRef]
  33. Ittner, C.D.; Larcker, D.F. Coming up short on non-financial performance measurement. Harv. Bus. Rev. 2003, 81, 88–95. [Google Scholar] [PubMed]
  34. Hsu, L.C. A hybrid multiple criteria decision-making model for investment decision making. J. Bus. Econ. Manag. 2014, 15, 509–529. [Google Scholar] [CrossRef]
  35. Hsu, L.C. Using a decision-making process to evaluate efficiency and operating performance for listed semiconductor companies. Technol. Econ. Dev. 2015, 21, 301–331. [Google Scholar] [CrossRef]
  36. Fu, G.; Wang, J.; Jia, M. The relationship between corporate social performance and financial performance: Modified models and their application: Evidence from listed companies in China. J. Contemp. Manag. 2013, 2, 17–37. [Google Scholar]
  37. Karagiorgos, T. Corporate social responsibility and financial performance: An empirical analysis on Greek companies. Eur. Res. Stud. 2010, 13, 85–108. [Google Scholar]
  38. Rundle-Thiele, S.; Ball, K.; Gillespie, M. Raising the bar: From corporate social responsibility to corporate social performance. J. Consum. Mark. 2008, 25, 245–253. [Google Scholar] [CrossRef]
  39. Fauzi, H.; Svensson, G.; Rahman, A.A. “Triple bottom line” as “sustainable corporate performance”: A proposition for the future. Sustainability 2010, 2, 1345–1360. [Google Scholar] [CrossRef]
  40. Elsakit, O.; Worthington, A. The attitudes of managers and stakeholders towards corporate social and environmental disclosure. Int. J. Econ. Financ. 2012, 4, 240–251. [Google Scholar] [CrossRef]
  41. Yılmaz, İ. Social performance vs. financial performance: CSR disclosures as an indicator of social performance. Int. J. Financ. Bank Stud. 2013, 2, 53–65. [Google Scholar] [CrossRef]
  42. Porter, M.E. The competitive advantage of the inner city. Harv. Bus. Rev. 1995, 73, 55–71. [Google Scholar]
  43. Maxwell, J.; Rothenberg, S.; Briscoe, F.; Marcus, A. Green schemes: Corporate environmental strategies and their implementation. Calif. Manag. Rev. 1997, 39, 118–120. [Google Scholar] [CrossRef]
  44. Chen, Y.S.; Lai, S.B.; Wen, C.T. The influence of green innovation performance on corporate advantage in Taiwan. J. Bus. Ethics 2006, 67, 331–339. [Google Scholar] [CrossRef]
  45. King, A.A.; Lenox, M.J. Does it really pay to be green? An empirical study of firm environmental and financial performance: An empirical study of firm environmental and financial performance. J. Ind. Ecol. 2001, 5, 105–116. [Google Scholar] [CrossRef]
  46. López-Gamero, M.D.; Molina-Azorín, J.F.; Claver-Cortés, E. The whole relationship between environmental variables and firm performance: Competitive advantage and firm resources as mediator variables. J. Environ. Manag. 2009, 90, 3110–3121. [Google Scholar] [CrossRef] [PubMed] [Green Version]
  47. Wang, W.K.; Lu, W.M.; Wang, S.W. The impact of environmental expenditures on performance in the U.S. chemical industry. J. Clean. Prod. 2013, 64, 447–456. [Google Scholar] [CrossRef]
  48. Aerts, W.; Cormier, D.; Magnan, M. Corporate environmental disclosure, financial markets and the media: An international perspective. Ecol. Econ. 2008, 64, 643–659. [Google Scholar] [CrossRef]
  49. Charles, H.C.; Martin, F.; Dennis, M.P. Corporate disclosure of environmental capital expenditures: A test of alternative theories. Account. Audit. Account. J. 2012, 25, 486–507. [Google Scholar]
  50. Leiter, A.M.; Parolini, A.; Winner, H. Environmental regulation and investment: Evidence from European industry data. Ecol. Econ. 2011, 70, 759–770. [Google Scholar] [CrossRef]
  51. Patten, D.M. The relation between environmental performance and environmental disclosure: A research note. Account. Org. Soc. 2002, 27, 763–773. [Google Scholar] [CrossRef]
  52. Verrecchia, R.E. Discretionary disclosure. J. Acc. Econ. 1983, 5, 179–194. [Google Scholar] [CrossRef]
  53. Christmann, P.; Taylor, G. Globalization and the environment: Determinants of firm self-regulation in China. J. Int. Bus. Stud. 2001, 32, 439–458. [Google Scholar] [CrossRef]
  54. Dean, T.J.; Brown, R.L. Pollution regulation as a barrier to new firm entry: Initial evidence and implications for future research. Acad. Manag. J. 1995, 38, 288–303. [Google Scholar]
  55. Yoon, K.P.; Hwang, C.L. Multiple Attribute Decision Making: An Introduction; Sage Publications: Thousand Oaks, CA, USA, 1995. [Google Scholar]
  56. Kung, C.Y.; Wen, K.L. Applying grey relational analysis and grey decision-making to evaluate the relationship between company attributes and its financial performance—A case study of venture capital enterprises in Taiwan. Decis. Support Syst. 2007, 43, 842–852. [Google Scholar] [CrossRef]
  57. Özdağoğlu, A.; Gümüş, Y.; Özdağoğlu, G.; Gümüş, G.K. Evaluating financial performance with grey relational analysis: An application of manufacturing companies listed on Borsa İstanbul. Muhasebe ve Finansman Dergisi 2017, 73, 289–312. [Google Scholar] [CrossRef]
  58. Malek, A.; Ebrahimnejad, S.; Tavakkoli-Moghaddam, R. An improved hybrid grey relational analysis approach for green resilient supply chain network assessment. Sustainability 2017, 9, 1433. [Google Scholar] [CrossRef]
  59. Kuo, T. A review of some modified grey relational analysis models. J. Grey Syst. 2017, 29, 70–77. [Google Scholar]
  60. Wang, Y.J. Combining grey relation analysis with FMCGDM to evaluate financial performance of Taiwan container lines. Expert Syst. Appl. 2009, 36, 2424–2432. [Google Scholar] [CrossRef]
  61. Sa, B.; Mb, S.; Pasupathy, S.A.; Karthick Kumar, K.; Ge, S. Multi objective optimization of anaerobic digestion of poultry litter using Taguchi grey relational analysis. Int. J. Appl. Eng. Res. 2018, 13, 5216–5222. [Google Scholar]
  62. Deng, J.L. Control problems of grey systems. Syst. Control Lett. 1982, 1, 288–294. [Google Scholar]
  63. Shao, Q.G.; Liou, J.J.; Weng, S.S.; Chuang, Y.C. Improving the green building evaluation system in China based on the DANP method. Sustainability 2018, 10, 1173. [Google Scholar] [CrossRef]
  64. Moghassem, A.R.; Fallahpour, A.R. Selecting doffing tube components for rotor-spun yarn for weft knitted fabrics using multi-criteria decision-making approach with interval data. J. Eng. Fiber Fabr. 2011, 6, 44–53. [Google Scholar] [CrossRef]
  65. Moghassem, A.R. Comparison among two analytical methods of multi-criteria decision making for appropriate spinning condition selection. World Appl. Sci. J. 2013, 21, 784–794. [Google Scholar]
  66. Yu, V.F.; Hu, K.J. An integrated fuzzy multi-criteria approach for the performance evaluation of multiple manufacturing plants. Comput. Ind. Eng. 2010, 58, 269–277. [Google Scholar] [CrossRef]
  67. Feng, C.M.; Wang, R.T. Performance evaluation for airlines including the consideration of financial ratios. J. Air Transp. Manag. 2000, 6, 133–142. [Google Scholar] [CrossRef]
  68. Ballı, S.; Korukoğlu, S. Development of a fuzzy decision support framework for complex multi-attribute decision problems: A case study for the selection of skilful basketball players. Expert Syst. 2014, 31, 56–69. [Google Scholar] [CrossRef]
  69. Chakraborty, R.; Ray, A.; Dan, P. Multi criteria decision making methods for location selection of distribution centers. Int. J. Ind. Eng. Comput. 2013, 4, 491–504. [Google Scholar] [CrossRef]
Figure 1. A summary of the hybrid multi-criteria decision-making (MCDM) model procedures.
Sustainability 11 01506 g001
Figure 2. The framework to evaluate and rank the green credit of companies.
Sustainability 11 01506 g003
Figure 3. A flowchart of the proposed framework.
Sustainability 11 01506 g003
Table 1. Descriptions of the financial indicators on the three categories.
CategoryCodeFinancial ratiosDefinition
Solvency S 1 Cash flow adequacy ratioNet cash flow operation over the last five years/(Capital spending + Addition to inventory + Cash dividend) over the five years
S 2 Cash reinvestment ratio(Net cash flow from operating activities − Cash dividend)/(Total fixed assets + Long-term investments + Other assets + Working capital)
S 3 Current ratioCurrent assets/Current liabilities
S 4 Quick ratio(Current assets − Inventories)/Current liabilities
S 5 Long-term capital ratio(Net shareholder’s equity + Long-term Liabilities)/Net fixed assets
S 6 Times interest earned(Net income + Interest expense)/Interest expense
S 7 Operation income/CapitalOperation income/Capital
S 8 Pre tax income/CapitalPretax income/Capital
Operating ability O 1 Total assets turnoverNet operating revenue/Total assets
O 2 Accounts receivable turnoverNet sales/Average balance of account receivable
O 3 Inventory turnoverCost of sales/Average inventory
O 4 Fixed assets turnoverNet operating revenue/Total fixed assets
O 5 Turnover of net worthNet Sales/Net worth (Stockholders’ equity)
O 6 Days-A/R turnover(Total A/R Outstanding/Total Sales) * Days
O 7 Days-inventory turnover(Average inventory/Cost of goods sold) * days
Profitability P 1 Returns on assets(Earning + Interest expenses (1 − Tax rate))/Average total assets
P 2 Returns on equityCurrent term net profit/Shareholder equity
P 3 Profit margin(Total sales –Total expenses)/Total sales
P 4 Operating marginOperating profit/Net sales
P 5 Net profit marginNet Profit/Total Revenue
P 6 Earnings per shareNet income/Average outstanding common shares
Table 2. The selected indicators for banks in green credit decision-making.
CriteriaIndicators
Credit riskTaiwan Corporate Credit Risk Index (TCRI)
Economic performanceReturn on assets ( P 1 ), Return of equity ( P 2 ) and Net profit margin ( P 5 ), Turnover of net worth ( O 5 ), Days-inventory turnover ( O 7 ), Current ratio ( S 3 ), Long-term capital ratio ( S 5 ), Times interest earned ( S 6 ), Oper. income/capital ( S 7 ), R&D expenditure (RDE), Risk-adjusted rate of return on capital (RAROC), Degree of operating leverage (DOL) and Degree of financial leverage (DFL)
Social performanceCorporate social responsibility disclosure (CSRD)
Environmental performanceEco-efficiency indicators (ECO), Environmental expenditure (EE) and Environmental information disclosure (EID)
Table 3. The final distance measures, relative closeness coefficients and rankings.
Companies S i + S i C i RankCompanies S i + S i C i Rank
F10.165770.107630.3936752F290.145190.132260.4767115
F20.155670.119220.4337034F300.155460.125910.4474926
F30.143560.132420.4798210F310.150340.135230.4735517
F40.136500.144530.514293F320.153420.129230.4572021
F50.144060.131660.4775314F330.160880.109840.4057348
F60.160290.116850.4216343F340.176820.106150.3751355
F70.151300.125470.4533323F350.156110.115580.4254242
F80.142400.128540.4744116F360.149050.130790.4673719
F90.143030.132880.481629F370.150460.121750.4472727
F100.144310.135890.484987F380.148670.136270.4782413
F110.144090.132110.4783012F390.151730.123810.4493425
F120.156670.119150.4319936F400.158780.117630.4255641
F130.167130.108930.3945851F410.140570.135900.491555
F140.143940.157730.522851F420.173600.119340.4073846
F150.154110.130740.4589720F430.166530.109780.3973250
F160.143730.136780.487636F440.161570.116900.4197844
F170.158810.112440.4145245F450.154880.119210.4349333
F180.151270.117910.4380231F460.157790.117130.4260540
F190.165770.107630.3936735F470.145190.135980.483618
F200.155670.119220.4337022F480.170640.103810.3782554
F210.143560.132420.4798211F490.161610.122680.4315337
F220.136500.144530.5142918F500.160040.119660.4278238
F230.144060.131660.4775332F510.162810.111440.4063547
F240.160290.116850.4216328F520.150490.122940.4496324
F250.151300.125470.453332F530.169630.109660.3926553
F260.142400.128540.474414F540.164210.122750.4277639
F270.143030.132880.4816229F550.178380.121230.4046449
F280.144310.135890.4849830

