1. Introduction
The acquisition of a large number of individual spatiotemporal data is steadily becoming realized with the development and application of location-based services (LBSs) such as global positioning satellite (GPS) technology, social networks and wireless communications [
1]. These large-scale individual datasets that contain spatiotemporal characteristics provide new ways to scientifically study human mobility patterns, the spatial structures of urban residence and employment and urban planning.
Data cleaning and O-D pair extraction are prerequisites for analysis of urban structures and human mobility patterns based on spatiotemporal LBS data. Previous cleaning methods were mainly intended for data that contained complete attribute or uniform GPS information, such as phone signaling data [
2,
3], taxi GPS data [
4,
5] and smart card data of bus or subway stations [
6,
7,
8], whose O-D information can be extracted directly by using the locations of smart card transactions and taxi pick-up and drop-off points. Under the initiative of low-carbon transportation, cheap and convenient public bicycle rental systems have become one of the most popular modes of travel for urban residents. In recent years, the extraction of human mobility trajectories and urban hot functional areas from the operational data of shared transport systems has become a focal point for research [
9,
10]. Shared bicycles and shared electric bicycles (e-bikes) rental system are two most common public bicycle rental system. Compared to shared bicycles, shared e-bikes is relatively insensitive to long-distance travel, poor air quality or weather [
11]. Shared e-bikes are highly adept in navigating large roads and small alleys, which makes them an excellent solution for short- and medium-distance trips, especially in second- and third-tier cities. For shared bicycle, a few studies have extracted O-D pair of each ride directly by using the GPS information and riding status. However, for shared e-bicycle, the corresponding research has not yet been reported in recent studies. Additionally, unlike taxi GPS data or shared bicycle data, shared e-bikes travel at relatively high speeds and have limited battery usage, the GPS trajectory points tend to exhibit discontinuities and nonuniformities and it is also difficult to obtain their riding status information. When shared e-bike GPS trajectory data cleaning is performed using the current method, the resulted O-D pairs may tend to become trivial and incorrect, which subsequently results in the incorrect analysis of human mobility.
In this paper, we first propose a novel cleaning method for shared e-bike GPS trajectories, which feature nonuniform GPS information and a lack of ride-status attribute information. Furthermore, actual road networks are used to continuously correct and validate the results of the trajectory extraction algorithm. The results of this study are significant for reallocation of e-bikes and provide scientific data for human mobility pattern analysis, urban functional zones sectorization and spatial distribution of occupation and residence.
2. Literature Review
A systematic literature review adapted from Correia et al. 2017 and Centobelli et al., 2017 was used to provide all available research relevant to trajectory data analysis [
12,
13]. By using Web of Science and Scopus academic databases, keywords include ‘GPS data,’ ‘data cleaning,’ ‘shared bikes,’ ‘smart data,’ ‘travel data analysis,’ ‘trajectory data,’ ‘riding data’ and ‘origin-destination’ are searched and frequency analysis are conducted. Then through paper selection and analysis on manual filtering, relevant papers in the analysis of the LBS data cleaning and application are considered finally. Through the above analysis, previous studies related to taxi GPS data, smart phone signaling data, smart card data and the GPS trajectory data of shared bicycles [
14,
15,
16] were mainly analyzed.
Using GPS trajectory data, Liu et al. (2012) traced taxi passenger pick-up and drop-off locations of one week in Shanghai and analyzed the relationship between the daily movements of urban residents and land use [
17]. Tang et al. (2015) collected the GPS data of 1100 taxis in 2012 in Harbin city, with a sampling rate of 30 s per point and extracted the O-D pairs of these taxis using their occupancy status and location data [
18]. Zheng et al. (2014) proposed a set of criteria for assessing the accuracy of GPS taxi data based on the identification of inconsistencies between movement, speed and trip length [
19]. Based on GPS travel data, Wolf classified travel trajectories by setting a time threshold for the identification of vehicle parking events, which minimized the misrecognition of traffic jams or other delay-related time segments such as vehicle parking events, enabling the identification of origin (O) and destination (D) points [
20].
By using mobile phone signaling data and smart card data, Alexander et al. (2015) proposed a method for inferring the average daily O-D pairs of each user from the mobile phone records of anonymized users [
21]. Zou et al. (2011) proposed a method for the extraction of O-D pairs from bus trips based on mobile phone positioning [
22]. Alsger et al. (2016) implemented, validated and improved currently available algorithms for the estimation of O-D pairs [
23]. Xu et al. (2017) constructed a network for population fluxes that occur during the Spring Festival in China based on Tencent Location Big Data and analyzed the relationship between these population fluxes and the level of development of several cities in China [
24]. Kim et al. (2017) used the O-D pair data of smart cards to investigate the habitual route selection patterns of bus passengers [
25]. Long et al. (2015) constructed a travel model based on smart card records to analyze the places of employment and residence of Beijing residents and their commuting behaviors, providing new ideas about the commuting patterns of large cities [
26]. Munizaga et al. (2014) proposed a method for the validation of public transport O-D matrices that were estimated from smart card and GPS data [
27].
For the trajectory data of shared bicycles, Jensen et al. (2010) analyzed the riding behaviors of residents by using shared bicycle system data in Lyon [
28]. The extracted data records contain the location and time of the beginning and end of each trip and the precise trip distances measured by a distance counter on each bicycle. Since 2015, shared bicycle systems have developed at an extremely rapid pace in China. Many researchers have used Python packages and ArcGIS to study the spatiotemporal features of urban riding patterns by using currently available operational data. Examples include the study of Yang et al. (2018) on the impact of public bike-sharing systems on public transport systems [
29] and the studies of Shaheen et al. (2011) and Tang et al. (2017) on the bicycle-sharing schemes in Hangzhou and Shanghai, respectively [
30,
31].
Smart transportation systems provide new sources of data for the study of urban systems and mobility modes, for example, the data gathered by smart card and shared bicycle systems. However, studies based on the trajectory data of shared e-bikes have not yet to be reported. Since shared e-bikes are rental goods that are used by a wide range of users, the data of each shared e-bike consist of multiple trajectory segments, each made by a different user. As the trips recorded by the GPS data are simply the spatiotemporal trajectory point coordinates of the vehicle, it is not possible to directly infer the activities of the vehicle’s riders from this information. In addition, the GPS trajectory data of shared e-bikes do not contain attributes such as the riding status. The current data cleaning methods for the extraction of O-D pairs are therefore inapplicable for these data. Therefore, it is necessary to formulate new rules for determining the parking and traveling states of these e-bikes, restoring the information of each trajectory segment. In this paper, we propose a method for data cleaning and O-D pair extraction that is suitable for sparse trajectory data. The findings of this study provide a scientific basis for future studies about urban structures and the spatiotemporal characteristics of urban resident mobility.
3. Data Characteristics
3.1. Data Sources
The data used in this study are the GPS trajectory points of shared e-bikes in Tengzhou that were acquired between 19 May 2018 and 26 May 2018. The integrated module with GPS and communication is installed in each e-bike and the GPS information is sent to the specified internet address every minute. Based on the data acquisition interface of HTTP protocol provided by shared e-bike operator, GPS trajectory points data can be acquired from the specified internet address by a high frequency timer system, which is developed by Java language.
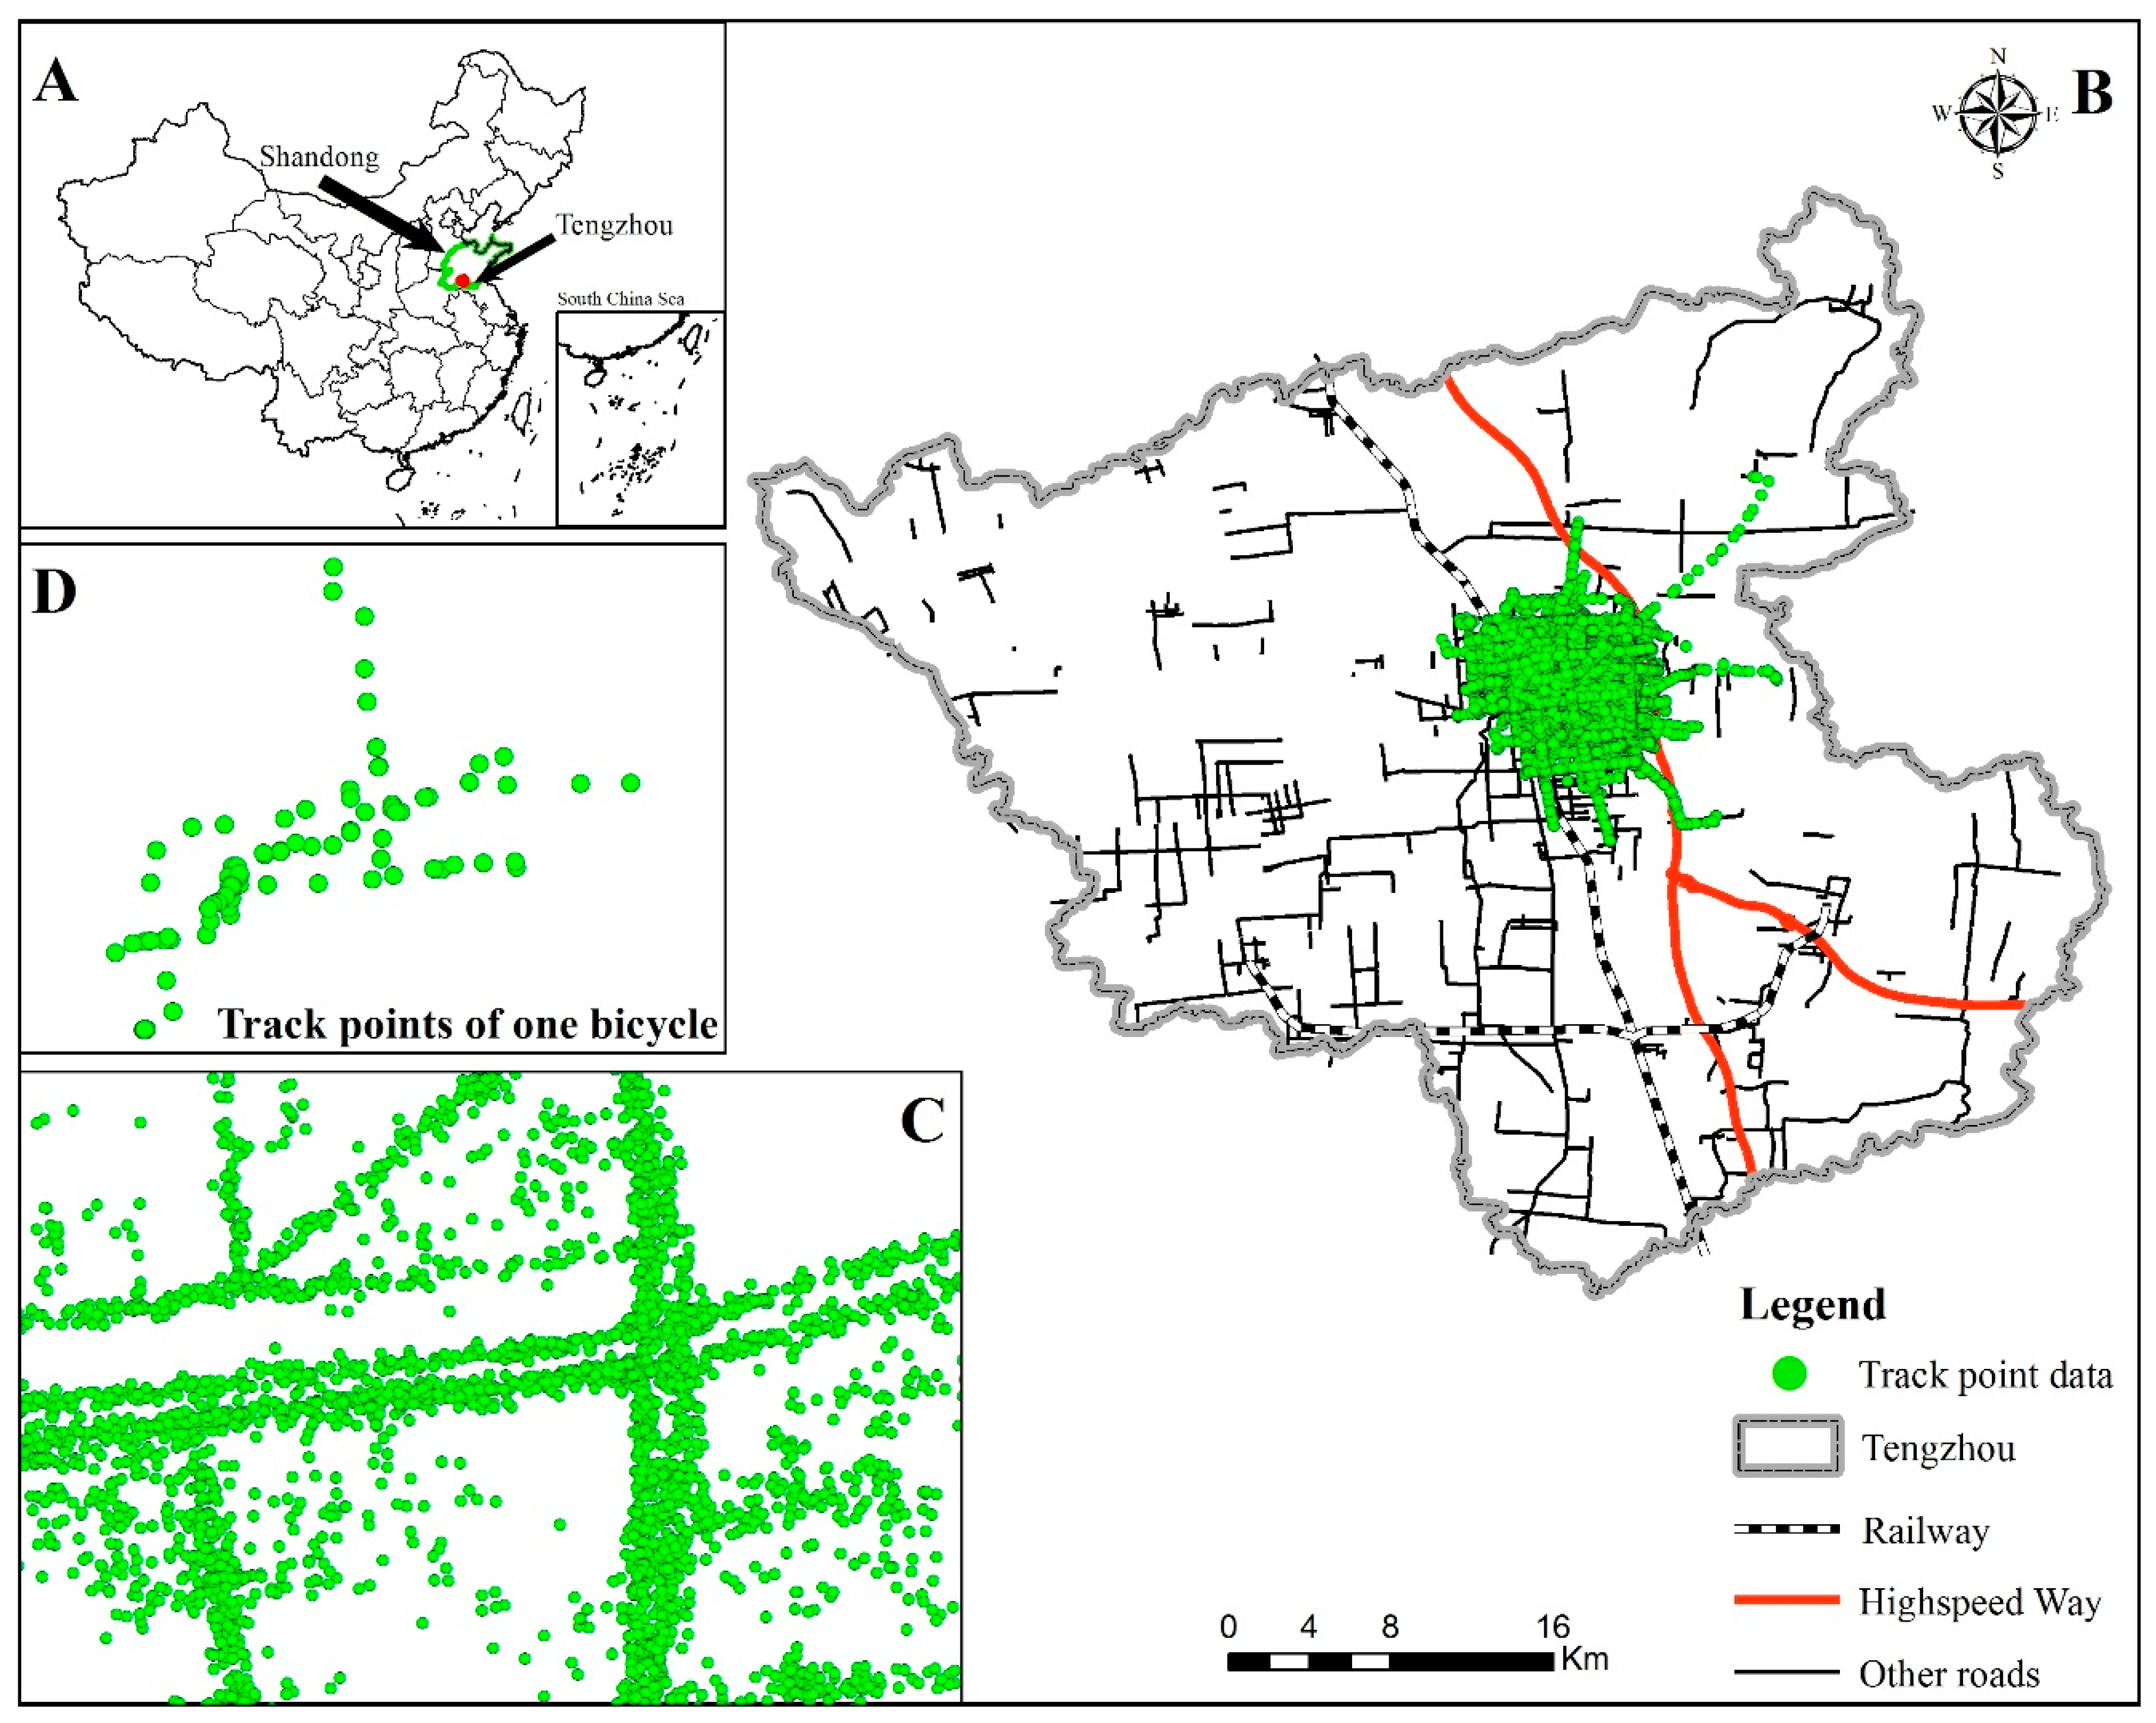
Tengzhou is located in west-southern Shandong province, in eastern China. It is China’s most beautiful eco-tourism demonstration city and was awarded 2018 ‘happiness hundred counties’ and ‘industrial hundred counties.’ Shared e-bikes have been widely used in Tengzhou, especially in downtown areas. As shown in
Figure 1, the derived shared e-bike data are a set of unsorted and continuous GPS points. The information contained by each GPS point includes: the vehicle’s ID (stationid), data acquisition time (timestamp) and location (as latitude/longitude coordinates), predicted mileage (anticipated mileage) and margin (margin). The dataset in this study includes the data of 516 shared e-bikes and 98795 GPS trajectory data points.
Data cleaning comprises the processing of invalid fields, taking out the GPS drift points and finally extracting O-D pairs (which form the basis of trajectory data) from the unsorted GPS points and their corresponding trip times to form the travel trajectories of each user. Since the source data do not contain any riding status-related information, the key to O-D extraction lies in the identification of endpoints that belong to two adjacent trips from the continuous and stateless initial data. The trips made by each user may then be determined.
3.2. Data Characteristics
The characteristics of the shared e-bike dataset used in this study were analyzed from a temporal perspective based on the time attributes of the data. In this analysis, ti (1 ≤ i ≤ n) is defined as the timestamp of n trajectory points and |ti+1 − ti| is the sampling interval of the trajectory data.
3.2.1. Data Coverage
The number of days covered by the trajectory points of the shared e-bikes was analyzed. Thirty-four shared e-bikes were used throughout the week and 406 shared e-bikes were used on three to four days. Only 27 shared e-bikes were just used for one day. This result indicates that the shared e-bikes have high utilization rates and the data can reflect the travel patterns of partial urban residents. However, not all rides cover the entirety of the week, so the GPS trajectory data are characterized by discontinuity and incompleteness, which makes the data sparse to a certain degree.
3.2.2. Sampling Interval
The GPS tracking devices were configured with a sampling interval of one acquisition per minute. Calculation of the time intervals of the acquired data showed that 61% of the data was acquired with a sampling interval of 1 min and that 89.6% of the data was acquired with a sampling interval within 2 min. Since the sampling intervals are relatively uniform, the data are usable and analyzable. However, 10.4% of the data had sampling intervals longer than 2 min. This result means that the data contain sparse trajectories with nonuniform distributions in the time dimension, which results in the loss of some fragmentary data.
The sparse vehicle trajectories of urban traffic are generally characterized by two significant features: (1) The trajectory points in the vehicle trajectory are not distributed uniformly in the time dimension. (2) The time spanned by the trajectories of each vehicle accounts for a very small proportion of the total observation time [
6,
32]. Based on this definition, the shared e-bike trajectory data obtained in this study is considered sparse data. This outcome may be due to two reasons: first, unlike the shared bikes, shared e-bikes use electric energy as their driving force and are limited by the battery. The batteries are usually replaced manually. When the battery is wearing out, the GPS device may have a weak or absent signal. Second, shared e-bikes are highly adept in navigating large roads and small alleys and when passing through small alleys, tunnels or roads covered by trees, the GPS signal might be too weak, and the location of the vehicle may not be updated in a timely manner. This issue leads to data losses over long periods of time. In addition, certain difficult-to-avoid problems such as device operation issues or packet loss may lead to the loss of trajectory data. Therefore, sparse trajectory data are always present in traffic data.
4. Cleaning and Extraction of Trajectory Data
Since the raw data derived from the GPS devices consist of the spatiotemporal trajectory point coordinates of the shared e-bikes, they do not directly reflect the trajectory and route information of each user. Therefore, our data cleaning and trajectory extraction procedures comprise the following: (1) the classification of the endpoints of two adjacent trips from continuous and stateless raw data, (2) the removal of incomplete and invalid trajectory records and (3) the extraction of the trajectory segment/O-D pairs of each user.
Our trajectory cleaning method, which is suitable for the sparse data of shared e-bikes, satisfies the following requirements of trajectory extraction: efficacy (the ability to restore the O-D pairs of the trajectory segment of each user), completeness (the sampling density of each trajectory segment is maintained at a certain level), accuracy (the errors in the information retrieval process are limited to a certain range) and rationality (the trajectories are matched with actual road networks to continuously adjust the algorithm).
4.1. Data Characteristics
4.1.1. Selection of Cleaning Indices
In the absence of riding status-related information, it is necessary to search for the parking points of each moving object based on the spatiotemporal point coordinates provided by the object’s GPS records to identify the riding status of each trajectory (sample) point. Then, the endpoints of two adjacent trips by the moving object may be identified. The state of motion of a moving object is adjudged using the time difference, distance and average speed between two adjacent sample points and the instantaneous speed of each sample point.
In the following, t
i (1 ≤ i ≤
n) is defined as the timestamp of n trajectory points, gpsy
i (1 ≤ i ≤
n) and gpsx
i (1 ≤ i ≤
n) are the latitude and longitude coordinates of the n trajectory points and R is the Earth’s radius (6371004 m in this paper). T
i is the time interval (in seconds) between the i-th and i+1-th points in the GPS trajectory data, d
i is the distance between the i-th and i+1-th points in the GPS trajectory data,
is the average speed (km/h) of the moving object between the i-th and i+1-th points in the GPS trajectory data and
is the instantaneous speed of the moving object at the i-th point in the trajectory data.
4.1.2. Preliminary Threshold Determination of Indices
To ensure that trajectory O-D point extraction is performed scientifically, the endpoints of a moving object’s trips are determined by setting threshold values for the time interval, distance and average speed between two trajectory points and the instantaneous speed of each point. This provides a preliminary set of trajectories for each moving object.
The thresholds for the trajectory cleaning indices were initially defined as follows:
(1) Time interval of the sample points. If the sample interval is greater than 10 min (less than 10% of all samples), the trajectory is considered to contain a loss of fragmentary data and is therefore invalid.
(2) Average speed between sample points. The walking speed of a normal person generally fluctuates at approximately 1 m/s (approximately 4 km/h) [
33]. Therefore, if the instantaneous speed of a sample point (i.e., the riding speed of a shared e-bike) is less than that of a walking person, this point may be considered a parking point. However, to avoid the misidentification of traffic-induced delays as parking points (e.g., traffic jams and traffic lights), the criterion for a sample point to be identified as a trip endpoint is riding speeds that are continuously lower than 4 km/h for two minutes.
4.2. Algorithm Anomaly Identification and Modification Based on the Actual Road Network
First, the endpoints of the moving object’s trips are preliminarily identified using threshold values. Then, using actual road networks, the preliminary results in
Section 4.1 are corrected through anomaly identification and corrections.
4.2.1. First Algorithm Modification
If the sampling interval of the trajectory points is 2 to 10 min, some of the intervening trips between the sample points may be lost. In this case, the endpoints of a trip must be judged according to the distance moved and speed of the shared e-bike. Based on a large number of threshold adjustment trials, setting the moved distance greater than 200 m and the average speed lower than 4 km/h, the last GPS point is determined to be a parking point. To restore trajectory segments in limit errors, the middle point between two trajectories is considered the destination point of the previous trajectory and the original point of the next trajectory.
4.2.2. Second Algorithm Modification
Based on the result of algorithm modification 1, excluding the invalid trajectories. If an identified trajectory segment only contains two sample points (i.e., only the original and destination points), there may be three scenarios as follows.
a. If the time difference between two sample points is greater than 2 min, one trip may have occurred during this period and these two points are the origin and destination points of this trip.
b. If the two sample points correspond to the original point of a trip and a point within a trip, other GPS trip data are missing and it is impossible to determine the destination point of the trip.
c. Both points are GPS points within a trip and it is impossible to determine the origin and destination points of the trip.
Considering these scenarios, the actual road networks and the threshold adjustment trials, trajectory segments that only contain two sample points are determined to be invalid and can be eliminated.
In addition, if a trip obtained after algorithm modification 1 is too short, the corresponding trajectory segment is meaningless. The distance moved of a shared e-bike is therefore a criterion for the elimination of invalid trajectories. Based on the road network matching tests and threshold adjustment trials, all trajectory segments with Euclidean distances (di) equal or less than 200 m are determined to be invalid trajectories. As indicated in
Figure 2, if a route that matches an actual road network is shorter than 50 m, it can be considered the displacement error of the e-bike staying or the GPS equipment signal.
4.3. Algorithm for Trajectory Cleaning and O-D Extraction
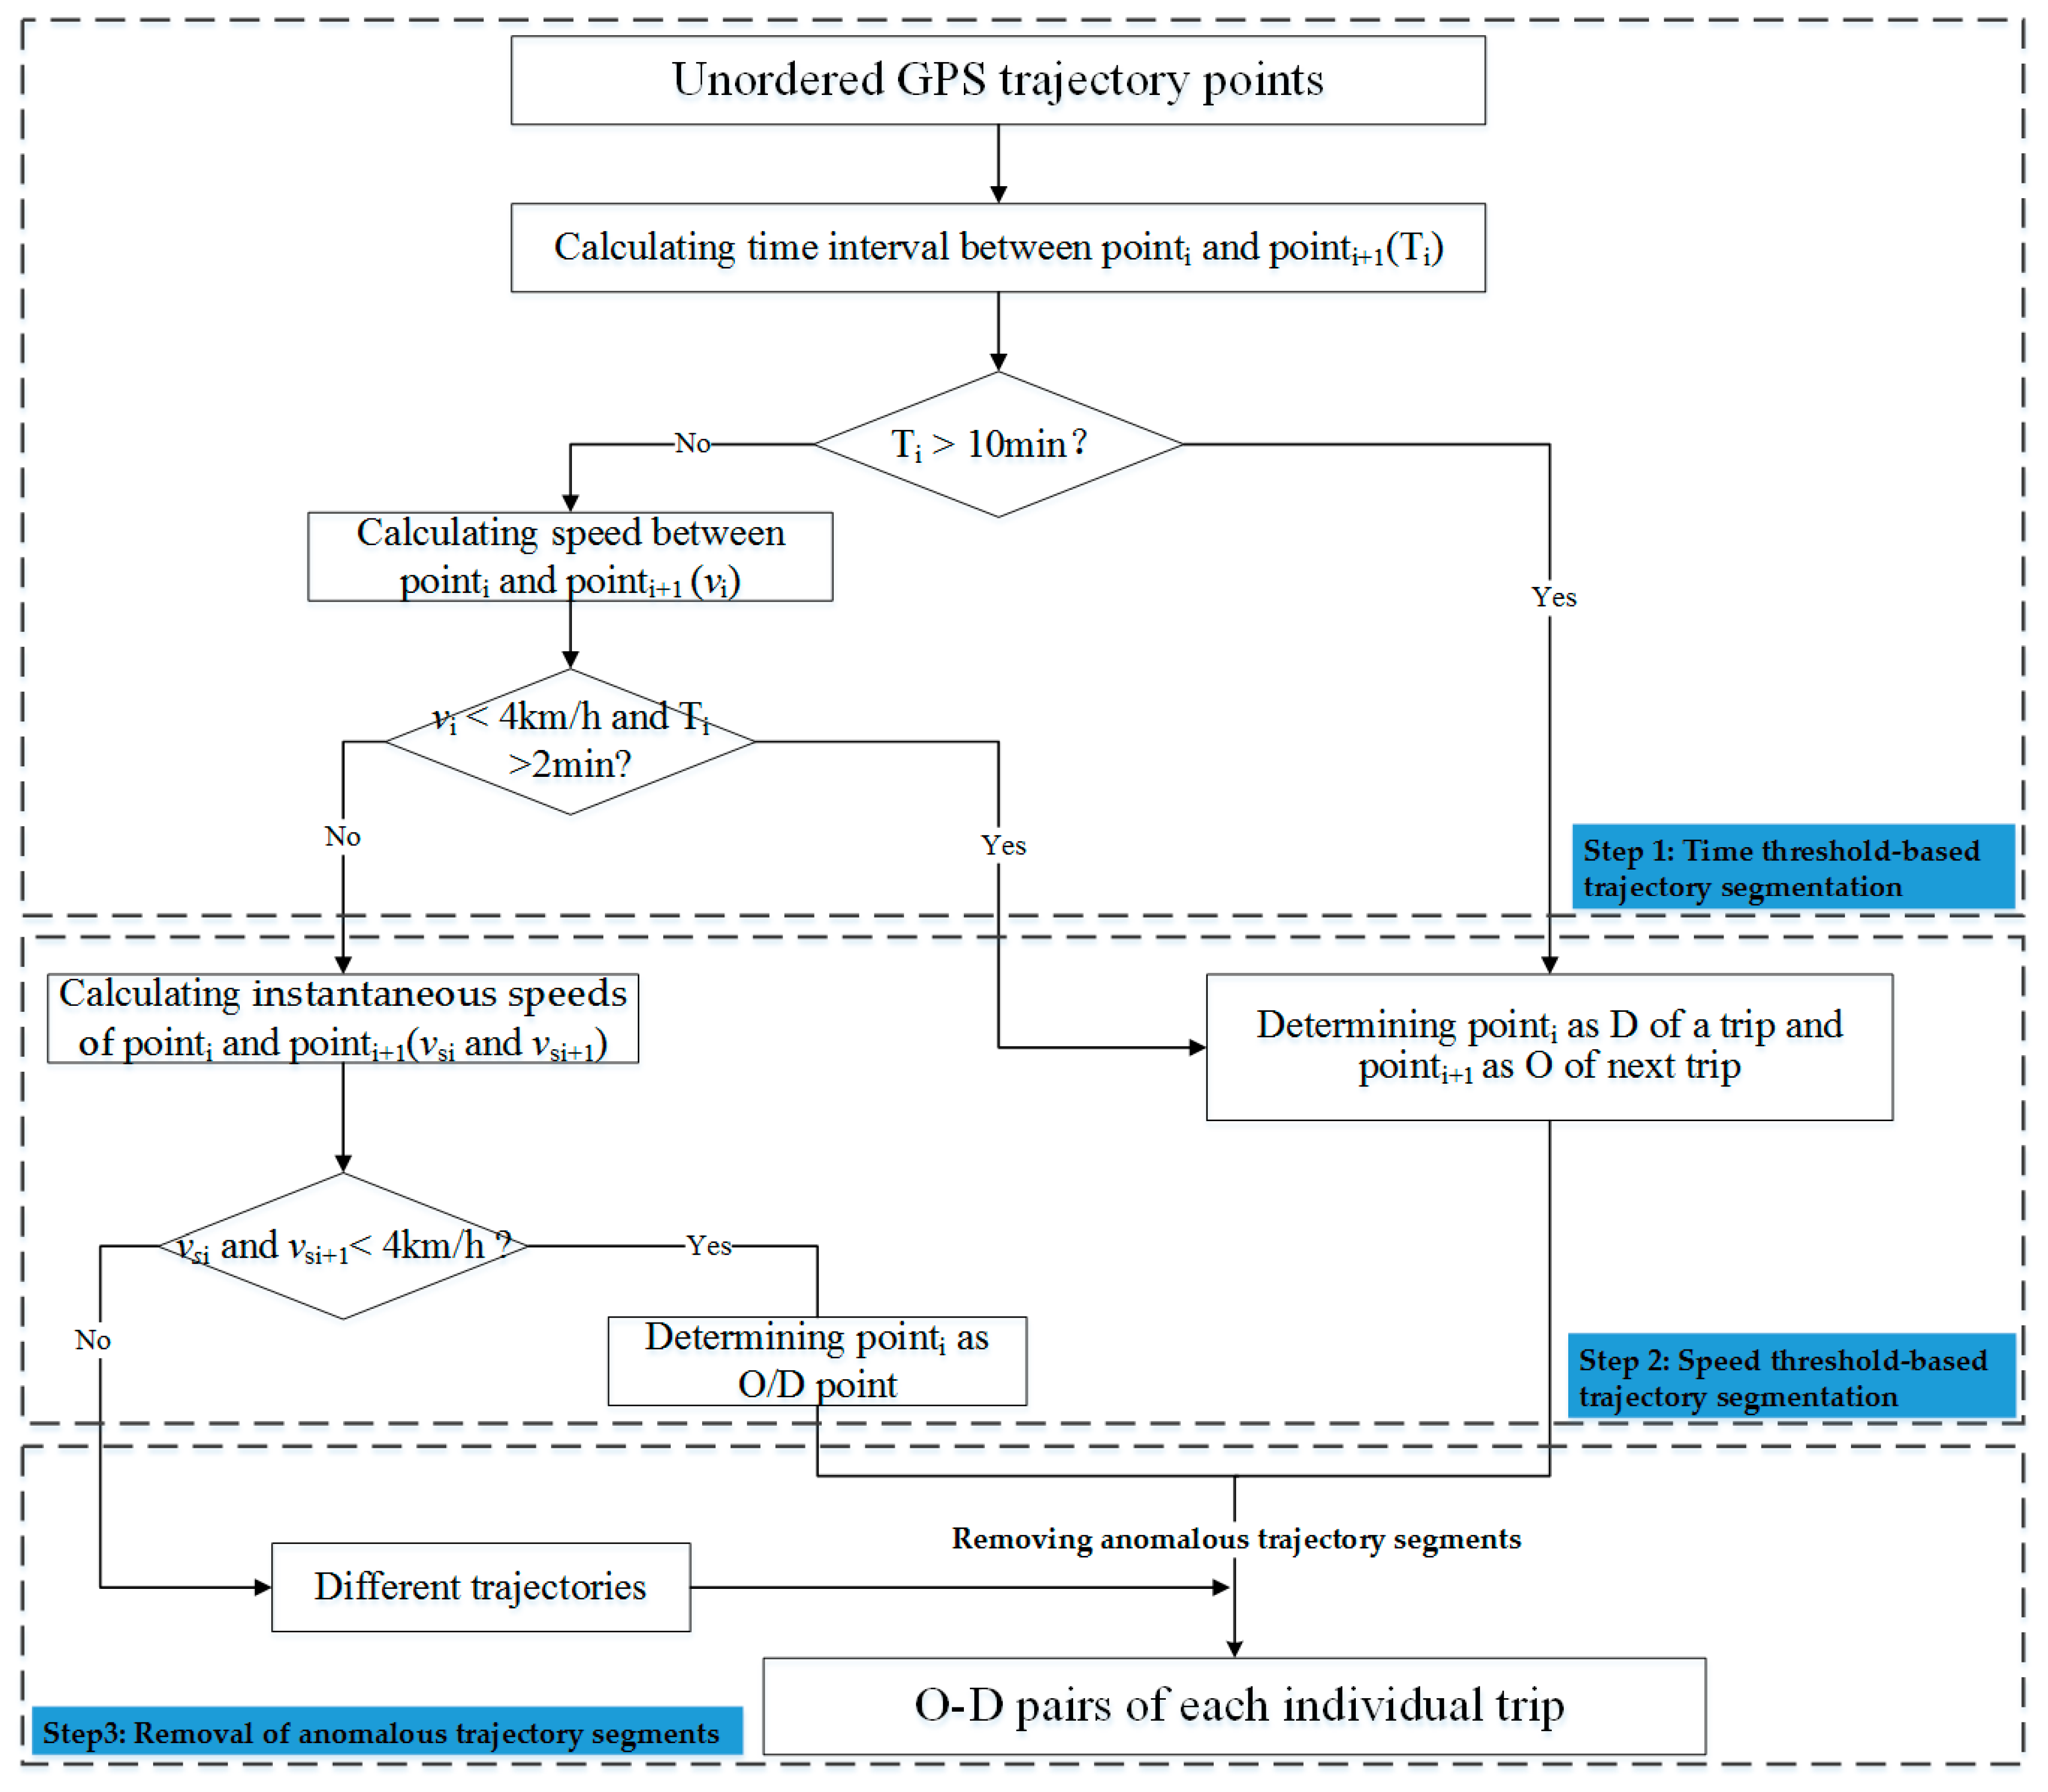
Based on the determination of the cleaning indices and the algorithm anomaly identification and modification with the actual road network, an algorithm for trajectory cleaning and O-D extraction is identified and divided into three steps, whose flow chart is illustrated in
Figure 3.
Step 1: Time threshold-based trajectory segmentation
(1) Trajectory data that correspond to different days are generally classified as different trajectory segments.
(2) Adapted from Zhao et al.,2017 that divide different trips based on time difference between two segment, sampling interval, T
i, are also defined in this paper [
34]. Somewhat differently, the interval threshold is 10 min. If T
i is greater than the threshold T (10 min), no trajectory will be recorded for the shared e-bike in the corresponding period. The earlier sample point (point i) will be marked as the D (destination) point of a trip and the later sample point (point i + 1) will be marked as the O (origin) point of the next trip.
(3) If the sampling interval is larger than two minutes and smaller or equal to T, the average speed between the adjacent points in the trajectory segment is calculated (the distance is calculated using the Euclidean distance).
(i) If < 4 km/h and Ti > 2min, the shared e-bike is considered to have parked during this period. In the trajectory segment between these points, the earlier point is labeled as the D point of the previous trip and the later point is labeled as the O point of the next trip.
(ii) if Ti < 2 min and the average speed is less than 4 km/h, the shared e-bike is considered to have stopped temporarily in this period. This trajectory will not be segmented.
Step 2: Speed threshold-based trajectory segmentation
In the trajectory segments that were extracted in Step 1, trajectory segmentation is performed in continuous trajectories with riding speeds lower than 4 km/h for more than two minutes, which also have instantaneous speeds ( and vs(i+1)) less than 4 km/h in two continuous trajectory points (except for the original and destination points). The earlier sample point is marked as the D point of the previous trip and the later sample point is marked as the O point of the subsequent trip.
Step 3: Removal of anomalous trajectory segments
In this step, the trajectory segments that were generated in Step 2 are traversed and the trajectory segments with fewer than two sample points or di <= 200 m are eliminated.
5. Results
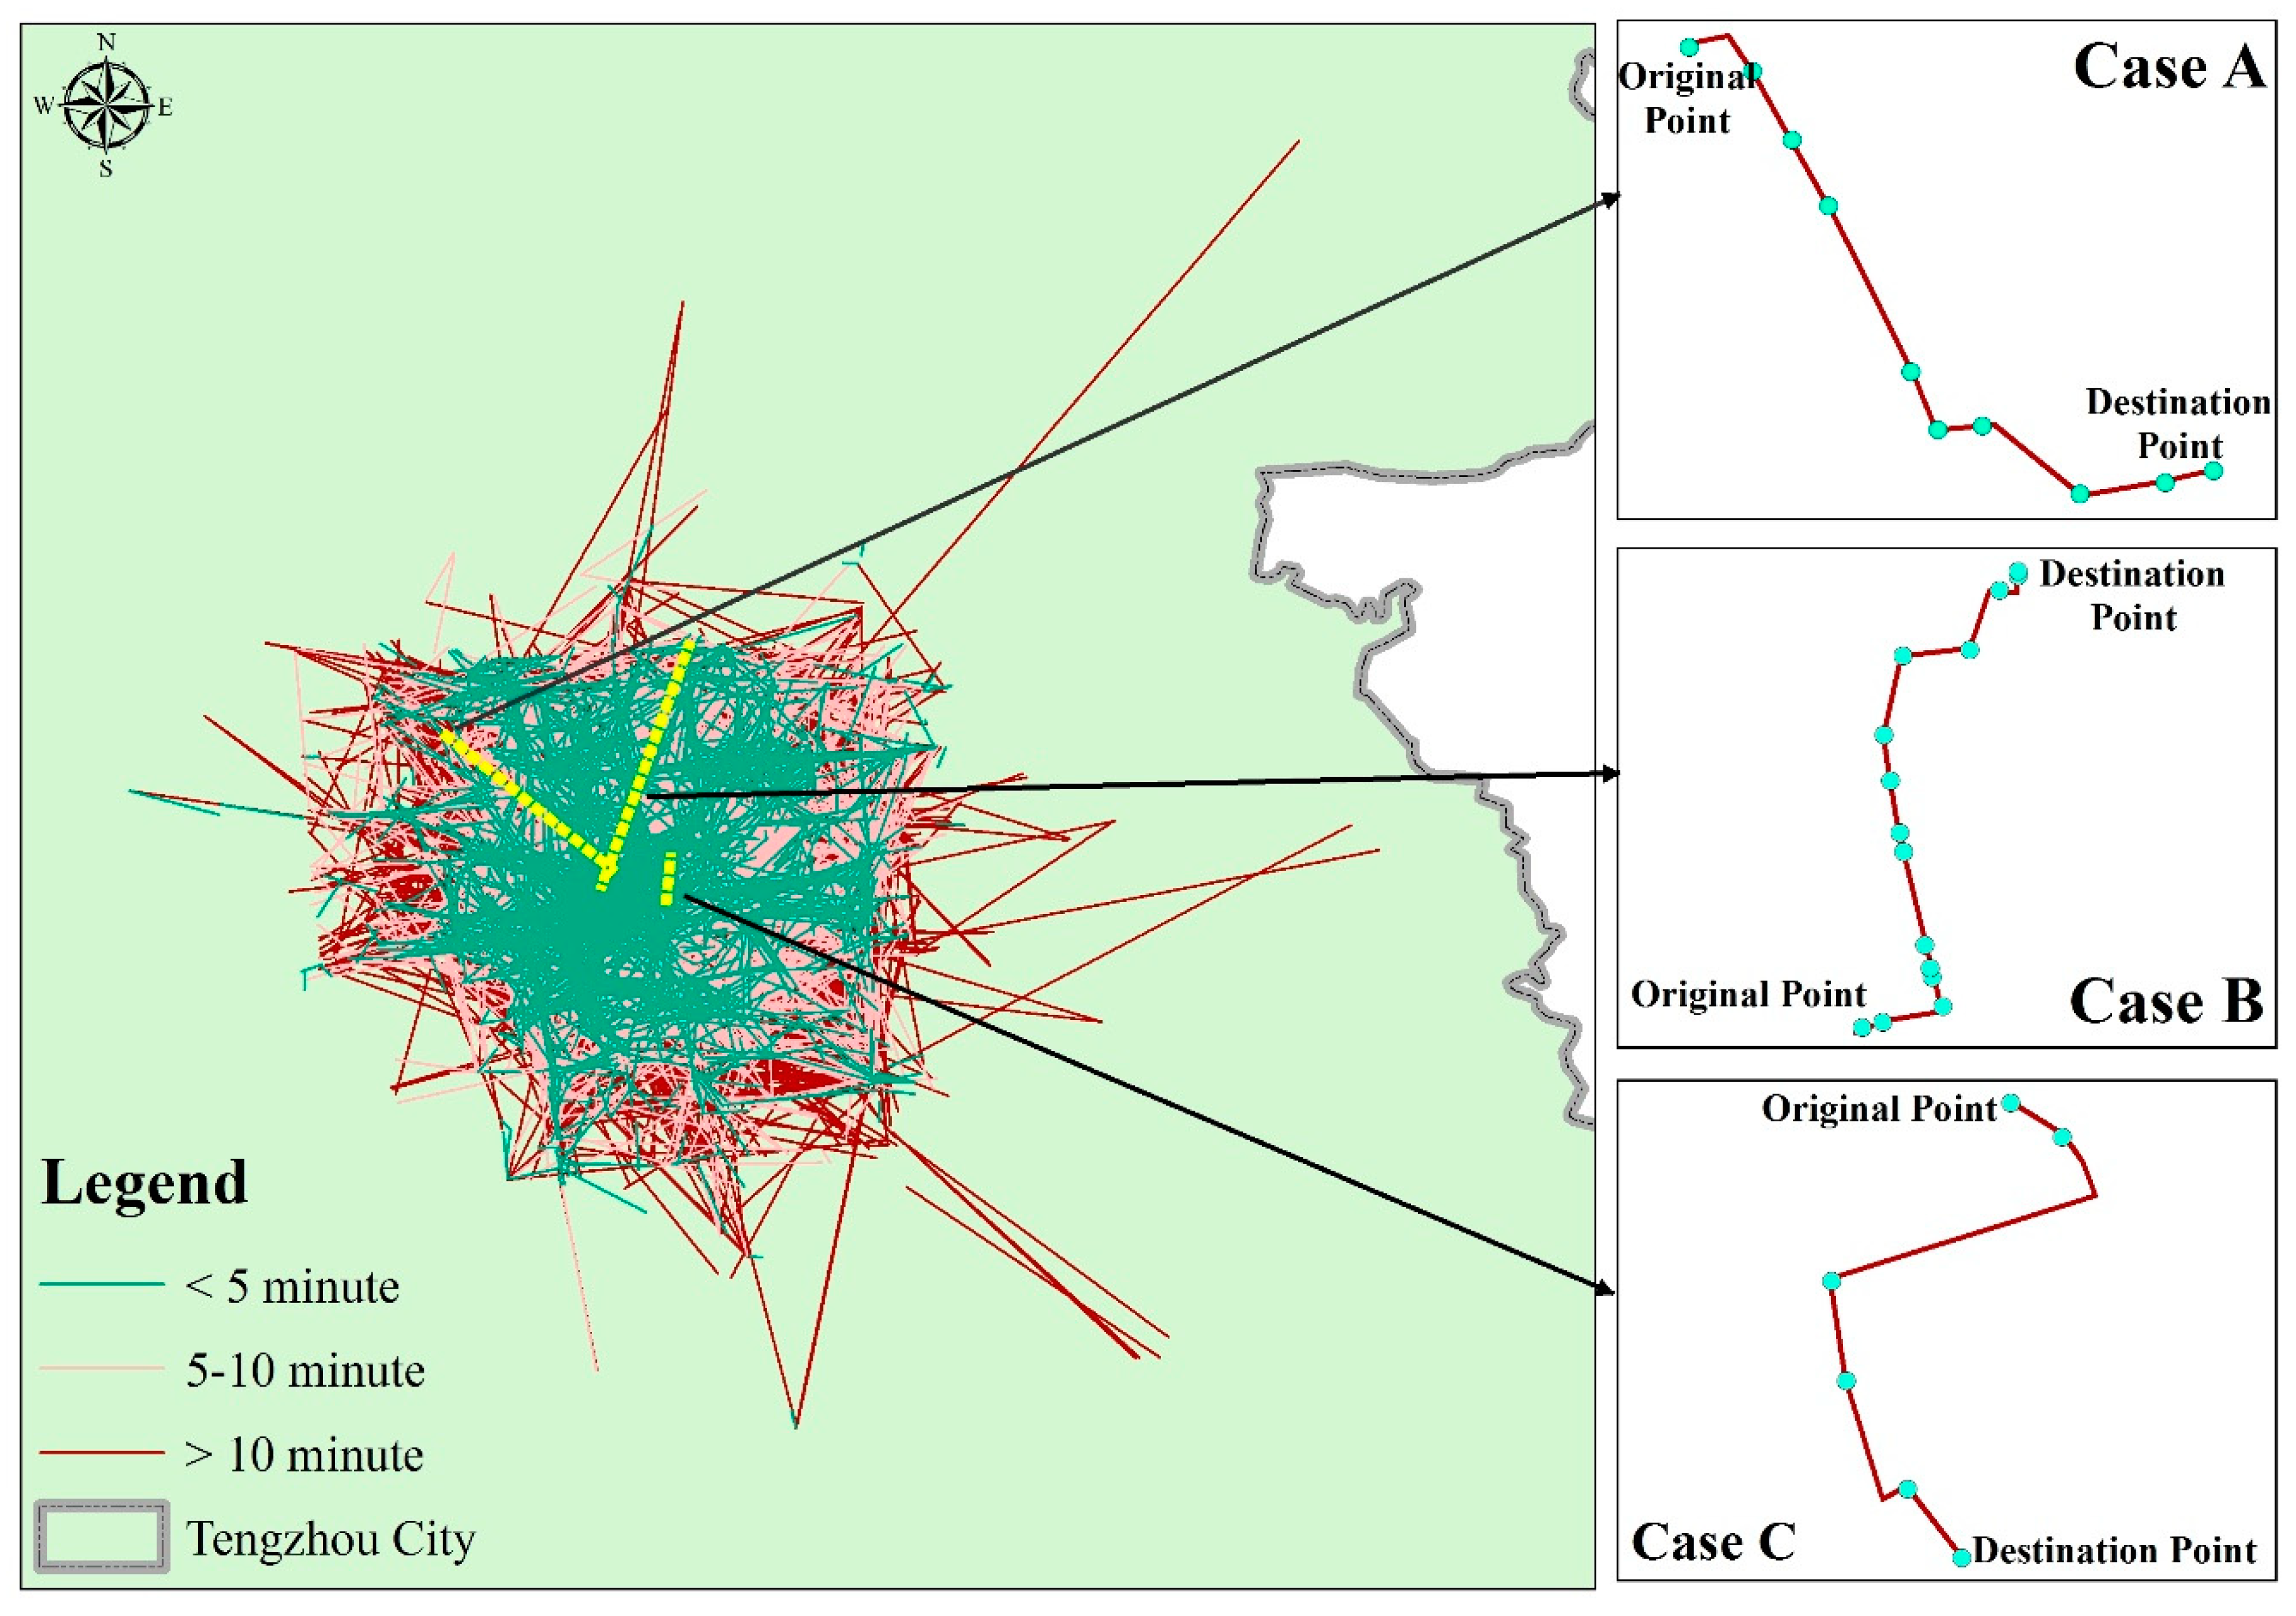
11178 valid ride trajectories were scrubbed from the week of disordered GPS trajectory data of shared e-bikes in Tengzhou. To better show the week-long commuting patterns in Tengzhou, the identified commuter travel was spatialized. Each line represents a riding trip (O-D points from origin to destination), riding time, riding distance and the ID of the shared e-bike in the attributes of the GIS layer. We spatialized the trajectory according to the time of the ride, as shown in
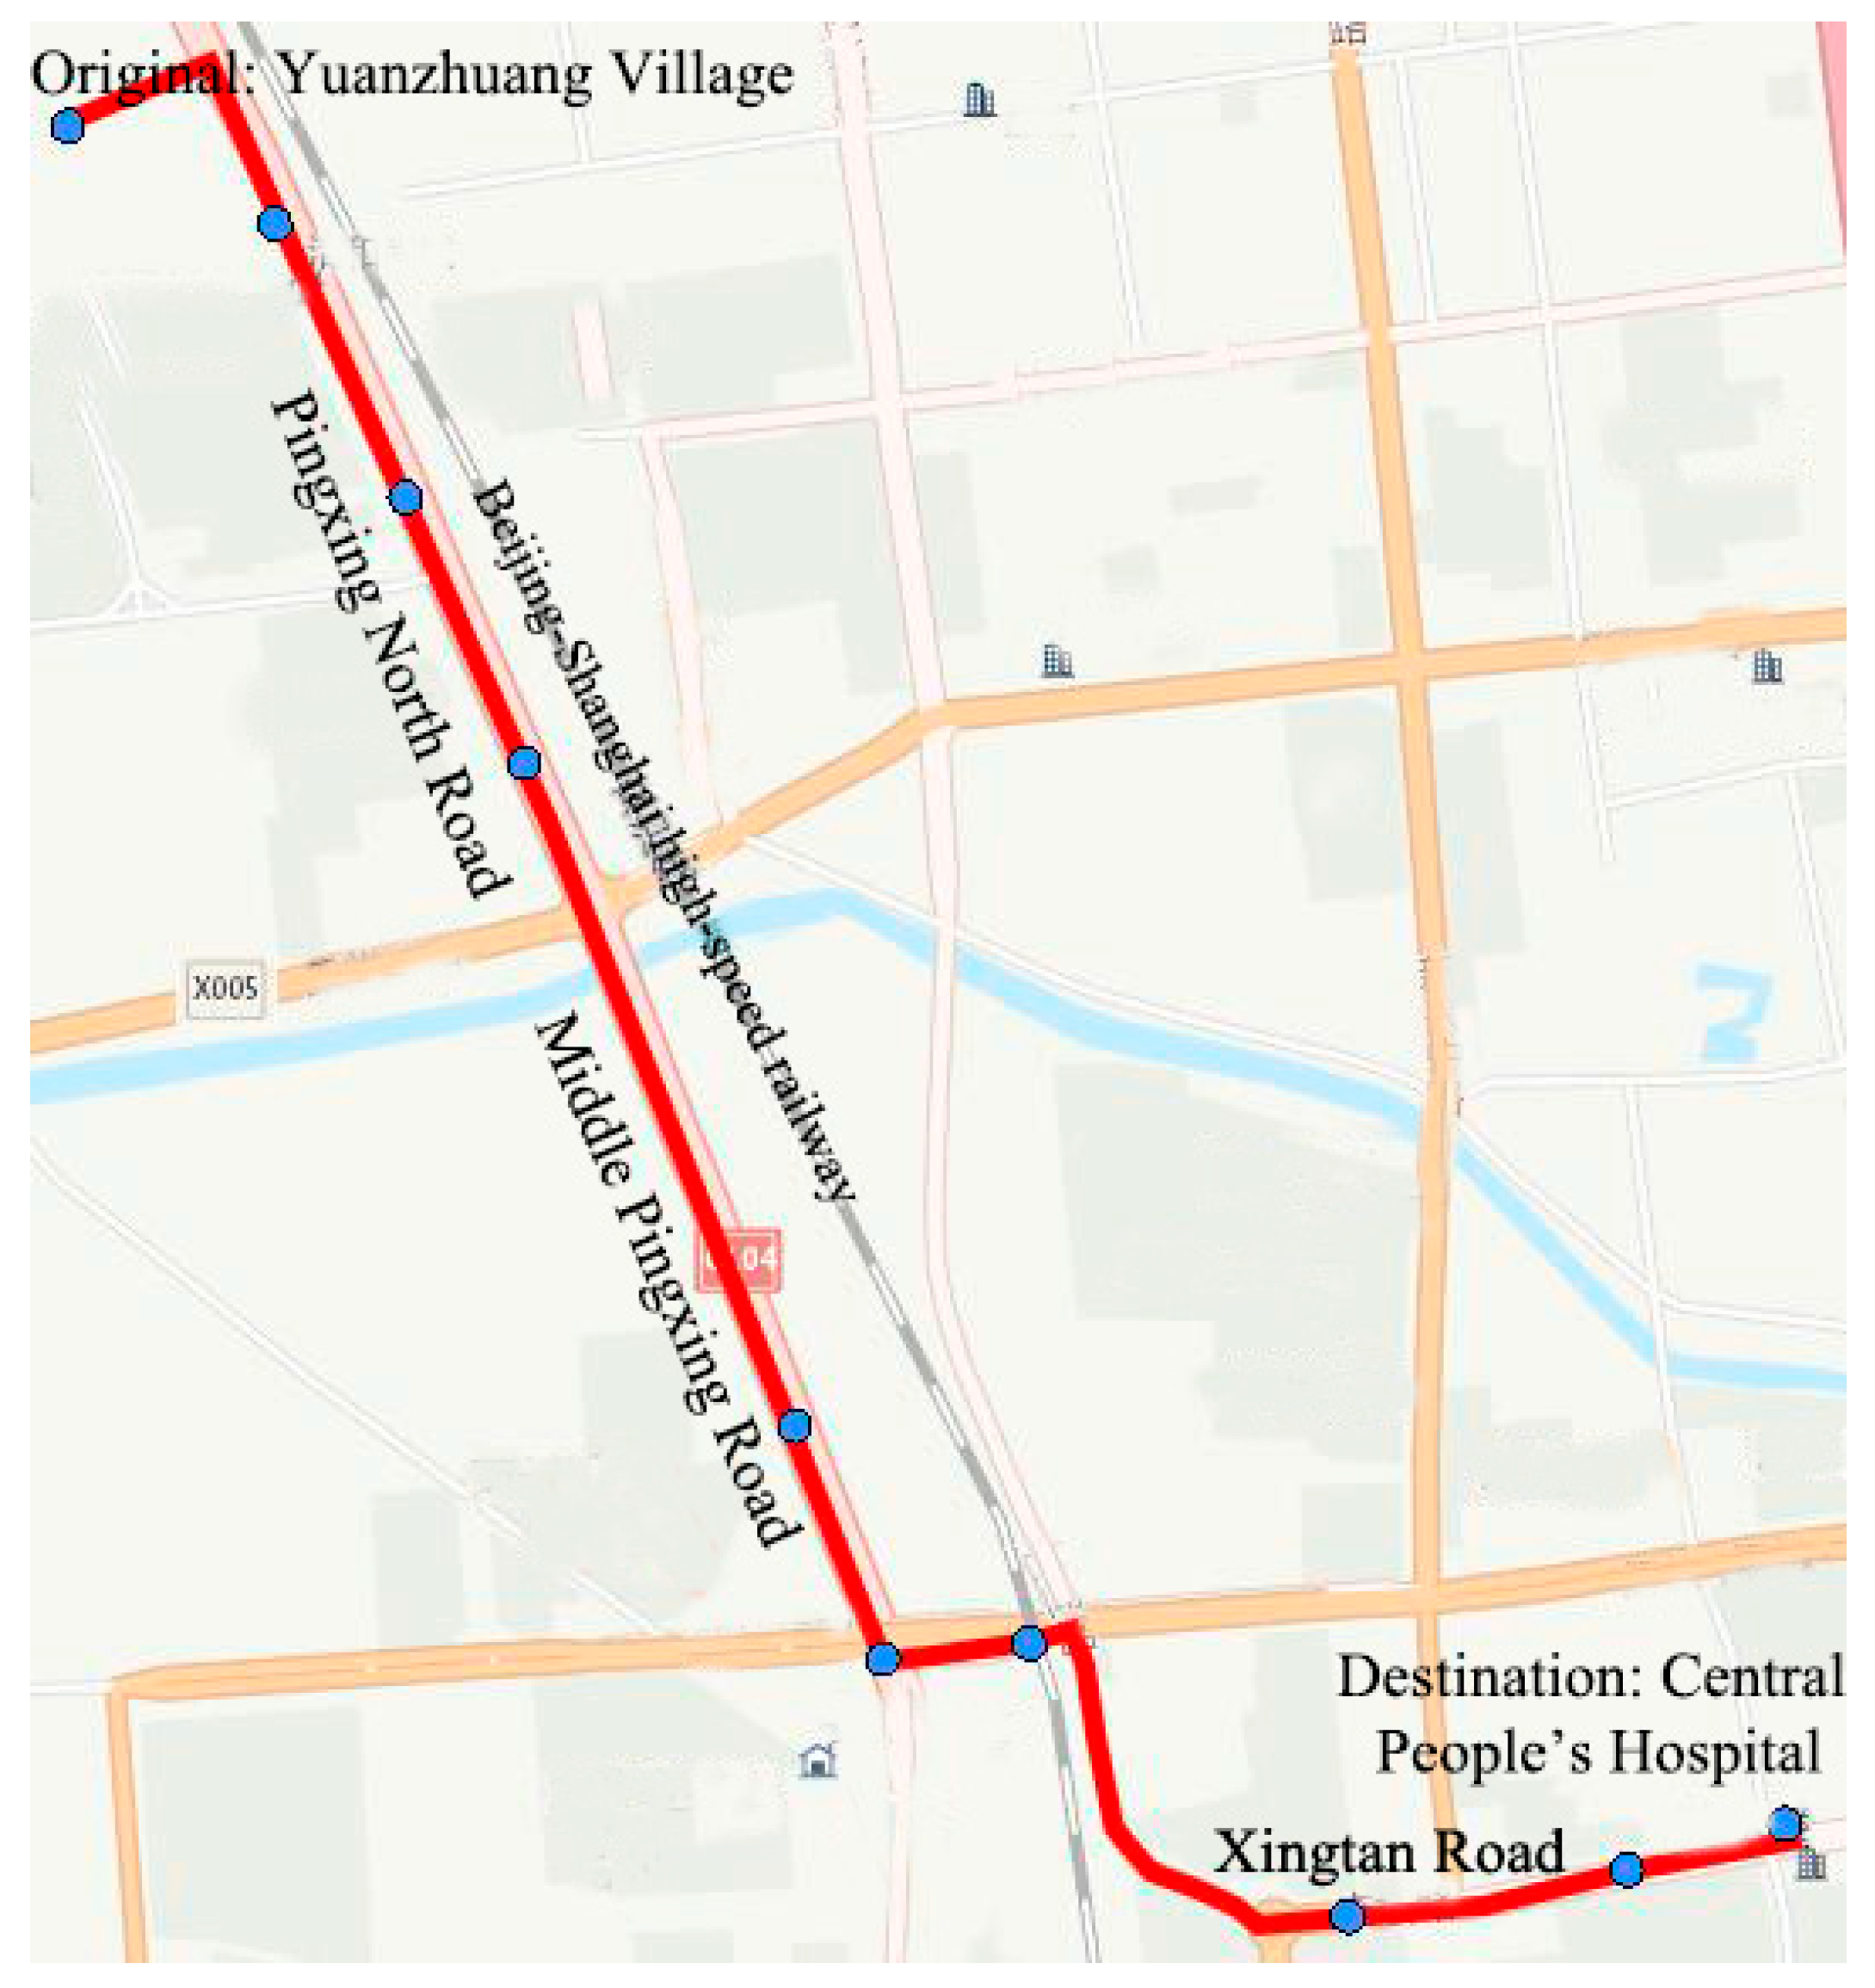
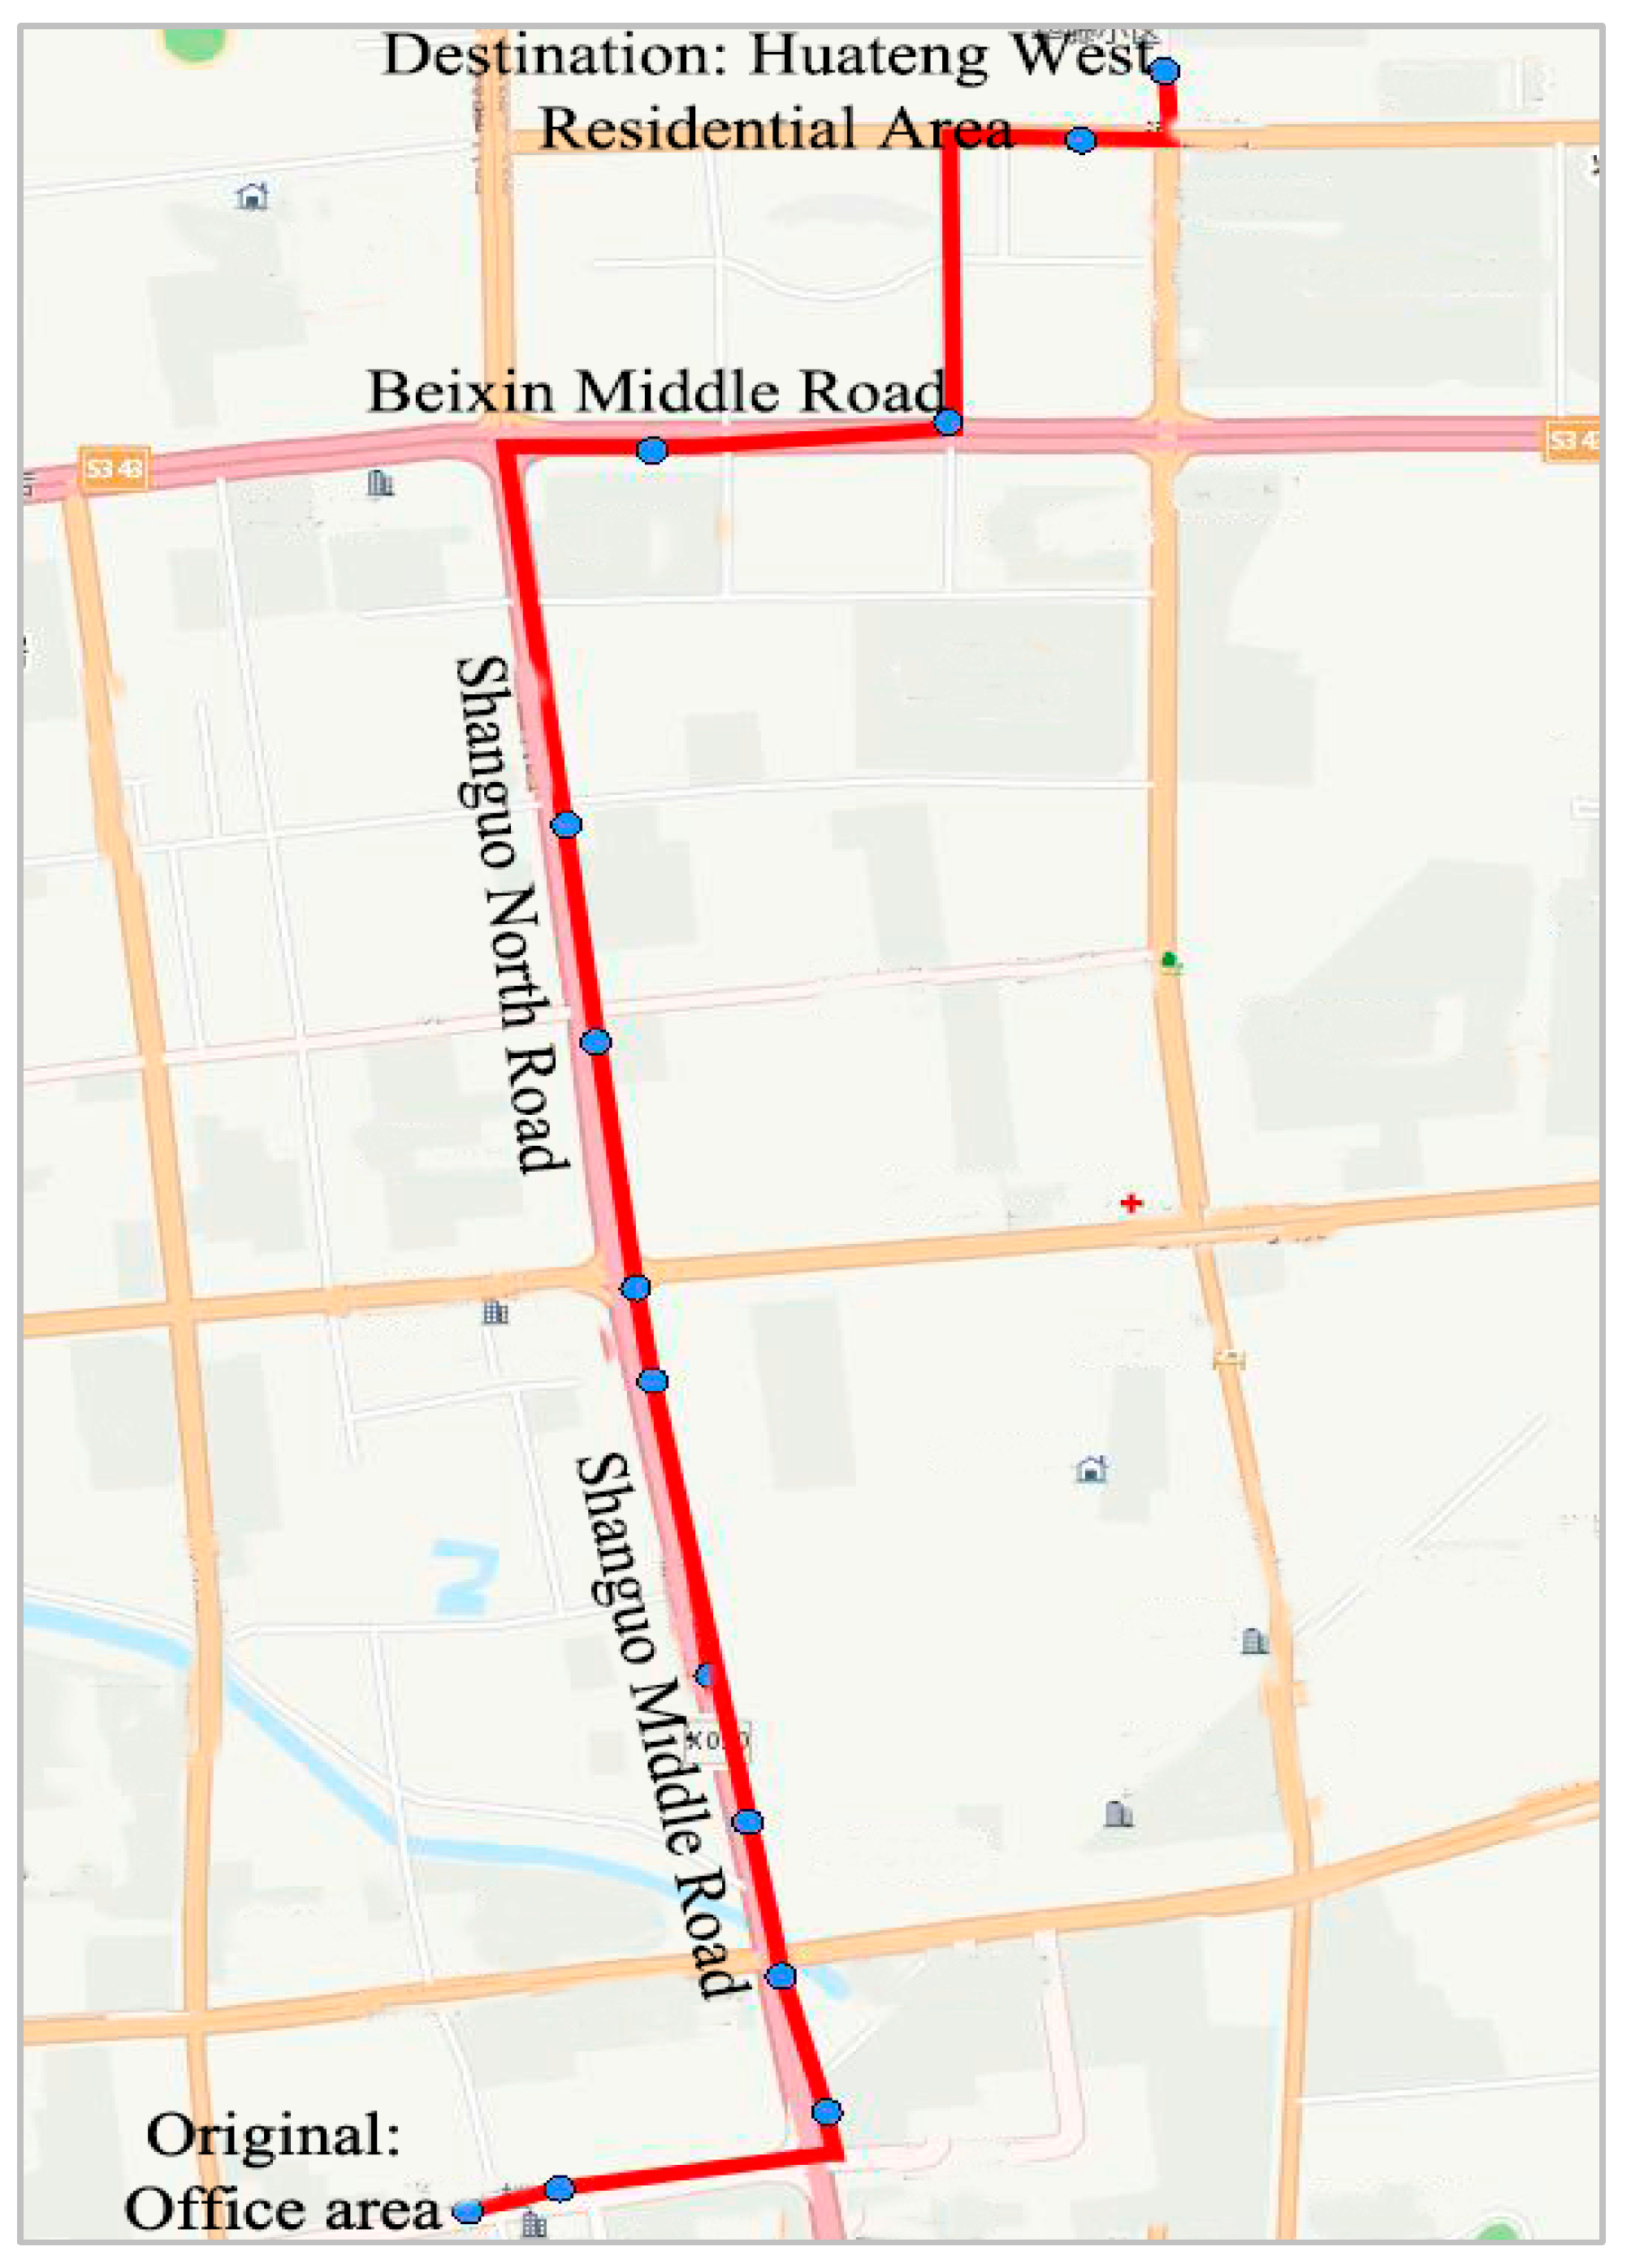
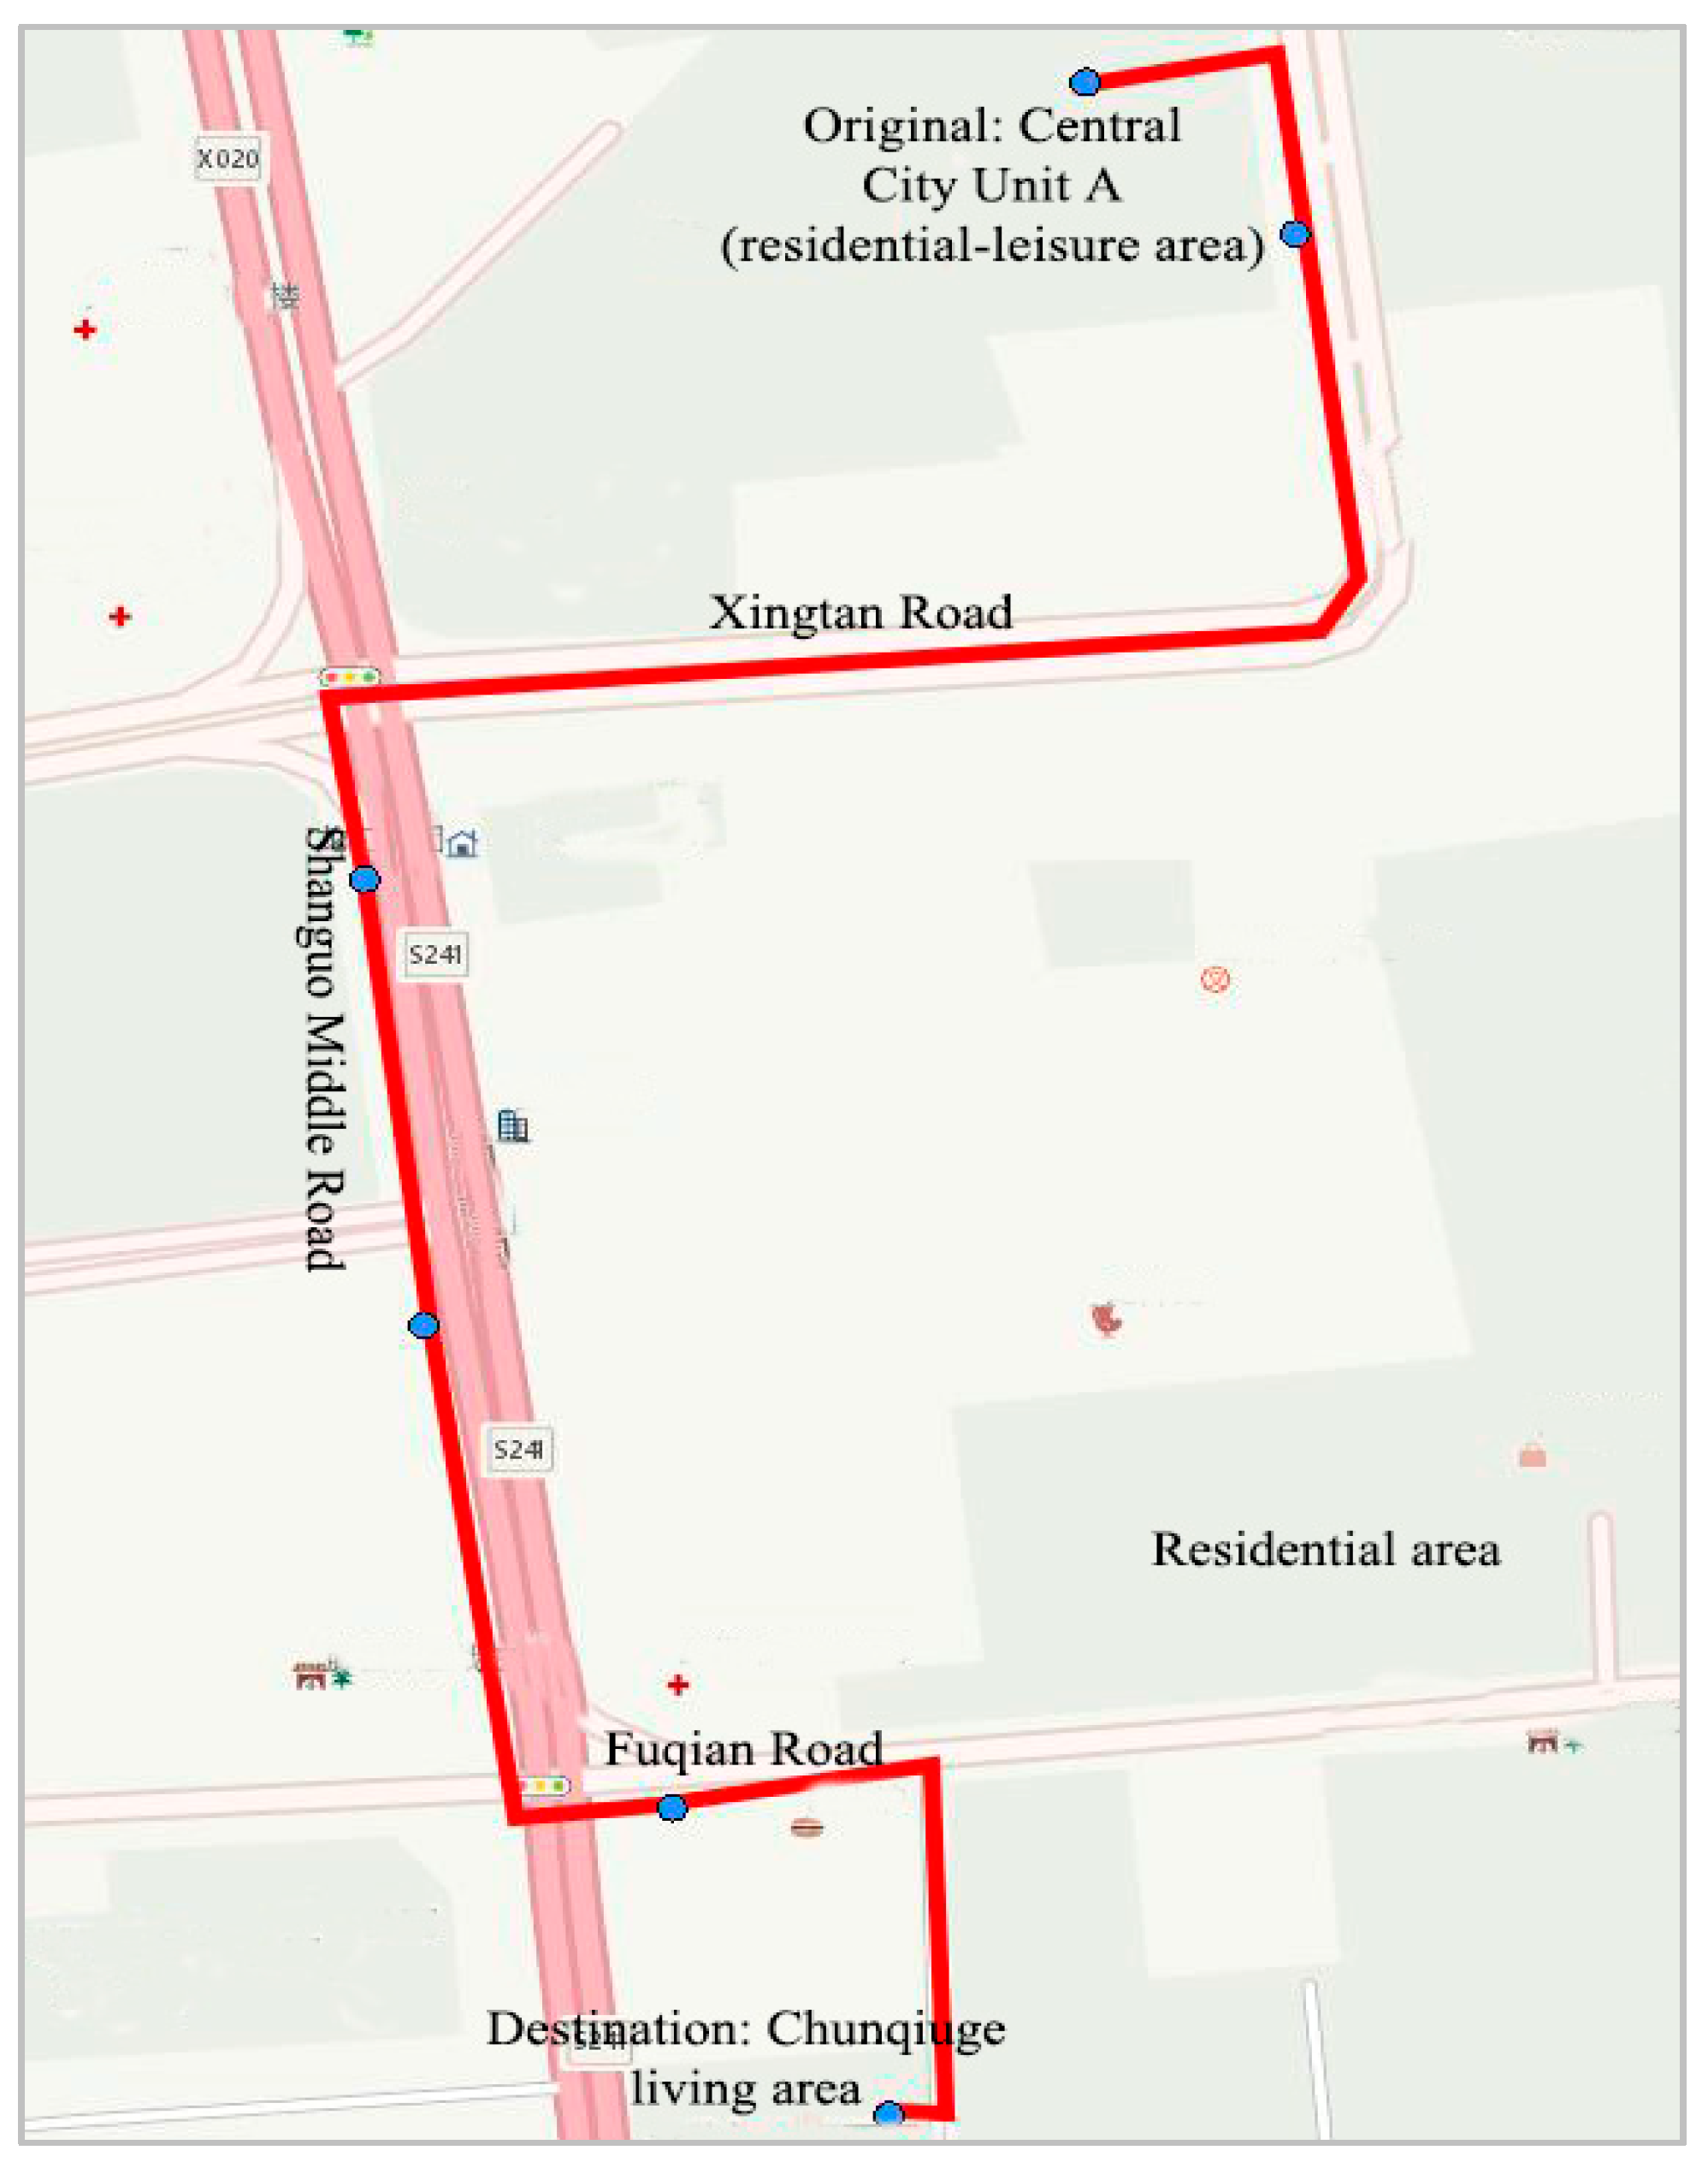
Figure 4. The statistics show that the rides with a riding time of five minutes or less account for 30.59%, rides from five to ten minutes comprised 36.60% and rides longer than ten minutes accounted for 32.81%. The short distance travels mainly occur in central areas in Tengzhou city, which is similar with the study in Beijing. Through statistical analysis, it is indicated that trip distance for each individual is mostly during from 2km to 10km, which is conform to electric bicycles’ service intention—making up for commuting demand of shared bicycle (usually within 2 km). Cases A, B and C shown in the three rectangles are amplifications of the cleaning trajectories of the yellow trips in Panel A, which were matched with Google Maps for validation analysis as described below. The reason for choosing these three cases are their commuting time, which represent three special moments—working time, off-work time and leisure time.
The sampling method was used to visually assess the matching between the experimental results and the road network to validate the accuracy of the cleaned trajectories and O-D points. The rationality analysis was performed by randomly sampling the scrubbed trajectory data and comparing these trajectory segments to the actual road network. A total of 100 travel trajectories were randomly sampled and 91 of these trajectories could be rationally matched to routes that are compatible with the actual road network, indicating that the method proposed for sparse trajectory GPS data is practicable.
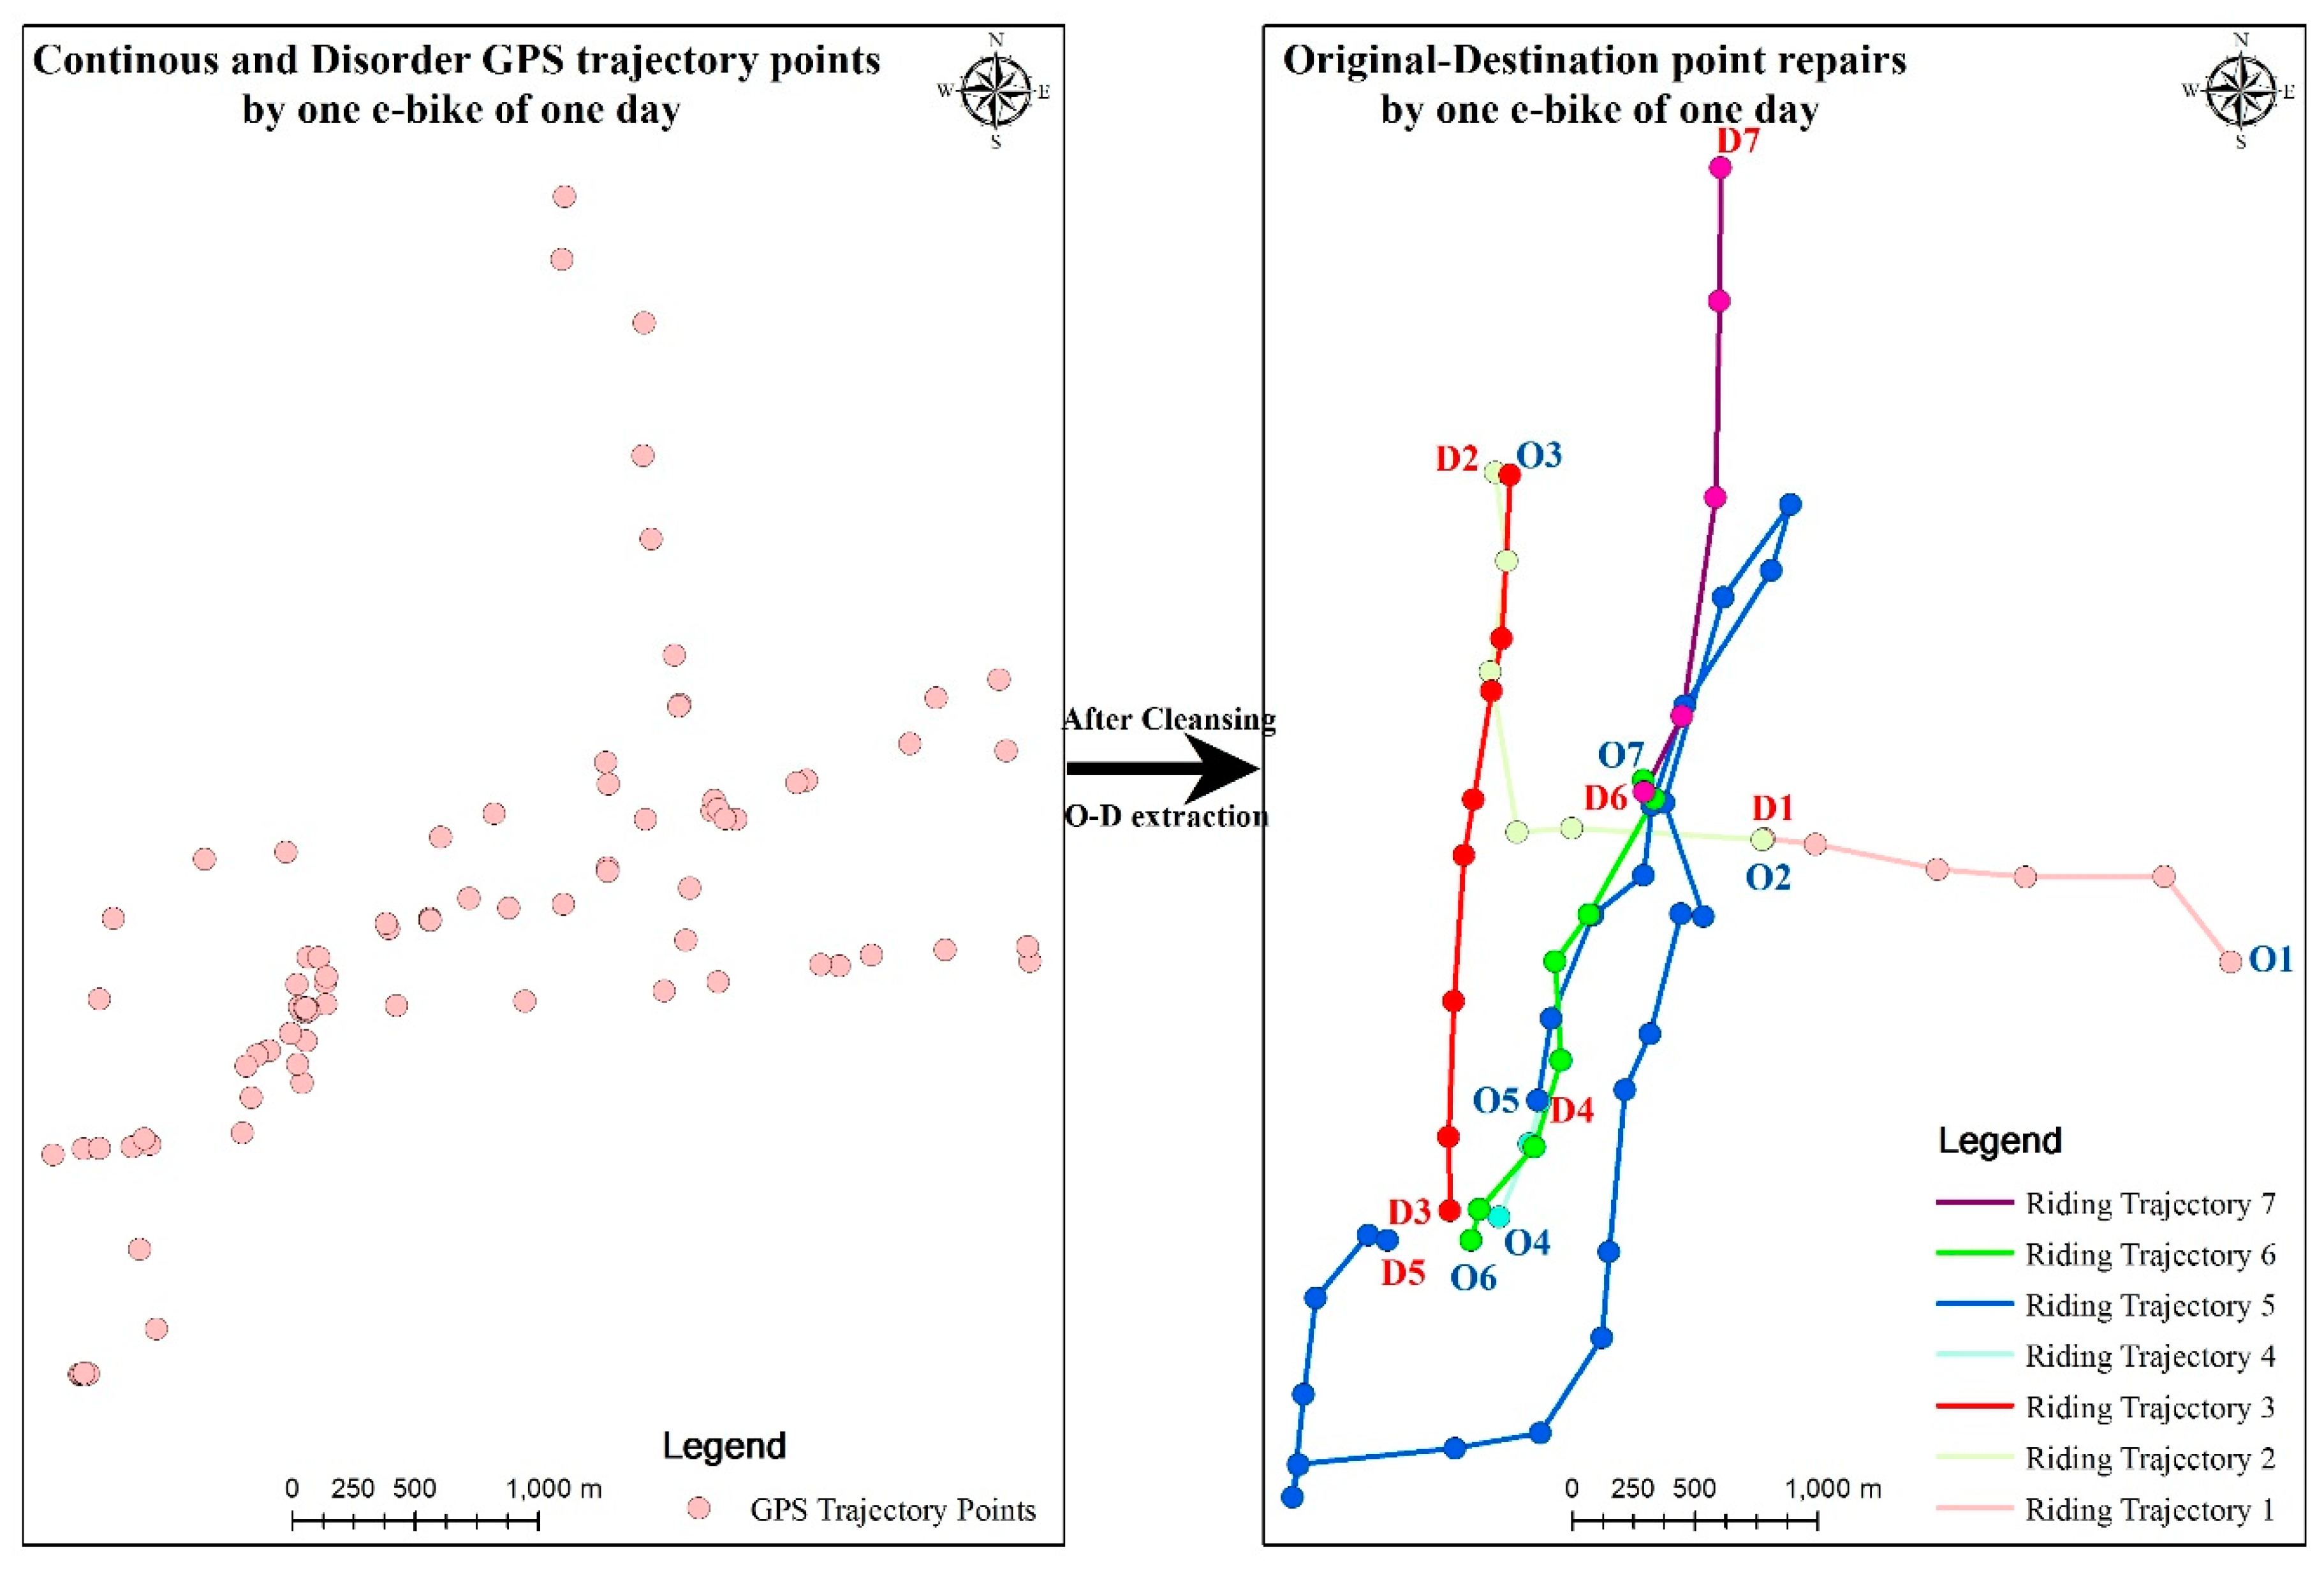
To verify the superiority of the trajectory data cleaning method proposed in this paper, the cleaned route information from one shared e-bike on one day were spatialized. As
Figure 5 illustrated, each individual trip with O-D pair (right figure) can be derived from continuous and disordered GPS trajectory points (left figure). On 23 May, this shared e-bike was used 7 times, producing seven different riding travels. It should be noted that, some previous destination is not matched with the latter origin, such as D3 and O4. This may due to that when batteries of shared e-bikes are wearing out or the e-bikes were parked where not allowed, managers would repair and reallocate these shared e-bikes (may be with different places), which would cause ‘false riding’ (the travel between D3 and O4). The ‘false riding’ does not represent real user travel, which needs to be taken out in a cleaning process, which resulted in the differences between D3 and O4. However, this situation just proved the necessity and correctness of the trajectory cleaning method proposed in this paper.
Three trajectories (Cases A, B and C in
Figure 4) in the morning (working hours), late afternoon (off-work hours) and night (leisure time) were randomly selected and visualized using the actual road network in Google Maps.
Figure 6 describes the cleaned route information in red lines and the matching with the road network. Based on the actual road information of this route, the scrubbed trajectory segment is theoretically compatible with the moving object departing on the 25th of May at 07:03am from Yuanzhuang village and traveling along Pingxing North Road, Middle Pingxing Road and Xingtan Road before arriving at Tengzhou Central People’s Hospital at 07:15 am.
Figure 7 illustrates the cleaned route information of Case B in red lines and the matching of this trajectory with the road network. Based on the matching between the extracted trajectory segment and the road network, Case B is theoretically compatible with a moving object departing near an office area in Tengzhou (the Tengzhou Bureau of Education, Tengzhou No. 1 Middle School and Tengzhou Central People’s Hospital are all nearby), traveling along Xingtan Road, Shanguo Middle Road, Shanguo North Road and Beixin Middle Road before arriving at its destination, the Huateng West District.
Figure 8 shows the cleaned route information of Case C in red lines and its matching to the road network. Based on the matching between the trajectory and the road network in Google Maps, the extracted trajectory is theoretically compatible with a moving object departing from the Central City A Unit Chun (residential and leisure area) and traveling along Xingtan Road, Shanguo Middle Road and Fuqian Road before arriving at Chunqiuge Unit at 20:33 pm.
In summary, our method for O-D pair extraction and cleaning from sparse trajectory data, which is based on the time difference, distance and average speed between two sample points and the instantaneous speed of each sample point, was shown to be viable. This method is especially suitable for continuous trajectory point data that do not possess riding status attributes.
6. Conclusions
Data cleaning and O-D point pair extraction are prerequisites for the analysis of urban spatial structures and human mobility characteristics based on LBS data. Although studies have been conducted using the spatiotemporal data of mobile phone signals, taxis and shared bicycles, there are no reports in the literature on shared e-bike data. Due to the limits of the bicycle battery and GPS device signal, the raw data quality of shared e-bikes is inherently sparse, characterized by noncontiguous, heterogeneous GPS points and a lack of riding status information, which resulted in the inapplicable of current traditional cleaning method to shared e-bike data. The above issues motivated this research, based on the characteristics of shared e-bicycle trajectory data in Tengzhou city, a novel method for data cleaning and O-D point pair extraction that is suitable for the trajectory data of shared e-bikes was first presented in this study. The conclusions are as follows:
(1) By using indices of the time difference, distance and average speed between two adjacent sample points and the instantaneous speed of each sample point, the classification of the endpoints of two adjacent trips from continuous and stateless raw data can be identified;
(2) During the GPS trajectory data cleaning procedure, determination and adjustment of the threshold value of the cleaning index should be combined with the actual road network to ensure the reasonableness of the cleaning results;
(3) The method proposed in this paper incorporates actual road network data and is applicable for data cleaning and O-D pair extraction from sparse trajectory data that lack attribute information (such as riding status information) and with nonuniform GPS information. The analysis of the experimental results of the week-long trajectory data of shared e-bikes in Tengzhou showed that our method has an extraction accuracy of 91% by assessing 100 randomly sampled trajectories. Results clearly reflected major spatiotemporal e-bicycle flow patterns in Tengzhou.
The proposed method is designed to maximally restore the trajectories corresponding to the lost data, which can be applied to other sparse trajectory data. The results of this research are useful for policy managers in planning future e-bike stations to better rebalance e-bike service. More importantly, based on the results data of this study and some methods like clustering method and spatial-temporal statistical method, human travel behavior and urban hot functional zones can be excavated, which provide useful information for transportation management and land use planning. Finally, this research is important for the connection between shared e-bikes and other public transports and provides a better theoretical basis for urban green transport development. However, this research has also limitations. For instance, the threshold is usually set as a single value empirically. In addition, due to the characteristics of shared e-bike trajectory data, fragmentation-induced data loss is inevitable. Finally, the valid trips extracted from the experimental dataset were distributed in a nonuniform manner, suggesting that the trips are also affected by other constraints and factors. In future work, we will perform the interpolation and cleaning/extraction of sparse data that lack attribute information using methods such as similarity analysis, incorporate factors such as population characteristics and urban land use and conduct algorithm validation using field observations.
