Article

Landslides Susceptibility Assessment Based on GIS Statistical Bivariate Analysis in the Hills Surrounding a Metropolitan Area

1
Department of Terrestrial Measurement and Cadastre, Faculty of Civil Engineering, Technical University of Cluj-Napoca, 400020 Cluj-Napoca, Romania
2
Faculty of Land Reclamation and Environmental Engineering, University of Agronomic Sciences and Veterinary Medicine Bucharest, 011464 Bucharest, Romania
3
Faculty of Geography, Babeş-Bolyai University, 400006 Cluj-Napoca, Romania
4
Cluj-Napoca Subsidiary Geography Section, Romanian Academy, 400015 Cluj-Napoca, Romania
5
Faculty of Mines, University of Petrosani, 332006 Petrosani, Romania
6
Faculty of Horticulture, University of Agricultural Sciences and Veterinary Medicine of Cluj-Napoca, 400372 Cluj-Napoca, Romania
7
Geography Department, Faculty of Philosophy, University of Montenegro, 81400 Niksic, Montenegro
*
Author to whom correspondence should be addressed.
Sustainability 2019, 11(5), 1362; https://doi.org/10.3390/su11051362
Submission received: 29 January 2019 / Revised: 26 February 2019 / Accepted: 28 February 2019 / Published: 5 March 2019

Abstract

:
In the highly populated analysed territory, the expansion of the construction zones and the pressure imposed on the slopes by the housing and transport infrastructure led to the appearance and reactivation of mass movement processes that affects the population and the environment. The purpose of this study consist in applying the principles of bivariate statistical analysis in order to determine the dynamic potential of a territory, taking into account the statistical relationship between the independent variables represented by predisposing and triggering factors of landslides (slope, geology, land use etc.) and dependent variables, in this case: landslides. The identification of the degree of validation of the results was determined by calculating the AUROC (Area under the Receiver Operating Characteristic) value, whose value of 0.854 highlights the representativeness of the chosen model. The analysis of landslides susceptibility highlights the inclusion of the territory represented by the hills surrounding Cluj-Napoca metropolitan area, Romania, on the classes of spatial occurrence of these processes.

1. Introduction

Landslides along with erosion processes represent natural hazards with a large area of manifestation in Romania [1,2,3], affecting the transport and removing significant land areas from the category of production lands, which makes it necessary to identify measures to mitigate the negative effects and reintegrate these territories into useful build-up areas and infrastructure, as well as productive agricultural circuit [4,5]. Landslides are part of the gravitational processes that occur when the steady state of the slopes is affected as a result of overgrowth of the geological substrate of clay and marl deposits due to a period of abundant precipitation or due to seismic movements [6,7]. Besides these natural causes, important factors are the anthropogenic interventions in the territory by overburdening slopes accentuated by construction, massive deforestation and poor management of agricultural land [8,9,10,11]. In order to identify the susceptibility of landslides, a series of GIS spatial analysis models have been implemented the most statistically valid results being the probabilistic ones [12,13,14,15]. A different toolbox made in the GIS environment was proposed so that it is facilitated the use of such a model for different test areas [16,17,18].
The probability map of landslides occurrence that can be used in spatial planning studies is obtained by taking into account a complex database that includes both triggering factors (e.g., rainfall) and predisposing factors (e.g., geology, slope gradient) [19,20,21]. In Romania, the factors which compound a specific database are: the lithological coefficient represented by the geology of the analyzed region; the geomorphologic coefficient that takes into account the slope and altitude of the relief; the forest and anthropic coefficient depending on the land use and the triggering factors; the hydro-climatic coefficient taking into account the amount of rainfall available to the analysed region; the seismic coefficient modelled according to the regionalization seismic activity of Romania on the Medvedev-Sponheuer-Karnik (MSK) scale [22,23,24]. This database is regulated at national level by Government Decision 447/2003—Methodological Norms regarding the Method of Development and Protection of Natural Hazard Maps at Landslides.
This research aimed at assessing the landslide susceptibility for anthropogenic activities in a perimeter where due to the extension of the city, new buildings are constructed in locations mostly on slopes, vulnerable to landslides. The susceptibility of the area was studied based on adequate indicators and methodologies adapted to the urban space of Cluj-Napoca, Romania.

2. Materials and Methods
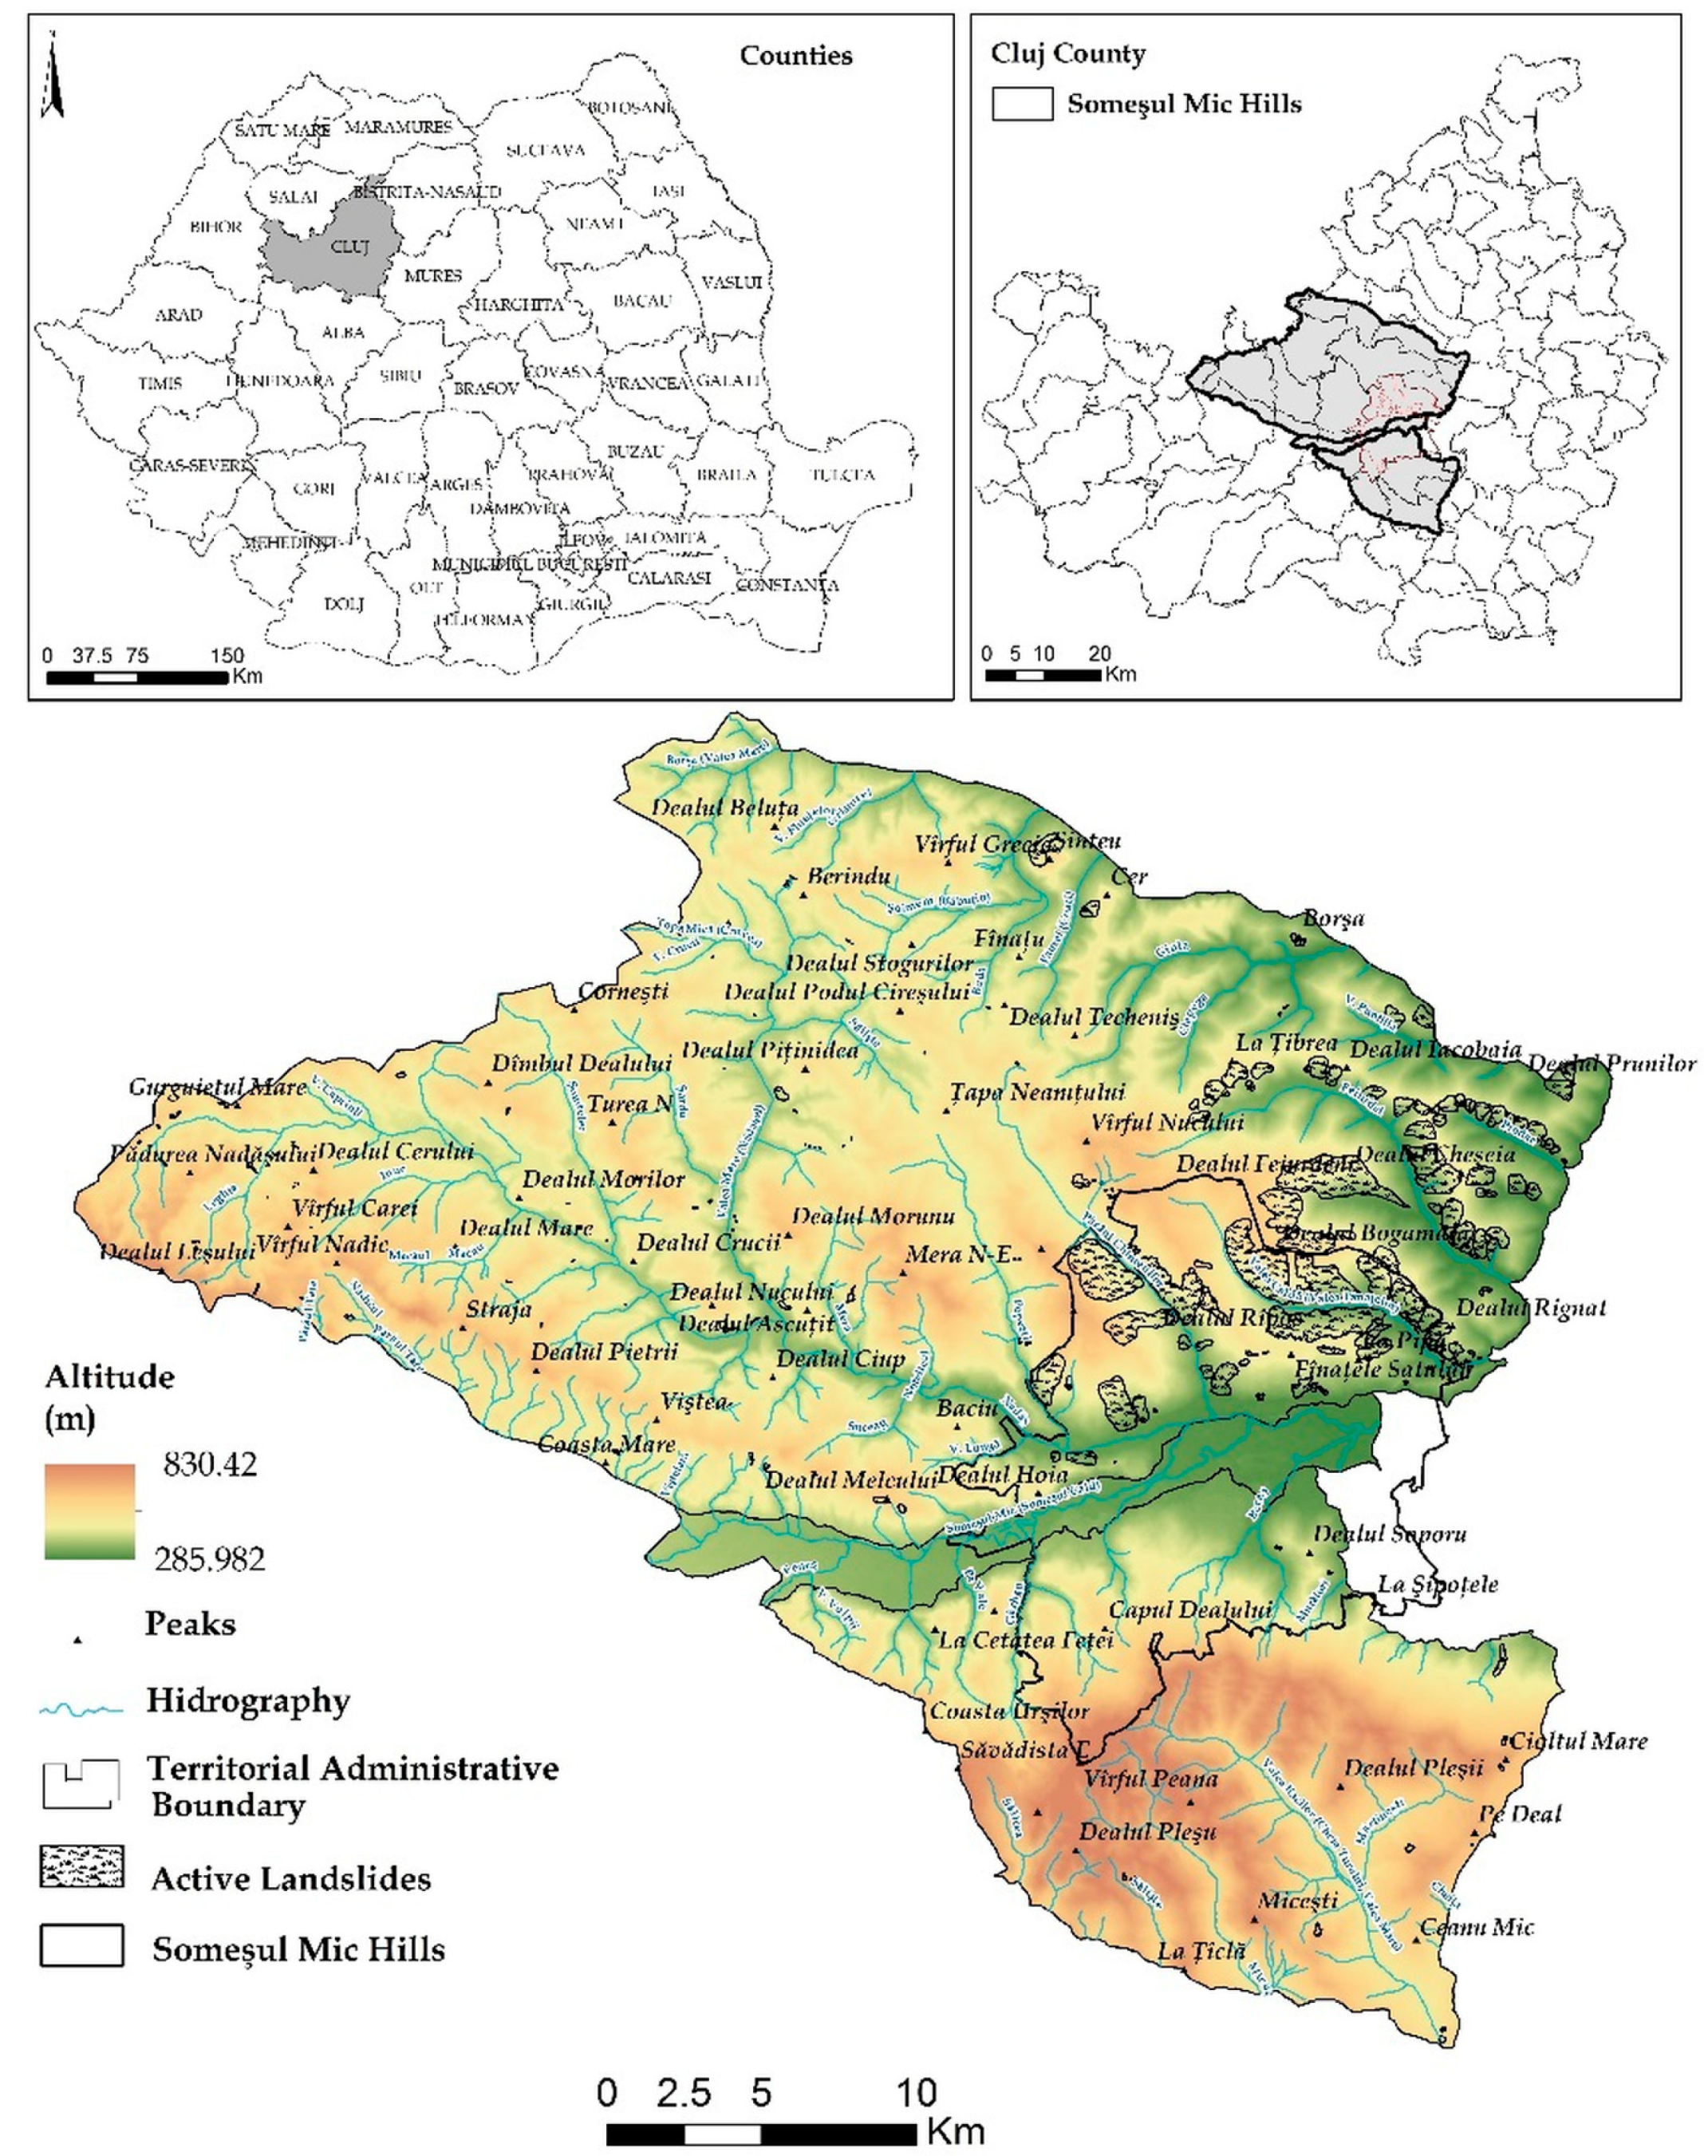
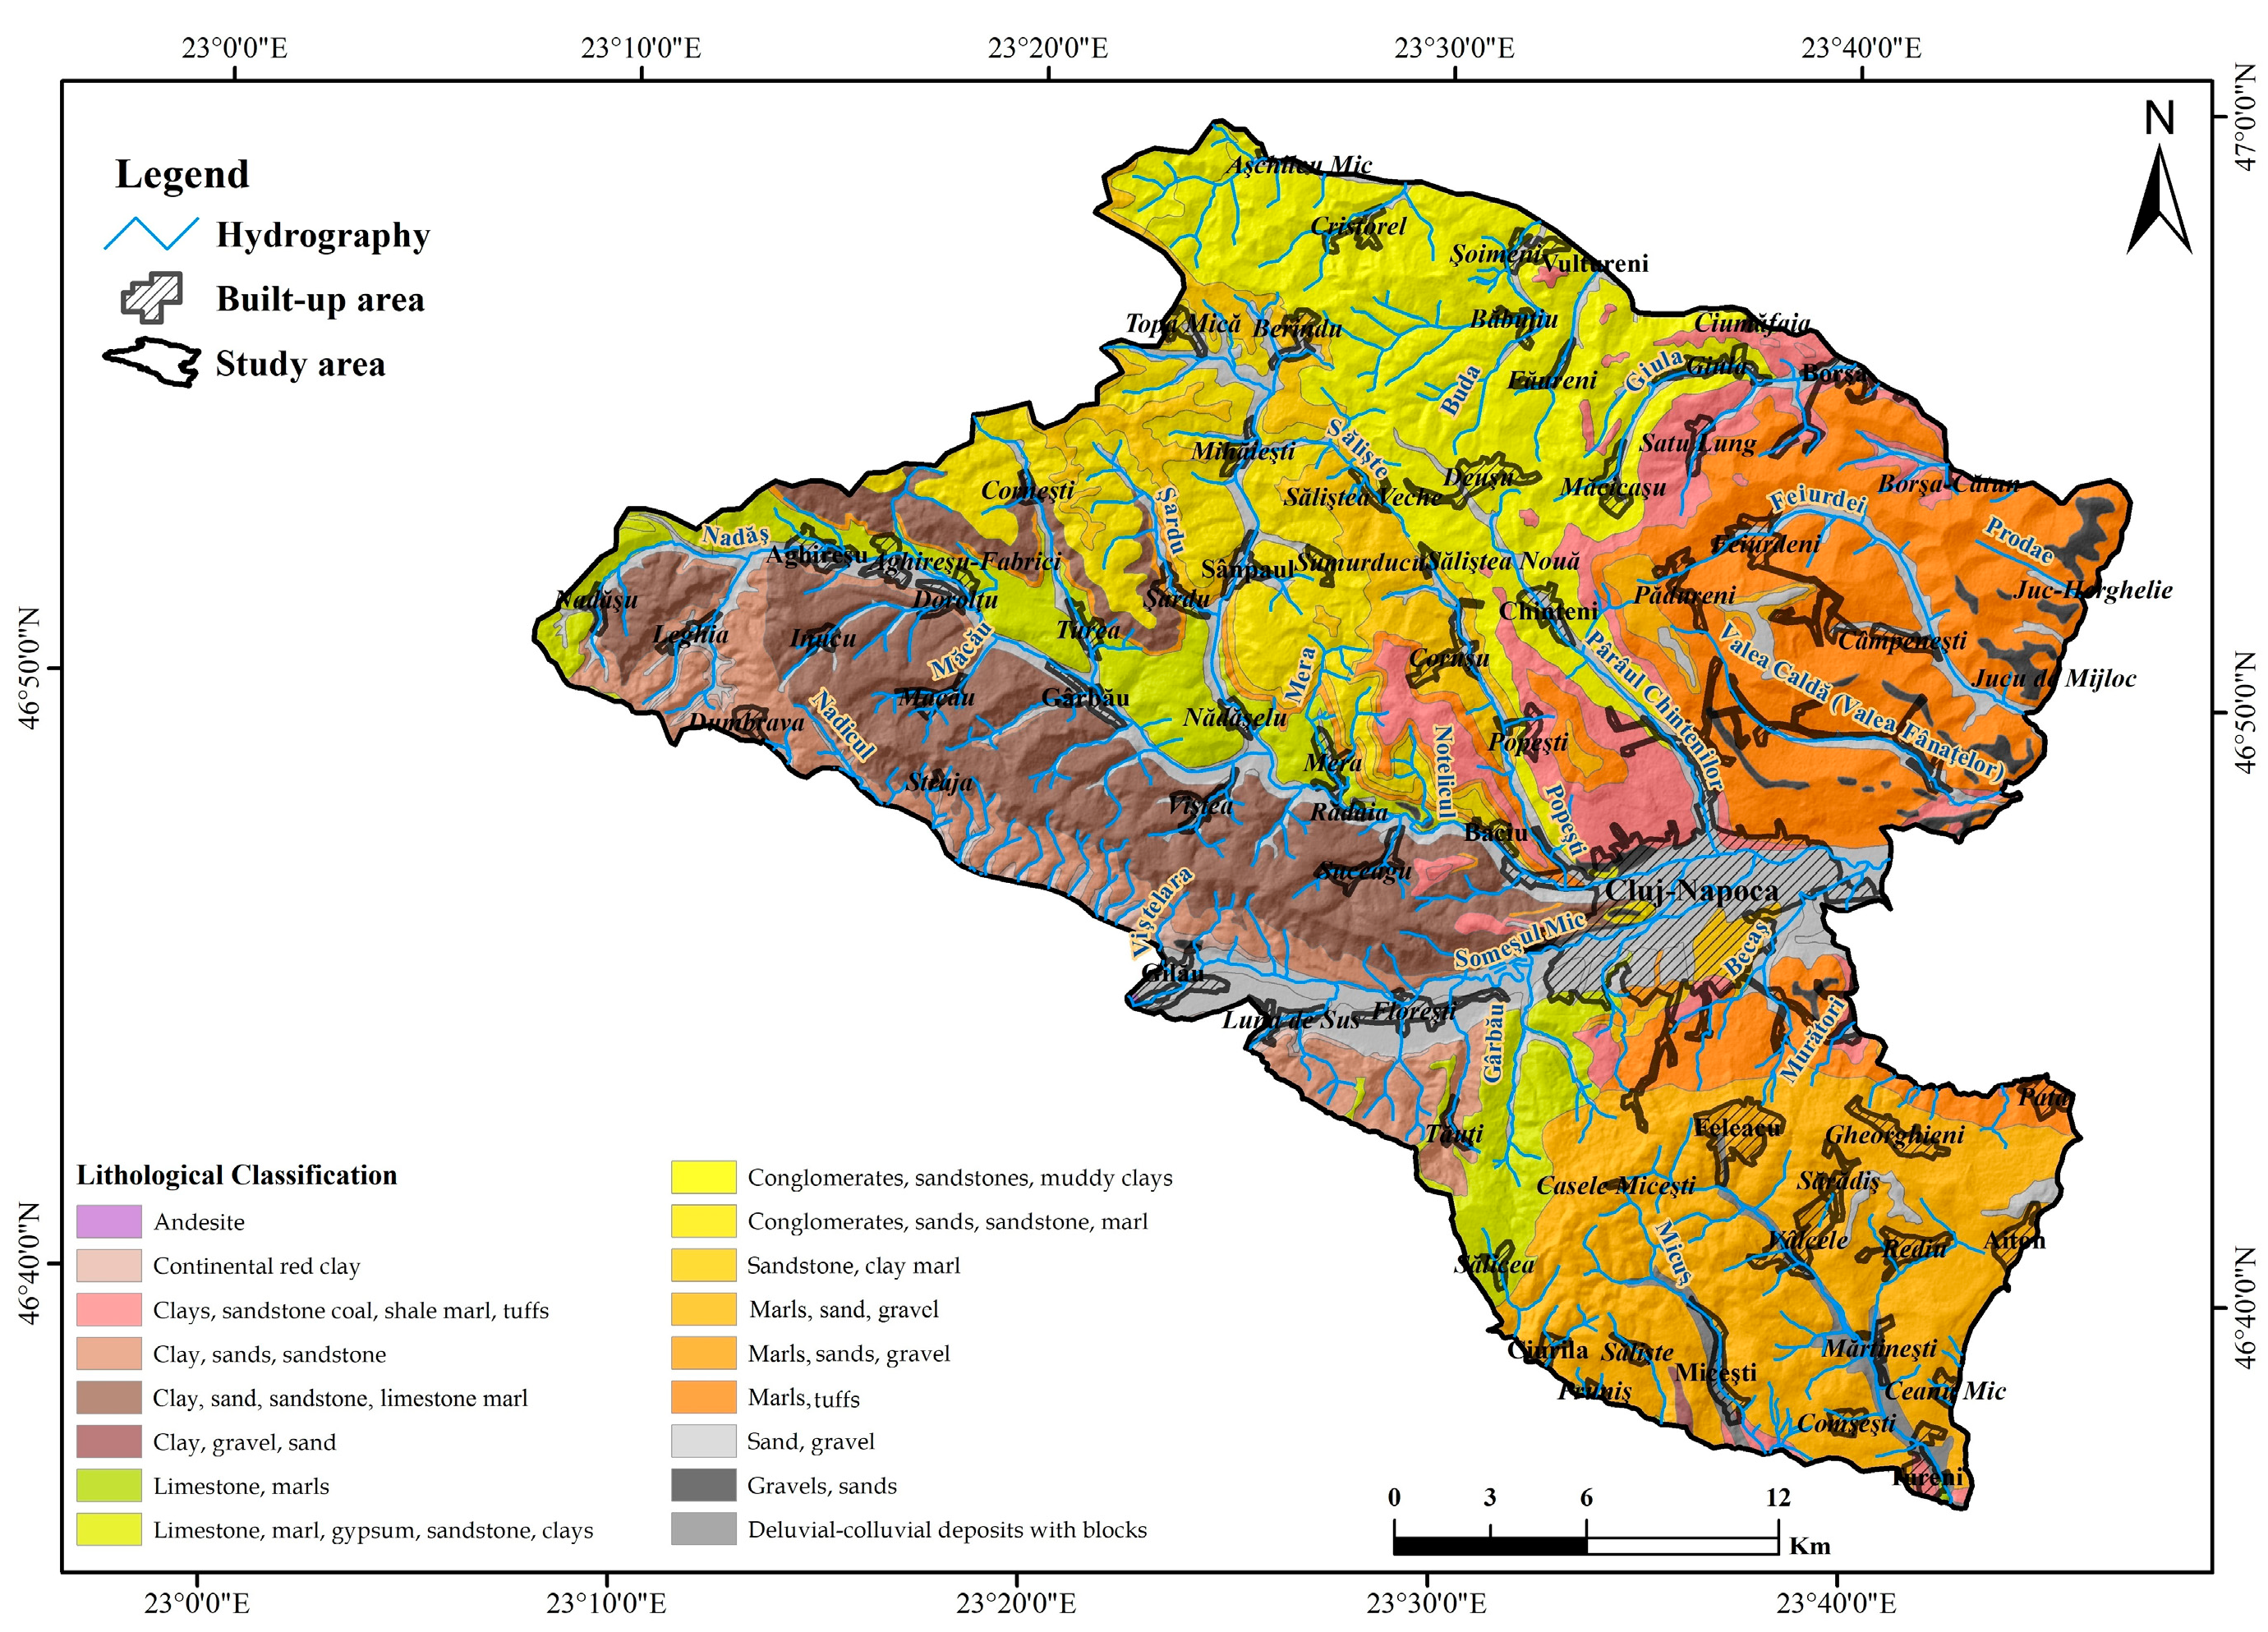
2.1. Study Area

The study area is represented by the hills surrounding Cluj-Napoca metropolitan area, located in the county of Cluj, in the eastern sector of the Depression of Transylvania, Romania (Figure 1) with an area of 1041 km2. The altitude difference of the analysed region is 545 m, varying between 285 m, specific to the lower section of the Somes River bed and 830 m specific to the high hills. The elevated character of the analysed area is highlighted both from the point of view of the specific altitudes and of the slopes having an average value of 7.8° with a maximum of 45.3° which implies a high and dynamic potential. The diverse geology of the region includes marls, sands, gravel, clay, gypsum and sandstone, muddy clays, bituminous marls etc., which due to the increased fragmentation of the secondary hydrographic network, lead to the existence of 29 sloping areas of active land. This database of land-based landslides and recent satellite imagery is the basis for the implementation of the model for determining the likelihood of landslides, so it is necessary to produce a complete and current database [25,26].

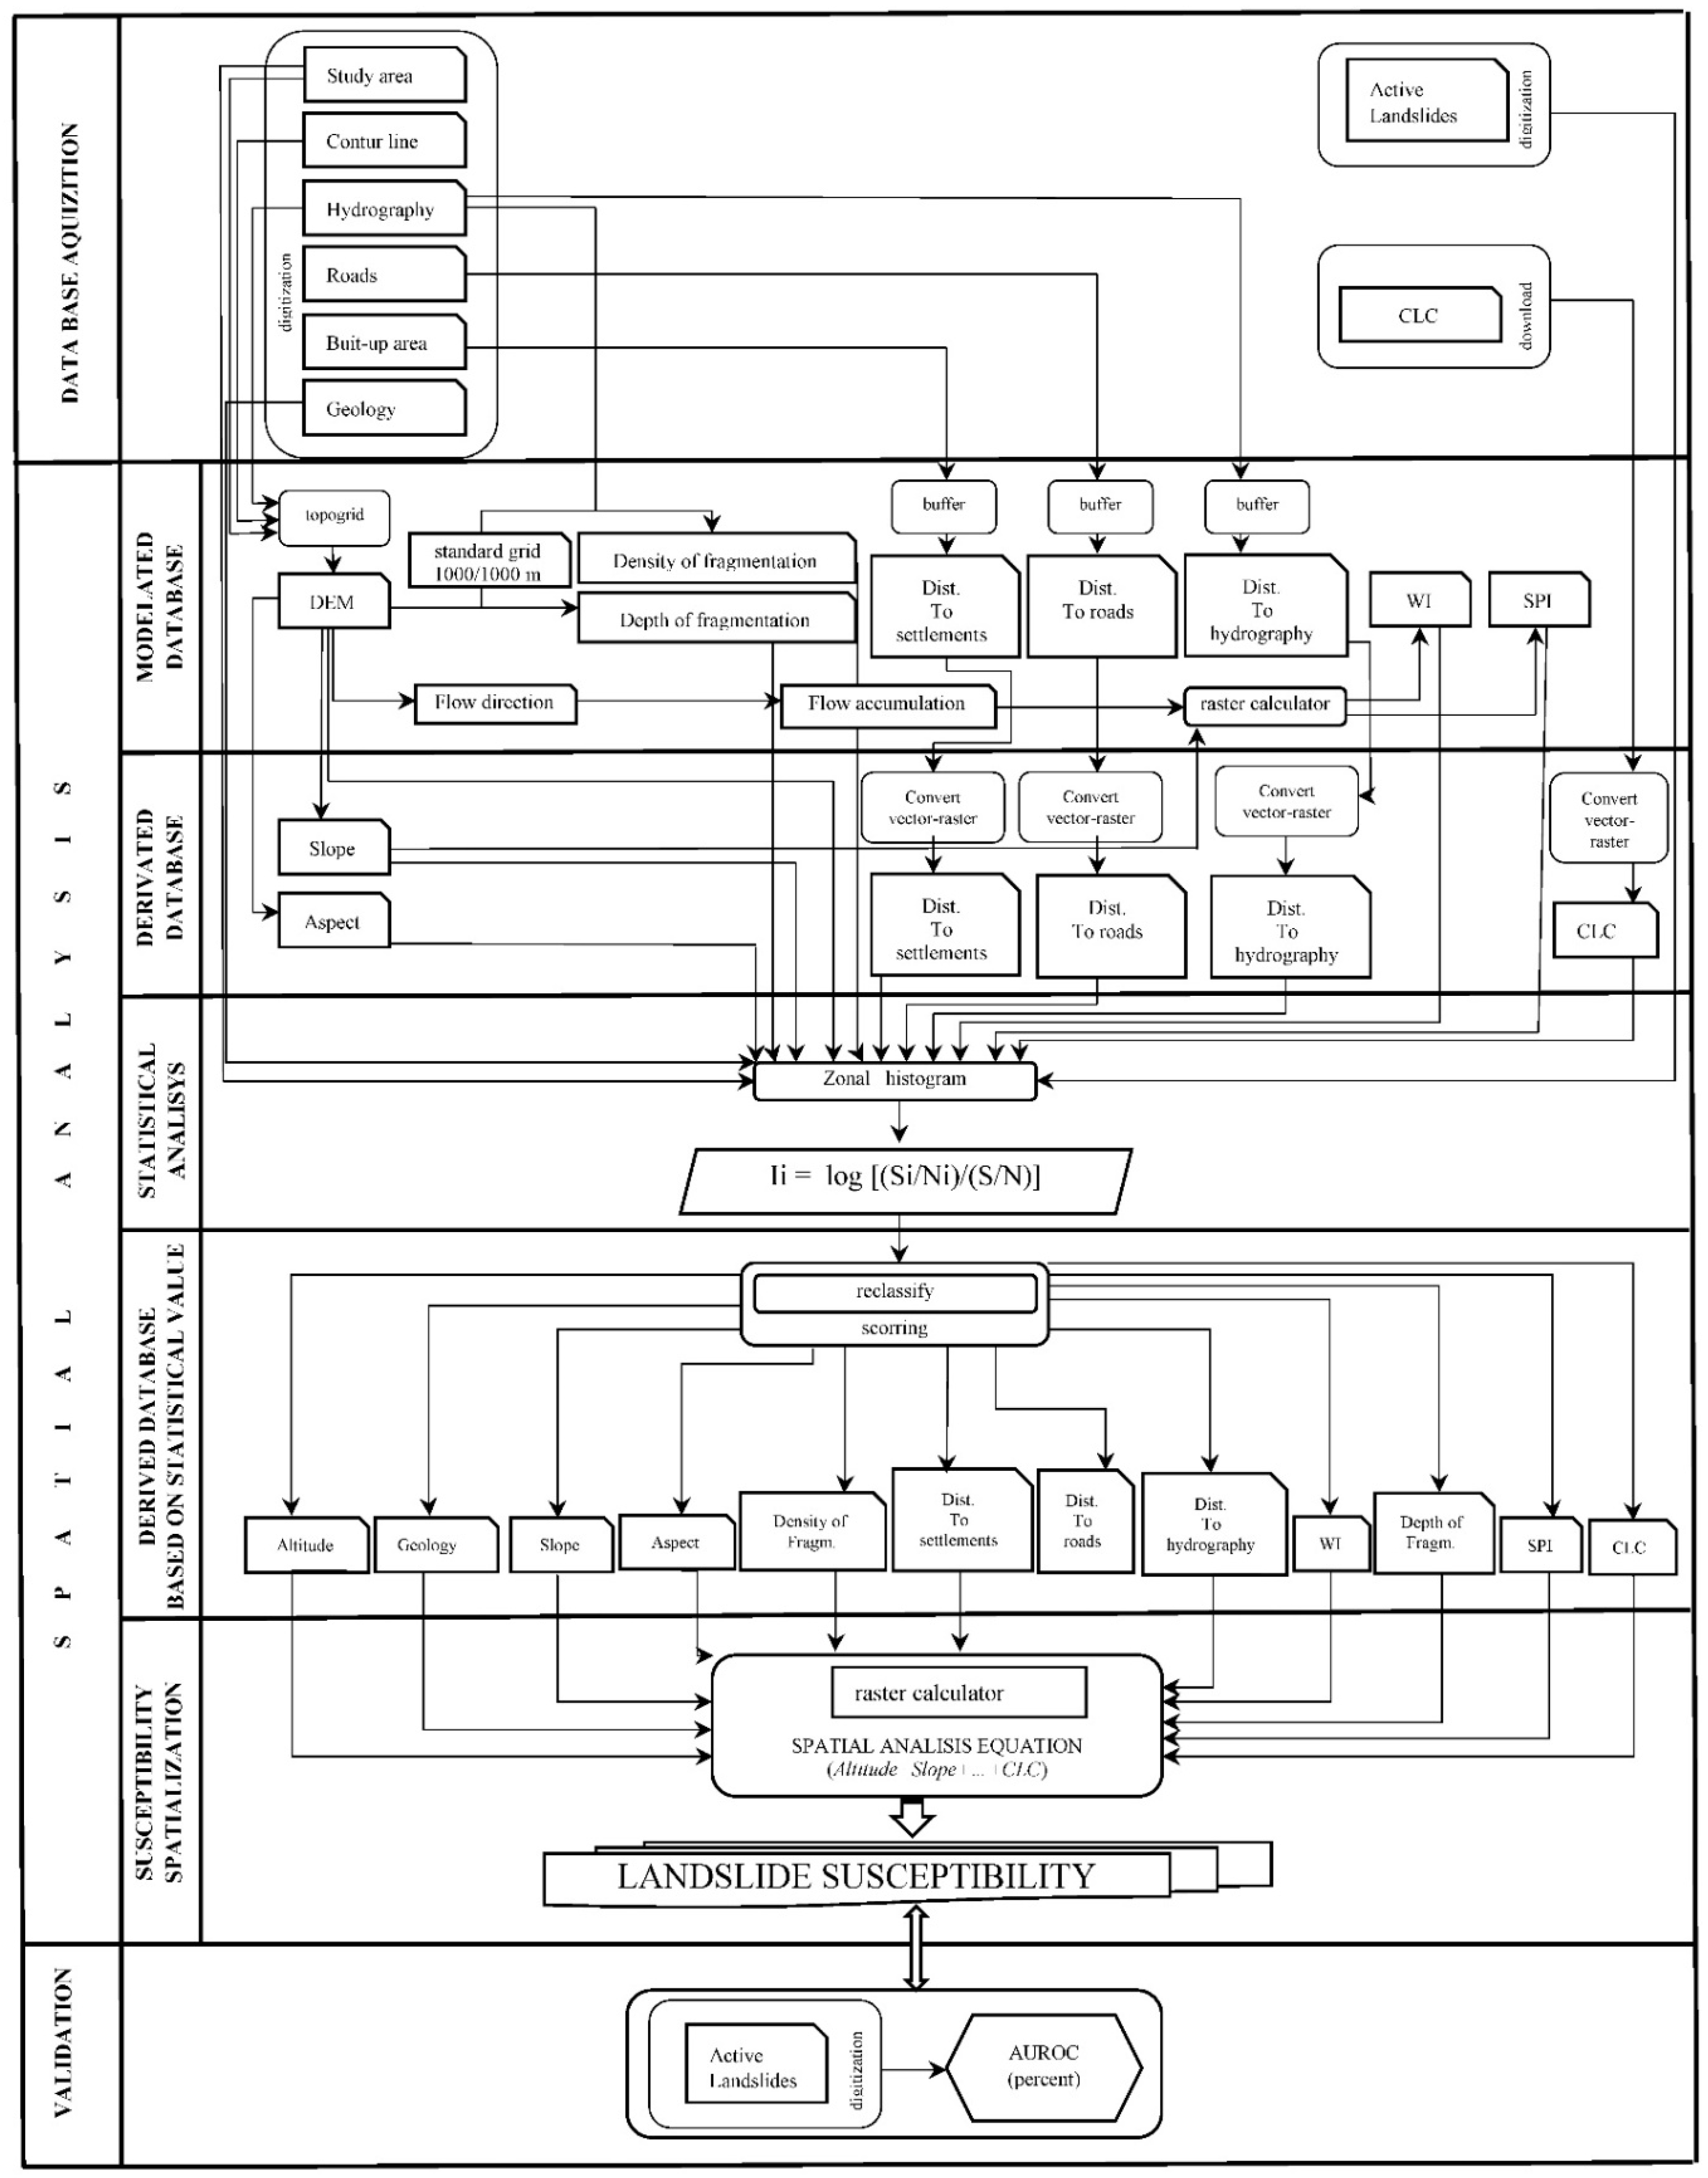
2.2. Database and Methodology

In order to establish landslides probability classes for the studied territory, it was applied a statistical model that takes into account the principles of statistical bivariate analysis so that the landslides become the dependent variables for determining the statistical influence of the causal and triggering coefficients which represent the independent variables. This type of analysis has provided good results for territories of different sizes in different study regions previously performed [27,28,29,30].
The implementation of the proposed statistical model through GIS spatial analysis models is achieved by the creation of a spatial, digital vector and raster database, a digital database made in accordance with the model requirements (Table 1).
Considering the average spatial scale of spatial analysis modelling to identify land susceptibility to landslides, it was decided to use as support the 1:25,000 scale map for the realization of vector databases representing the level curves (for three-dimensional modelling of the relief), the hydrographic network (for modelling and obtaining of digital databases representing the density of the relief fragmentation), the communication network and the settlement network (the compact built area).
The vector databases, representing land use and geology, were obtained indirectly from the Corine Land Cover (CLC) database and vectorization, using the geological map of Romania as a support, scale 1:200,000. The use of these two databases at different scales was chosen because they are the only official databases available in Romania for these two factors absolutely necessary taken into account and included in the spatial analysis model.
One of the most important databases used in the spatial analysis model is the polynomial vector structures representing the active landslides identified within the analysed territory, a database obtained by vectorization on the maps 1:25,000, the 2017 orthophotomaps as well as by delimiting them on the ground based on geographic coordinates. This database is divided into two different structures according to their use in the spatial analysis model: the first structure is represented by the landslide polygons that will be used for calculating the statistical probability values and the second structure is represented by the polygons used in the final result validation step based on the Area under the Receiver Operating Characteristic (ROC, or AUROC curve) [31,32].
Databases made as submodels that are an integral part of the general model (slope, fragmentation density, depth of degradation, slope orientation, wetness index, stream power index) to identify susceptibility to landslides based on spatial analysis have as a basis for development, the digital elevation model having a spatial resolution of 5 m, spatial resolution equal to the equidistance of the level curves on which it was generated. Regarding the vector/raster derived databases (distance to the hydrographic network, distance to the communication paths and the distance to the built surface), a 5 m resolution is chosen for the raster to keep the space scale and obtain a high overall accuracy of the outcome of the final model [33,34].
From a methodological point of view (Figure 2), the spatial analysis GIS model for the identification of susceptibility to landslides is structured over three main interconnected phases: the acquisition of the databases, the spatial analysis phase structured on five main subparts, starting from the modelling intermediate databases by dividing intermediate databases for which statistical susceptibility values are calculated, values to be taken into account in the stage of spatial susceptibility analysis, ending with the main validation stage of the model results. The correct realization and efficient single factor analysis make the final result as a spatial database able to be used successfully within other complex spatial analysis models [33,35].
The factors that involved the use of most spatial analysis techniques and databases for their finalization are represented by fragmentation density, depth of fragmentation, wetness index (WI) and stream power index (SPI). If only the use of the functions available in the geoinformation programs (Fishnet, Identity, Joint etc.) was required to complete the first two factors, for the other two factors it was necessary to implement spatial analysis equations on known raster structures: flow accumulation and slope [35].
To achieve the two WI and SPI additional indicators, Beven and Kirkby (1979) derived Equations for WI and Moore et al. (1991) were used for SPI implemented in GIS software as [35,36]:
Ln((“accumulation”*25)/Tan(“slope”)), [WI]
(“accumulation”*25)*Tan(“slope”), [SPI]
where:
  • Ln, Tan—mathematical identifiers
  • Accumulation—flow accumulation
  • 25—the area in m2 of the DEM cell
  • slope—slope in radians
The statistical analysis of digital databases in raster format consists in identifying the susceptibility value for each class of each factor included in the model structure in the form of digital databases. The calculation of the susceptibility value was performed using the bivariate statistical analysis (BSA) value of each class calculated on the basis of the probability Equation [37,38]:
Ii = log [(Si/Ni)/(S/N)],
where:
  • Ii—statistical value of the i factor
  • Si—area with identified landslides within each considered variable
  • Ni—area of the analysed variable category within the studied territory
  • S—total area affected by landslides within the studied territory
  • N—the studied area in km2
The result of applying the formula by including the extracted values from the digital databases through the spatial histogram functions included in the GIS software results in values from negative to positive. As the statistical value has a higher value, the respective coefficient class is more representative to the analysed phenomenon [2].
Using the GIS technology, the reclassification of the digital databases based on the statistical values obtained as a result of the implementation of the BSA probability equation, specific databases are obtained for each analysed factor, databases used for model finalization and the identification of susceptibility to landslides for the analysed area. Overlay technique, using spatial analysis equations based on mathematical identifiers (the + indicator in the present case) allows the spatial integration of the analysed factors [10,39] as a database and the derivation of the final result in the form of a digital database, which was validated by the AUROC method.

3. Results

The individual analysis, both in terms of the statistical value calculated for each class of each factor and in terms of the spatial extent of the respective value, leads to an understanding of the influence that the factor has on the manifestation of the entire landslide process and the identification of the susceptibility [19,20,21]. To identify susceptibility to landslides by means of the BSA method, the following factors have been analysed and taken into account with the direct impact on susceptibility assessment: altitudes, slopes, fragmentation density, depth of fragmentation, slope orientation, WI and SPI, the distance to the hydrographic network, to human settlements and to the roads.

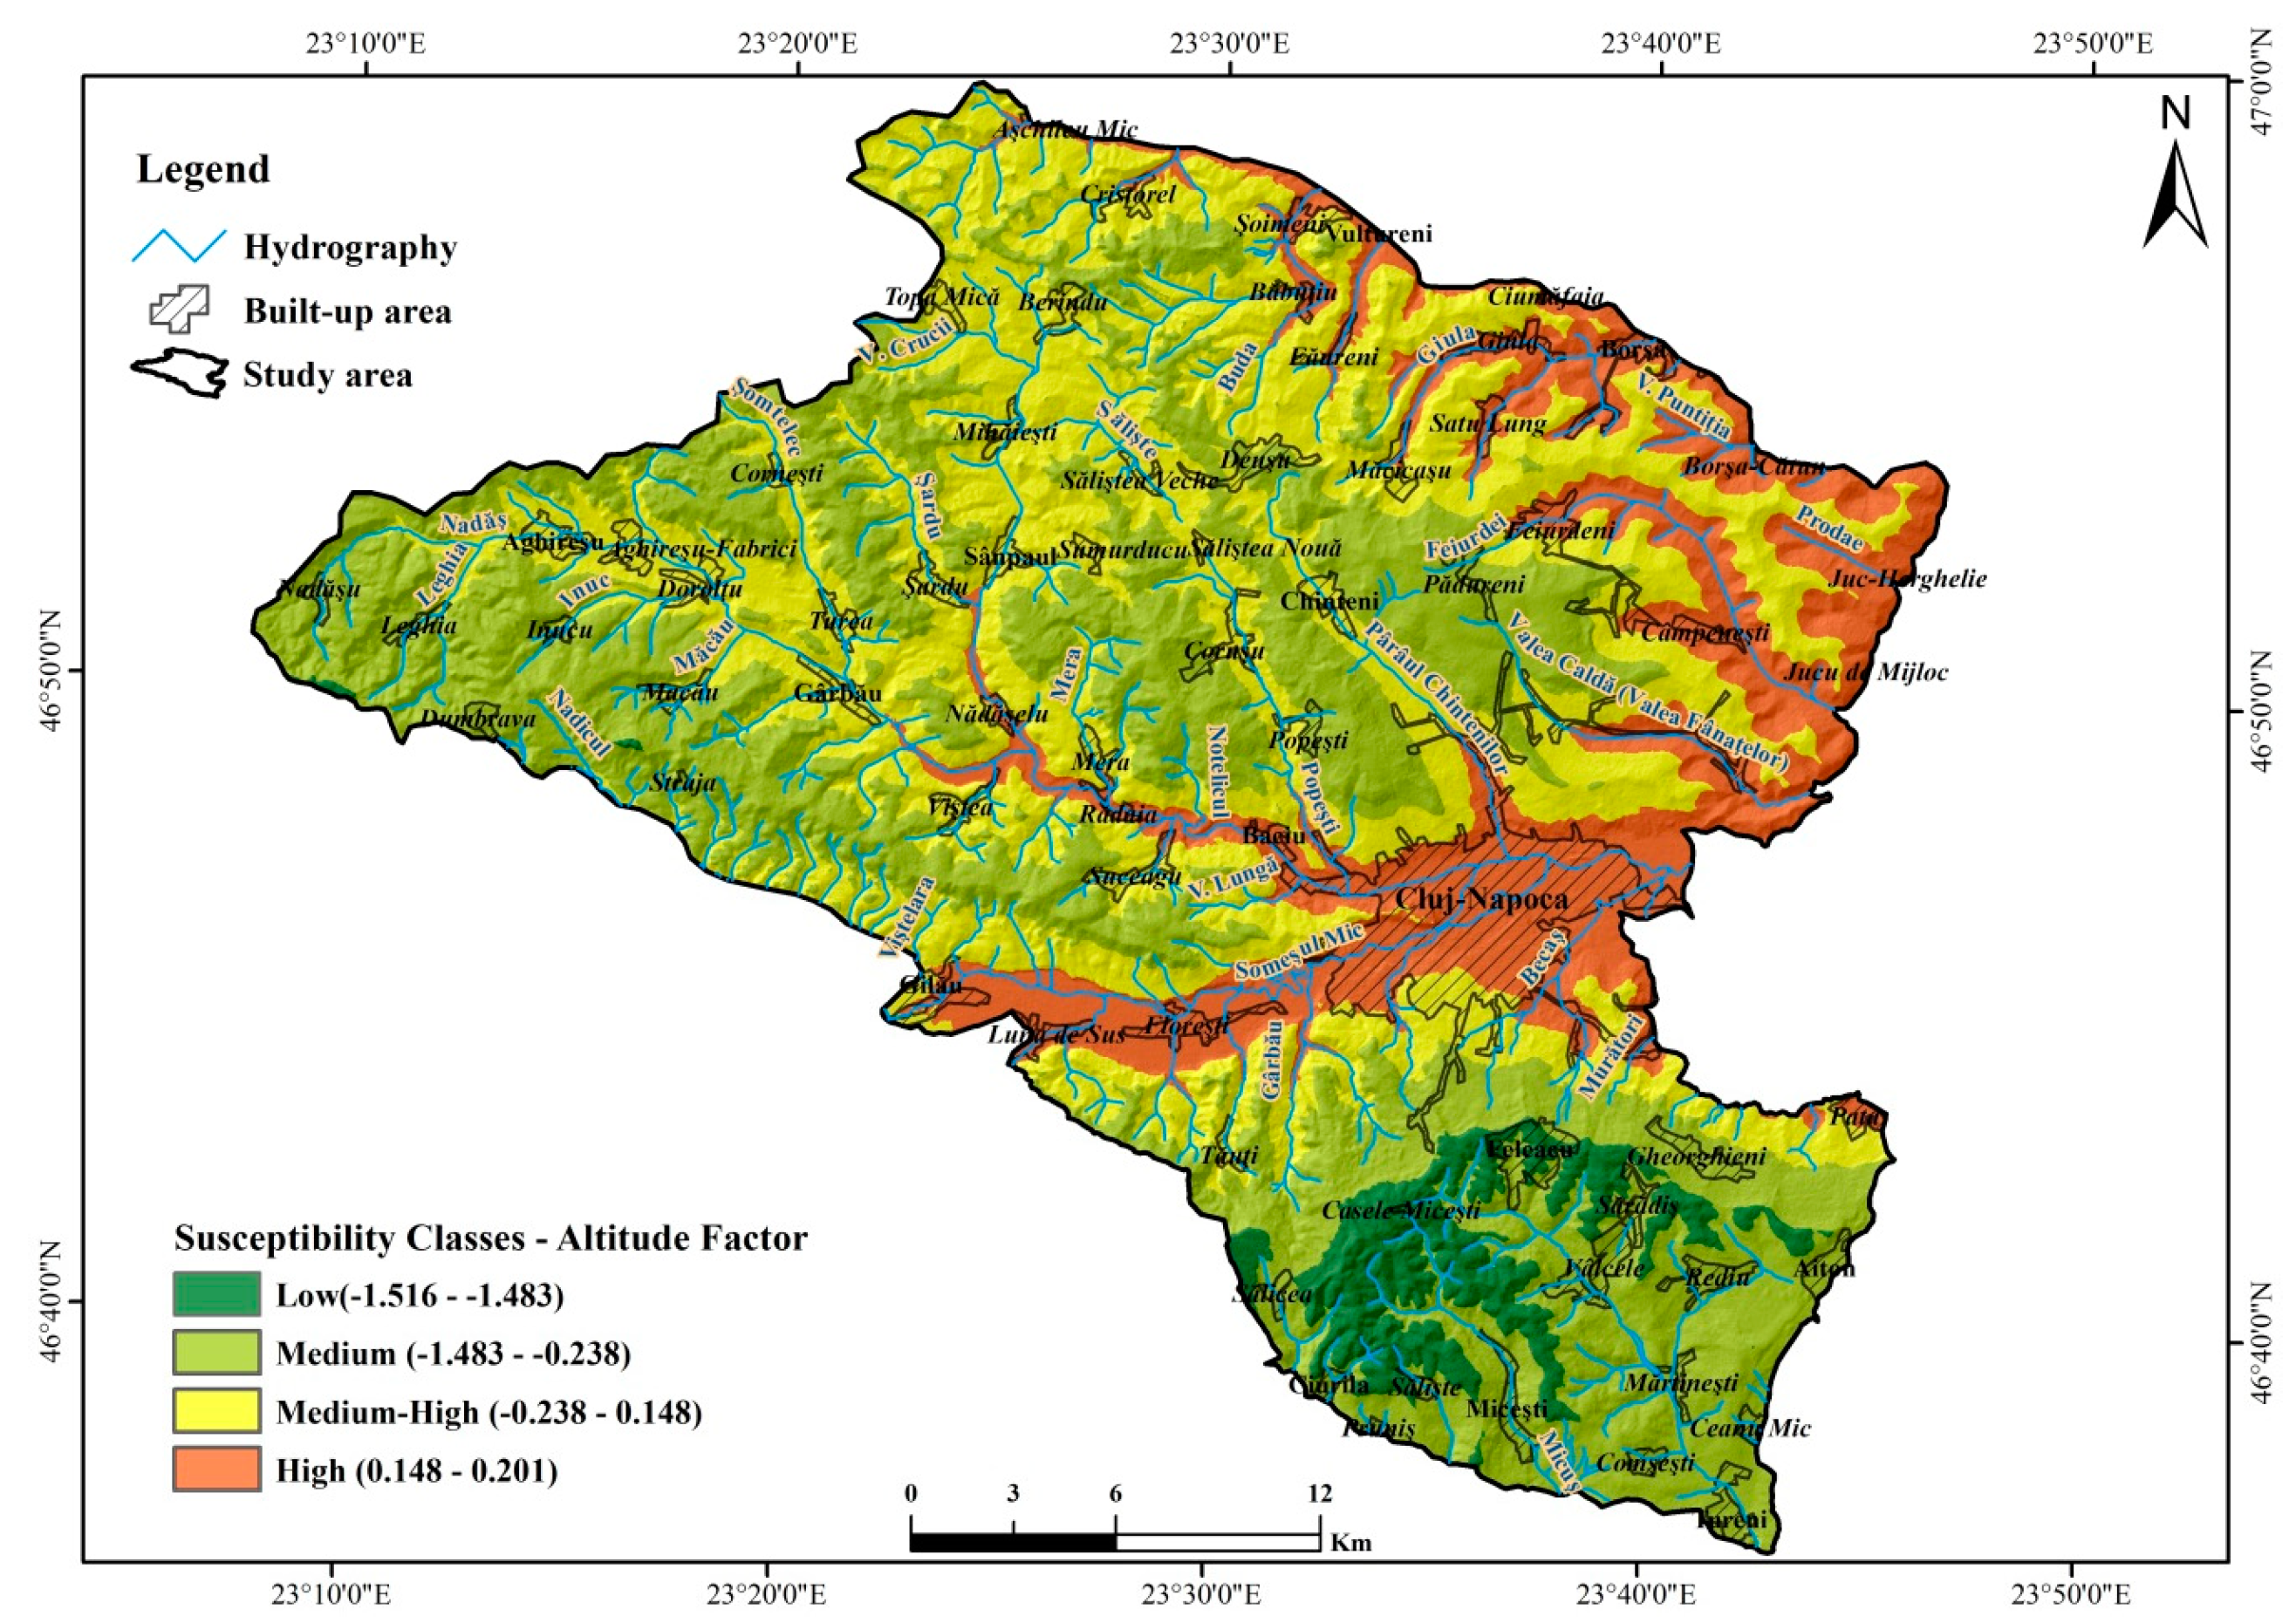
3.1. Altitude Factor
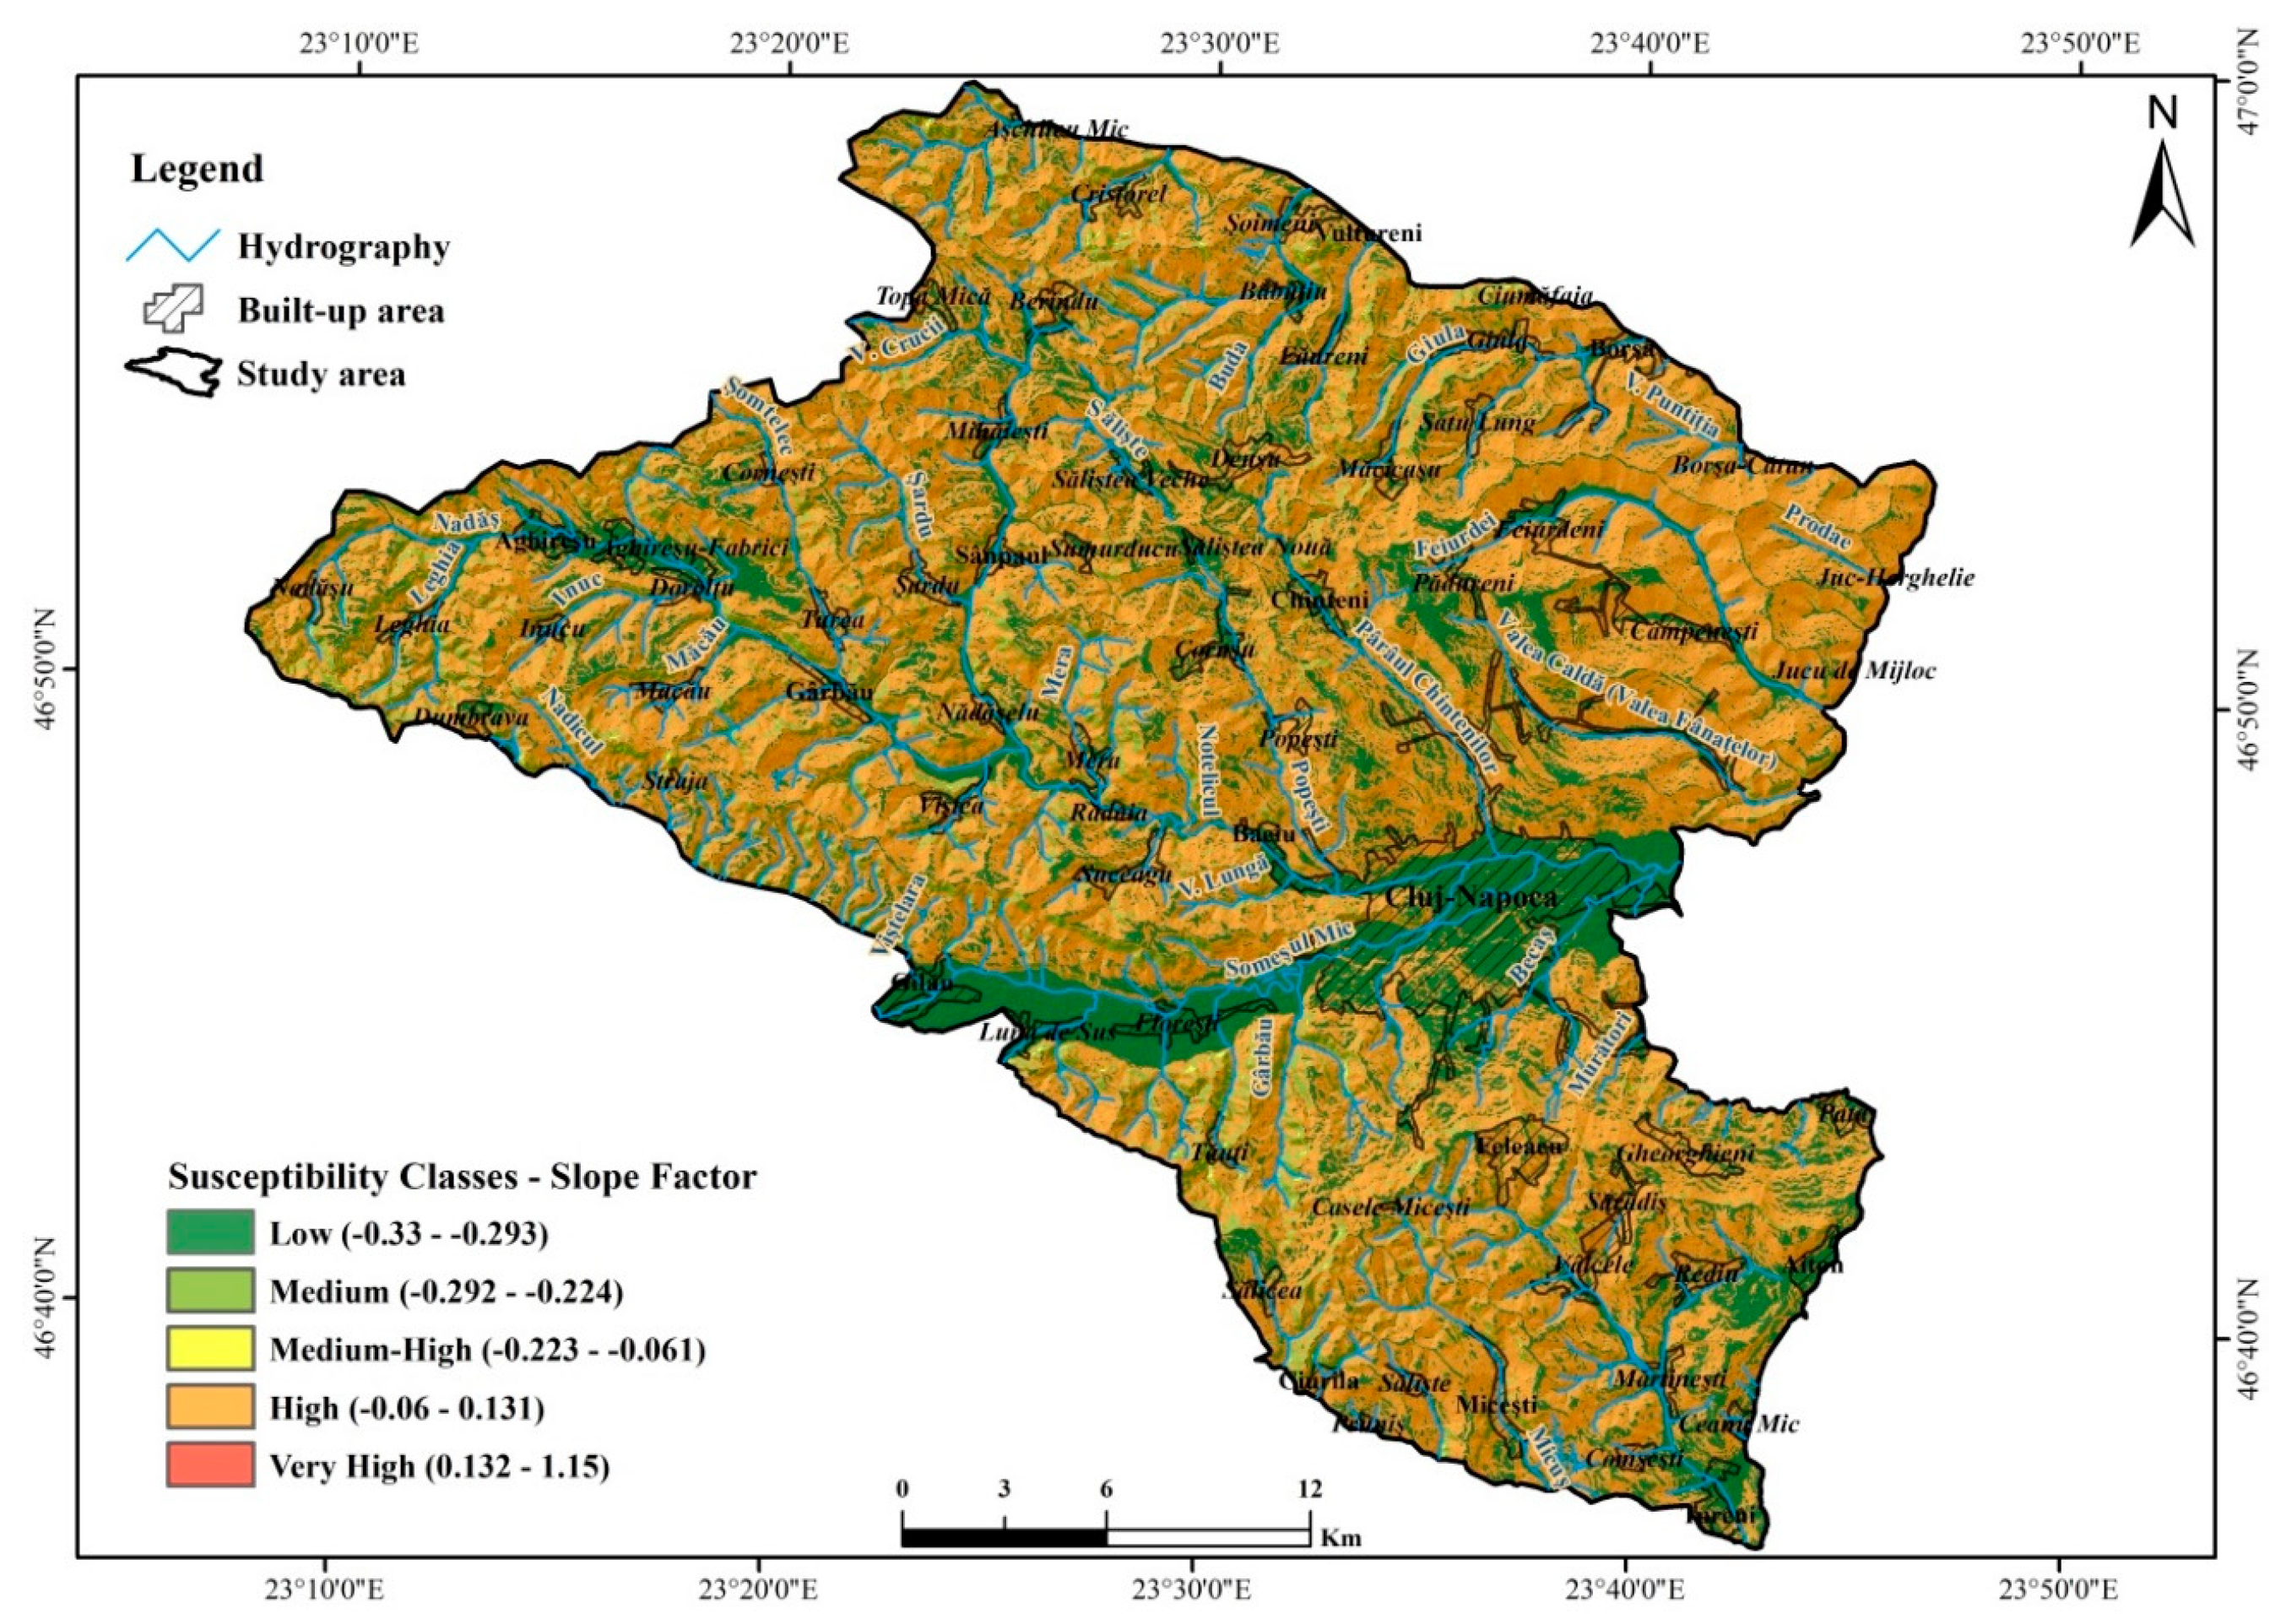
The small altitude difference between the study area makes the landslides in the Someş Mic hills to be identifiable in the hilly relief falling within the altitude range of 400–500 m (22.28 km2), with a smaller spatial spread (12.54 km2) within the low altitude surface of the Somes valley, and the altitude of 700–900 m (0.05 km2) specific to the high hill area characterized by quasi-horizontal plates. Relative to the entire study area, statistical probability values ranging from −1.517 to 0.198 (Table 2) were calculated, highlighting the altitude range of 285–400 m as an altitude range characterized by a high probability of occurrence of landslides, in contrast to the 700–900 m altitude range for which the lowest probability statistical value was calculated (−1517).
The analysis of the altitude factor as an individual database regarding susceptibility to landslides is made by reclassifying it into four major impact categories: low susceptibility (between −1.516 and −1.483 BSA value), medium susceptibility (between −1.483 and −0.238 BSA value), medium-high susceptibility (between −0.238 and 0.148 BSA value) and high susceptibility (between 0.148 and 0.201 BSA value) (Figure 3).
The inherent risk of inhabited territories by the high probability of landslides is low due to the fact that most of them are located in low hills and high hill areas, with high inherent risk being identified in the low hill contact area and Somes riverbank where living areas are less extensive.

3.2. Slope Factor

The slope represents one of the main predisposing factors for the landslide process [5,21,22]. As a key factor in the process of identifying susceptibility to landslides, the slope plays a special role both in terms of conditioning the location of the housing and transport infrastructure related to the risk of landslides, as well as in terms of land preparation for stabilization and probable risk mitigation.
Analysis of the probability values calculated for each slope reveals very high probability values for the 30–35 slope degree interval, characterized by a small spatial expansion and relatively high density of landslides reported to surface area. In view of this, the induced risk is reduced to zero due to the fact that these surfaces are spatially identified at a large distance from built areas and technical infrastructures. At the opposite pole, for low susceptibility were calculated values for the 0–5 slope degree interval and although it has a large territorial expansion is characterized by low density of surface landslides (Table 3).
A very large part of the analyzed area is situated within the high susceptibility class (approximately 67%) associated within intervals of 5–15 slope degrees and 25–30 slope degrees associated to tame slopes of the hills and cuesta, areas that pose a risk to the territorial infrastructure of communication in the immediate vicinity, but not implying a risk for residential areas that are located on surfaces included in slope category of 0–5 degrees (Figure 4).

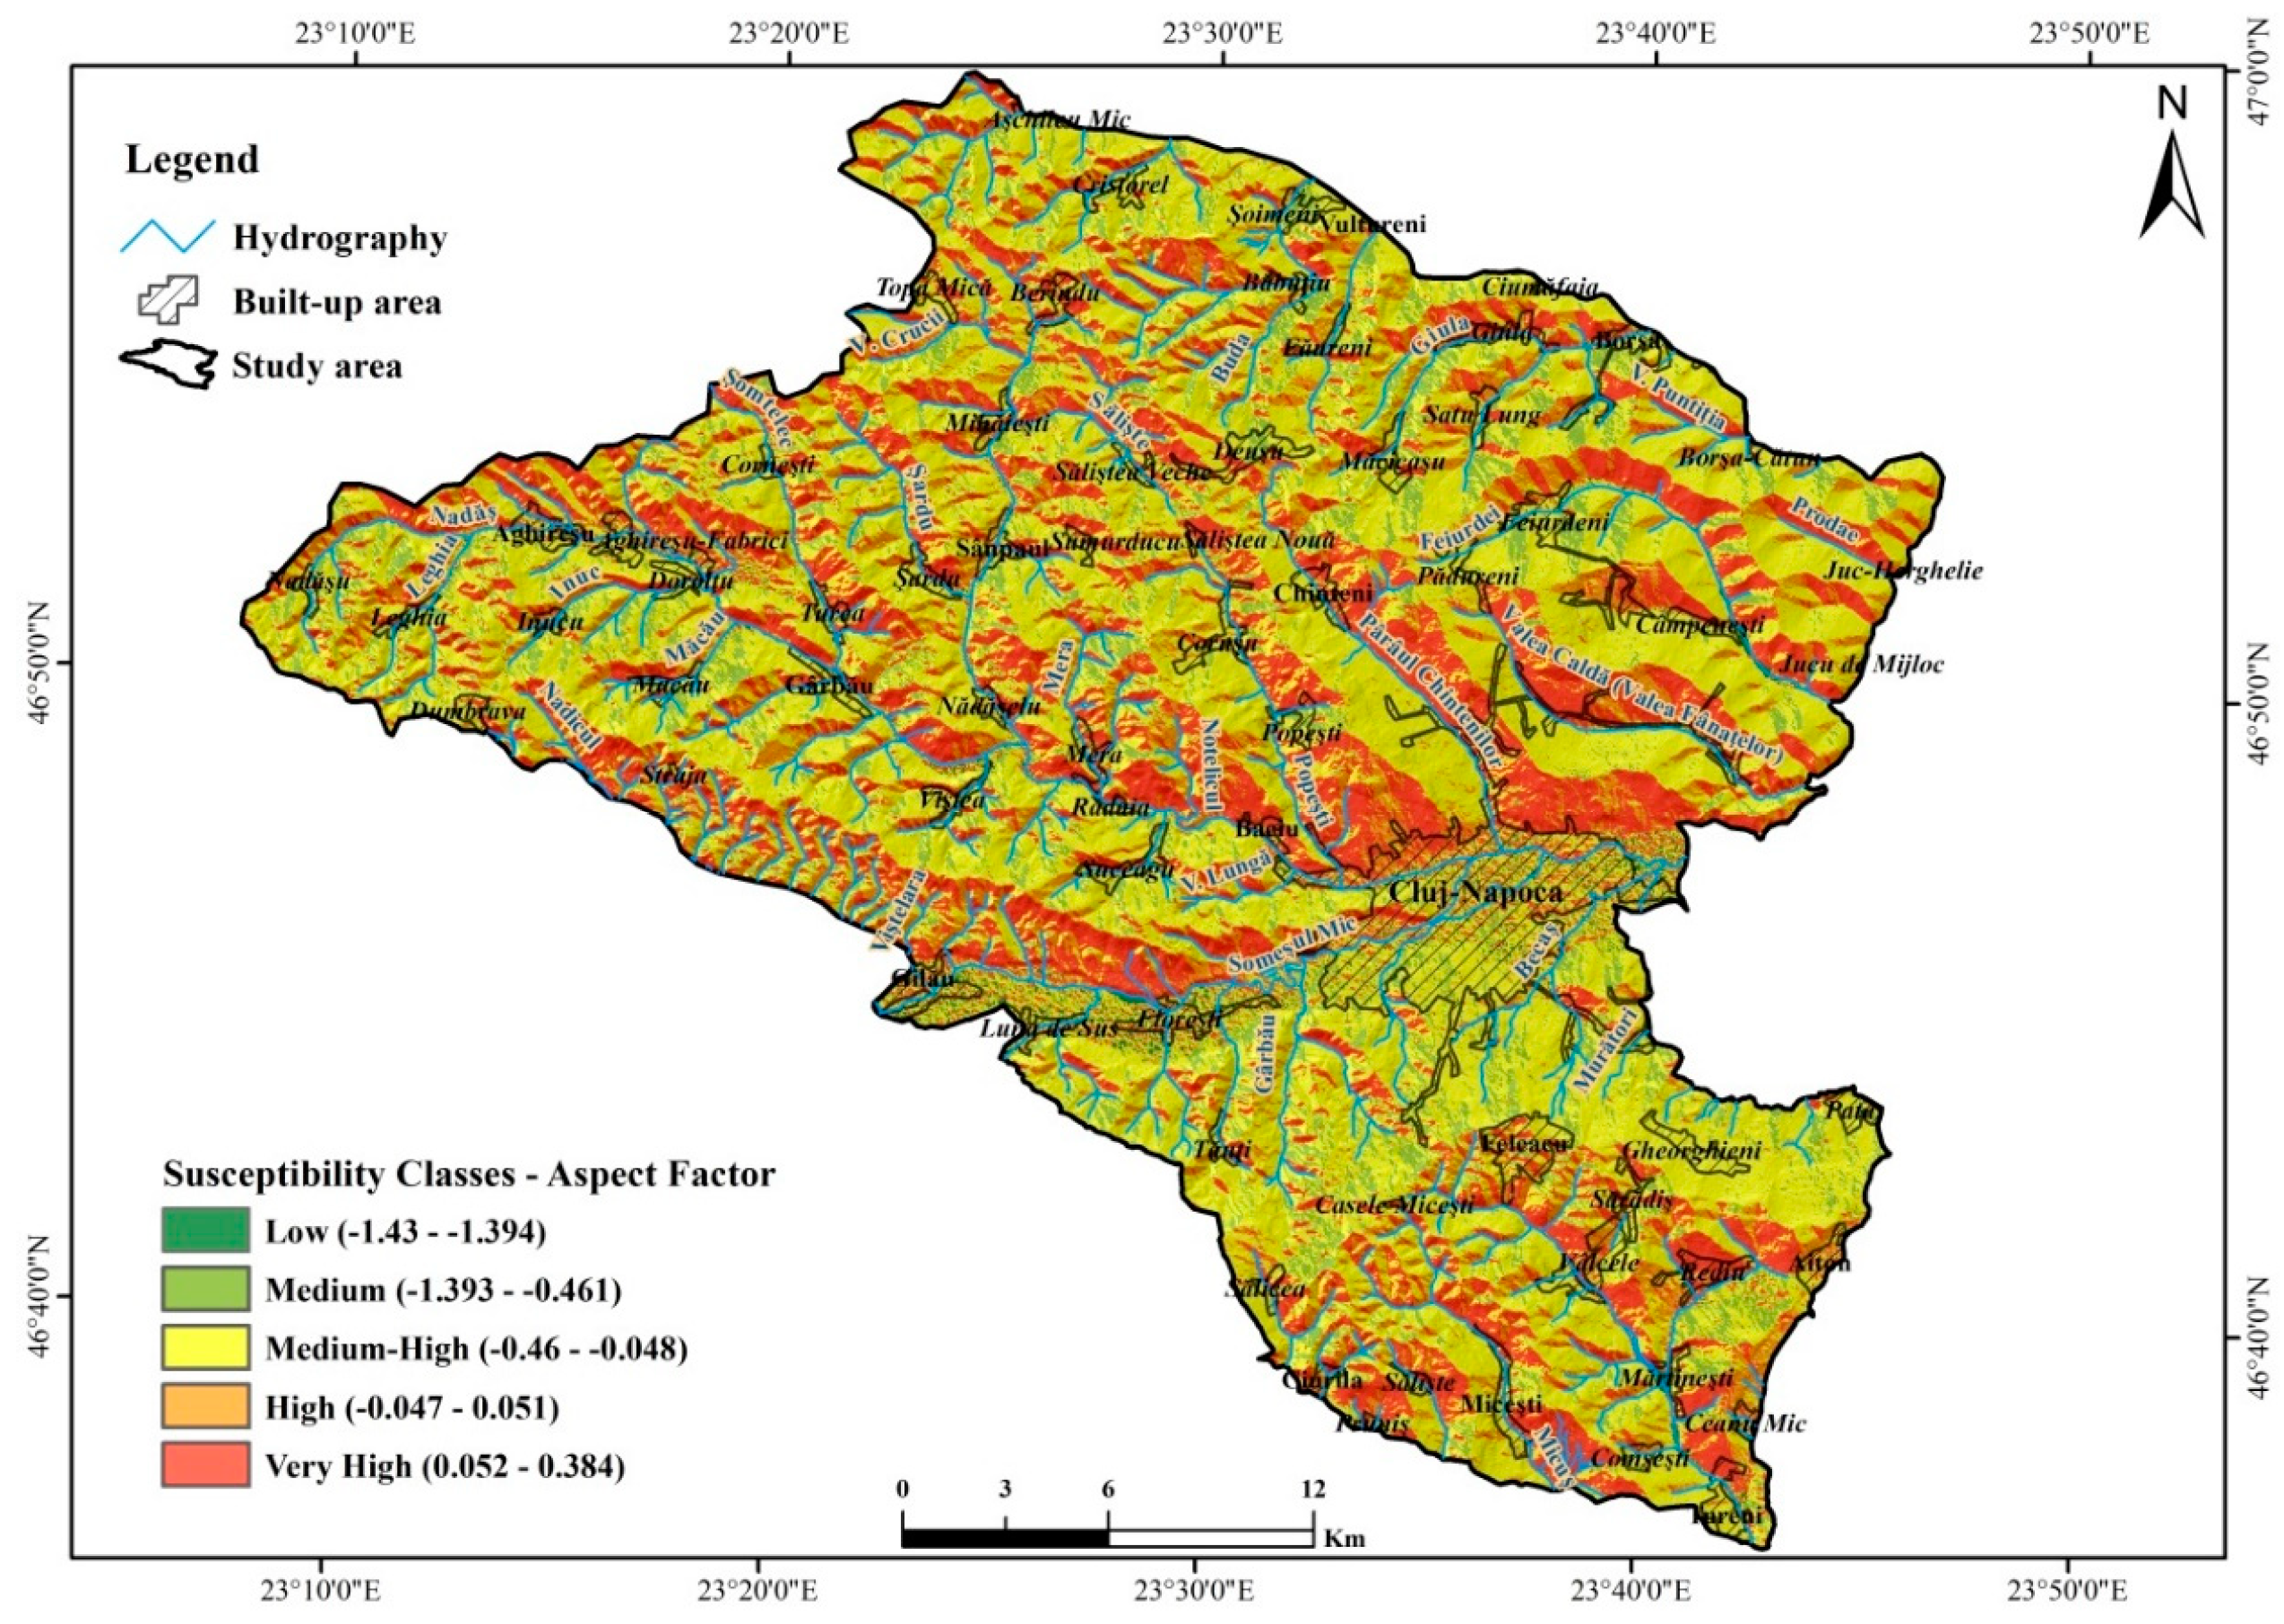
3.3. Slope Orientation Factor

The orientation of inclined surfaces plays a major role in the amount of water available at a given moment in the soil and in terms of the sunstroke and consequently the superficial degradation of the soil layer. These are the causes for which large amounts of material from the surface of the land can easily be displaced and transported by sliding into the lower parts of the south-facing slopes where the high slope conditions are present and the rapid accumulation of water in the soil specific to the shaded slopes.
The high and very high probability of landslides has been calculated for south-eastern, southern and southwest slopes ranging from 0.051 to 0.384 probabilities, the slopes which are classified as sunny and semi-sunny. Low probability values were calculated for the north, eastern, northeast and northwest slopes, shaded and semi-shaded areas as well as quasi-horizontal territories characterized by high stability (Table 4).
The analysis of the slope orientation factor highlights the medium-high susceptibility class as dominant, posing a risk especially to residential and agricultural land, followed by a very high class, which mainly poses a risk to infrastructure transport and to a lesser extent on the surfaces used mainly for pasture and meadow (Figure 5).

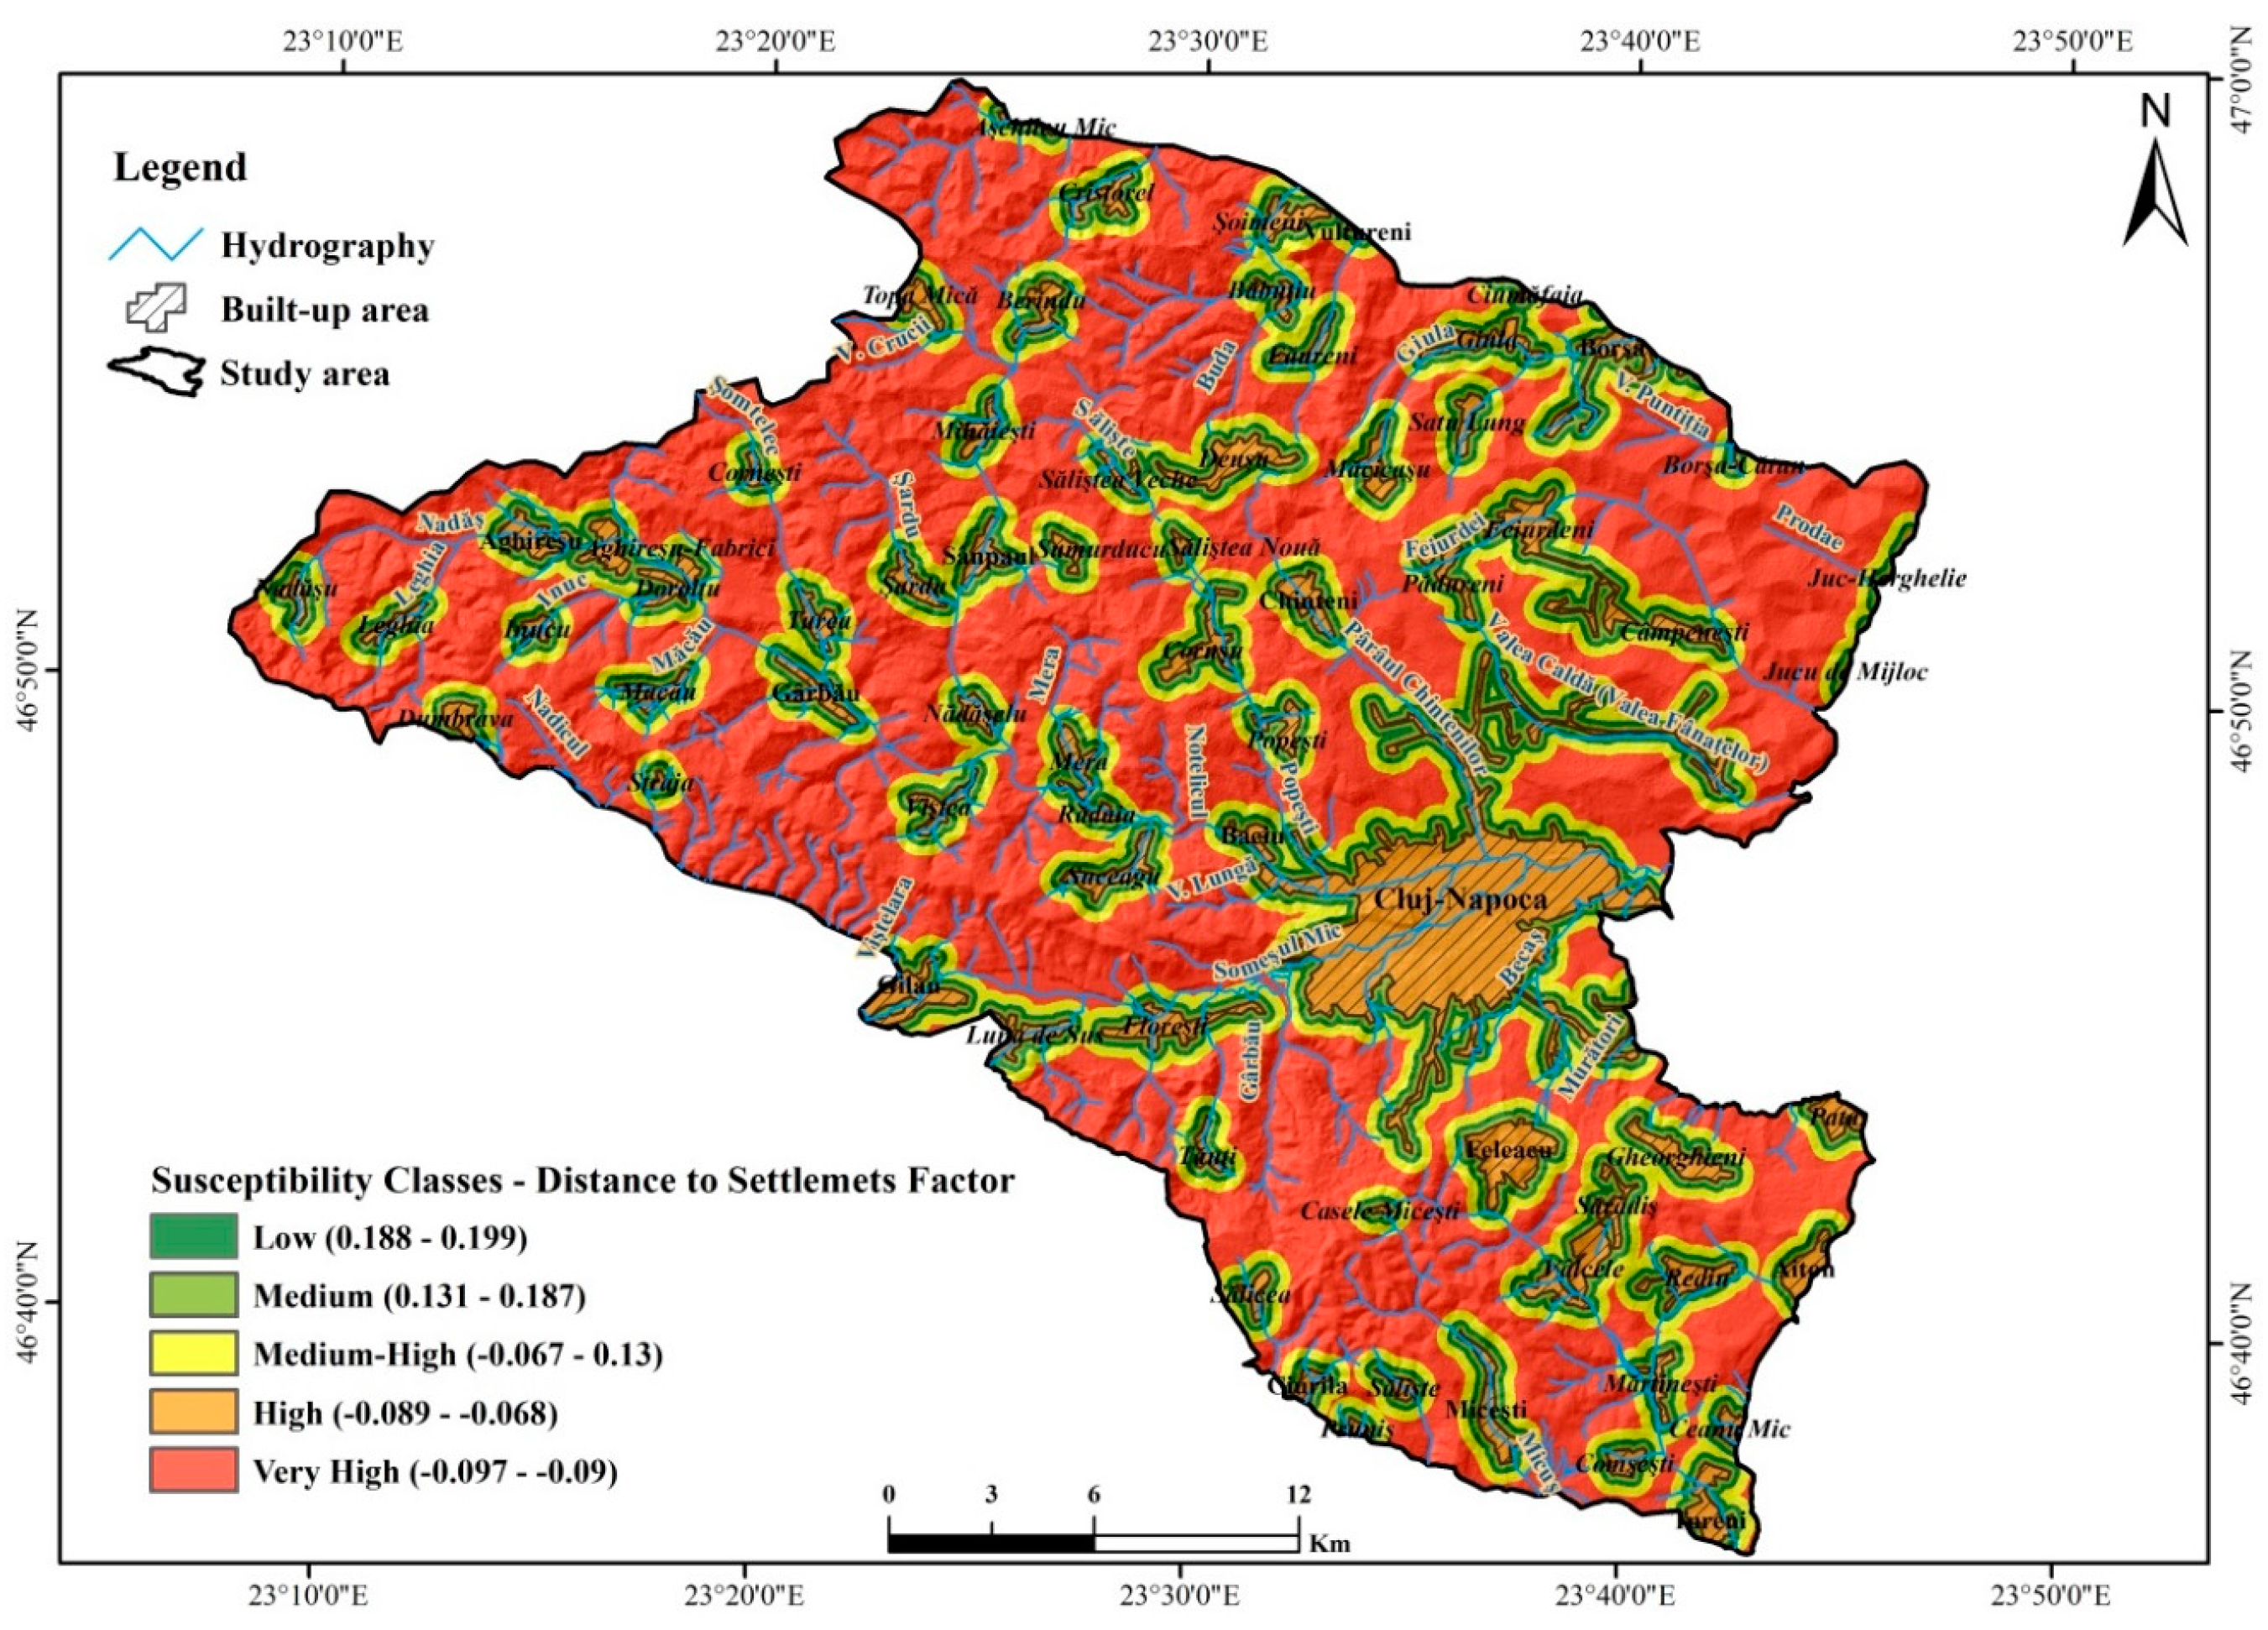
3.4. Distance to Settlements Factor

Approaching or moving away from residential areas is an important factor in assessing susceptibility to landslide due to the anthropogenic pressure exerted on the territory. The high pressure exerted by the human component has impact mainly in the immediate vicinity of the habitat both by destabilizing the slopes due to landscaping works and by the stabilization works of the slopes made in non-compliance with the law standards. Thus by calculating the probability using the BSA method was identified medium to medium-high susceptibility at distances of about 150–300 m, with a large BSA statistical value comprised between 0.186–0.198 (Table 5).
Small values of the statistical coefficient, which highlight the low susceptibility of the territory, were calculated for the immediate vicinity of the city, up to approximately 50 m, but also over distances of more than 600 m from the city. These things can be explained by the fact that around the built area development works and stabilization of slopes are made mostly by correct standards as well because the most buildable areas are identified in quasi horizontal plateaus where susceptibility is small. At the opposite pole there are areas very distant from the settlements, areas where the anthropic impact is reduced (Figure 6).
The vast majority of the analysed area is in the small susceptibility class, between −0.097 to −0.090 statistical calculated values, due to the disposition of the intravilanes at great distances from each other, the very high susceptibility class being identified in a very small proportion, only in some areas in the immediate vicinity of large settlements and cities (Figure 6).

3.5. Distance to Roads Factor

Communication lines, especially roads, transmit susceptibility to the territory in two different forms. First of all, building them at the base of the slopes by excavating and sectioning them produces major instability and susceptibility and indirect risk and secondly, their exploitation by subjecting vibration to unsteady slopes makes road communication paths to constitute a trigger factor important to consider.
Given the relief configuration of relatively low hills and gentle slope with interspersed large flat areas and extended valley corridors, the analysis of this factor reveals a very high susceptibility to landslides at very long road distances of over 200 m and not in the immediate vicinity of roadways (Table 6). This is explained by the arrangement of the communication lines mainly on the valleys with low susceptibility to landslides (Figure 7).

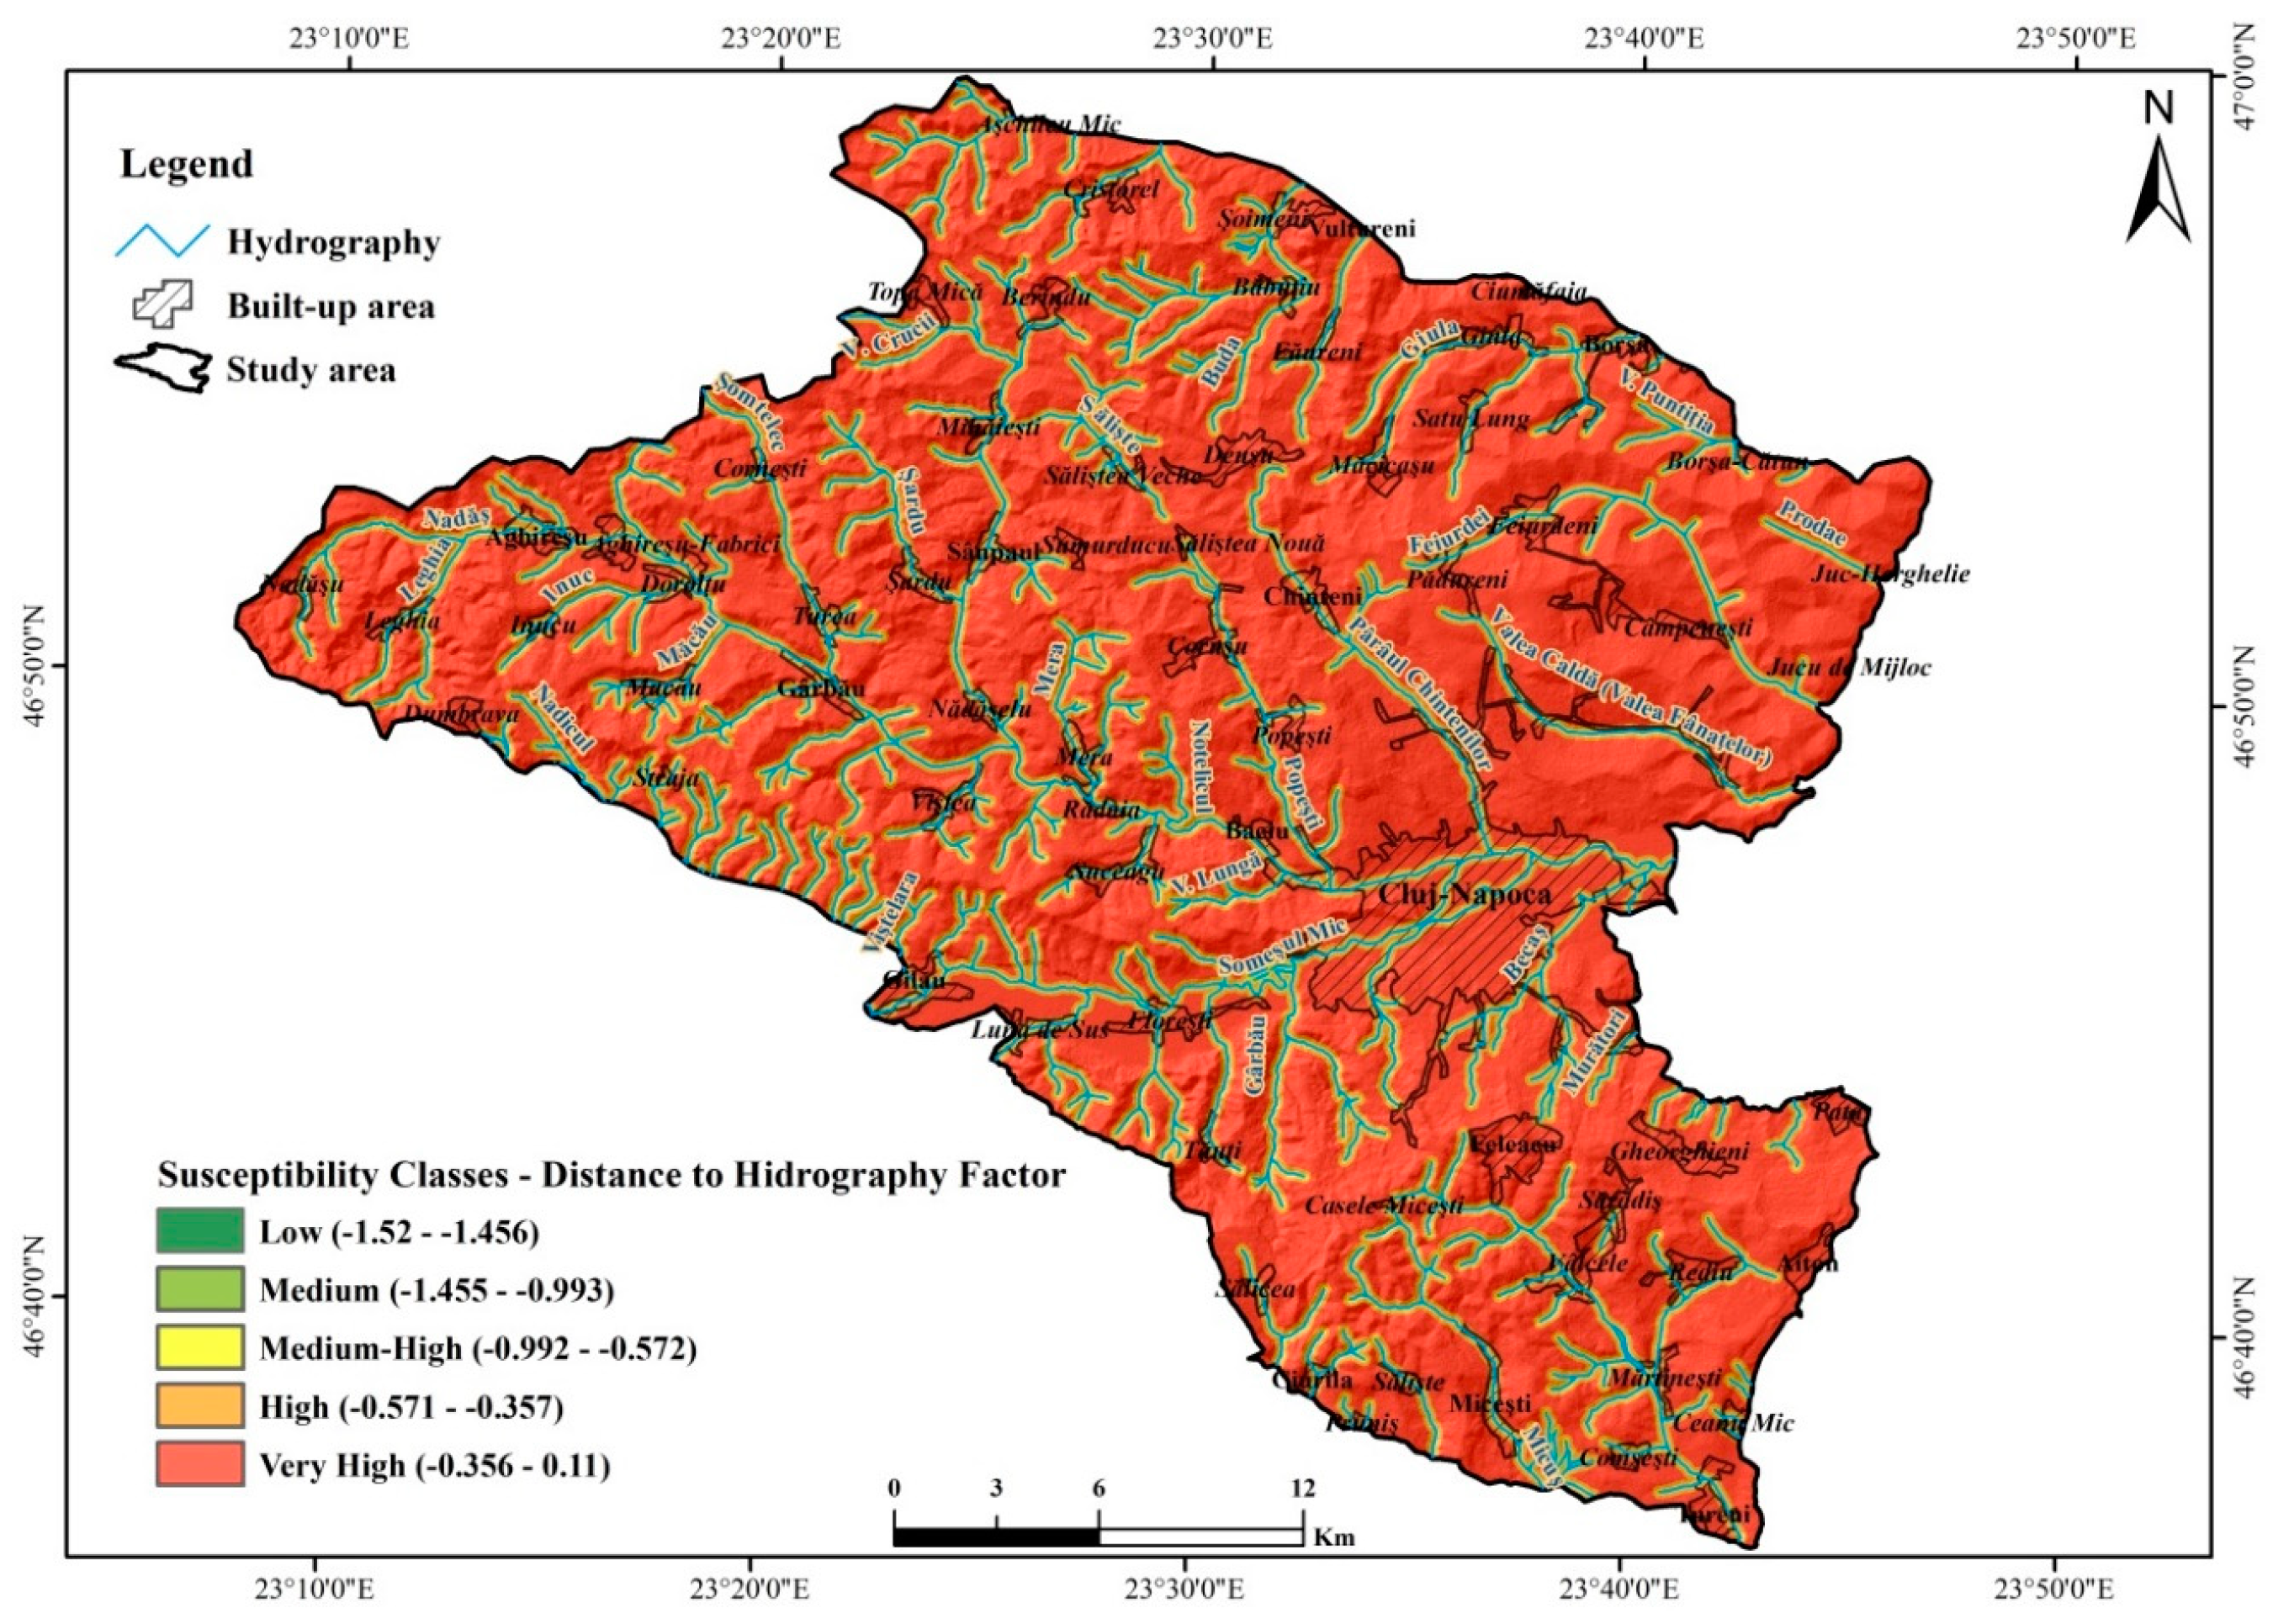
3.6. Distance to Hydrography Factor

Regarding the distribution of landslides according to distance from the hydrographic network it raises the issue of its influence on the dynamics of landslides in terms of lateral erosion on the banks near the steep slopes, areas prone to landslides. Thus, the biggest influence is the secondary hydrographic network that can contribute to the appearance and dynamics of the landslides, especially the superficial ones, by regressive erosion. Analysing the statistical value obtained from the bivariate statistical analysis, it can be noticed that most of the landslides are located at a distance of 150 to 600 m from the main hydrographic network (Table 7, Figure 8).

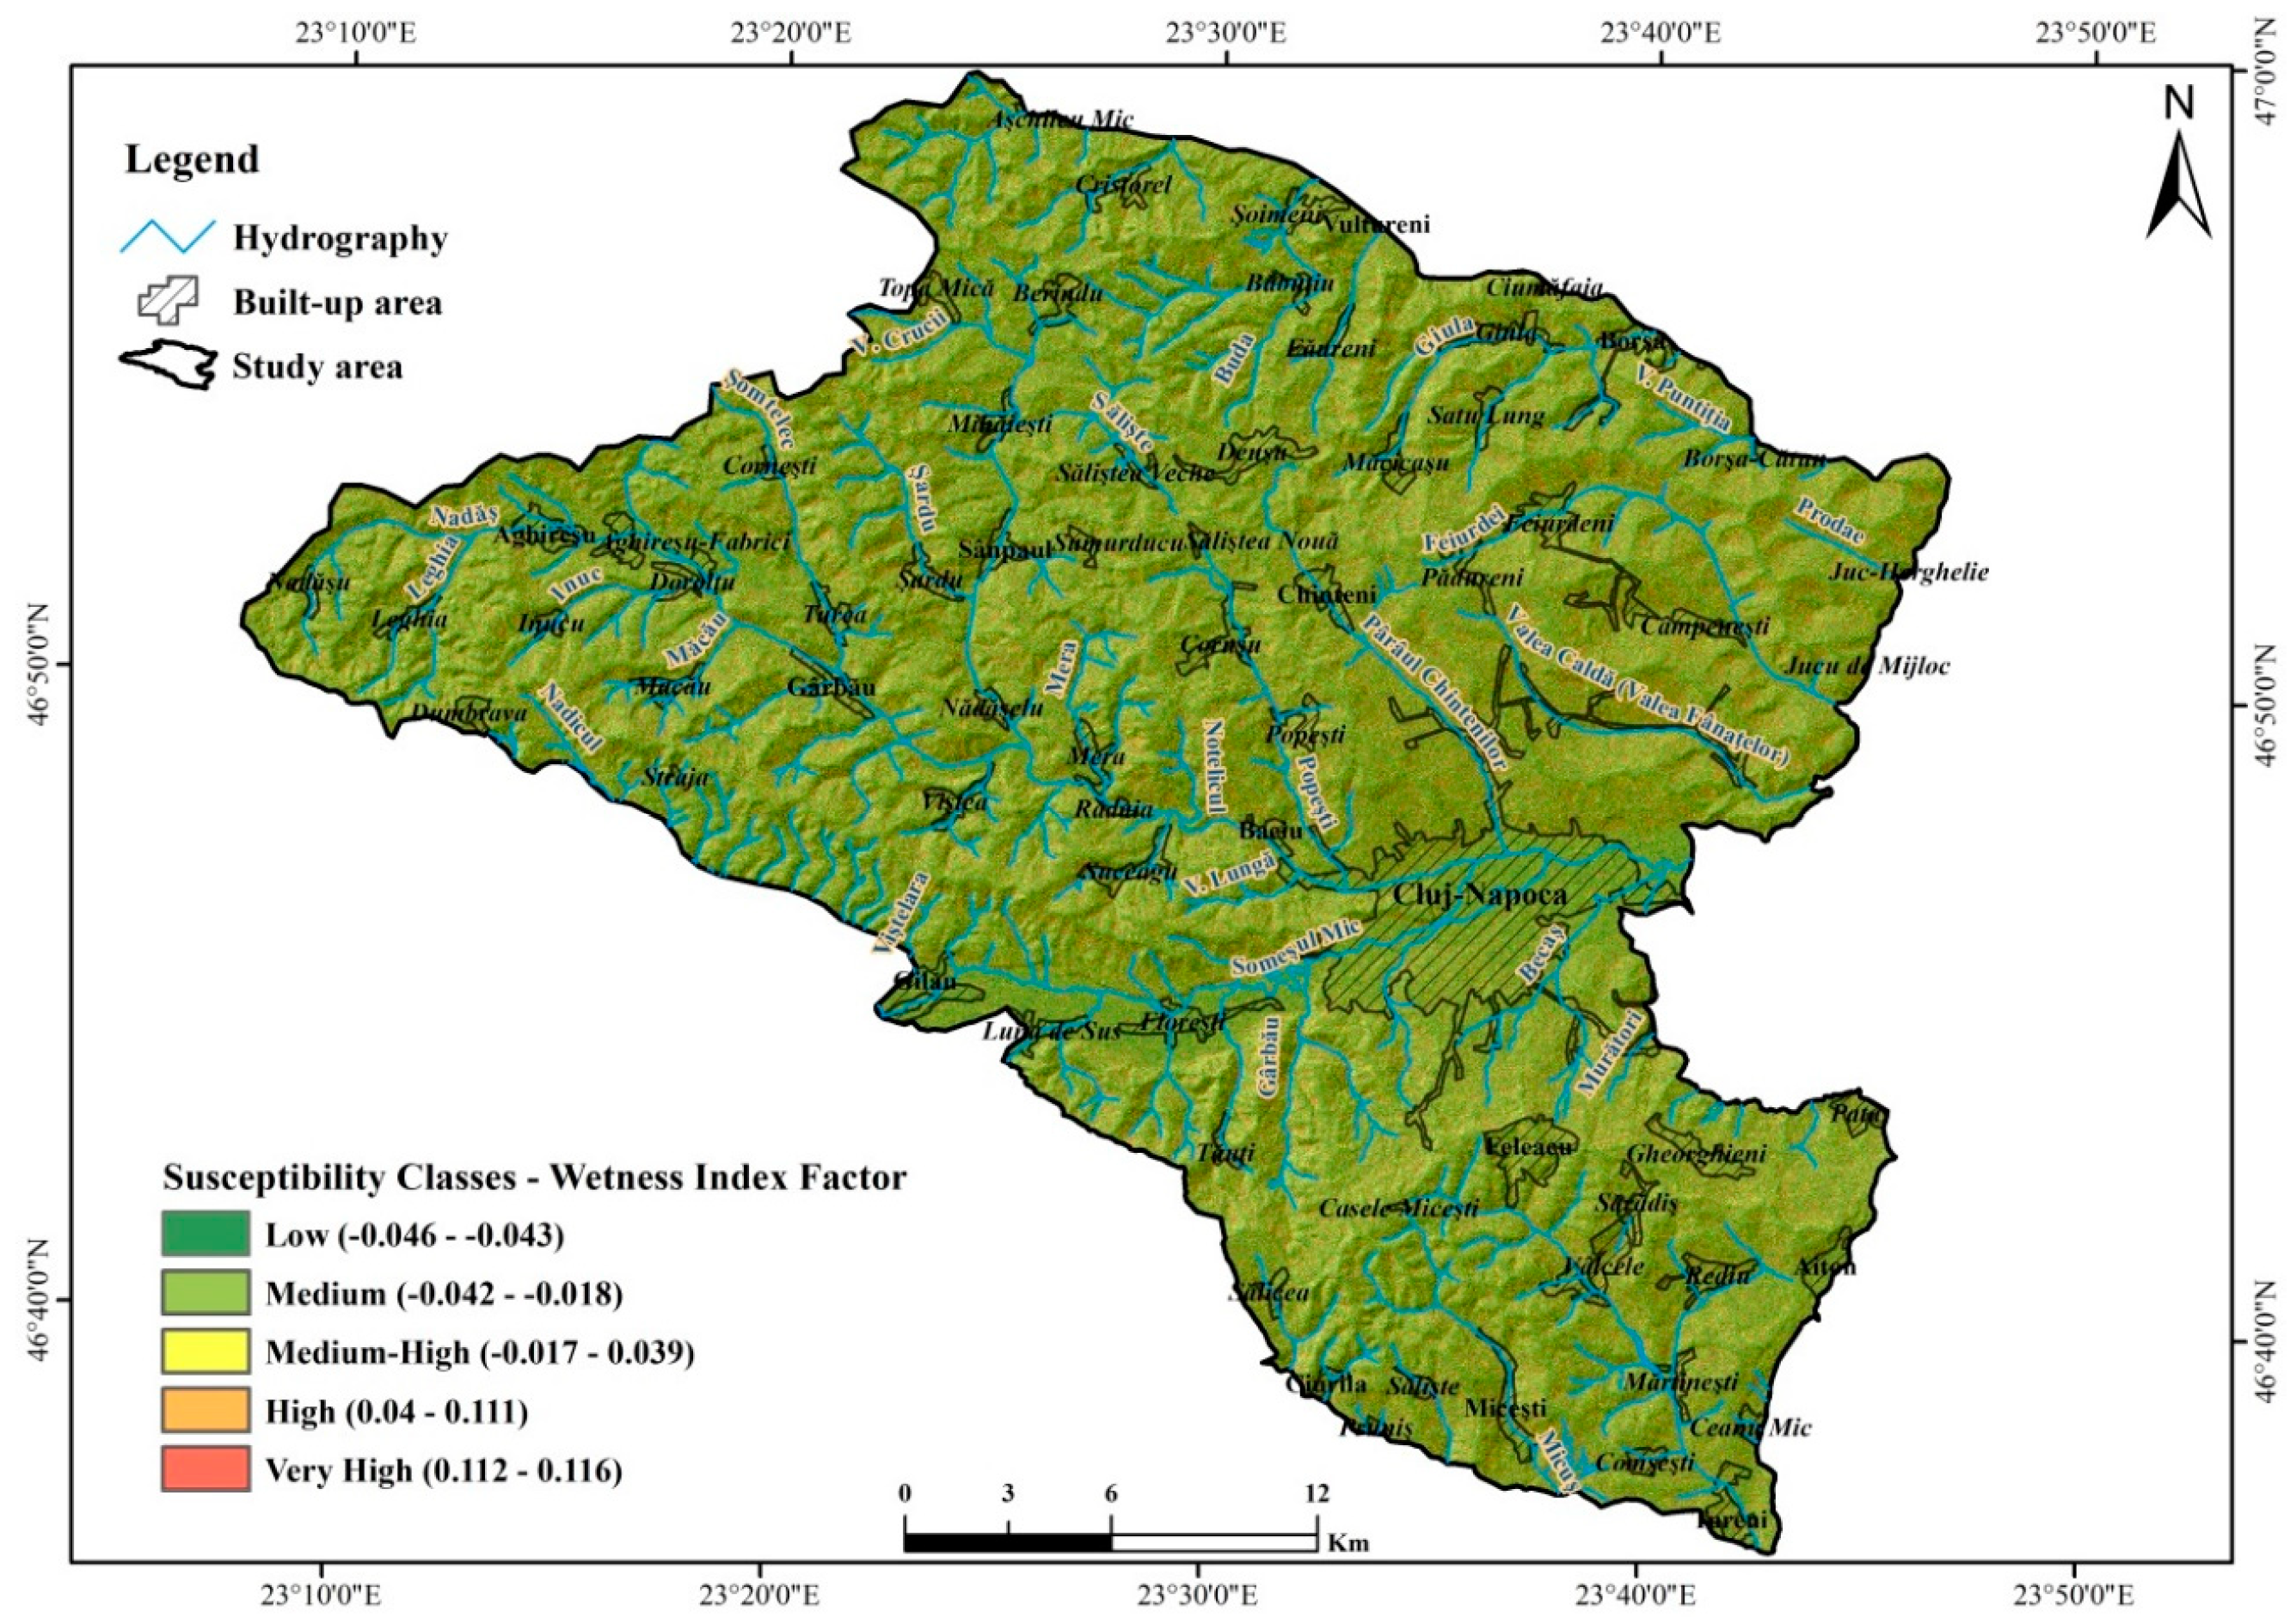
3.7. Wetness Index Factor

Wetness index values are within the range −0.046 to 0.116 to highlight areas with high relative saturation in water, thus directly affecting the cause of the landslide triggering as well as the reactivation moments of them, therefore characterizing the analysed territory in the high probability class [37]. This influence is also highlighted by the corresponding high statistical value of 0.110, resulting from the application of the BSA method (Table 8). On the opposite side, we identify areas characterized by very low wetness index values (ranging from 0–7) to which a low and medium susceptibility is specified (with a statistical value between −0.046 and −0.018) (Figure 9).

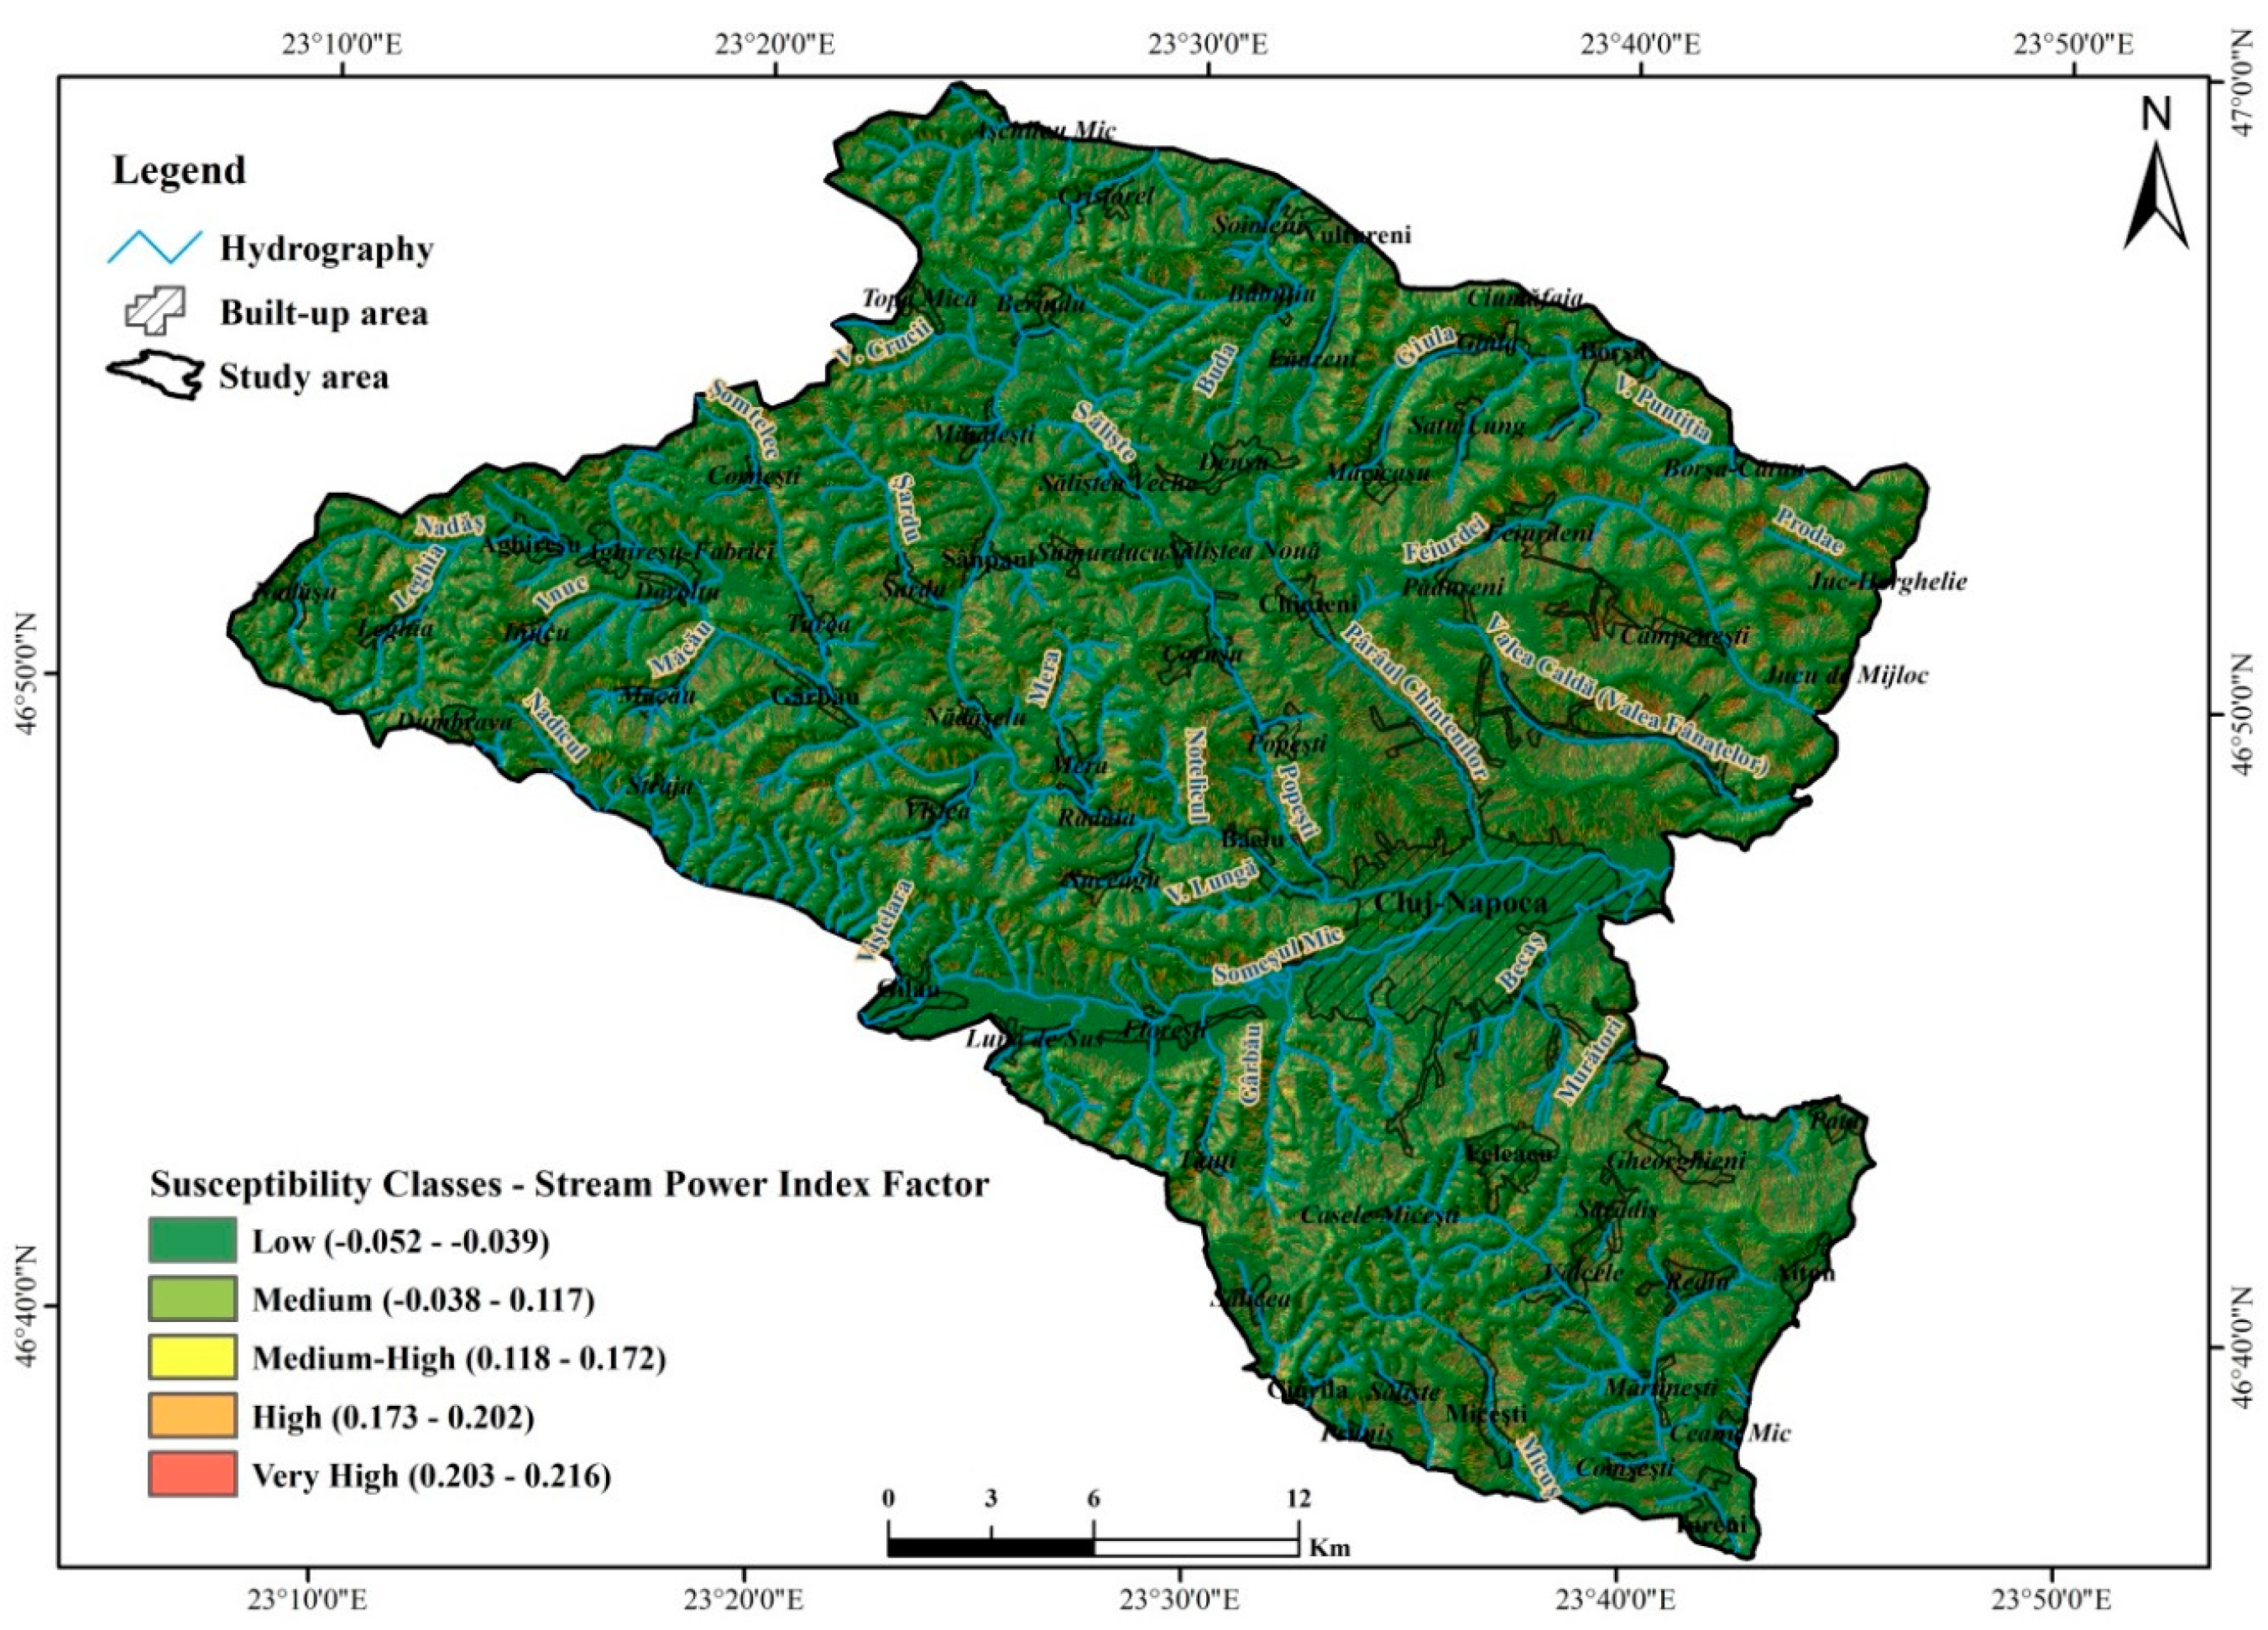
3.8. Stream Power Index Factor

The Stream Power Index factor with calculated values ranging from −0.052 to 0.214 highlights the areas with accelerated water erosion potential, the positive values of this indicator corresponding to the lands with a high probability of landslides occurring at the level of the entire Transylvanian Plateau [3,40]. In the case of the studied area the values higher than 1.4 have the highest statistical representativeness (0.214) (Table 9). With this factor, the negative effect of the hydrographic erosion by the secondary hydrographic network is again highlighted, thus becoming an important factor in the assessment of the susceptibility to the landslides in the Somesul Mic hills (Figure 10).

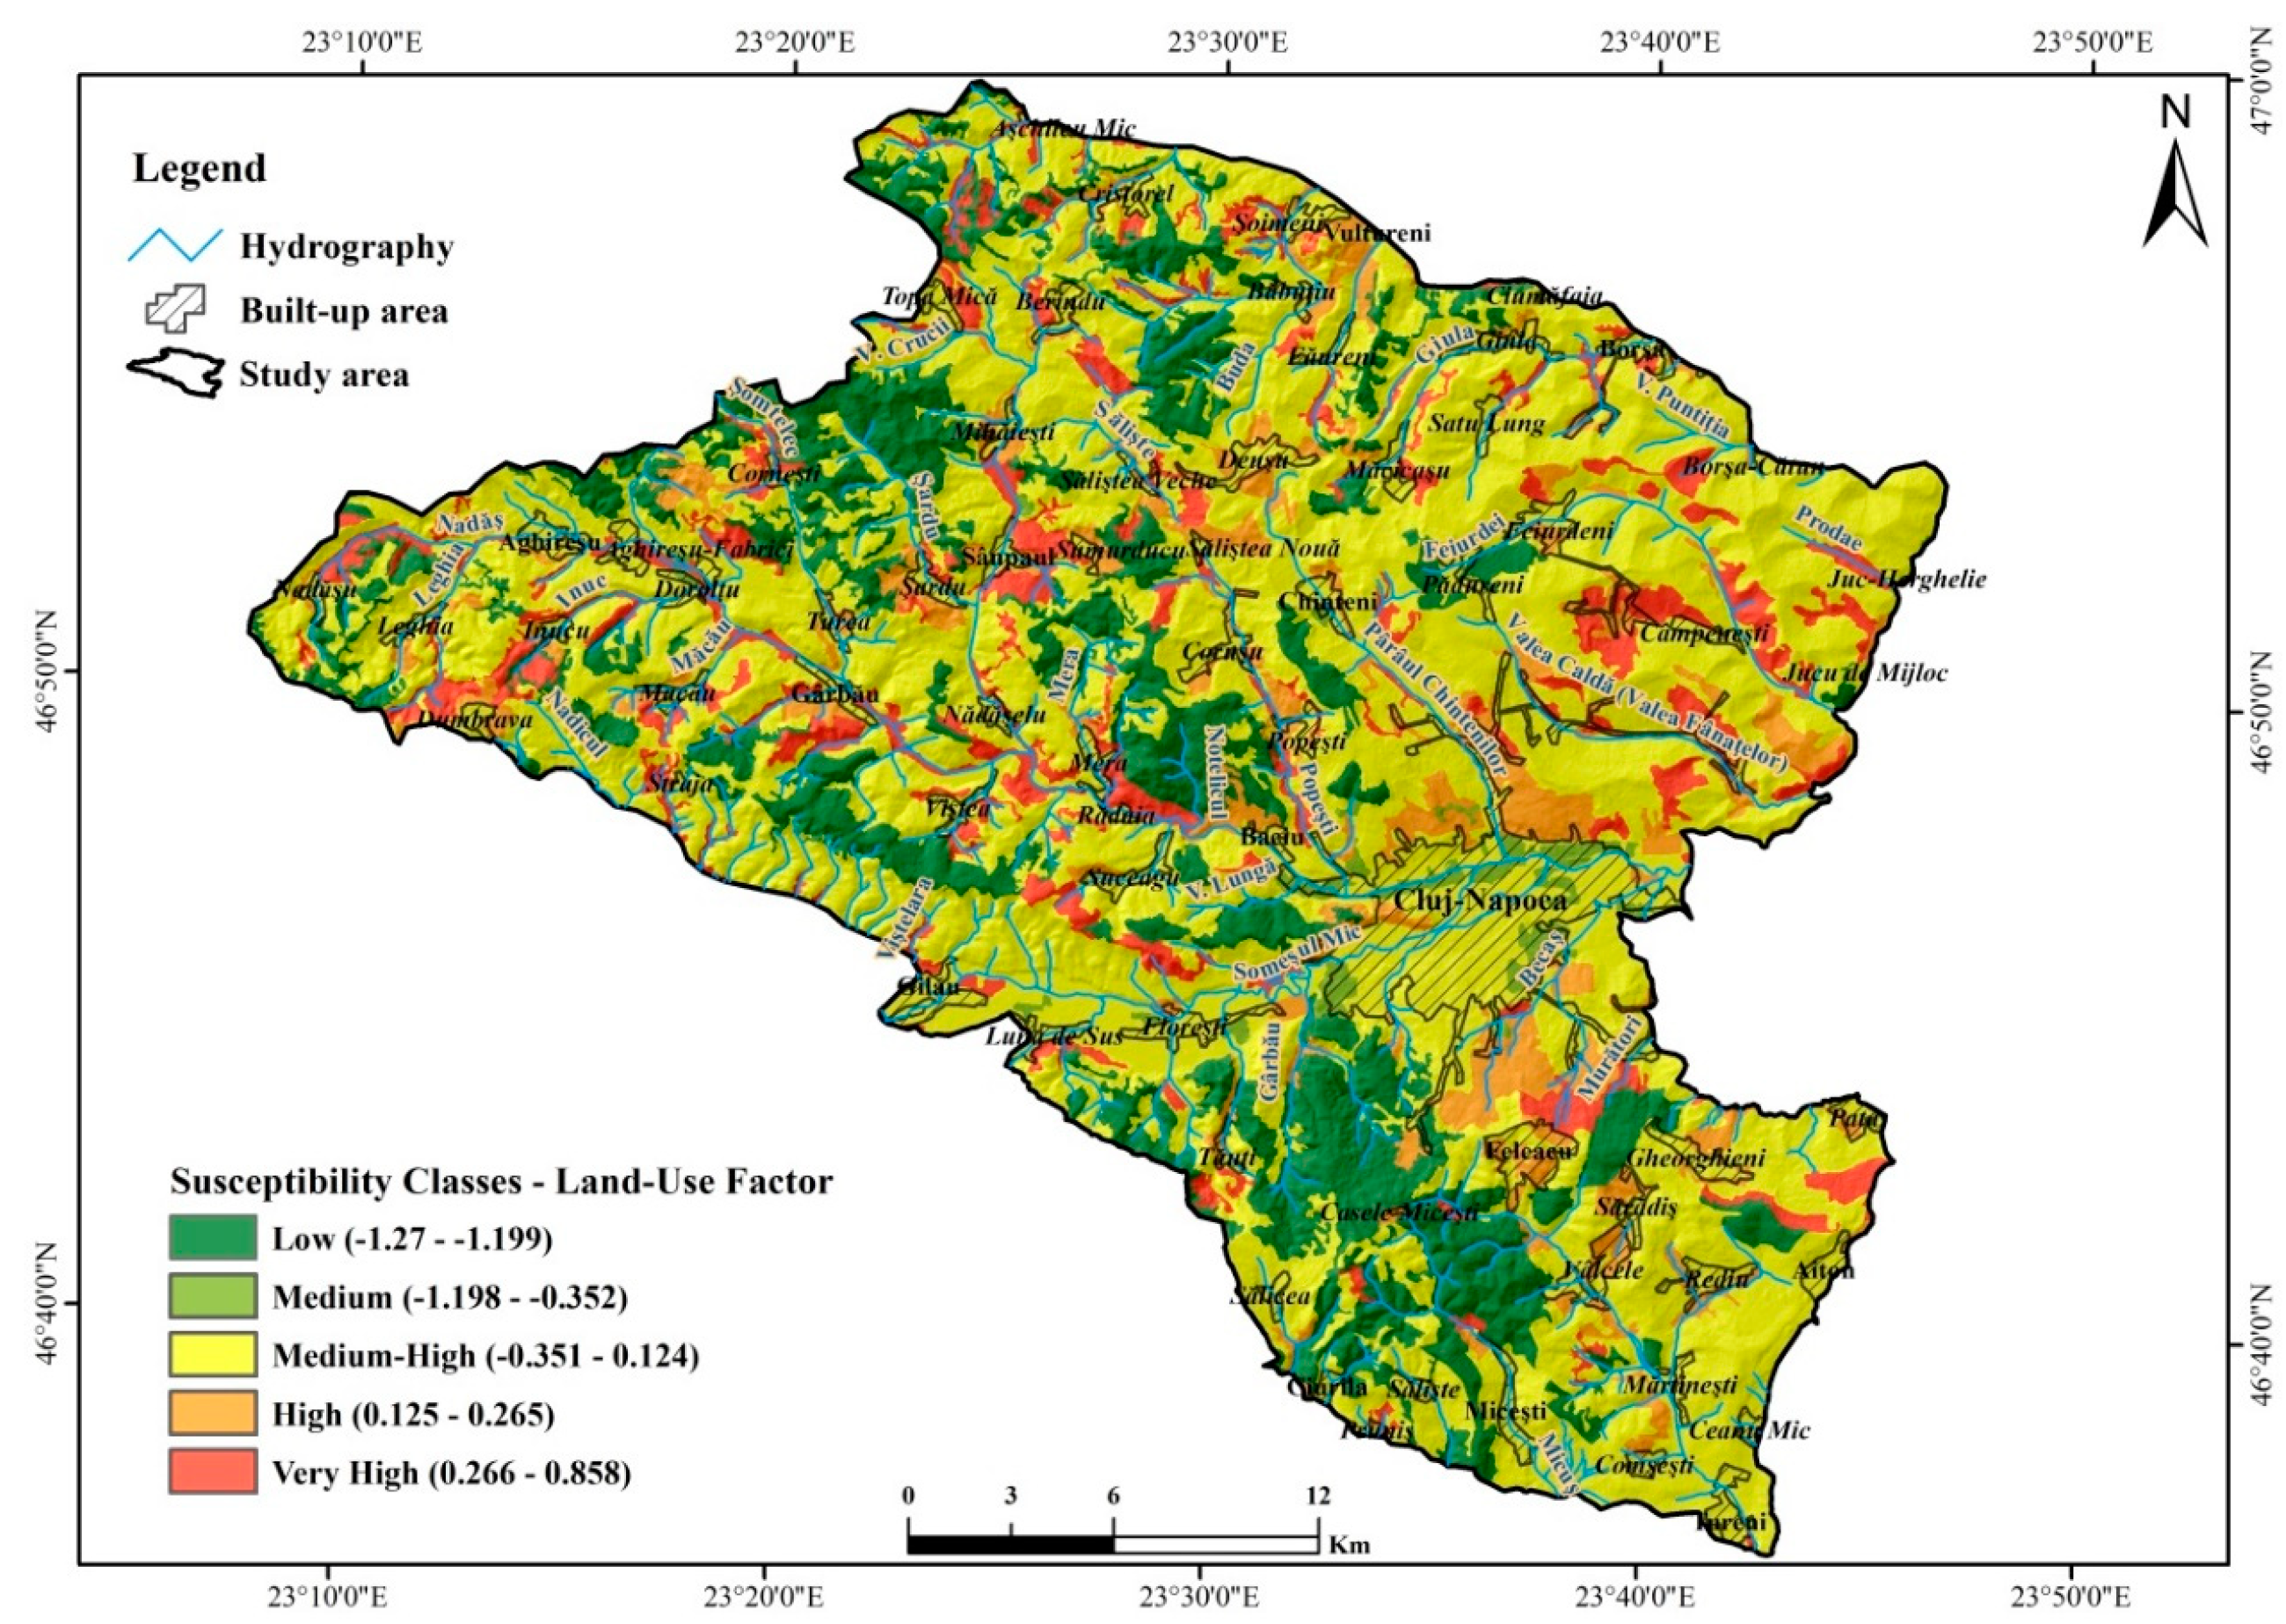
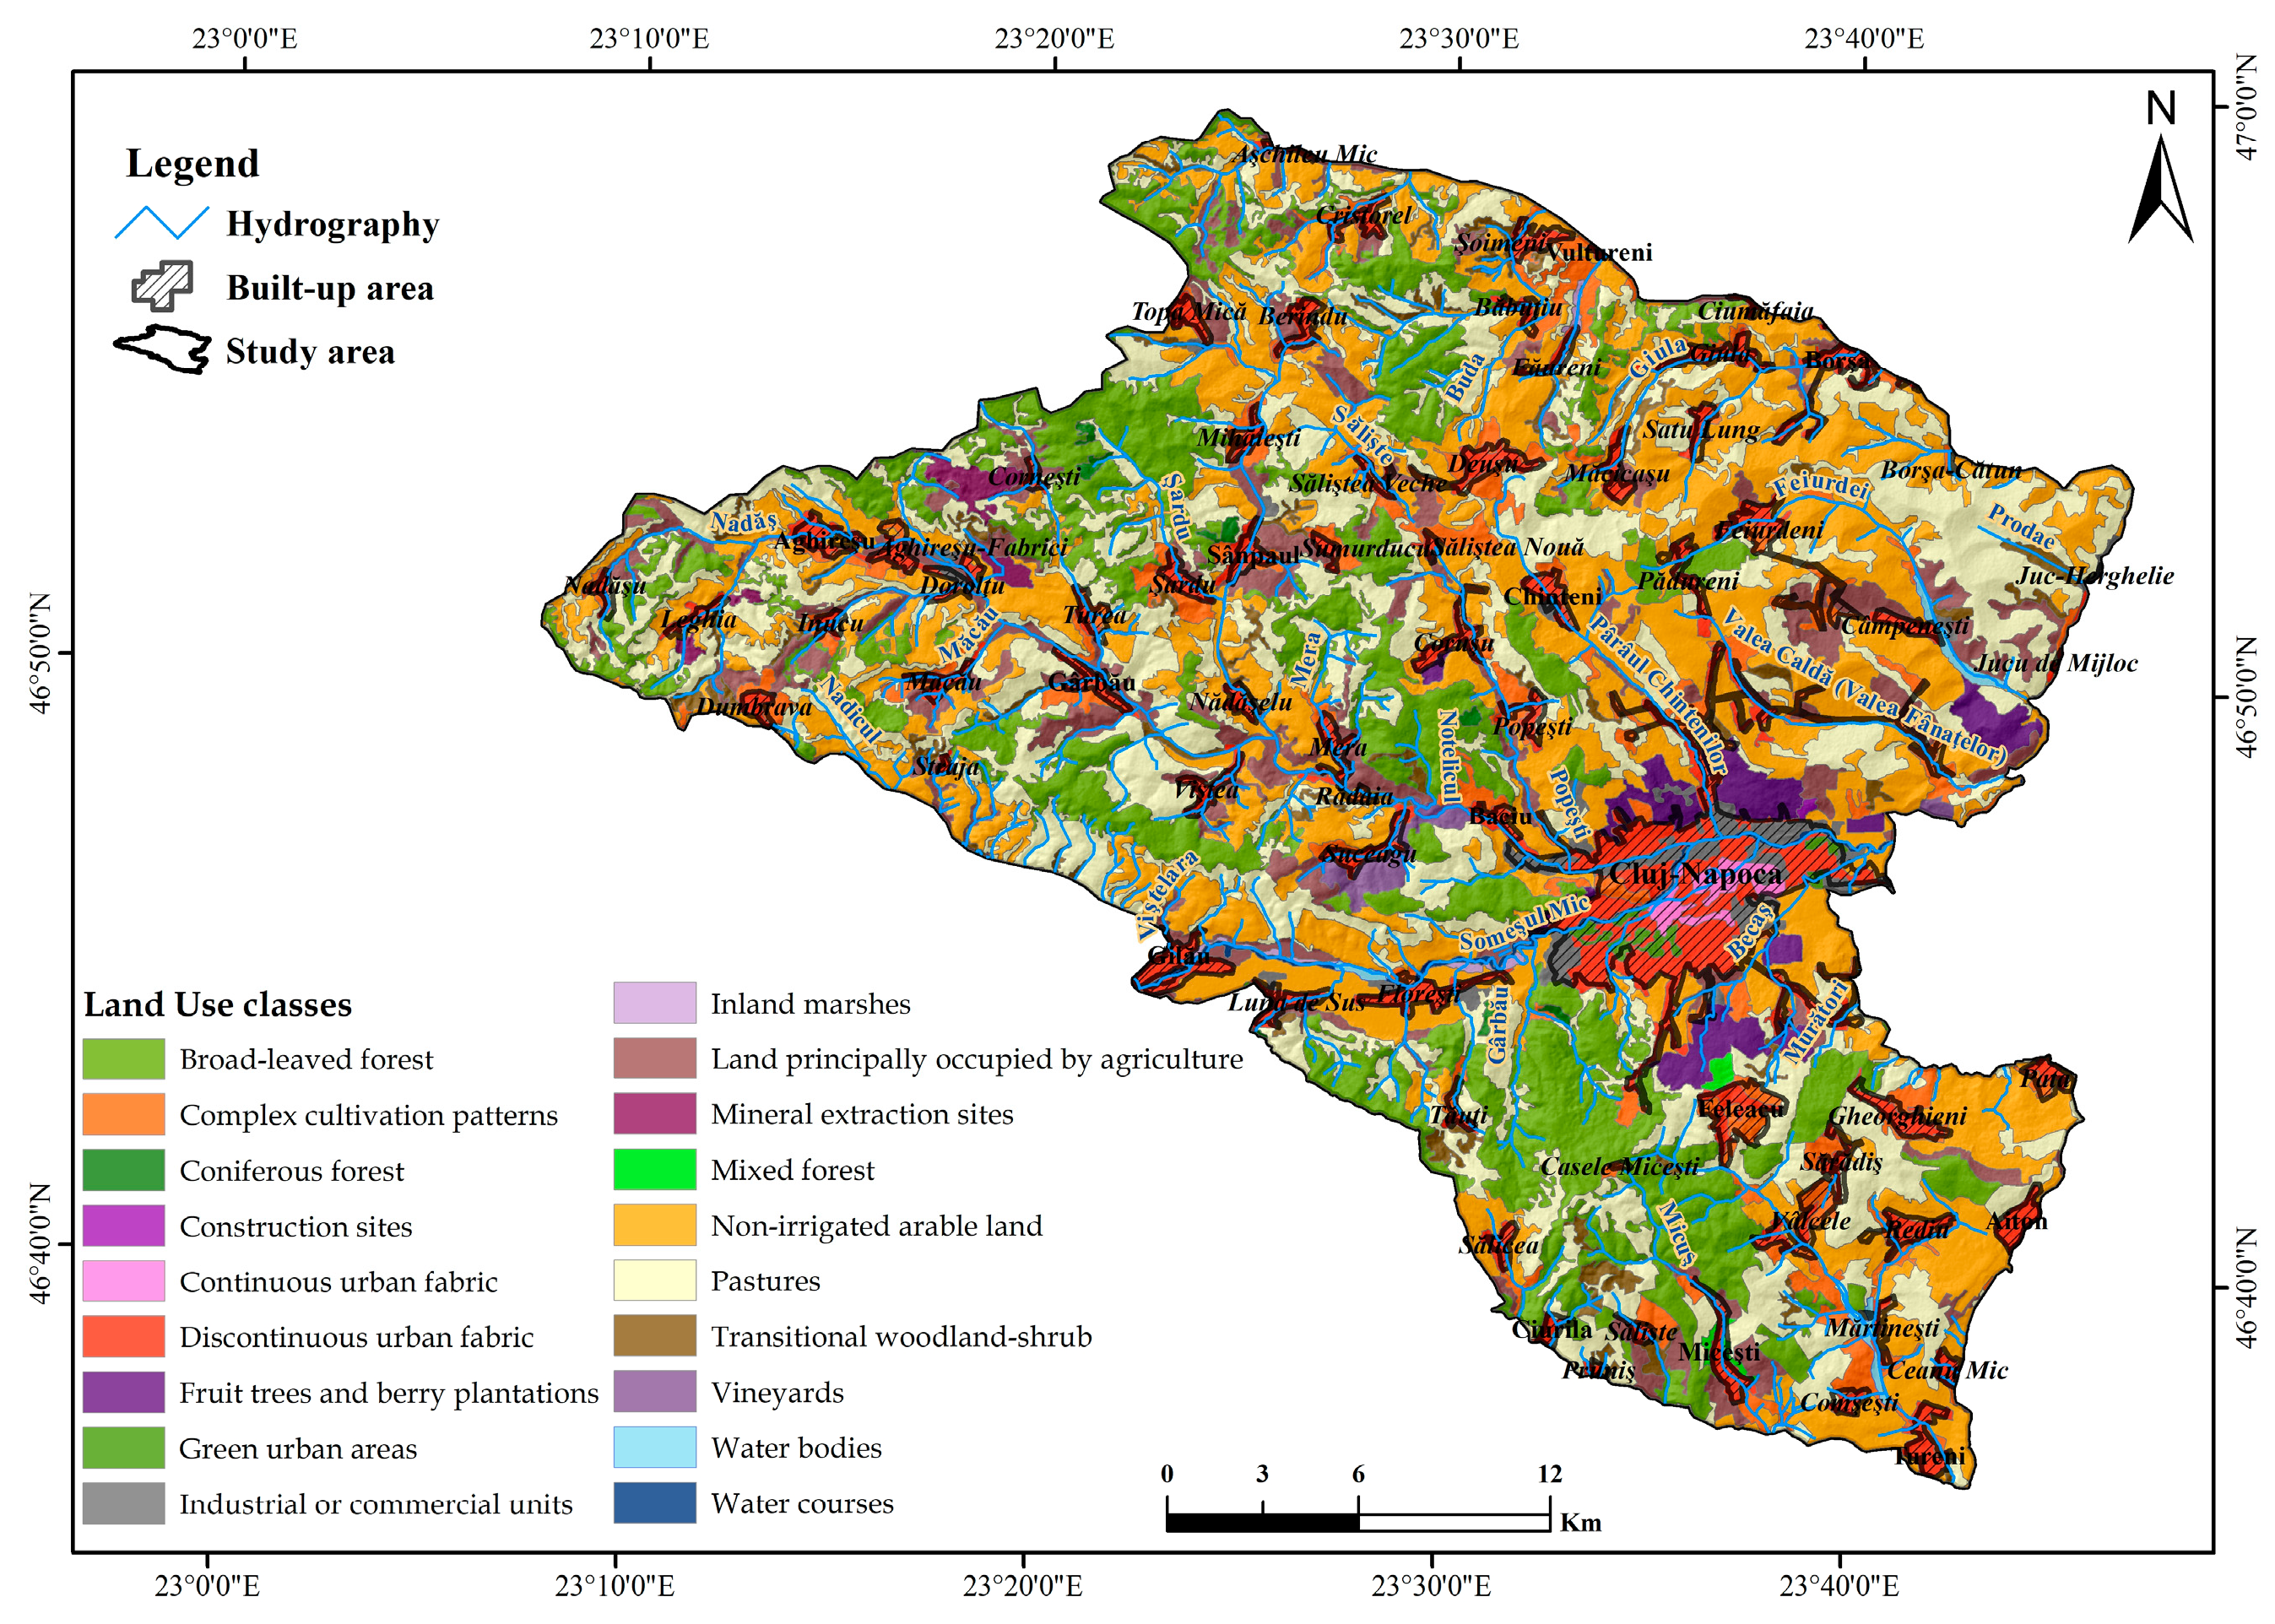
3.9. Land-Use Factor

The analysis of the land-use highlights the agricultural character of the study area, so the largest area of land is occupied with arable land not irrigated (295.41 km2), meadows (248.12 km2) and deciduous forests (191.35 km2) (Table 10).
Agricultural work, ploughing and sowing operations, which do not meet the technical requirements (ploughing and sowing on hill slope direction), cause the rainwater to flow faster into the soil, thus creating favourable conditions for excessive soil wetness and sliding land for areas with clay and semi-clay geological substrate [29,31]. In the analysed area, the deciduous forests play a dual role in the landslides: they primarily have the role of stabilizing and mitigating surface erosion for the low slopes of the low hills, and secondly they play a destabilizing role for inclined slopes due to overloading (Figure 11 and Figure 12).
At the spatial level, the medium to high probability has the largest territorial expansion of approximately 63% of the total territory being spatially identified in the immediate vicinity of the constructed areas, thus inducing a moderate risk, followed by a small probability of approximately 18% of the spatially identified territory generally in high hill areas with low slopes and interfluids, and to a small extent in the immediate vicinity of secondary hydrographic networks.

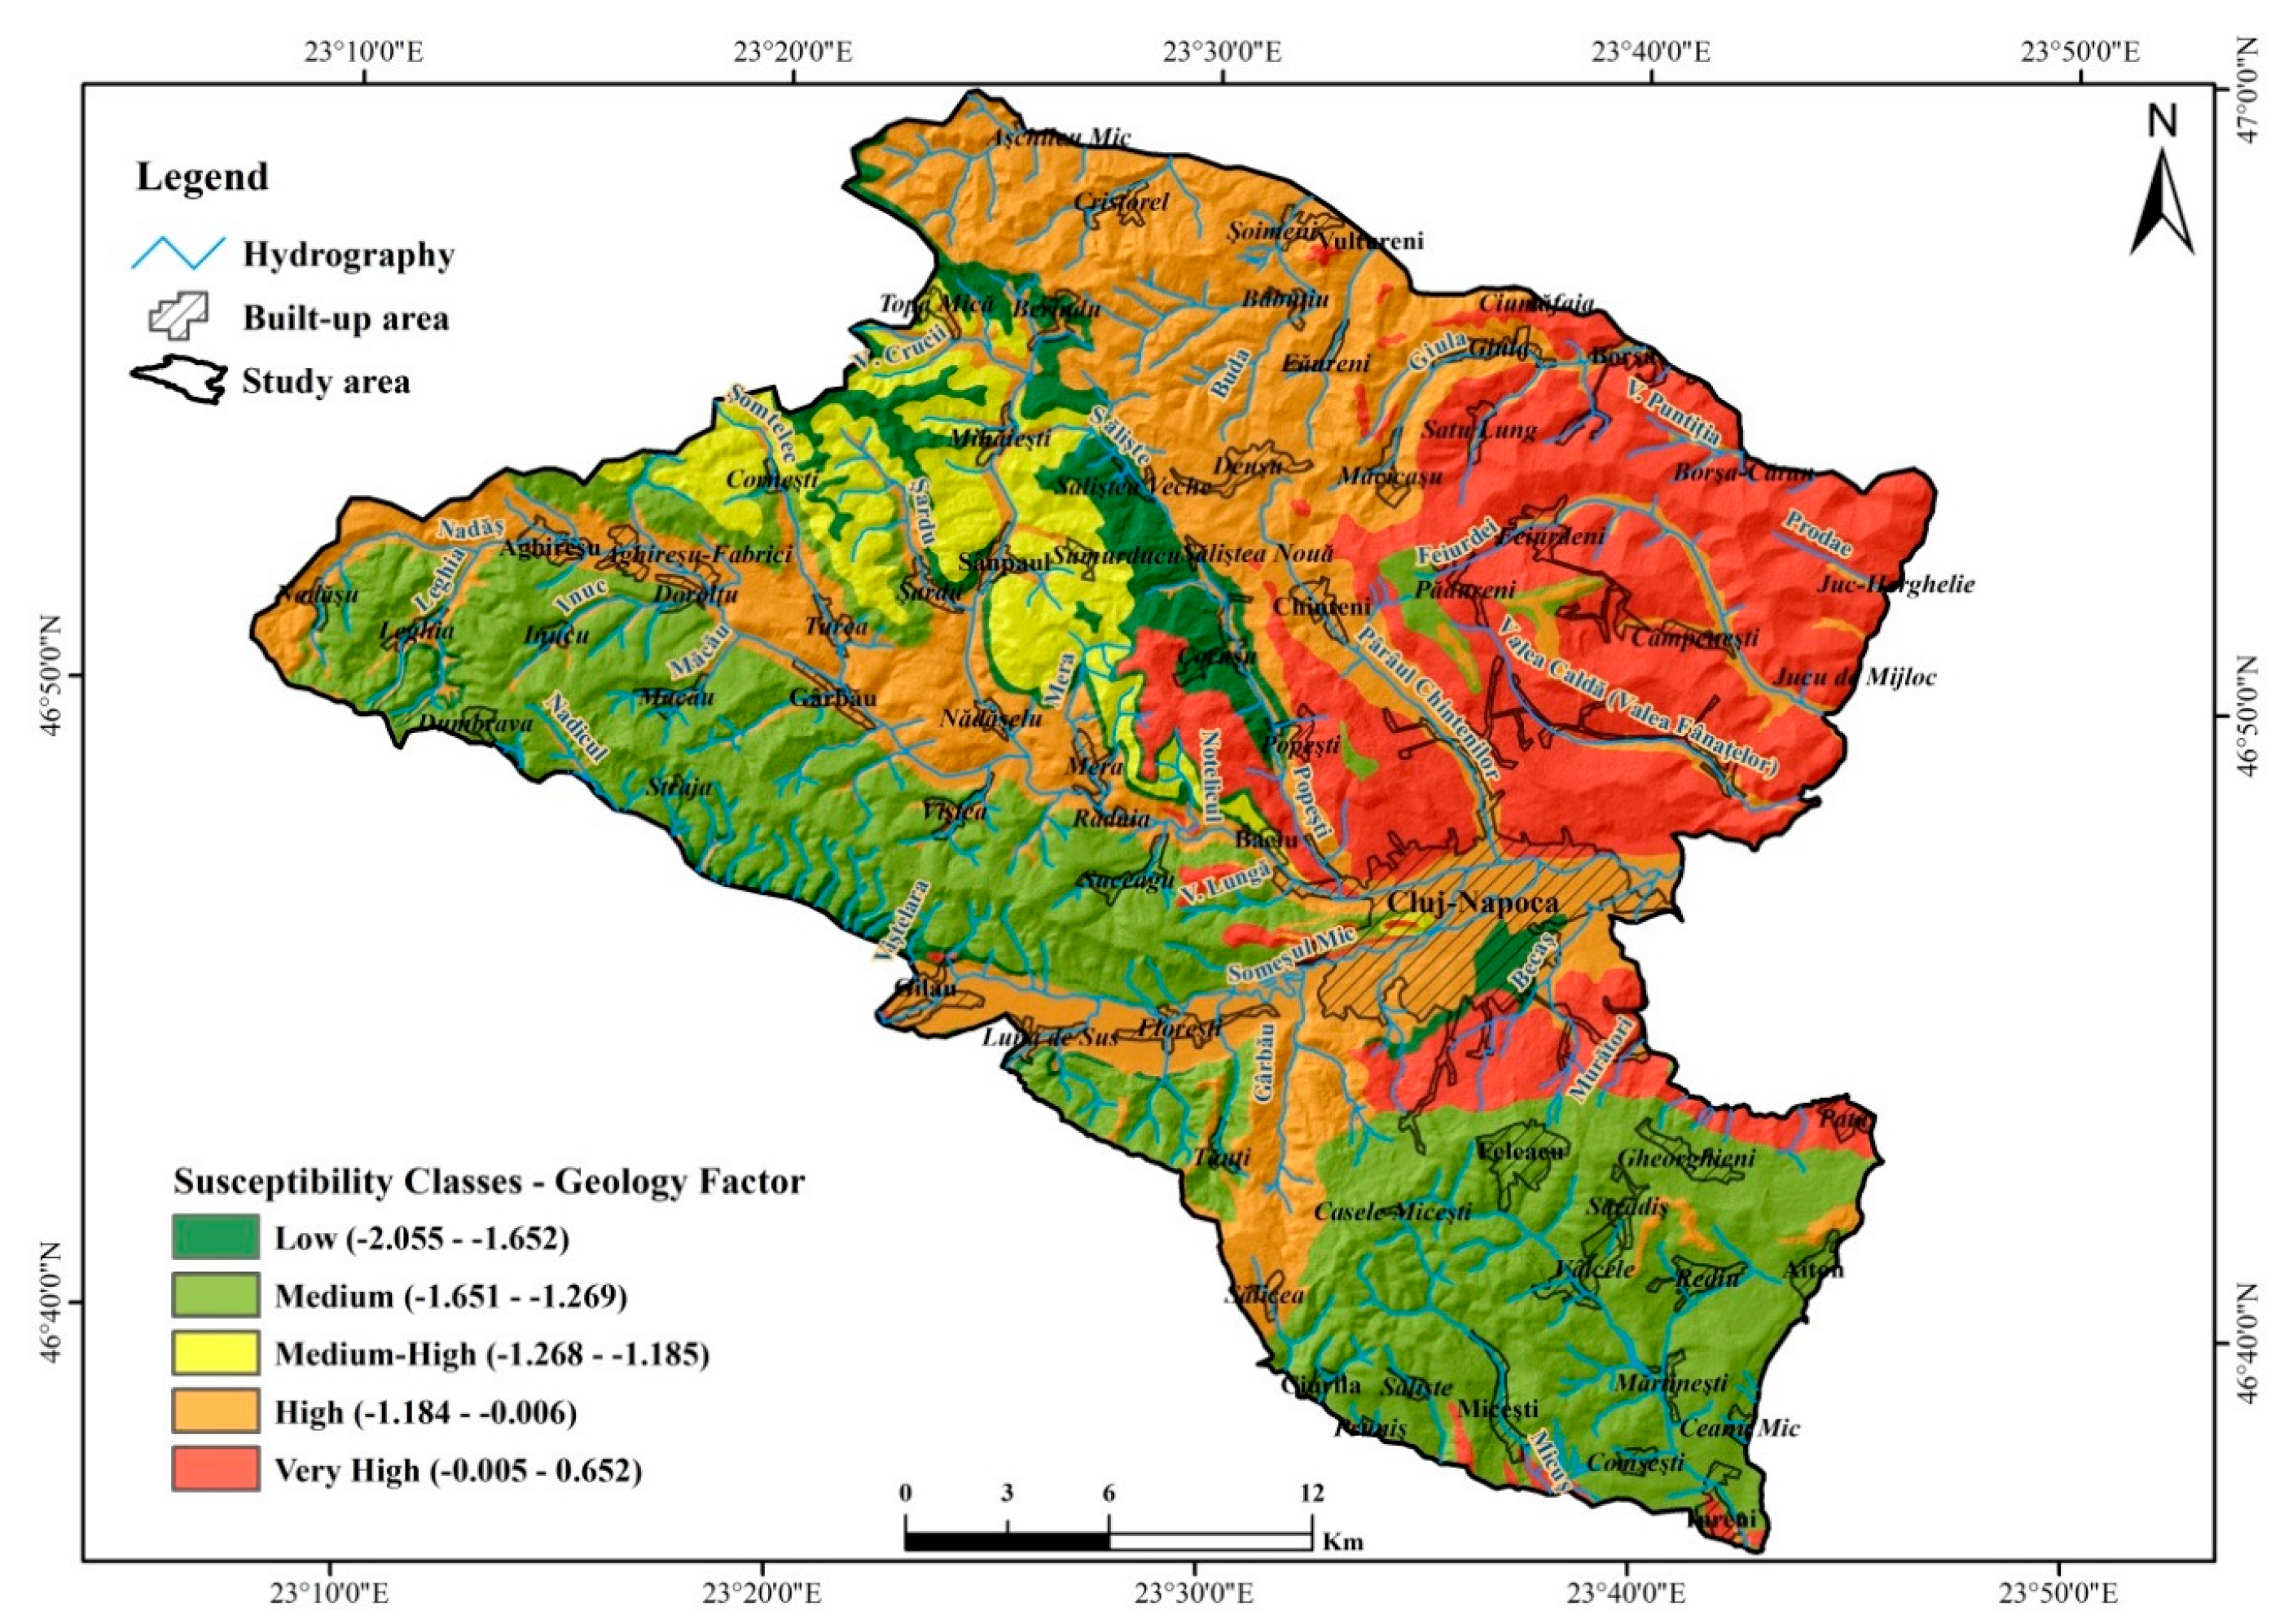
3.10. Geology Factor

Most of the active landslides within the study area have developed on a geology dominated by marl, tuffs and gravel, poorly cemented sands and clays, sandstone coal, marl for which a statistically high BSA was calculated, respectively 0.652, 0.511 and 0.286 (Table 11).
At the spatial level, the south-eastern extension of the analysed territory, which falls within the high and very high susceptibility class (approximately 56%), with a major impact on the human component of activity (mainly industrial and production activities) on the outskirts of Cluj-Napoca, as well as on the newly developed residential areas in favour of pastures and orchards. An important area of the total surface analysed (32.29%) is classified as medium and low susceptibility class (approximately 38%), which is spatially identified on the entire western side of the territory. This is explained by the geology, respectively lithology specific to the hill-mountain contact areas of the Apuseni Mountains (Figure 13 and Figure 14).

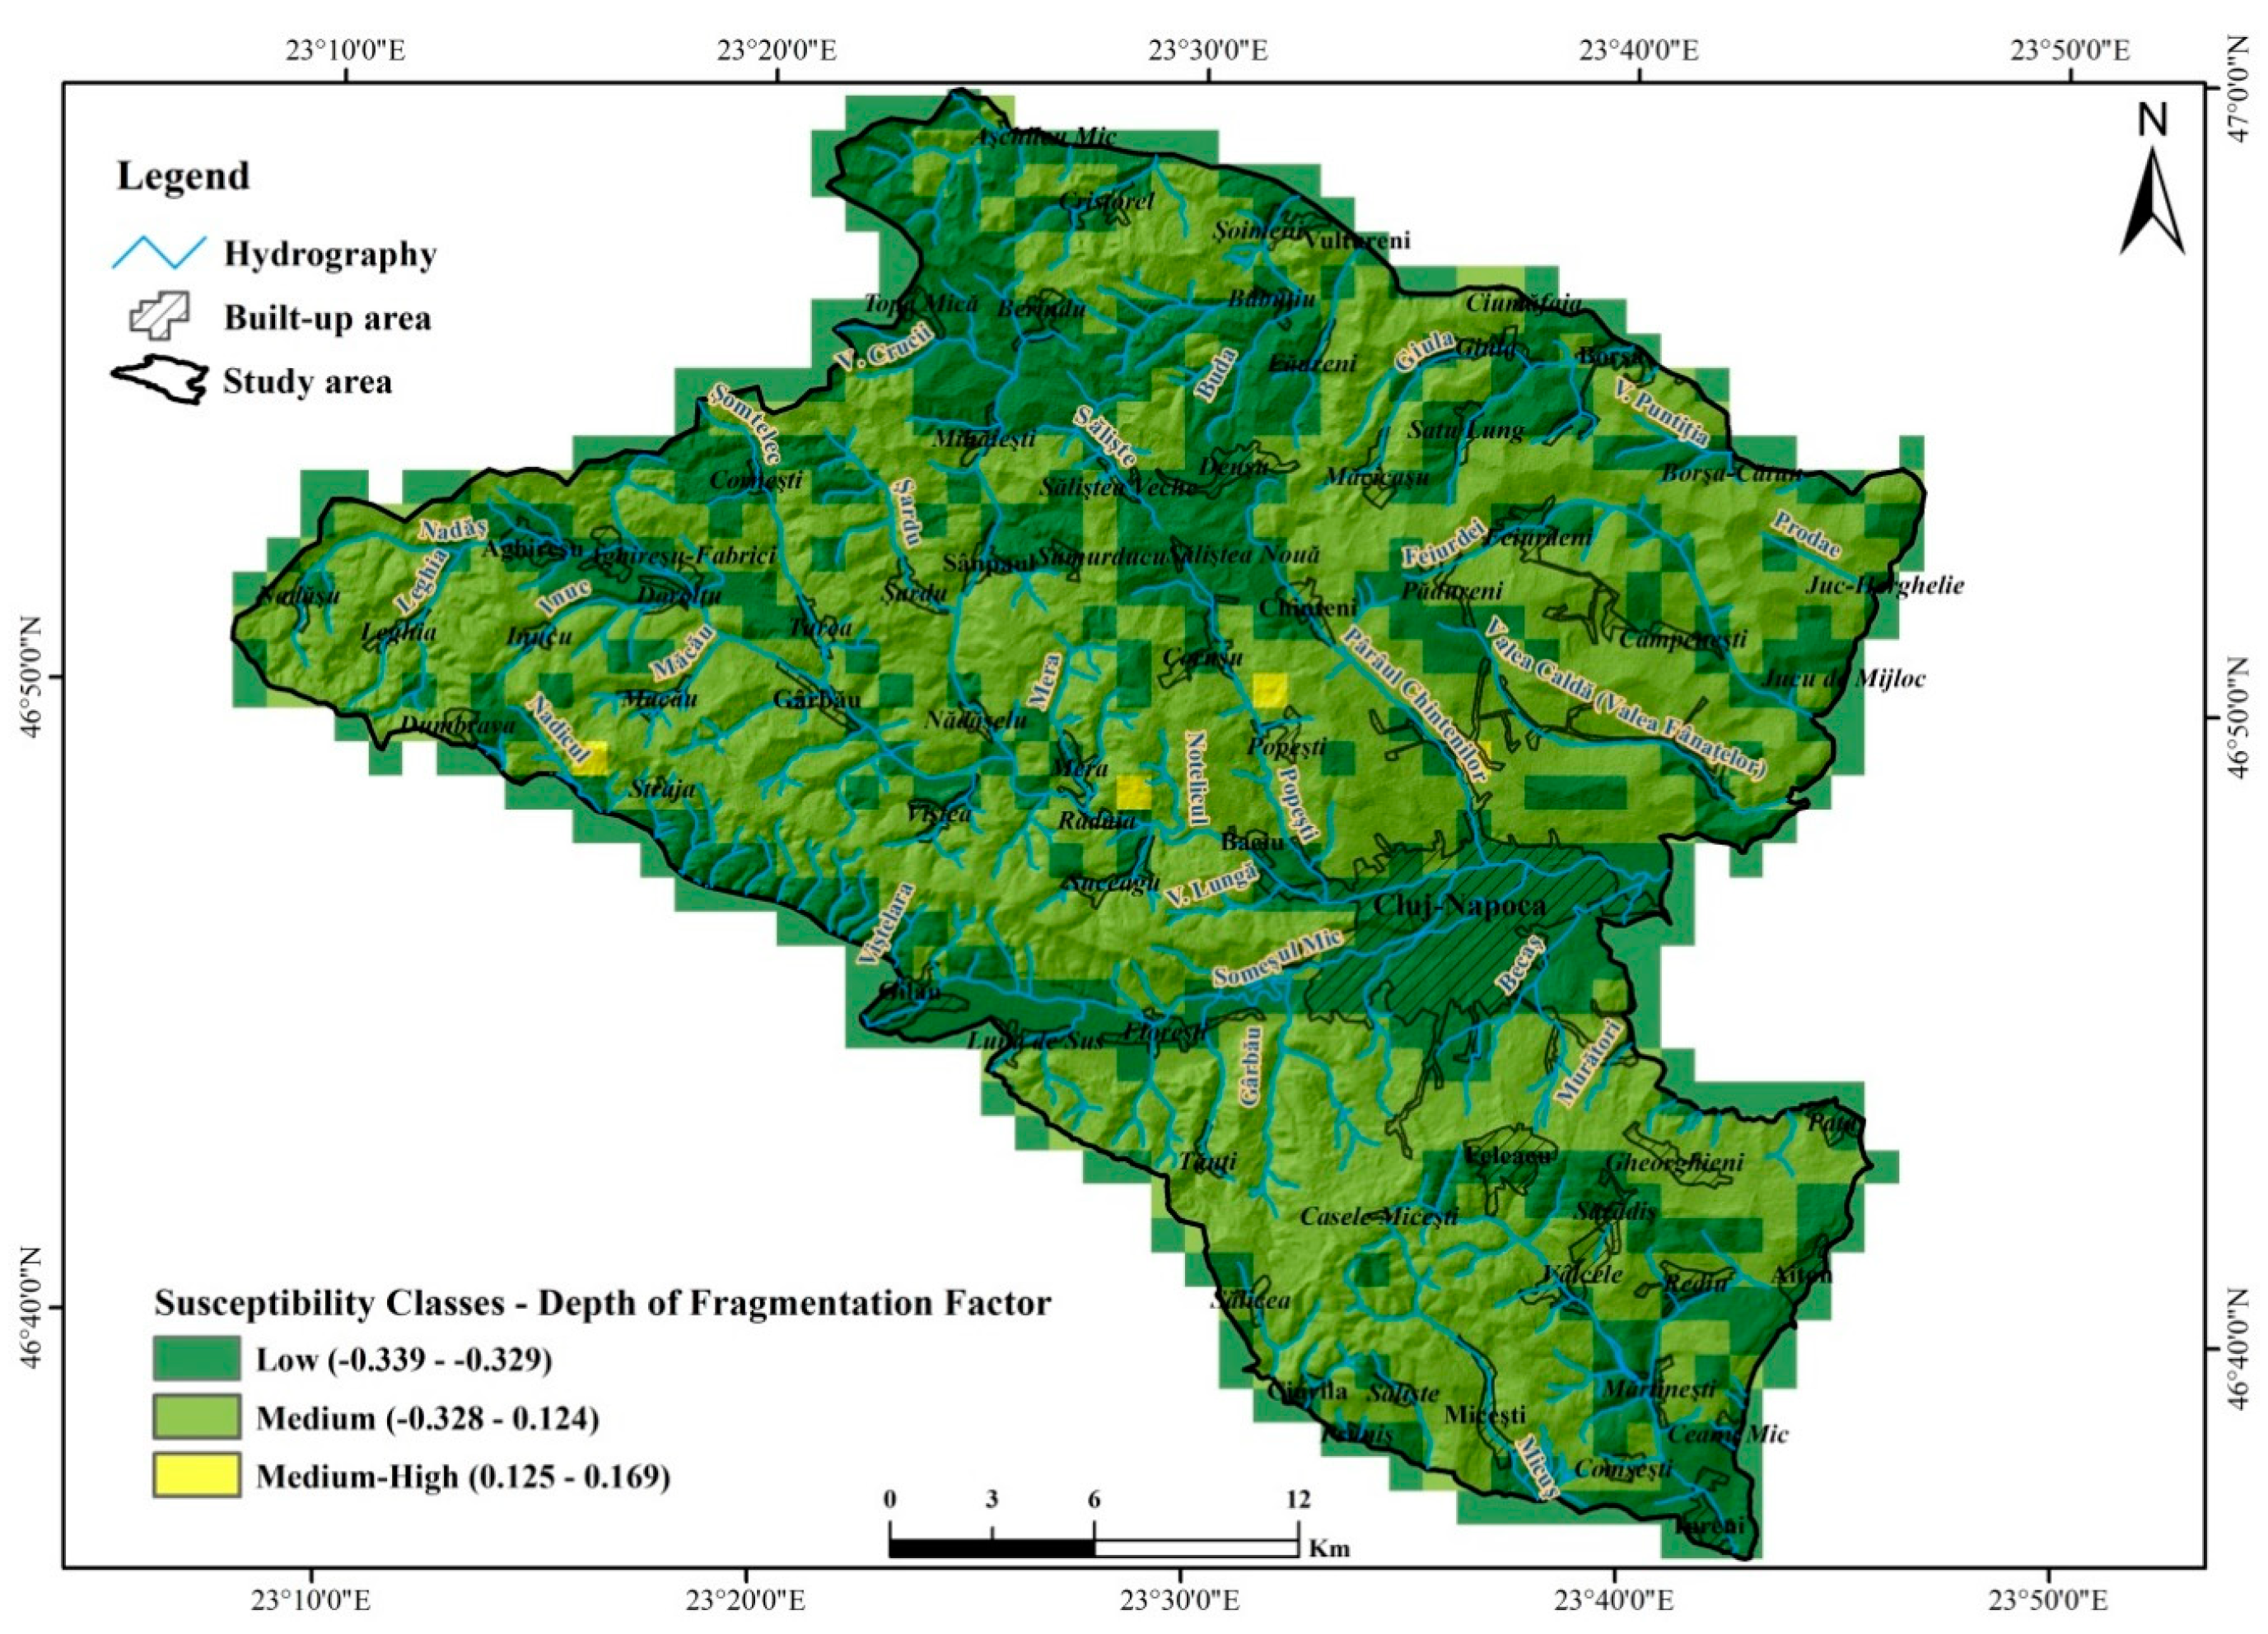
3.11. Depth of Fragmentation Factor

The depth of fragmentation expressed in m/km2 provides additional information regarding the energy available to trigger landslides, so territories with higher values of fragmentation depths above 200 m/km2 are characterized by the highest values of the BSA statistical indicator (0.16) and those that are less than 100 m/km2 have the lowest influence on the probability of landslides (Table 12).
As observed by the analysis of the altitude factor, the area of study is represented by a predominantly hilly territory with an average relief energy which induces the classification for the largest part of the territory in the average susceptibility class (−0.329 to 0.124 BSA statistical value), the high values being isolated in the high hill area and in contact with the adjacent mountain (Figure 15).

3.12. Density of Fragmentation Factor

Density fragmentation (expressed in km/km2) highlights territories with a high density of the hydrographic network, density increasing the probability of landslides due to erosion, the appearance and dynamics of landslides. For the analysed territory, the highest density of landslides was identified for the range 0–1 km/km2, which is also reflected on the values calculated based on the BSA equation (Table 13). Regarding the spatial expansion of the susceptibility classes, the very high class stands out, with about 67% of the total territory overlapping mostly with low fragmentation areas (Figure 16).

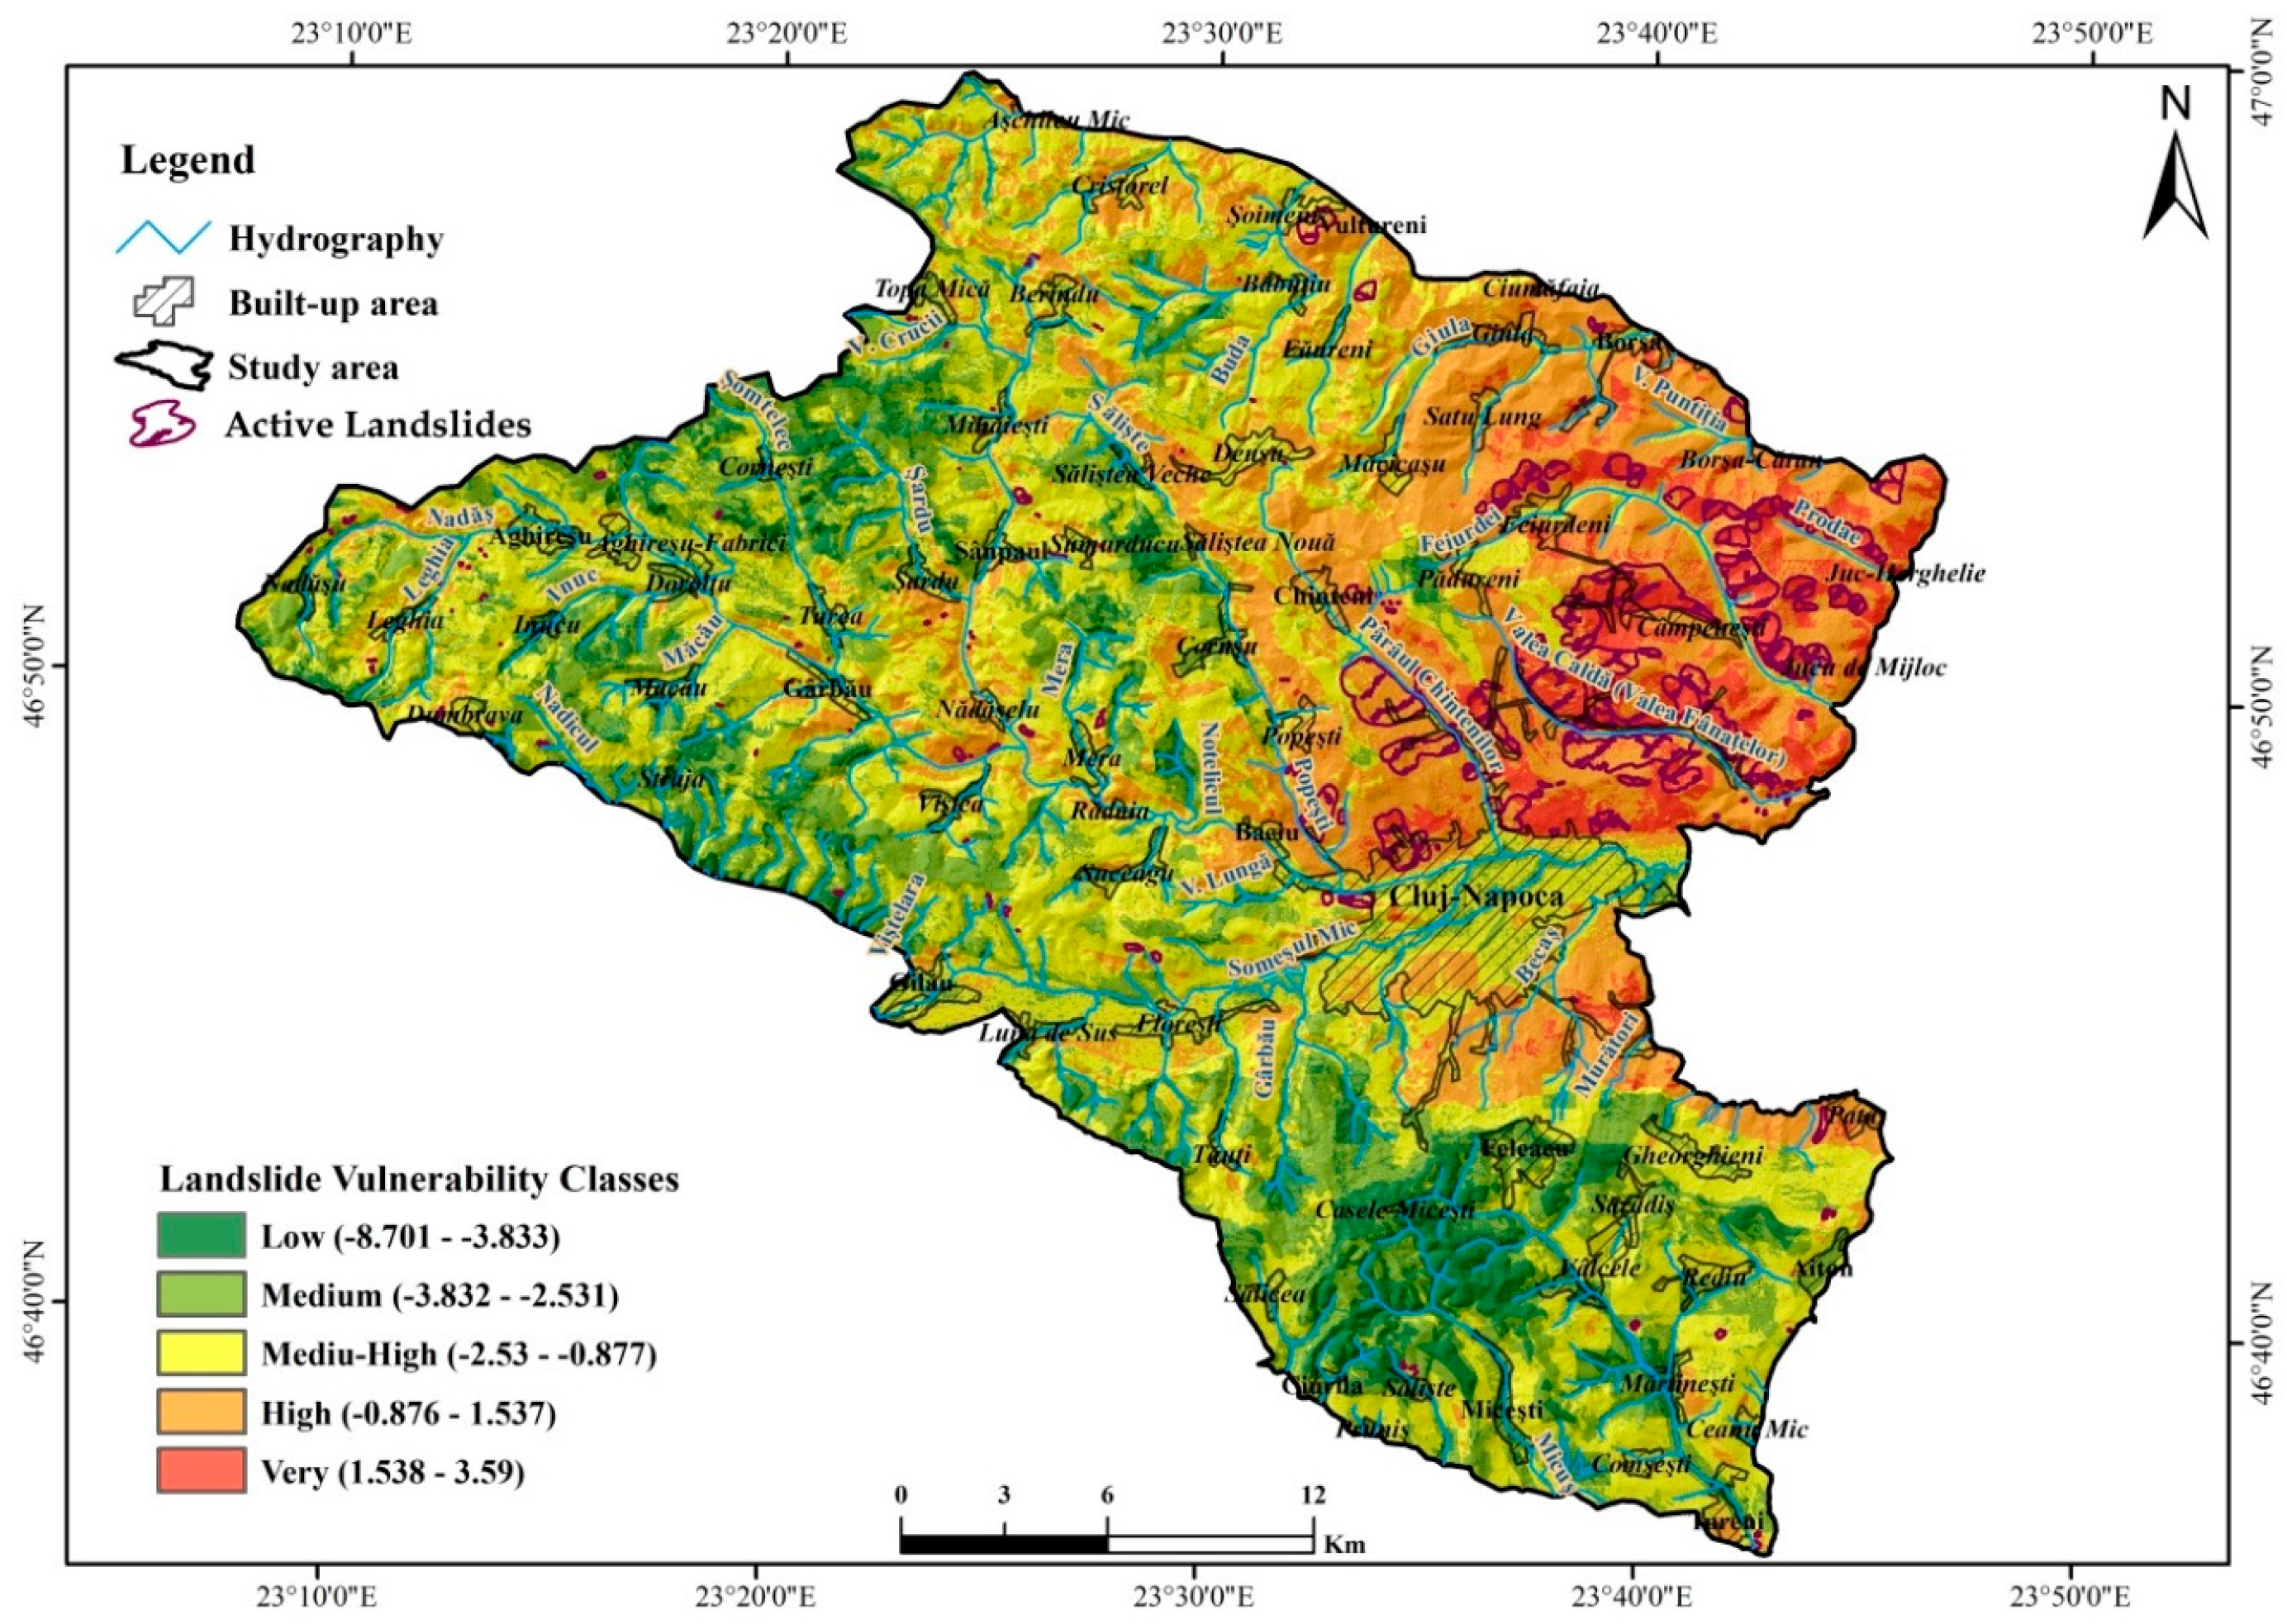
3.13. Cumulated Landslide Susceptibility Analysis

The cumulative analysis of susceptibility according to the proposed model requires the integration of all previously analysed individual factors into an equation of all probability values calculated for each spread of each factor, thus establishing the overall cumulative influence of the probability values:
“DEM” + “slope” + “geology” + “aspect” + dist_to_sett.” + “dist_to_roads” + “dist_to_hidro” + “density_of_fragm” + “depth_of_fragm” + “WI” + “SPI” + “CLS”,
As a result of applying the spatial analysis equation was obtained the spatial susceptibility accumulated for the entire territory with probability values comprised in the range of −8.70 to 3.58. Following the application of the BSA model to determine the spatial probability of landslides according to the specific statistical values of each class of triggering and causing factors, the the final susceptibility map was obtained (Figure 17).

4. Discussion

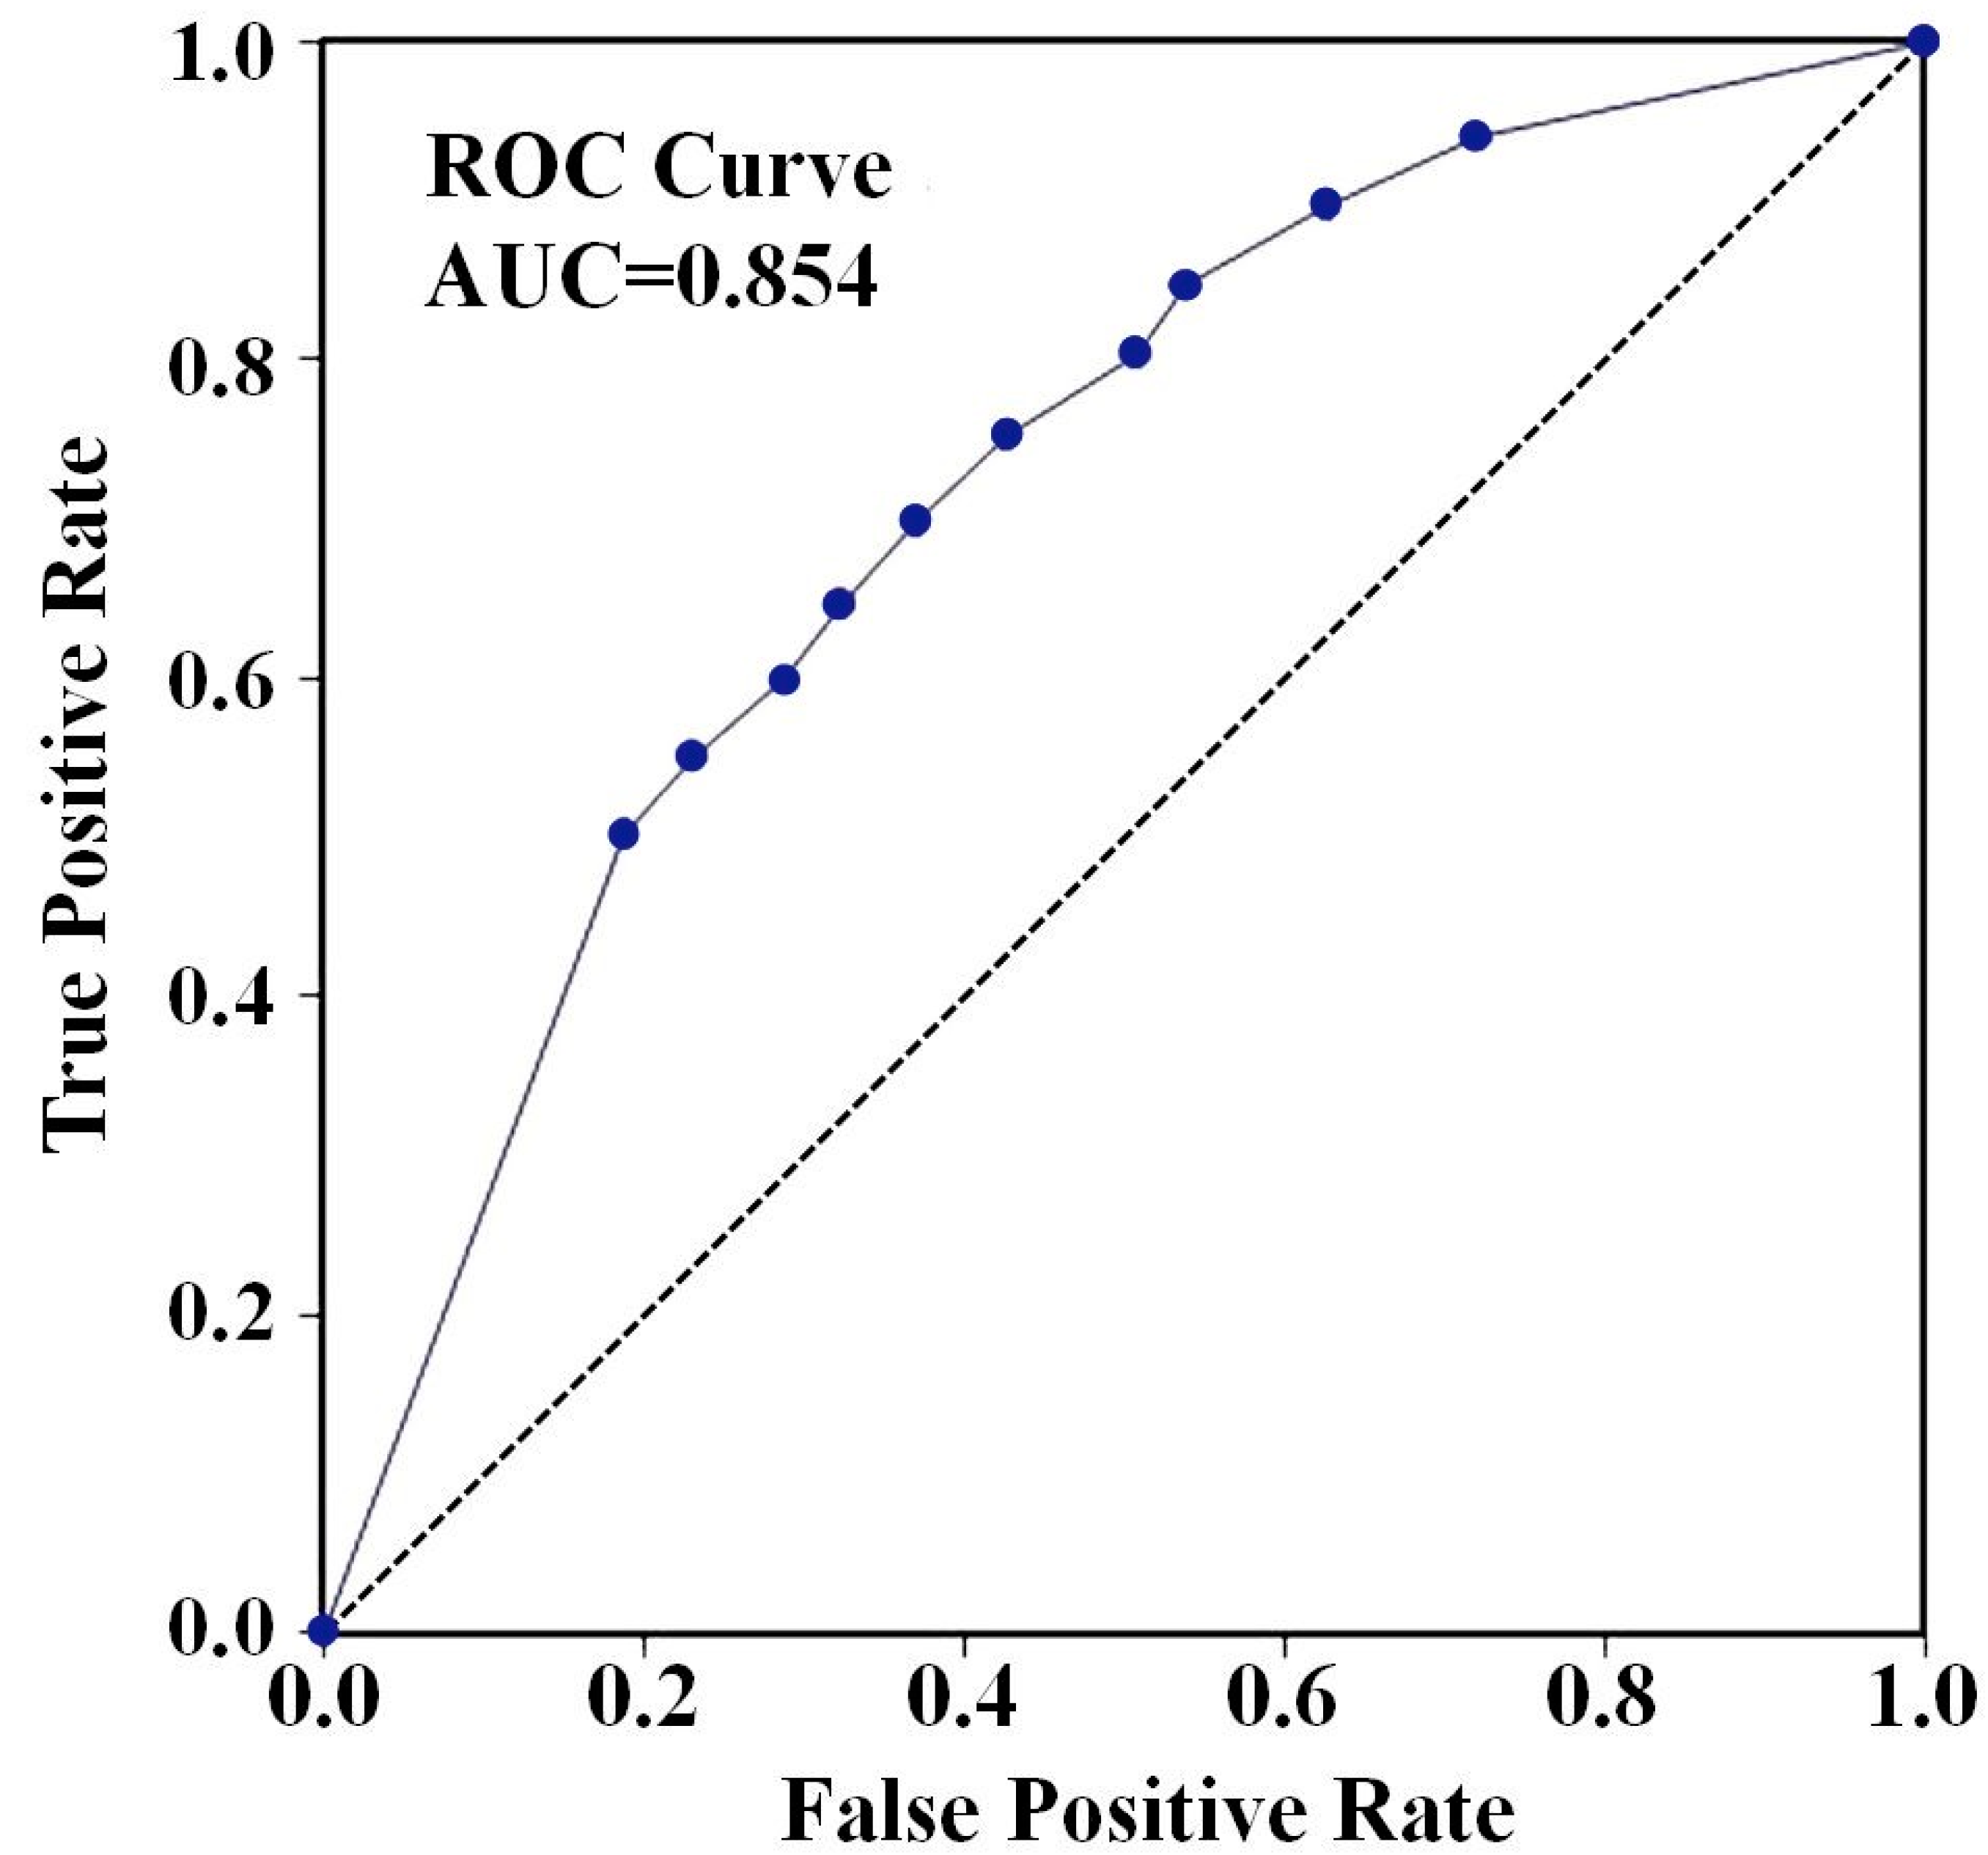
4.1. Model Validation

In order to identify the degree of predictability of the BSA model applied for the identification of the probability classes of landslides in the studied area, the AUROC (Area under the Receiver Operating Characteristic) curve method was used (Figure 18). The validation value of 0.854 indicates the relationship between true positive values (model sensitivity) and true negative values (model specificity) resulting in a large validation of the result, as it is known that the closer AUROC value is to 1, the more it reflects the degree of validation of the chosen method as well as of the database used [41,42,43,44].
Compared with simple statistics such as landslide percentage per susceptible zones and the proportion of correctly classified events derived from a confusion matrix used to valid landslide susceptibility maps and the inefficiency of these models, threshold-independent methods, like receiver operating characteristic (ROC), have been extensively used for validation [20,45,46,47,48,49].

4.2. General Considerations

From the point of view of the risk induced in the territory following the analysis of the final outcome of the modelling, several hotspots of major importance stand out. The surface overlapping the northern hills in the city of Cluj-Napoca falls within the category of very high landslides susceptibility, thus inducing a high risk on the territorial infrastructure of housing and services (residential structures, urban networks, tourist facilities) and on the communication lines developed in the respective area [50].
For all analysed hotspots and for the rest of the territory classified as high and very high susceptibility, it is recommended to carry out ameliorative and stabilization works to reduce or remove these areas from the risk categories with major impact on the human component.
To a great degree, the territory under consideration falls into the low to medium-high susceptibility category with a larger percentage of low and medium susceptibility, territorial areas that do not require special work in terms of their operation and arrangement in terms of stabilization and to prevent landslides.

5. Conclusions

The realization of the spatial analysis model for the identification of landslides makes the time efficiency allocated for the analysis of extended territorial areas to be reduced and their evaluation done in a shorter time leading to a faster anticipation of the induced risk and decision making to reduce its effects. In the present study, based on the BSA model, a number of 12 triggering factors of the landslide process were analysed individually, each being analysed as impact of susceptibility and risk generation in the territory. The final analysis of landslides susceptibility was achieved by aggregating individual factors as a result of the application of spatial analysis equations and validation of the final result. Several hotspots have been identified as high and very high risk areas for which ameliorative and stabilization works are absolutely necessary in order to prevent disasters or catastrophes.
The very good validation of the model based on the 0.854 AUROC curve value highlights the good realization and credibility of the model both from a methodological and practical point of view, recommending such models for derivation and use in research on similar surfaces in terms of morphometric and geological characteristics.
Landslide susceptibility assessment in regards to BSA values across the five classes has provided a better understanding of the model and the factors that contribute to the peculiarities of these hazards in the investigated regions.

Author Contributions

All authors have contributed equally to the work.

Funding

This research received no external funding.

Acknowledgments

The first author (P.S.) is thankful to the Doctoral School from UASVM Bucharest for the support received in his research during doctoral stage.

Conflicts of Interest

The authors declare no conflict of interest.

References

  1. Armaș, I. An analytic multicriteria hierarchical approach to assess landslide vulnerability. Case study: Cornu Village/Romania. Z. Geomorphol. 2011, 55, 209–229. [Google Scholar] [CrossRef]
  2. Bilaşco, Ş.; Horvath, C.; Cocean, P.; Sorocovschi, V.; Oncu, M. Implementation of the USLE model using GIS techniques. Case study the Somesean Plateau. Carpath. J. Earth Environ. Sci. 2009, 4, 123–132. [Google Scholar]
  3. Petrea, D.; Bilasco, S.; Rosca, S.; Vescan, I.; Fodorean, I. The determination of the landslide occurrence probability by GIS spatial analysis of the land morphometric characteristics (Case Study: The Transylvanian Plateau). Carpath. J. Earth Environ. Sci. 2014, 9, 91–102. [Google Scholar]
  4. Bălteanu, D.; Micu, M. Landslide investigation: From morphodynamic mapping to hazard assessment. A case-study in the Romanian Subcarpathians: Muscel Catchment. In Landslide Process. From Geomorphologic Mapping to Dynamic Modelling; Malet, J.P., Remaitre, A., Bogaard, T., Eds.; CERG Editions: Strasbourg, France, 2009; pp. 235–241. [Google Scholar]
  5. Irimuș, I.-A.; Roșca, S.; Rus, M.-I.; Marian, F.L.; Bilașco, S. Landslide susceptibility assessment in Almas Basin by means of the frequency rate and GIS techniques. Geogr. Technol. 2017, 12, 97–109. [Google Scholar] [CrossRef]
  6. Varnes, D.J. Slope movement types and processes. In Special Report 176: Landslides: Analysis and Control Transportation and Road Research Board; Schuster, R.L., Krizek, R.J., Eds.; National Academy of Science: Washington, DC, USA, 1978; pp. 11–33. [Google Scholar]
  7. Cruden, D.M.; Varnes, D.J. Landslides types and processes. In Landslides Investigation and Mitigation; Special Report, 247; Turner, A.K., Schuster, R.L., Eds.; Transportation Research Board, National Research Council: Washington, DC, USA, 1996; pp. 36–75. [Google Scholar]
  8. Jaedicke, C.; Van Den Eeckhaut, M.; Nadim, F.; Hervás, J.; Kalsnes, B.; Vangelsten, B.V.; Smith, J.T.; Tofani, V.; Ciurean, R.; Winter, M.G. Identification of landslide hazard and risk ‘hotspots’ in Europe. Bull. Eng. Geol. Environ. 2014, 73, 325–339. [Google Scholar] [CrossRef]
  9. Carrara, A.; Cardinali, M.; Guzzetti, F.; Reichenbach, P. GIS-based technology in mapping landslide hazard. In Geographical Information Systems in Assessing Natural Hazards; Carrara, A., Guzzetti, F., Eds.; Kluwer Acad. Publications: Dordrecht, The Netherlands, 1995; pp. 135–176. [Google Scholar]
  10. Dai, F.; Lee, C.; Ngai, Y.Y. Landslide risk assessment and management: An overview. Eng. Geol. 2002, 64, 65–87. [Google Scholar] [CrossRef]
  11. Spalevic, V.; Lakicevic, M.; Radanovic, D.; Billi, P.; Barovic, G.; Vujacic, D.; Sestras, P.; Khaledi Darvishan, A. Ecological-economic (Eco-Eco) modelling in the River Basins of Mountainous Regions: Impact of land cover changes on sediment yield in the Velicka Rijeka, Montenegro. Not. Bot. Horti Agrobo. 2017, 45, 602–610. [Google Scholar] [CrossRef]
  12. Carrara, A.; Guzzetti, F.; Cardinali, M.; Reichenbach, P. Use of GIS technology in the prediction and monitoring of landslide hazard. Nat. Hazards 1999, 20, 117–135. [Google Scholar] [CrossRef]
  13. Coe, J.A.; Godt, J.W.; Baum, R.L.; Bucknam, R.C.; Michael, J.A. Landslide susceptibility from topography in Guatemala. In Landslides: Evaluation and Stabilization; Lacerda, W.A., Ehrlich, M., Fontura, S.A.B., Sayao, A.S.F., Eds.; Taylor & Francis Group: London, UK, 2004; Volume 1, pp. 69–78. [Google Scholar]
  14. Coe, J.A.; Michael, J.A.; Crovelli, R.A.; Savage, W.Z.; Laprade, W.T.; Nashem, W.D. Probabilistic assessment of precipitation-triggered landslides using historical records of landslide occurrence, Seattle, Washington. Environ. Eng. Geosci. 2004, 10, 103–122. [Google Scholar] [CrossRef]
  15. Magliulo, P.; Di Lisio, A.; Russo, F.; Zelano, A. Geomorphology and landslide susceptibility assessment using GIS and bivariate statistics: A case study in southern Italy. Nat. Hazards 2008, 47, 411–435. [Google Scholar] [CrossRef]
  16. Jebur, M.N.; Pradhan, B.; Shafri, H.Z.M.; Yusoff, Z.M.; Tehrany, M.S. An integrated user-friendly ArcMAP tool for bivariate statistical modelling in geoscience applications. Geosci. Model Dev. 2015, 8, 881–891. [Google Scholar] [CrossRef] [Green Version]
  17. Jebur, M.N.; Pradhan, B.; Tehrany, M.S. Detection of vertical slope movement in highly vegetated tropical area of Gunung pass landslide, Malaysia, using L-band InSAR technique. Geosci. J. 2014, 18, 61–68. [Google Scholar] [CrossRef]
  18. Jebur, M.N.; Pradhan, B.; Tehrany, M.S. Using ALOS PALSAR derived high-resolution dinsar to detect slow-moving landslides in tropical forest: Cameron highlands, Malaysia. Geomat. Nat. Hazards Risk 2015, 6, 741–759. [Google Scholar] [CrossRef]
  19. Borrelli, L.; Ciurleo, M.; Gullà, G. Shallow Landslide Susceptibility Assessment in Granitic Rocks Using Gis-Based Statistical Methods: The Contribution of the Weathering Grade Map. Landslides 2018, 15, 1127–1142. [Google Scholar] [CrossRef]
  20. Ciurleo, M.; Cascini, L.; Calvello, M. A comparison of statistical and deterministic methods for shallow landslide susceptibility zoning in clayey soils. Eng. Geol. 2017, 223, 71–81. [Google Scholar] [CrossRef]
  21. Fell, R.; Corominas, J.; Bonnard, C.; Cascini, L.; Leroi, E.; Savage, W.Z. Guidelines for landslide susceptibility, hazard and risk zoning for land-use planning. Eng. Geol. 2008, 102, 99–111. [Google Scholar] [CrossRef] [Green Version]
  22. Radoane, M.; Radoane, N. Geomorfologie Aplicată; Editura University Suceava: Suceava, Romania, 2007; p. 378. [Google Scholar]
  23. Roșca, S. Bazinul Nirajului. Studiu de Geomorfologie Aplicată; Editura Risoprint: Cluj-Napoca, Romania, 2015; p. 384. [Google Scholar]
  24. Sestras, P.; Bondrea, M.; Cetean, H.; Sălăgean, T.; Bilaşco, Ş.; Naș, S.; Spalevic, V.; Fountas, S.; Cîmpeanu, S. Ameliorative, ecological and landscape roles of Făget Forest, Cluj-Napoca, Romania, and possibilities of avoiding risks based on GIS landslide susceptibility map. Not. Bot. Horti Agrobo. 2018, 46, 292–300. [Google Scholar] [CrossRef]
  25. Ercanoglu, M.; Kasmer, O.; Temiz, N. Adaptation and comparison of expert opinion to analytical hierarchy process for landslide susceptibility mapping. Bull. Eng. Geol. Environ. 2008, 67, 565–578. [Google Scholar] [CrossRef]
  26. Roșca, S.; Bilașco, S.; Petrea, D.; Vescan, I.; Fodorean, I.; Filip, S. Application of landslide hazard scenarios at annual scale in the Niraj River basin (Transylvania Depression, Romania). Nat. Hazards 2015, 77, 1573. [Google Scholar] [CrossRef]
  27. Van Westen, C.J.; Rengers, N.; Soeters, R. Use of geomorphological information in indirect landslide susceptibility assessment. Nat. Hazards 2003, 30, 399–419. [Google Scholar] [CrossRef]
  28. Thiery, Y.; Malet, J.-P.; Sterlacchini, S.; Puissant, A.; Maquaire, O. Landslide susceptibility assessment by bivariate methods at large scales: Application to a complex mountainous environment. Geomorphology 2007, 92, 38–59. [Google Scholar] [CrossRef] [Green Version]
  29. Bilaşco, Ş.; Roşca, S.; Păcurar, I.; Moldovan, N.; Boţ, A.; Negrușier, C.; Sestras, P.; Bondrea, M.; Naș, S. Identification of Land Suitability for Agricultural Use by Applying Morphometric and Risk Parameters Based on GIS Spatial Analysis. Not. Bot. Horti Agrobo. 2016, 44, 302–312. [Google Scholar] [CrossRef]
  30. Roșca, S.; Bilașco, S.; Petrea, D.; Vescan, I.; Fodorean, I. Comparative assessment of landslide susceptibility. Case study: The Niraj river basin (Transylvania depression, Romania). Geomat. Nat. Hazards Risk 2016, 7, 1043–1064. [Google Scholar] [CrossRef]
  31. Moldovan, N.; Păcurar, I.; Bilașco, S.; Roșca, S.; Boț, A. The analysis of vulnerability to landslides in order to determine the risk on farmland. Case study: Intercommunity association area for development Alba Iulia. ProEnviroment 2015, 8, 356–546. [Google Scholar]
  32. Chalkias, C.; Ferentinou, M.; Polykretis, C. GIS Supported Landslide Susceptibility Modeling at Regional Scale: An Expert-Based Fuzzy Weighting Method. ISPRS Int. J. Geo-Inf. 2014, 3, 523–539. [Google Scholar] [CrossRef] [Green Version]
  33. Sarkar, S.; Kanungo, D.P. An integrated approach for landslide susceptibility mapping using remote sensing and GIS. Photogramm. Eng. Rem. Sens. 2004, 70, 617–625. [Google Scholar] [CrossRef]
  34. Sestraş, P.; Sălăgean, T.; Bilașco, S.; Bondrea, M.V.; Naș, S.; Fountas, S.; Cîmpeanu, S.M. Prospect of a GIS based digitization and 3D model for a better management and land use in a specific micro-areal for crop trees. Environ. Eng. Manag. J. accepted.
  35. Beven, K.J.; Kirkby, M.J. A physically based, variable contributing area model of basin hydrology. Hydrol. Sci. Bull. 1979, 24, 43–69. [Google Scholar] [CrossRef]
  36. Moore, I.D.; Wilson, J.P. Length-slope factors for the revised universal soil loss equation: Simplified method of estimation. J. Soil Water Conserv. 1992, 47, 423–428. [Google Scholar]
  37. Yin, K.L.; Yan, T.Z. Statistical prediction model for slope instability of metamorphosed rocks. In Proceedings of the 5th International Symposium on Landslides, Lausanne, Switzerland, 10–15 July 1988; Bonnard, C., Ed.; Balkema: Rotterdam, The Netherlands, 1988; Volume 2, pp. 1269–1272. [Google Scholar]
  38. Jade, S.; Sarkar, S. Statistical models for slope instability classification. Eng. Geol. 1993, 36, 91–98. [Google Scholar] [CrossRef]
  39. Dolean, B.E. Landslide susceptibility assessment using Spatial Analysis and GIS modeling in Cluj-Napoca Metropolitan Area, Romania. Cinq Cont. 2017, 7, 23–41. [Google Scholar]
  40. Roșca, S.; Bilaşco, S.; Păcurar, I.; Oncu, M.; Negruşier, C.; Petrea, D. Land capability classification for crop and fruit product assessment using GIS technology. Case study: The Niraj River Basin (Transylvania Depression, Romania). Not. Bot. Horti Agrobo. 2015, 43, 235–242. [Google Scholar] [CrossRef]
  41. Guzzetti, F.; Reichenbach, P.; Cardinali, M.; Galli, M.; Ardizzone, F. Probabilistic landslide hazard assessment at the basin scale. Geomorphology 2005, 72, 272–299. [Google Scholar] [CrossRef]
  42. Vakhshoori, V.; Zare, M. Is the ROC curve a reliable tool to compare the validity of landslide susceptibility maps? Geomat. Nat. Hazards Risk 2018, 9, 249–266. [Google Scholar] [CrossRef]
  43. Wang, Q.; Wang, D.; Huang, Y.; Wang, Z.; Zhang, L.; Guo, Q.; Chen, W.; Chen, W.; Sang, M. Landslide Susceptibility Mapping Based on Selected Optimal Combination of Landslide Predisposing Factors in a Large Catchment. Sustainability 2015, 7, 16653–16669. [Google Scholar] [CrossRef] [Green Version]
  44. Zhou, S.; Chen, G.; Fang, L.; Nie, Y. GIS-Based Integration of Subjective and Objective Weighting Methods for Regional Landslides Susceptibility Mapping. Sustainability 2016, 8, 334. [Google Scholar] [CrossRef]
  45. Ahmed, B.; Dewan, A. Application of Bivariate and Multivariate Statistical Techniques in Landslide Susceptibility Modeling in Chittagong City Corporation, Bangladesh. Remote Sens. 2017, 9, 304. [Google Scholar] [CrossRef]
  46. Assilzadeh, H.; Levy, J.K.; Wang, X. Landslide catastrophes and disaster risk reduction: A GIS framework for landslide prevention and management. Remote Sens. 2010, 2, 2259–2273. [Google Scholar] [CrossRef]
  47. Corominas, J.; van Westen, C.; Frattini, P.; Cascini, L.; Malet, J.-P.; Fotopoulou, S.; Catani, F.; van den Eeckhaut, M.; Mavrouli, O.; Agliardi, F.; et al. Recommendations for the quantitative analysis of landslide risk. Bull. Eng. Geol. Environ. 2014, 73, 209–263. [Google Scholar] [CrossRef]
  48. Jeong, S.; Kassim, A.; Hong, M.; Saadatkhah, N. Susceptibility Assessments of Landslides in Hulu Kelang Area Using a Geographic Information System-Based Prediction Model. Sustainability 2018, 10, 2941. [Google Scholar] [CrossRef]
  49. Ciurleo, M.; Mandaglio, M.C.; Moraci, N. Landslide susceptibility assessment by TRIGRS in a frequently affected shallow instability area. Landslides 2019, 16, 175. [Google Scholar] [CrossRef]
  50. Kerekes, A.-H.; Poszet, S.L.; Gál, A. Landslide susceptibility assessment using the maximum entropy model in a sector of the Cluj-Napoca Municipality, Romania. Rev. Geomorf. 2018, 20, 130–146. [Google Scholar] [CrossRef]
Figure 1. The geographic location of the study area with highlighting of the active landslides.
Sustainability 11 01362 g001
Figure 2. The conceptual flow chart established. DEM, digital elevation model.
Sustainability 11 01362 g002
Figure 3. Susceptibility to landslides according to altitude.
Sustainability 11 01362 g003
Figure 4. Susceptibility to landslides according to slopes.
Sustainability 11 01362 g004
Figure 5. Susceptibility to landslides according to orientation of the slopes.
Sustainability 11 01362 g005
Figure 6. Susceptibility to landslides according to distance to settlements.
Sustainability 11 01362 g006
Figure 7. Susceptibility to landslides according to distance to roads.
Sustainability 11 01362 g007
Figure 8. Susceptibility to landslides according to distance to hydrography.
Sustainability 11 01362 g008
Figure 9. Susceptibility to landslides according to wetness index.
Sustainability 11 01362 g009
Figure 10. Susceptibility to landslides according to stream power index.
Sustainability 11 01362 g010
Figure 11. Susceptibility to landslides according to land-use.
Sustainability 11 01362 g011
Figure 12. Land-use classes.
Sustainability 11 01362 g012
Figure 13. Susceptibility to landslides according to geology.
Sustainability 11 01362 g013
Figure 14. Lithological classification.
Sustainability 11 01362 g014
Figure 15. Susceptibility to landslides according to depth of fragmentation.
Sustainability 11 01362 g015
Figure 16. Susceptibility to landslides according to density of fragmentation.
Sustainability 11 01362 g016
Figure 17. Susceptibility to landslides map.
Sustainability 11 01362 g017
Figure 18. Validation of the applied model by calculating the AUROC value.
Sustainability 11 01362 g018
Table 1. Database Structure.
NrDatabase NameTypeStructureResolution/ScaleAttributesAcquisition Mode
1LandslidesVectorPolygonOrthophotomap/field identificationLocation, surfacePrimary (vectorization, coordinate measurement)
2Level curvesVectorLineEquidistance 5 mElevationPrimary (vectorization)
3Hydrographic networkVectorLine1:25,000Name/ LengthPrimary (vectorization)
4Communication ways networkVectorLine1:25,000IndicativePrimary (vectorization)
5Built areaVectorPolygon1:25,000NamePrimary (vectorization)
6GeologyVector/RasterPolygon/grid1:200,000Period/agePrimary (vectorization)
7Land useVector/RasterPolygon/grid100/100 mUsage typePrimary (download CLC 2012)
8SlopeRasterGrid5 mSlope values (degrees)Derivatives (from DEM)
9AltitudeRasterGrid5 mAltitude values (m)Modelled (from level curves, hydrography and boundary)
10Depth fragmentationRasterGrid5 mLevel difference (m)Modelled (from DEM and 1000/1000 m grid)
11Density of fragmentationRasterGrid5 mValues in km/km2Modelled (from hydrographic network and 1000/1000 m grid)
12Slope orientationRasterGrid5 mOrientation typeDerived from DEM
13Distance to hydrographyVector/RasterPolygon/grid5 mDistances (m)Modelled (Buffer)/Derived (Vector/Raster)
14Distance to roadsVector/RasterPolygon/grid5 mDistances (m)Modelled (Buffer)/Derived (Vector/Raster)
15Distance to settlementsVector/RasterPolygon/grid5 mDistances (m)Modelled (Buffer)/Derived (Vector /Raster)
16Wetness IndexRasterGrid5 mWI valuesModelled (from DEM, drainage direction and slope)
17Stream Power IndexRasterGrid5 mSPI valuesModelled (from DEM, flow accumulation and slope)
18Validation landslidesVectorPolygonOrthophotomap/field identificationLocation, surfacePrimary (vectorization, coordinate measurement)
Table 2. BSA Value for altitudinal factor and susceptibility classes.
Landslide FactorsAltitude EcartBSA Calculated Value/EcartLandslide Area/Ecart (km2)Area/Ecart (km2)SusceptibilityInterval
Altitude (m)285–4000.19812.55186.45Low−1.516–−1.483
400–5000.12122.28395.69Medium−1.483–−0.238
500–700−0.2729.36411.32Medium-High−0.238–0.148
700–900−1.5170.0644.54High0.148–0.201
Table 3. BSA Value for slope factor and susceptibility classes.
Landslide FactorsSlope EcartBSA Calculated Value/EcartLandslide Area/Ecart (km2)Area/Ecart (km2)SusceptibilityInterval
Slope (degree)0–5−0.3305.66283.85Low−0.330–−0.293
5–150.10336.72679.66Medium−0.293–−0.223
15–25−0.2431.7672.29Medium-High−0.223–−0.061
25–30−0.0940.072.03High−0.061–0.130
30–350.5770.020.14Very High0.130–1.149
>351.1200.010.02
Table 4. BSA Value for aspect factor and susceptibility classes.
Landslide FactorsAspectBSA Calculated Value/EcartLandslide Area/Ecart (km2)Area/Ecart (km2)SusceptibilityInterval
AspectFlat−1.430.0210.9Low−1.429–−1.394
N−0.2274.26168.9Medium−1.394–−0.460
NE−0.1485.22172.2Medium-High−0.460–−0.047
E−0.164.01136.2High−0.047–0.051
SE0.0365.31114.6Very High0.051–0.384
S0.33610.86117.6
SV0.2789.91122.6
V−0.0833.2191.3
NV−0.4881.44103.6
Table 5. BSA Value for distance to settlements factor and susceptibility classes.
Landslide FactorsDistance (m)BSA Calculated Value/EcartLandslide Area/Ecart (km2)Area/Ecart (km2)SusceptibilityInterval
Distance to settlements (m)50−0.0854.46132.94Low−0.097–−0.090
1500.1843.6859.16Medium−0.090–−0.067
3000.1975.4287.59Medium-High−0.067−0.129
6000.1269.57172.12High0.129−0.186
50000−0.09719.11586.19Very High0.186−0.198
Table 6. BSA Value for distance to roads factor and susceptibility classes.
Landslide FactorsDistance (m)BSA Calculated Value/EcartLandslide Area/Ecart (km2)Area/Ecart (km2)SusceptibilityInterval
Distance to roads (m)20−0.2480.4921.26Low−0.247–−0.238
50−0.2330.7531.35Medium−0.238–−0.224
100−0.1851.3550.62Medium-High−0.224–−0.182
200−0.0813.2094.86High−0.182–−0.077
500000.02836.65839.56Very High−0.077–0.028
Table 7. BSA Value for distance to hydrography factor and susceptibility classes.
Landslide FactorsDistance (m)BSA Calculated Value/EcartLandslide Area/Ecart (km2)Area/Ecart (km2)SusceptibilityInterval
Distance to hydrography (m)50−0.0850.0428.94Low−1.519–−1.455
1500.1840.1743.14Medium−1.455–−0.993
3000.1970.6970.82Medium-High−0.993–−0.572
6000.1262.23136.37High−0.572–−0.356
50000−0.09741.12758.73Very High−0.356–0.110
Table 8. BSA Value for wetness index factor and susceptibility classes.
Landslide FactorsWIBSA Calculated Value/EcartLandslide Area/Ecart (km2)Area/Ecart (km2)SusceptibilityInterval
WI0–5−0.0227.61677.69Low−0.046–−0.042
5–7−0.0464.52117.91Medium−0.042–−0.018
7–90.0366.65143.53Medium-High−0.018–0.039
9–110.1153.8268.80High0.039–0.110
>110.111.6530.07Very High0.110–0.116
Table 9. BSA Value for stream power index factor and susceptibility classes.
Landslide FactorsSPIBSA Calculated Value/EcartLandslide Area/Ecart (km2)Area/Ecart (km2)SusceptibilityInterval
SPI>0−0.05231.02820.78Low−0.052–−0.039
0–10.1116.70121.79Medium−0.039–0.116
1–1.20.1680.9214.70Medium-High0.116–0.172
1.2–1.40.20.8312.33High0.172–0.202
>1.40.2144.7768.39Very High0.202–0.216
Table 10. BSA Value for land-use factor and susceptibility classes.
Landslide FactorsLand-UseBSA Calculated Value/EcartLandslide Area/Ecart (km2)Area/Ecart (km2)SusceptibilityInterval
Land-useWater accumulation002.53Low−1.269–−1.199
Airports000.27Medium−1.199–−0.352
Water streams003.09Medium-High−0.352–0.123
Garbage holes001.09High0.123–0.265
Orchards0.2111.3119.71Very High0.265–0.857
Swamps001.36
Pine-tree forests002.20
Hardwood forests−1.270.42191.3
Mixt forests002.69
Secondary meadows0.09414.55248.1
Discontinuous urban space and rural space-0.341.7193.38
Arable land not irrigated-0.0410.81295.4
Predominant agricultural land mixed with natural vegetation0.4879.1673.28
Industrial or commercial units−0.640.1213.58
Vineyard004.28
Complex crop areas0.2414.4262.34
Mining areas0.1240.183.32
Deforested Areas0.2681.5920.08
Areas under construction0.8580.160.56
Green urban areas001.99
Table 11. BSA Value for geology factor and susceptibility classes.
Landslide FactorsGeologyBSA Calculated Value/EcartLandslide Area/Ecart (km2)Area/ecart (km2)SusceptibilityInterval
GeologyAndesite000.14Low−2.055–−1.651
Continental red clay−2.05508.91Medium−1.651–−1.269
Clays, sandstone coal, shale marl, tuffs0.286563.50Medium-High−1.269–−1.184
Clay, sands, sandstone−1.3370.33175.88High−1.184–−0.006
Clay, gravel, sand000.70Very High−0.006–0.652
Limestone, marl, gypsum, sandstone, clays−1.1840.1867.57
Conglomerates, sandstones, muddy clays−0.2075.51138.74
Conglomerates, sands, sandstone, marl−1.2660.1565.90
Deluvial-colluvial deposits with blocks−1.6450.019.97
Sandstone, clay marl−1.6630.0450.63
Marne, sands, gravel−1.280.32146.86
Marne, coal, limestone−1.1780.039.77
Marne, tuffs0.65228.26155.56
Sand, gravel−0.2772.84132.01
Gravels, sands0.5111.5711.86
Table 12. BSA Value for depth of fragmentation factor and susceptibility classes.
Landslide Factorsm/km2BSA Calculated Value/EcartLandslide Area/Ecart (km2)Area/Ecart (km2)SusceptibilityInterval
Depth of fragmentation0–100−0.3397.43379.88Low−0.338–−0.329
100–2000.11836.57654.08Medium−0.329–0.124
200–3000.160.254.04Medium-High0.124–0.169
Table 13. BSA Value for density of fragmentation factor and susceptibility classes.
Landslide Factorskm/km2BSA Calculated Value/EcartLandslide Area/Ecart (km2)Area/Ecart (km2)SusceptibilityInterval
Density of fragmentation0–10.10938.13698.83Low−1.279–−1.247
1–1.5−0.2524.70194.01Medium−1.247–−0.687
1.5–2−0.5341.30104.66Medium-High−0.687–−0.526
2–2.5−1.2790.0732.53High−0.526–−0.236
>2.5−0.70.077.97Very High−0.236–0.123

