Article

Spatial Production and Governance of Urban Agglomeration in China 2000–2015: Yangtze River Delta as a Case

1
Faculty of Education & School of Geographic Sciences, Shanghai Municipal Institute for Lifelong Education, Shanghai Key Laboratory for Urban Ecological Process and Eco-restoration & Institute of Eco-Chongming, East China Normal University, Shanghai 200241, China
2
School of Environmental Sciences, University of Hull, Hull HU6 7RX, UK
3
School of Resource and Earth Science, Yunnan University, Kunming 650091, China
4
School of Ecological and Environmental Science, Shanghai Key Laboratory for Urban Ecological Process and Eco-restoration, East China Normal University, Shanghai 200241, China
*
Author to whom correspondence should be addressed.
Sustainability 2019, 11(5), 1343; https://doi.org/10.3390/su11051343
Submission received: 23 December 2018 / Revised: 19 February 2019 / Accepted: 20 February 2019 / Published: 4 March 2019

Abstract

:
Urban agglomeration plays an essential role in world urbanization. Urban agglomerations in developing countries like China, although have the same characteristics as the developed countries because of globalization, often show a more different and dynamic process. Urban agglomerations in China are generally dominated and planned as a mode of organizing and improving urbanization by the Chinese government; however, in different regions, urban agglomeration has different trajectories based on a different historical and geographical context. The paper applies a new social theory, production of space, into explaining the development and governance of urban agglomeration in China, which is effective and meaningful to help understand the developmental process of urban agglomeration and urbanization. The theory of spatial production focuses on the relation between society and space, in which ‘society’ has a broad meaning and can be divided into three factors or parts: power, capital, and class. This paper chooses YRD (the Yangtze River Delta) as a typical case and designs a simple index system to reflect the influences of these three factors on urban agglomeration. The governance of urban agglomeration will be indicated by national or regional policies analysis. According to such a synthesis method of index assessment, GIS (Geographic Information System), and policies analysis, we find Chinese urban agglomeration is a capital-intensive region, and the national policies tend to regard it as an intensive investment object. Planning and governance from top-down power have more influence than the market in the evolving process of urban agglomeration. There is a contradiction between spatial production and people-oriented urbanization, with the latter more important than the former, but China’s urbanization often emphasizes the former. It is high time to link the techniques and methods such as GIS to the social theories like the production of space in urban studies.

1. Introduction

Since the notion of urban agglomeration was put forward, it has been the focus of global scholars [1,2,3]. There are a wide variety of concepts regarding urban agglomeration, including megalopolis, metropolitan area, city-region, and mega-city regions; however, urban agglomeration hasn’t reached a universal definition [4,5,6,7,8]. Generally speaking, urban agglomeration is described as “the city-region consists of the core city and its surrounding areas, such as its suburban areas and outskirts……is a part of the recentralization of state power” [9]. Although chengshiqun (urban agglomeration in Chinese) has also been defined poorly in Chinese, it has attracted more attention than ever, especially since 2000. There are some different perspectives on urban agglomeration in China, such as state rescaling, developmental policies, intercity relationships, regional governance, and administrative annexation [10,11,12,13,14,15]. Urban agglomeration is often thought of as a type of state reterritorialization and city-region governance [9,16,17,18,19,20]. The scholars have been looking for a way to help understand the developmental process of urban agglomeration. The above studies on urban agglomeration, focus on more quantitative or policy analysis than theoretical explanation. In particular, there is a lack of critical and profound theory for urban agglomeration research. In addition, Chinese urban agglomeration is a mixed production, driven by the market, social mobility, and strong policies, so it cannot be explained by only one theory or the Western theories. It is necessary to transform some theories based on Anglo-American experiences into Chinese versions regarding urbanization and urban agglomeration.
Compared to the existing studies on urban agglomeration, production of space, as a social theory, is critical and down to earth, which provides us a necessary and significant perspective to rethink the changing urban agglomerations in China. However, many studies on the production of space are so abstract and complicated that we can hardly put them into practice. Therefore, we try to transform the theory of spatial production into a brief framework including three elements and assess it from some indexes responding to the three elements, which makes the theory easier to understand and operate. The production of space generally means the relation and interaction between capital, power, class, and space [21,22]. Together with intensive public and private investment and special national policies in Chinese urban agglomeration, the large-scale transformation of land use and the astonishing extension of urban space continually emerge, which is the most remarkable characteristic of spatial production. The Chinese government has proposed urban agglomeration as one of spatial organizations or tools to improve urbanization. In the process of the spatial production of urban agglomeration, power and capital play a very important role; however, how they work is not clear. Therefore, it is necessary to understand and explain how urban agglomeration in China happens and develops, especially driven by the force of capital and power.
Out of most urban agglomerations or city-regions of China, the Pearl River Delta and the YRD have been the most studied and, often, to a more thorough degree than the others. The YRD region, as a relatively mature, typical, and complex urban agglomeration, accounts for a large proportion of these studies. The paper attempts to explain and discover the real process and dynamics of the YRDUA (Yangtze River Delta Urban Agglomeration) based on the theory of spatial production. Because urban agglomeration has been rapidly developed since 2000, we choose the middle-term temporal scale from 2000 to 2015 as the research period. The structure of this paper covers the research methodology of spatial production and urbanization, characteristics of spatial production of the YRDUA, and the conclusion.

2. Methodology

The theory of spatial production which integrates the theories on space into social theories, reveals the role of capital and power operation in the process of urbanization, and subsequently, develops into a new theory. According to this new theory, space is a tool and a product in the whole process of social (space) production [22,23]. Lefebvre pointed out that the production of space is similar to the production of any kind of commodity [24]. Firstly, various forms of social processes intervene in the urban space and shape it; secondly, (re)shaping space is also a material power, which can influence and restrict social life and actions in the city [25]. Space appears together with time and society, in which everything including social relations, happens in space and time; space is often regarded as a tool in the production and a product [26,27,28,29]. Capitalism, as a kind of complicated social system, also produces its space or is produced by the mode of spatial production, which is a dialectic process [30,31,32].
Lefebvre thought that urban space had become the key to the maintenance of capital circulation and capitalist production relations because space was simultaneously producing social relations during the process of spatial production [33]. According to socio-spatial dialectic, the methodology of spatial production, urban space continuously (re)shapes social relations and processes at different temporal scales and social relations react to urban space [34,35]. Based on this methodology, society can be divided into three parts, political, economic, and (narrow-sense) social, which correspond to three main factors of power, capital, and class, respectively [21,22]. Power, mainly from government, drives policymaking and governance. Capital is the most important factor in economic activity, and it flows across temporal and spatial scales, then produces an uneven geographical landscape [36]. Class also plays a significant role. With the improving strengths of power and capital in the process of urbanization, there is an increasingly large gap among social groups. In general, urbanization, especially in China, is the process and result of interaction among these three factors and all forms of urban space, see Figure 1.
Politics, economy, and society are three important components of spatial production, so it is quite significant to evaluate and quantify them scientifically. Previous studies mostly focused on the interpretation of the theory of spatial production and revealed some phenomena in a pure, critical theoretical way. However, there is always a lack of a reasonable index system to assess and understand spatial production. So, from a statistical point of view, we can collect the corresponding statistical indexes to represent spatial production according to the above framework. Christophers used two indicators with official data; fixed capital and pension fund based on the case of the United Kingdom [37]. The first indicator can be used in our analysis, but as for the second, the more complicated indicator, considering the difference between China and the UK, we choose two indicators (fixed asset investment and foreign direct investment) to reflect capital, which are representative, because it will be more complicated if further indicators are adopted. Moreover, this article aims to demonstrate that capital and power work on urban agglomeration; therefore, besides capital, we should choose some other indicators to represent the role of power and society. There are many indicators and multi-data including mobile phone usage that can be chosen for measuring urban vitality and explored in research concerning the production of space [38]. However, in this paper, the new framework and integrating analysis, as opposed to data, are highlighted.
To illustrate the most important characteristics of spatial production and urbanization, this paper uses a simple index system, in which capital is represented by FAI (fixed asset investment) and FDI (foreign direct investment) and power is represented by the built-up area and the URIR (urban-rural income ratio), which can reflect class. The indicator of urbanization ratio reflects the level of urbanization [22]. In the developmental process of the YRDUA, the influences of capital globalization on the YRDUA and the evolving trends of internal spatial production can be demonstrated by indexes related to urban social and spatial extension. Here, we select built-up area, FAI, urbanization ratio, REI (real estate investment), FDI, and URIR as indexes to reflect the spatial and capital developmental process. In addition, the governance of urban agglomeration will be demonstrated by national policies and planning analysis. Therefore, the methodology of this article is blended and integrating. We not only design a brief and clear theoretical framework to make the theory easier to understand but also synthesize indexes, data, GIS, and policy analysis to represent the changing process of urban agglomeration. The data of this paper are mainly obtained from the China City Statistical Yearbook and Jiangsu, Anhui, Shanghai, and Zhejiang Statistical Yearbook of 2016. All indicators except URIR are directly taken from the Yearbook, and URIR is calculated by the authors based on the data from the Yearbook. Although it is not sufficiently accurate, the official data are generally effective for large-scale regional analysis [22]. The paper is different from the general quantitative research on urbanization and its emphasis is not on statistical or model analysis. We try to design a new framework which links the theory of spatial production to the problems of urban agglomeration in order to reinterpret the developmental process and dynamics of urban agglomeration in China.

3. Spatial Production of the YRDUA

3.1. Unbalanced Development of the YRDUA

The YRDUA is the biggest comprehensive industrial base in China and has a prominent location that lies within the intersection of the Gold Coast of Eastern China and the Golden Waterway of the Yangtze River. Since 1992, the YRD has taken the lead in the process of regional integration reform, and global capital has started to be poured into the YRD. Since 2000, the YRD has become one of the regions with one of the highest economic growth rates and the fastest speed of urbanization in China, even in the world, which maintains the highest degree of urbanization and has the most densely distributed towns. Compared with urban agglomerations in other countries, the speed and scale of urbanization in the YRD also rank high on the list [
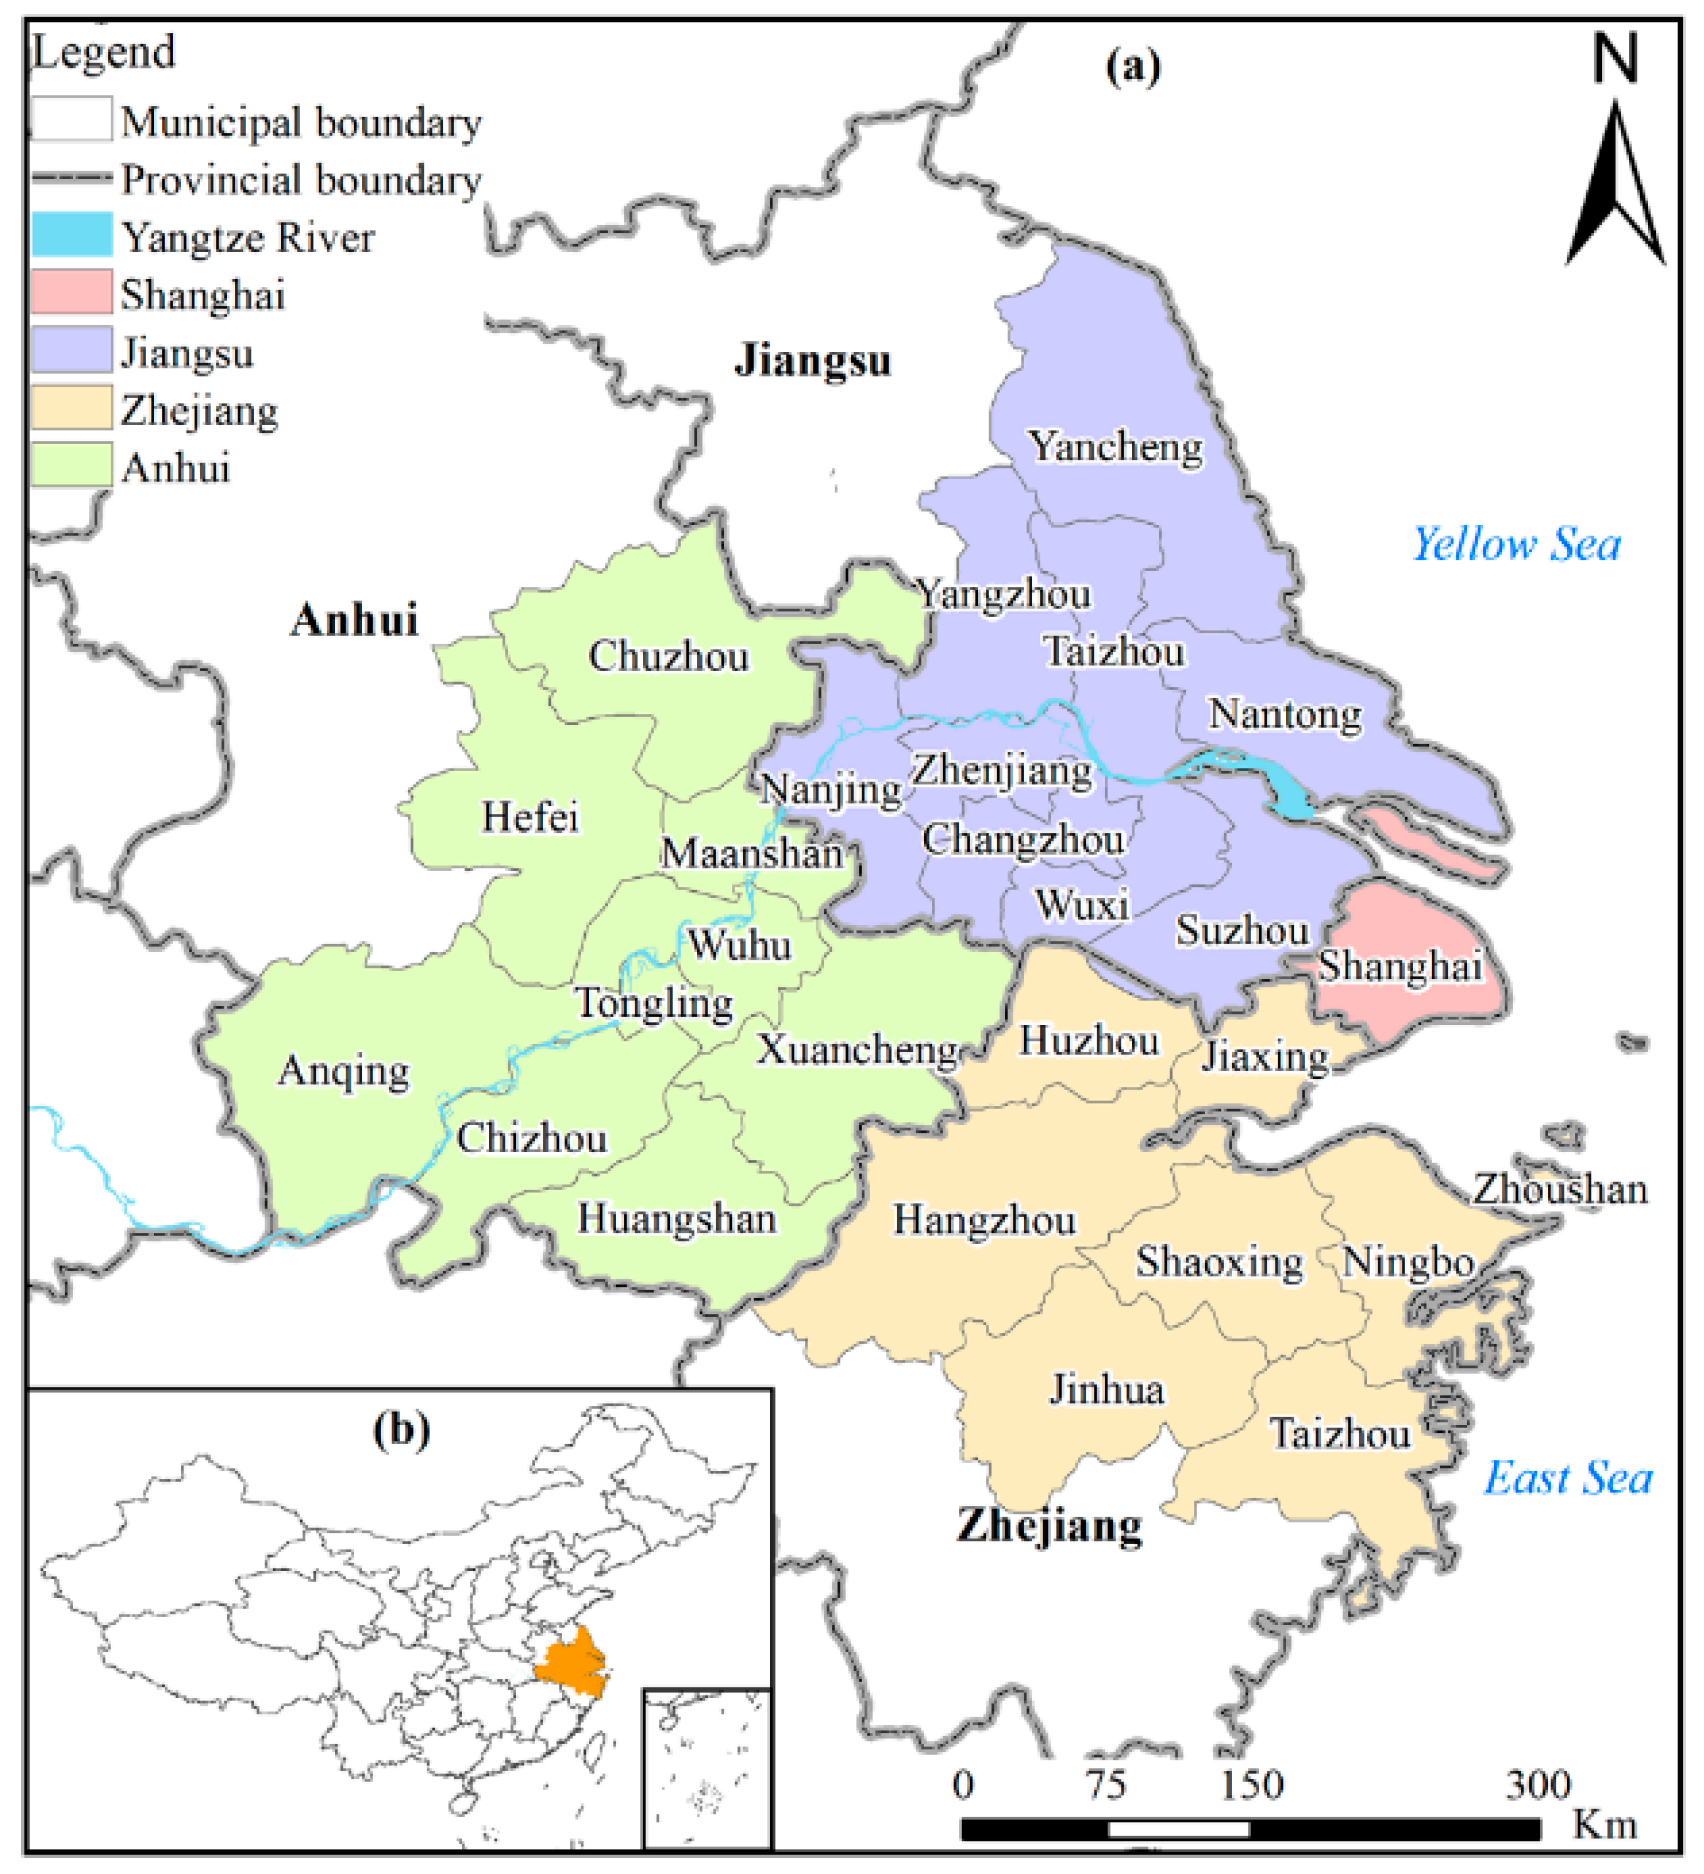
39]. The population of the YRDUA exceeded 200 million in 2016, which was close to the world-class urban agglomerations of North America, Western Europe, and Japan. The spatial scale of the YRDUA has undergone a historical process of development which changes from a geographical concept to an economic concept and extends from small scale to large scale. According to the Development Planning of the YRDUA issued by National Development and Reform Commission, the YRDUA covers Shanghai, and Nanjing, Wuxi, Changzhou, Suzhou, Nantong, Yancheng, Yangzhou, Zhenjiang, and Taizhou of Jiangsu Province; Hangzhou, Ningbo, Jiaxing, Huzhou, Shaoxing, Jinhua, Zhoushan, and Taizhou of Zhejiang Province; and Hefei, Wuhu, Ma’anshan, Tongling, Anqing, Chuzhou, Chizhou, and Xuancheng of Anhui Province, see Figure 2.
During the process of reform and opening up in the past 40 years, the economy of the YRD has been greatly developed. The GDP of the YRD reached 12.9 trillion yuan in 2014, accounting for 20.25% of the total country’s GDP and was far higher than the national average level and other domestic urban agglomerations. Shanghai is dominant and has become one of the most important cities in the world. However, with the continuous spread of globalization, the development of cities in the YRD not only shows the trend of regional integration and spatial pattern of a multi-core network but also forms some metropolitan areas with the core of megalopolis like Shanghai, Nanjing, and Hangzhou. In 2015, the GDP per capita of Shanghai was 125,002 yuan; Zhejiang was 77,644 yuan; Jiangsu was 87,995 yuan, and Anhui was 35,997 yuan. The GDP per capita of Shanghai was over three times the GDP per capita of Anhui province and was about 1.5-times those of the Zhejiang and Jiangsu Provinces. The uneven distribution of resources, environment, capital, and policies leads to the imbalance of urban economic development inside the YRDUA, which has become a problem that cannot be ignored.
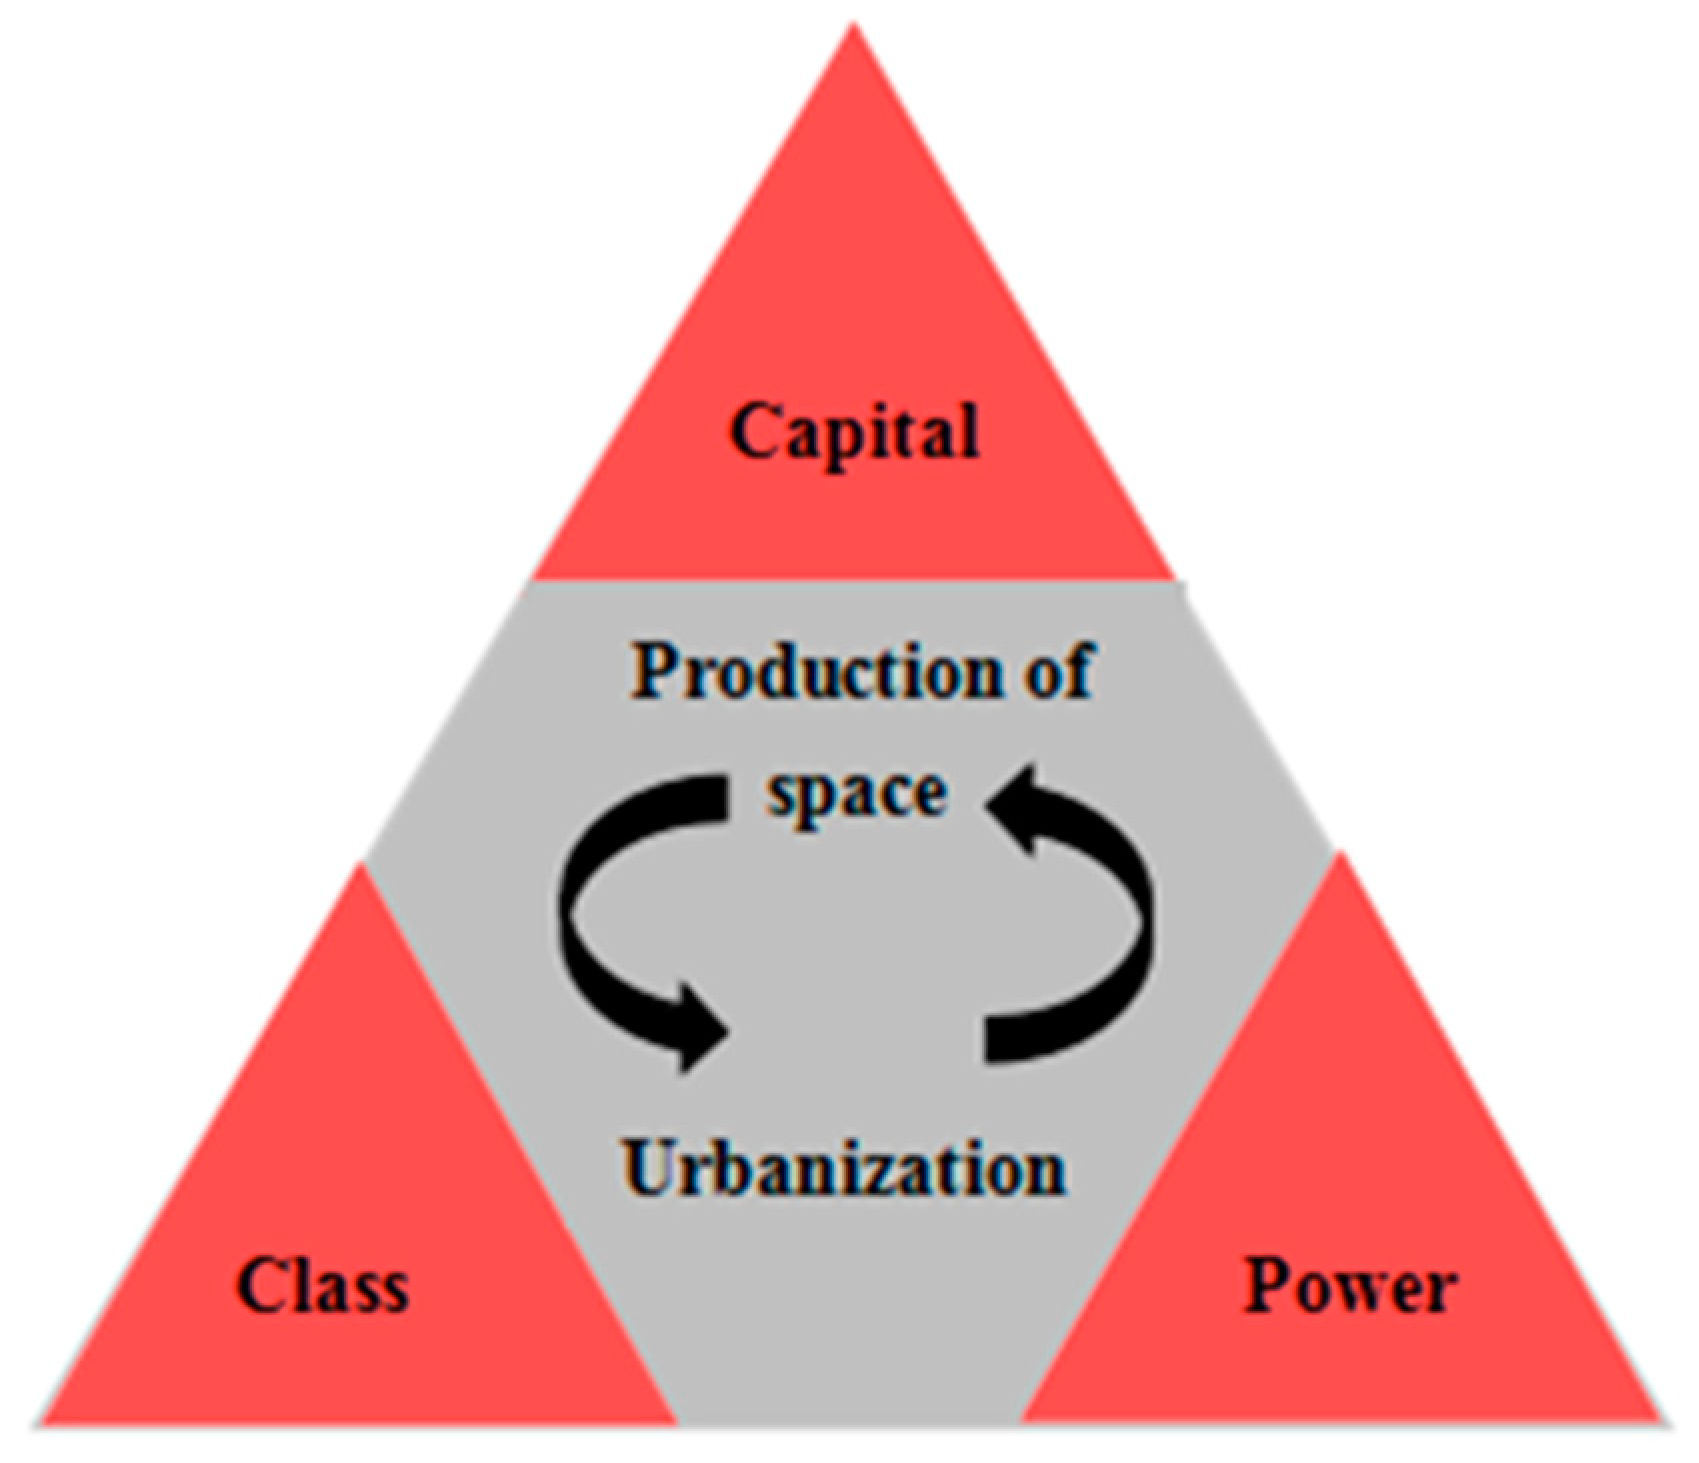
Uneven development is the core issue in understanding the production of space. Uneven development is the systematic geographical expression of the contradictions of the capitalist system [40]. Here, geographical conditions are both base and dynamic of regional or national development, which have been changed and reshaped in the production of space [22].

3.2. The YRDUA Driven by Capital and Power

During the evolution process of the YRDUA, Chinese national departments have issued relevant documents to guide them in recent years. From this perspective, building the YRDUA into a world-class urban agglomeration is not only the development orientation of itself but also Chinese governments’ aim, which means power plays a crucial role in shaping and promoting the YRDUA.
During the years 2001 to 2016, sets of documents regarding the development of urban agglomeration were issued by different departments, see Table 1 and Table 2, and the idea of taking urban agglomeration as the main form of future urban development was put forward by almost all of the documents. According to the documents for the development of the YRDUA, the common orientation is to form it into an important economic growth pole and then a world-class urban agglomeration with international competitiveness by promoting and optimizing international cooperation and competition at a higher level.
There are some remarkable differences among these documents regarding the orientation of the YRDUA. From the main national policies, “the 11th 5-Year plan” in 2006 first put forward the concept of urban agglomeration and regarded it as the main form of urban development to give priority to regional and national economic issues. “The 13th 5-Year plan” was based on this concept but came up with a deeper idea of internationalization, to gradually build some world-class urban agglomerations with more international and comprehensive competitiveness. After “the 12th 5-Year plan” had achieved some aims, the pursuit of faster and greater development was put forward by “the 13th 5-Year plan” which included optimizing and enhancing the function of the YRDUA. Under the guidance of Communist Party of China Central Committee’s relevant documents, the departments including the State Council, the National Development and Reform Commission, and the Ministry of Housing and Urban-Rural Development all issued relevant documents which were more detailed and provided targeted supplementary and improvement in the view of the new situation and different urban agglomerations. Overall, although the contents of documents in each period are different, all departments expressed great expectations with regard to the development of the YRDUA, while it aimed at constructing a world-class urban agglomeration and playing a leading role in the national economic and social development through accelerating the formation of new advantages in international competition [41].
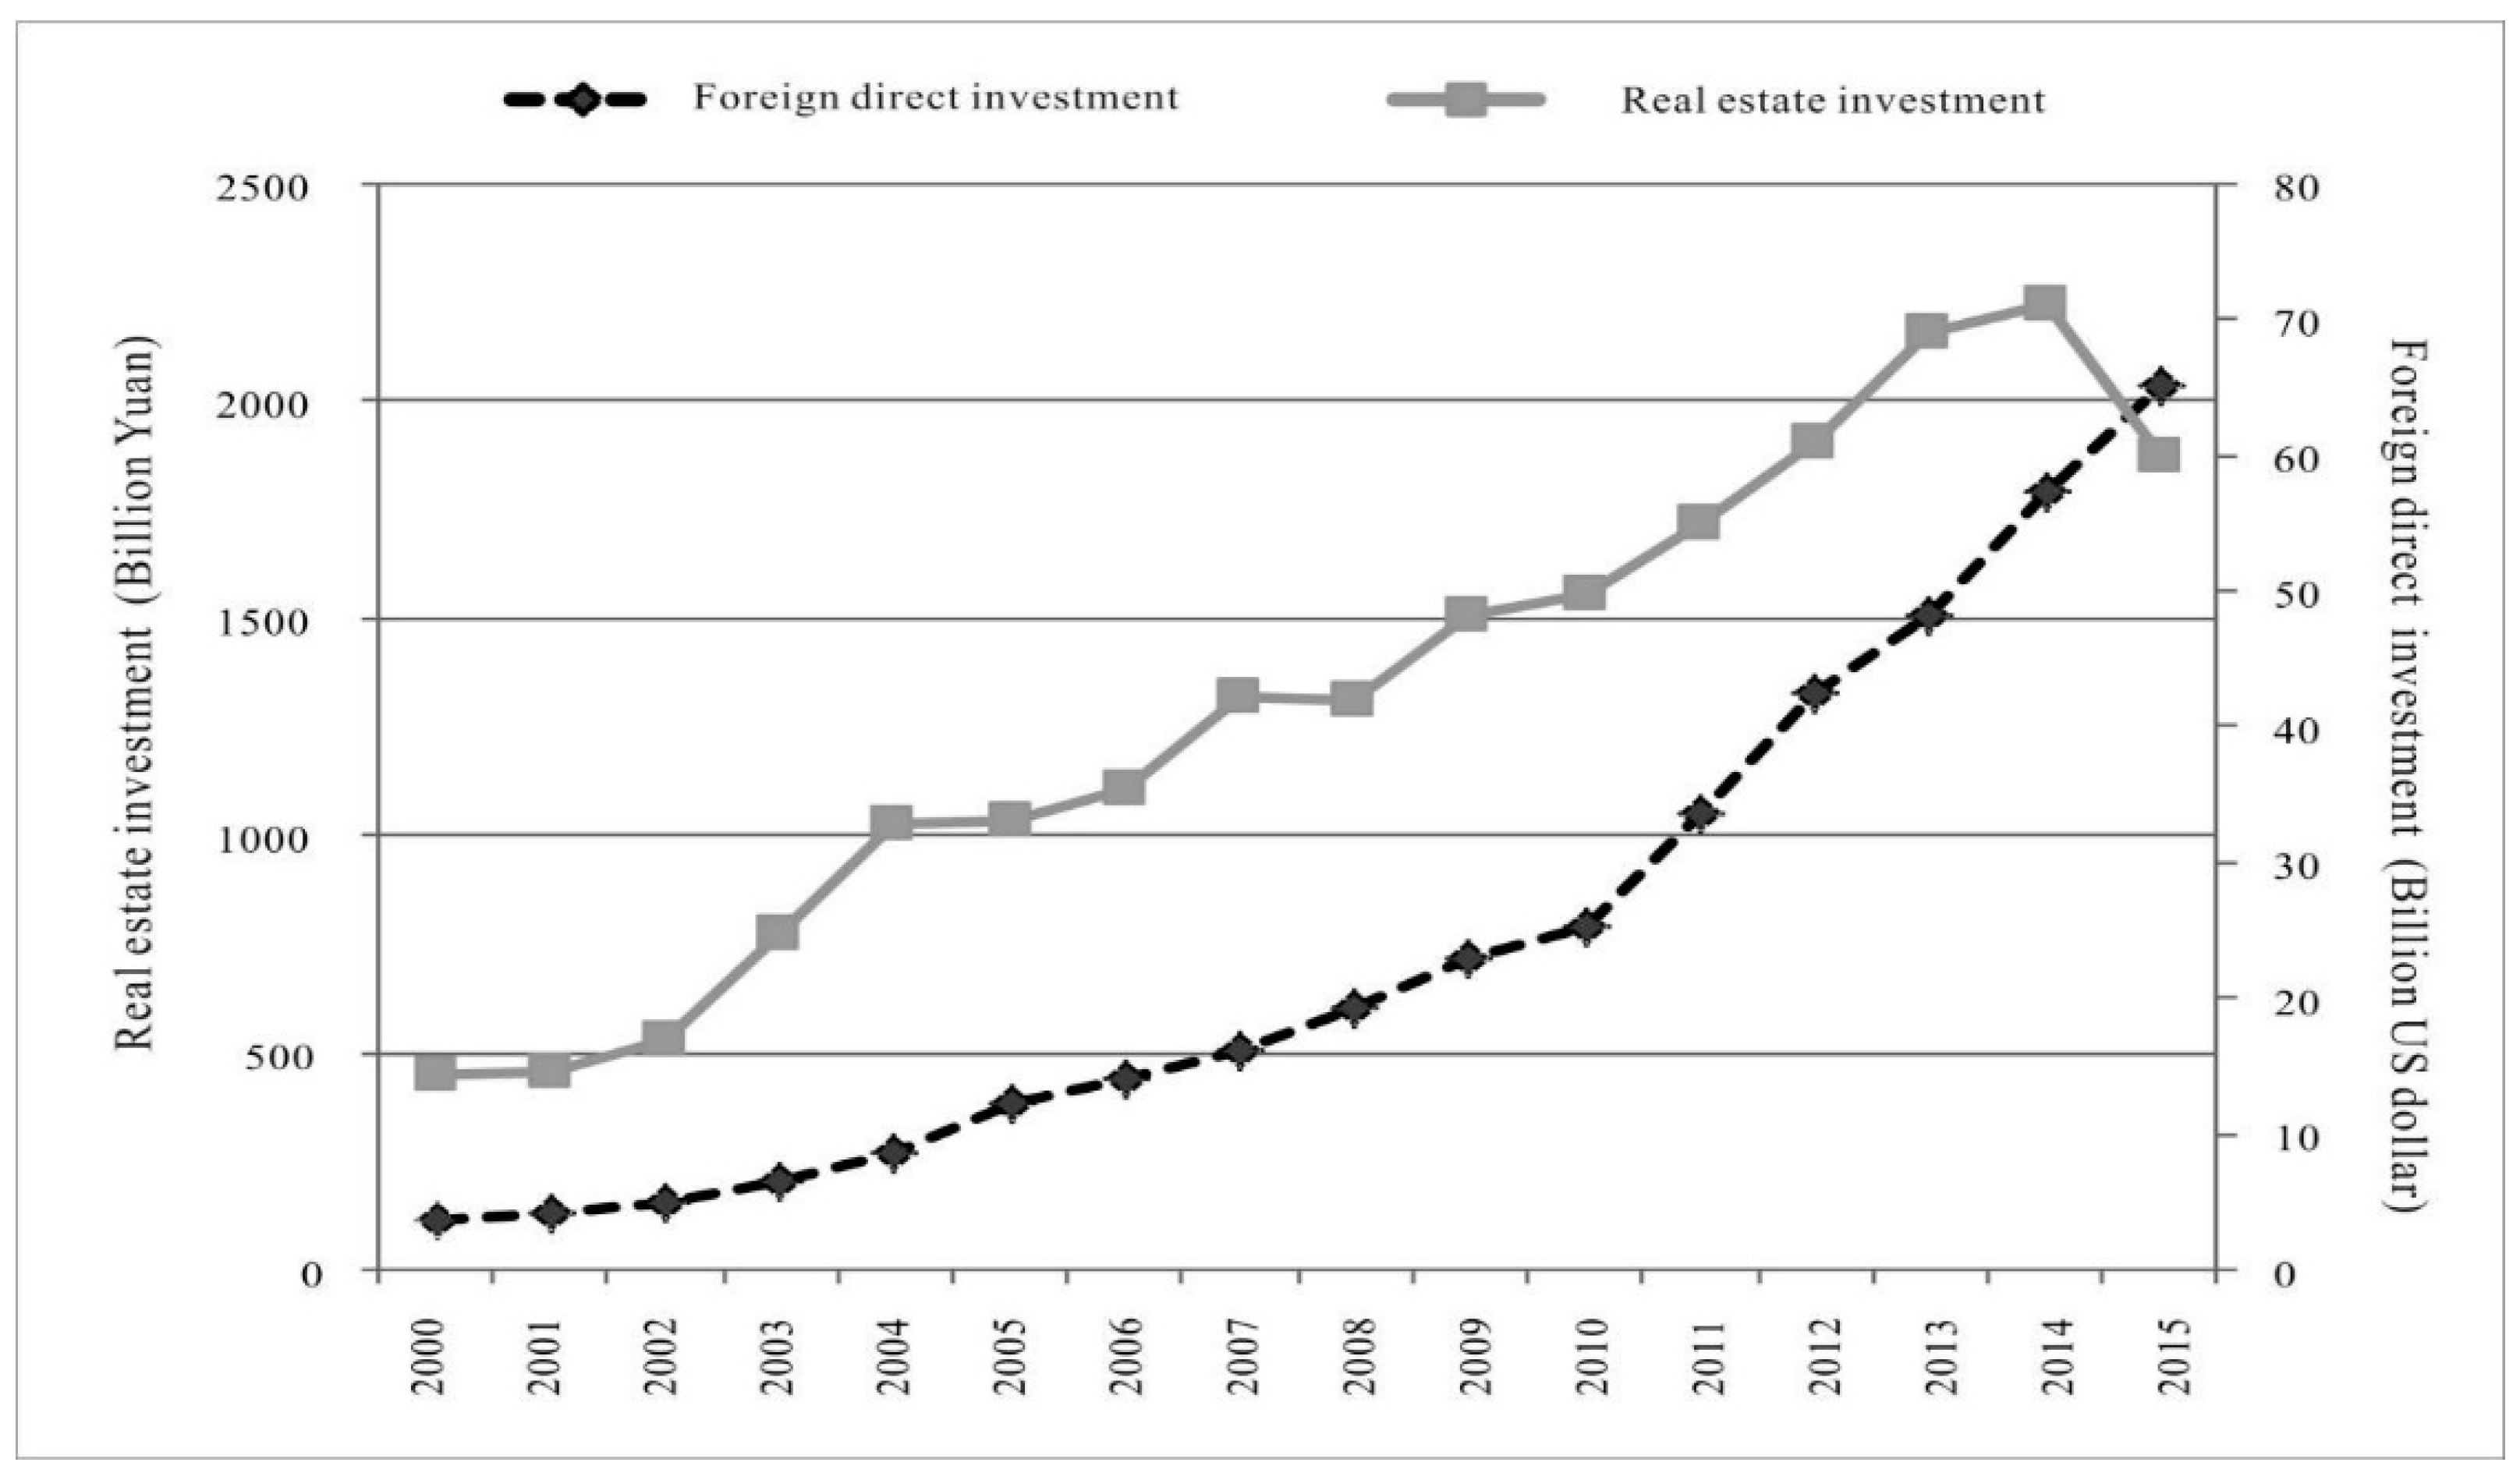
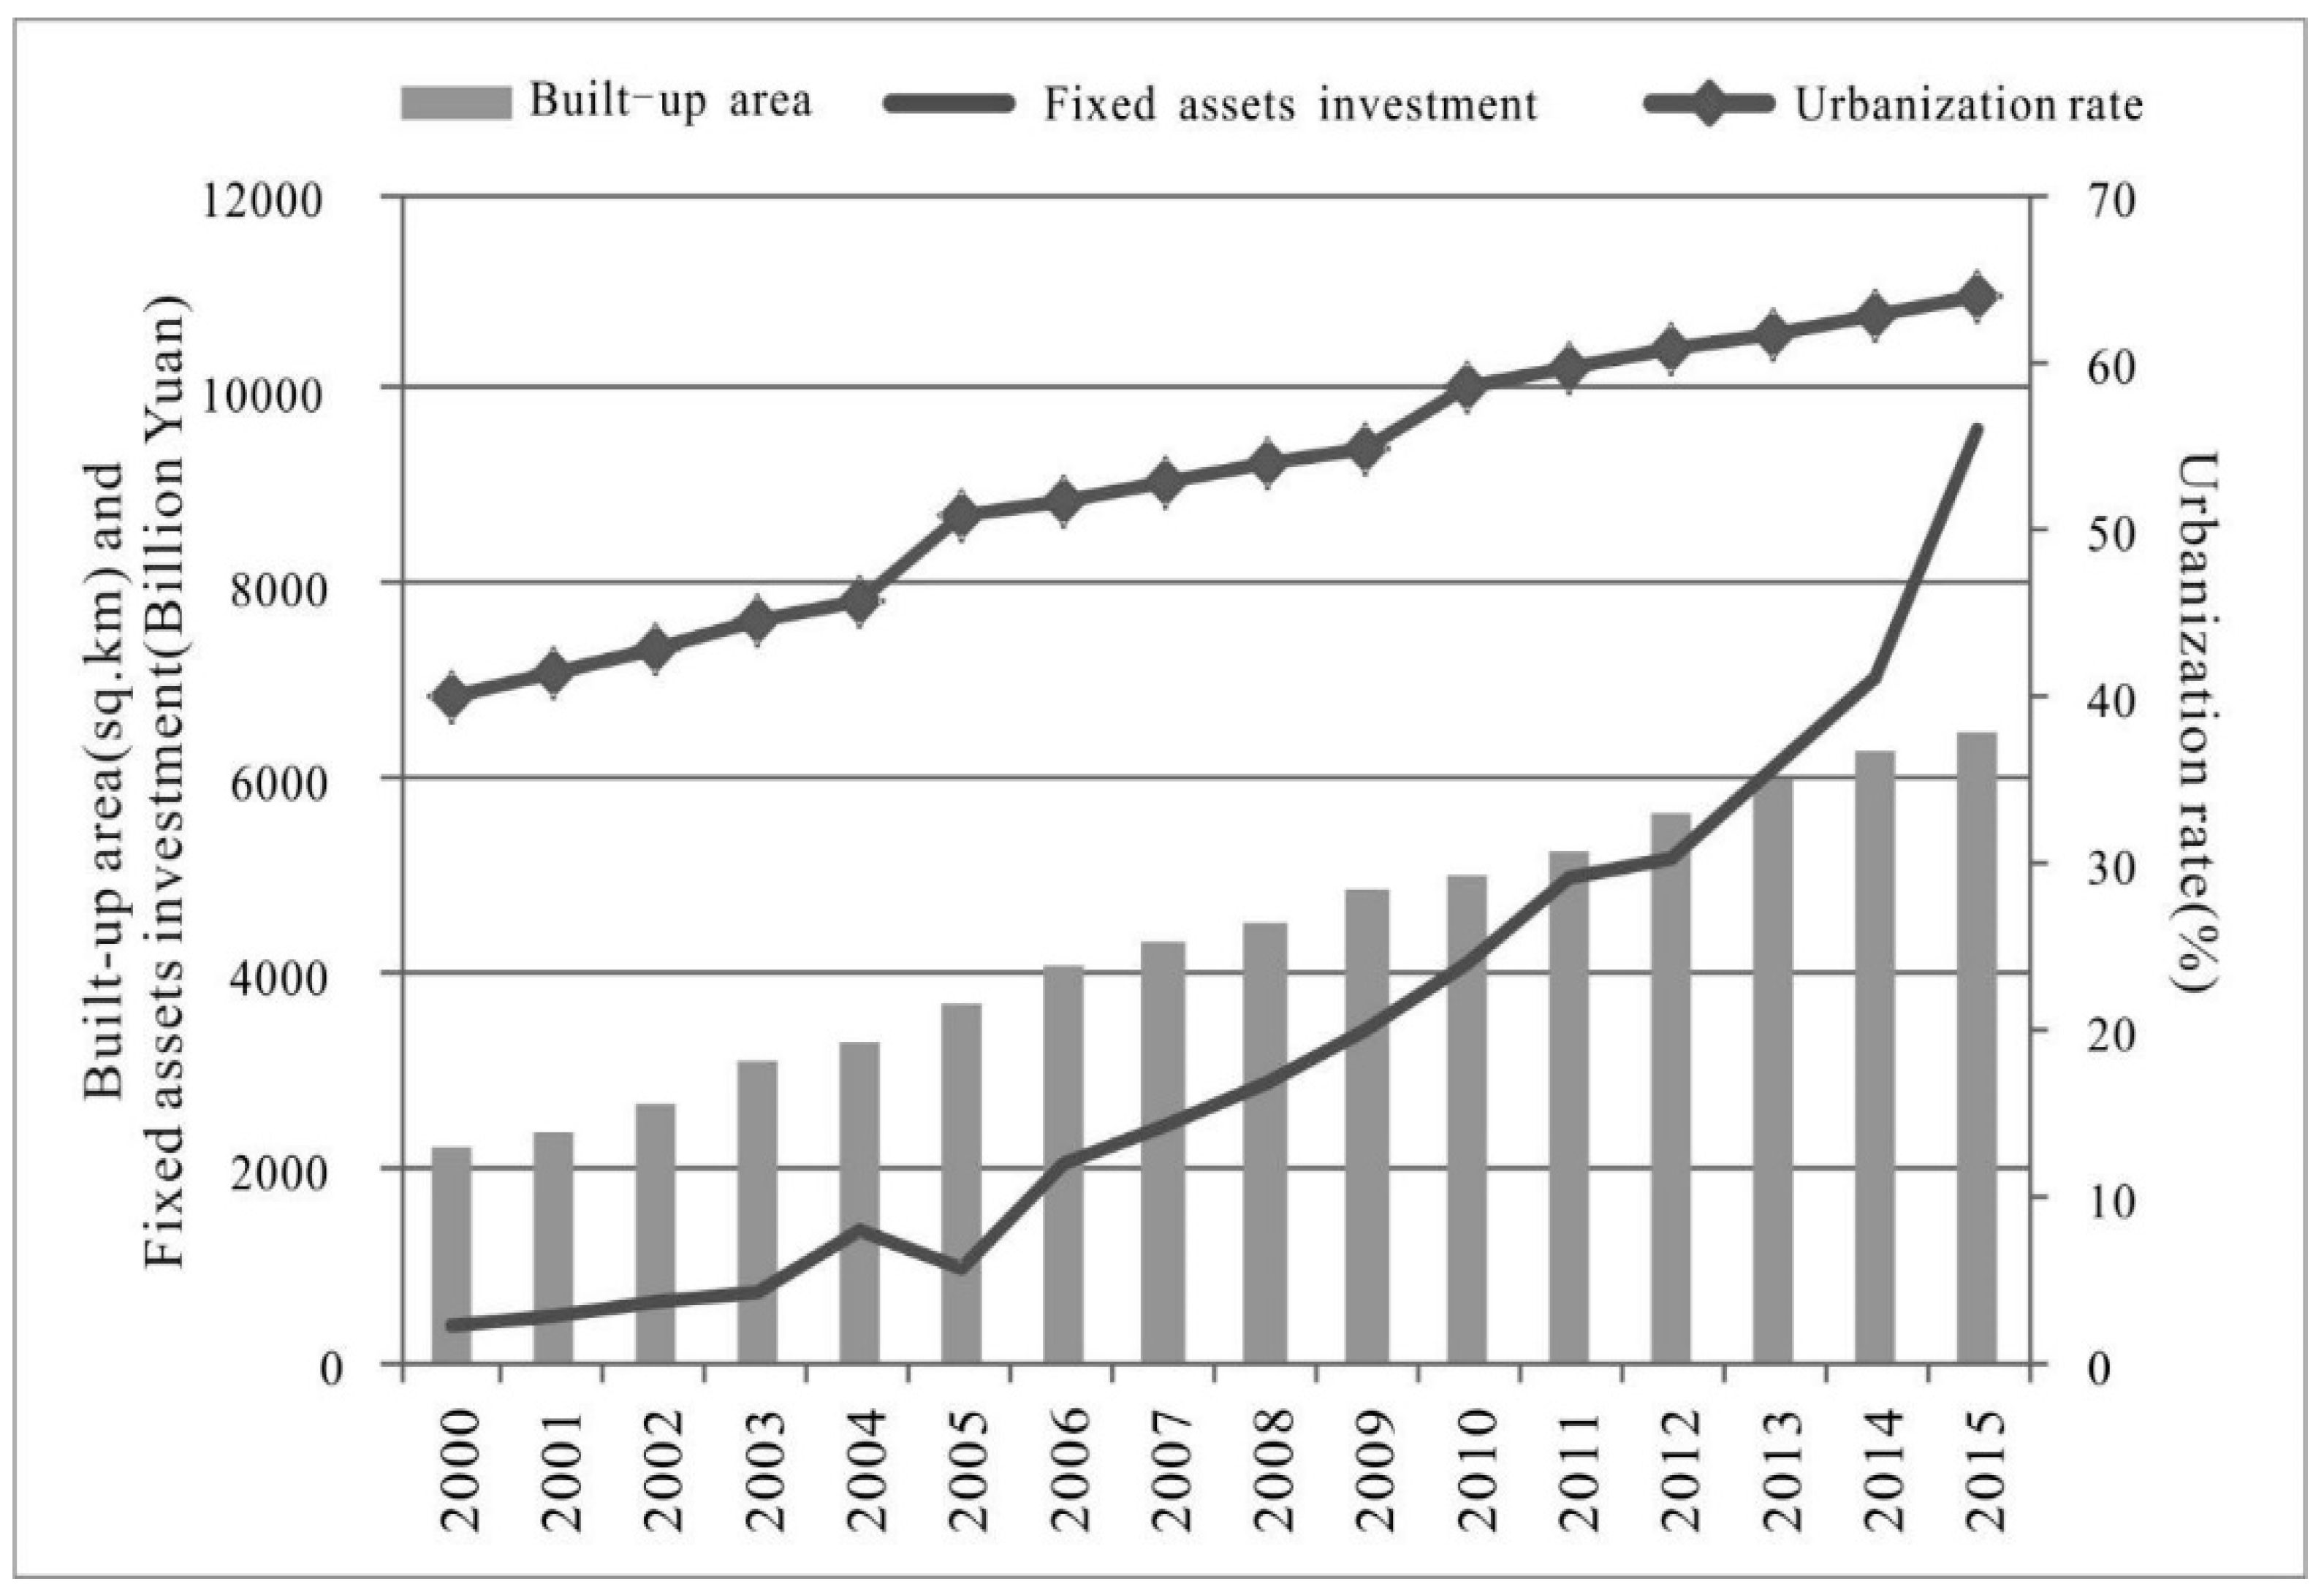
Over 15 years, FAI and FDI of the YRDUA have a similar changing trend, and the urbanization ratio basically shows a trend of linear growth. The evolution of built-up area and REI have a strong correlation (see Figure 3 and Figure 4). According to the relevant indexes, the development of the YRDUA can be divided into three periods, in which the year 2005 (the 11th Five-Year plan) and 2010 (the 12th Five-Year plan) are the turning points. The period of the years 2000–2005 can be referred to as the embryonic stage. There is an overall increasing trend but the development trend of each index remains relatively steady. This period can be described as the rapid development stage, in which each statistical index increases rapidly. The period of 2010–2015 is the sharp expansion stage when each index overall increases at an exponential speed, which is different from the previous two stages. For example, FAI and FDI have shown a strong momentum of growth. Although the overall evolution of each statistical index shows such a trend, there are some differences during certain separate years. For example, the scale of FAI did not increase but declined in 2005. Similarly, REI of the YRDUA in 2005 was basically the same as that in 2004 with no increase, as shown in Figure 3 and Figure 4. The underlying causes of the index changes will now be analyzed and explained.
Domestic and foreign capital investment which includes FAI, REI, and FDI, basically show similar variations to the urbanization ratio. After China joined the WTO (World Trade Organization) in 2001, FDI played a more important role than ever in the YRD. The growth of a built-up area is closely related to domestic capital investment, and FDI which includes REI makes a great contribution to the growth of the urbanization ratio. FDI has experienced a roughly exponential growth from 2000 to 2015, with the same trend of built-up areas and the urbanization ratio. It illustrates that foreign capital has a strong influence on the development of the YRDUA.
The government has played a crucial role from “the 10th 5-Year plan” to “the 12th 5-Year plan”. The state power leads to a city building movement, and an increase for the index which reflects the influence of power. For example, the built-up area was astonishingly expanded to almost three times the original size, from 2211 km2 in 2000 to 6452 km2 in 2015. It exhibits considerable variation and is consistent with the rapid urbanization in the YRDUA.
The built-up areas of Shanghai, Nanjing, Hangzhou, and Hefei, as the four core cities of the YRDUA, increased from 550–935 km2, 194–734 km2, 171–495 km2, and 120–403 km2, respectively, from 2000 to 2015. The built-up area of Shanghai increased by 1.7-times and the built-up area of the other three cities all increased by about four times. Presently, there is a new spatial pattern with Nanjing, Hangzhou, and Hefei as the centers of the urban network. The conversion of idle land into industrial or commercial land is a common method to achieve rapid development and improve the level of urbanization.
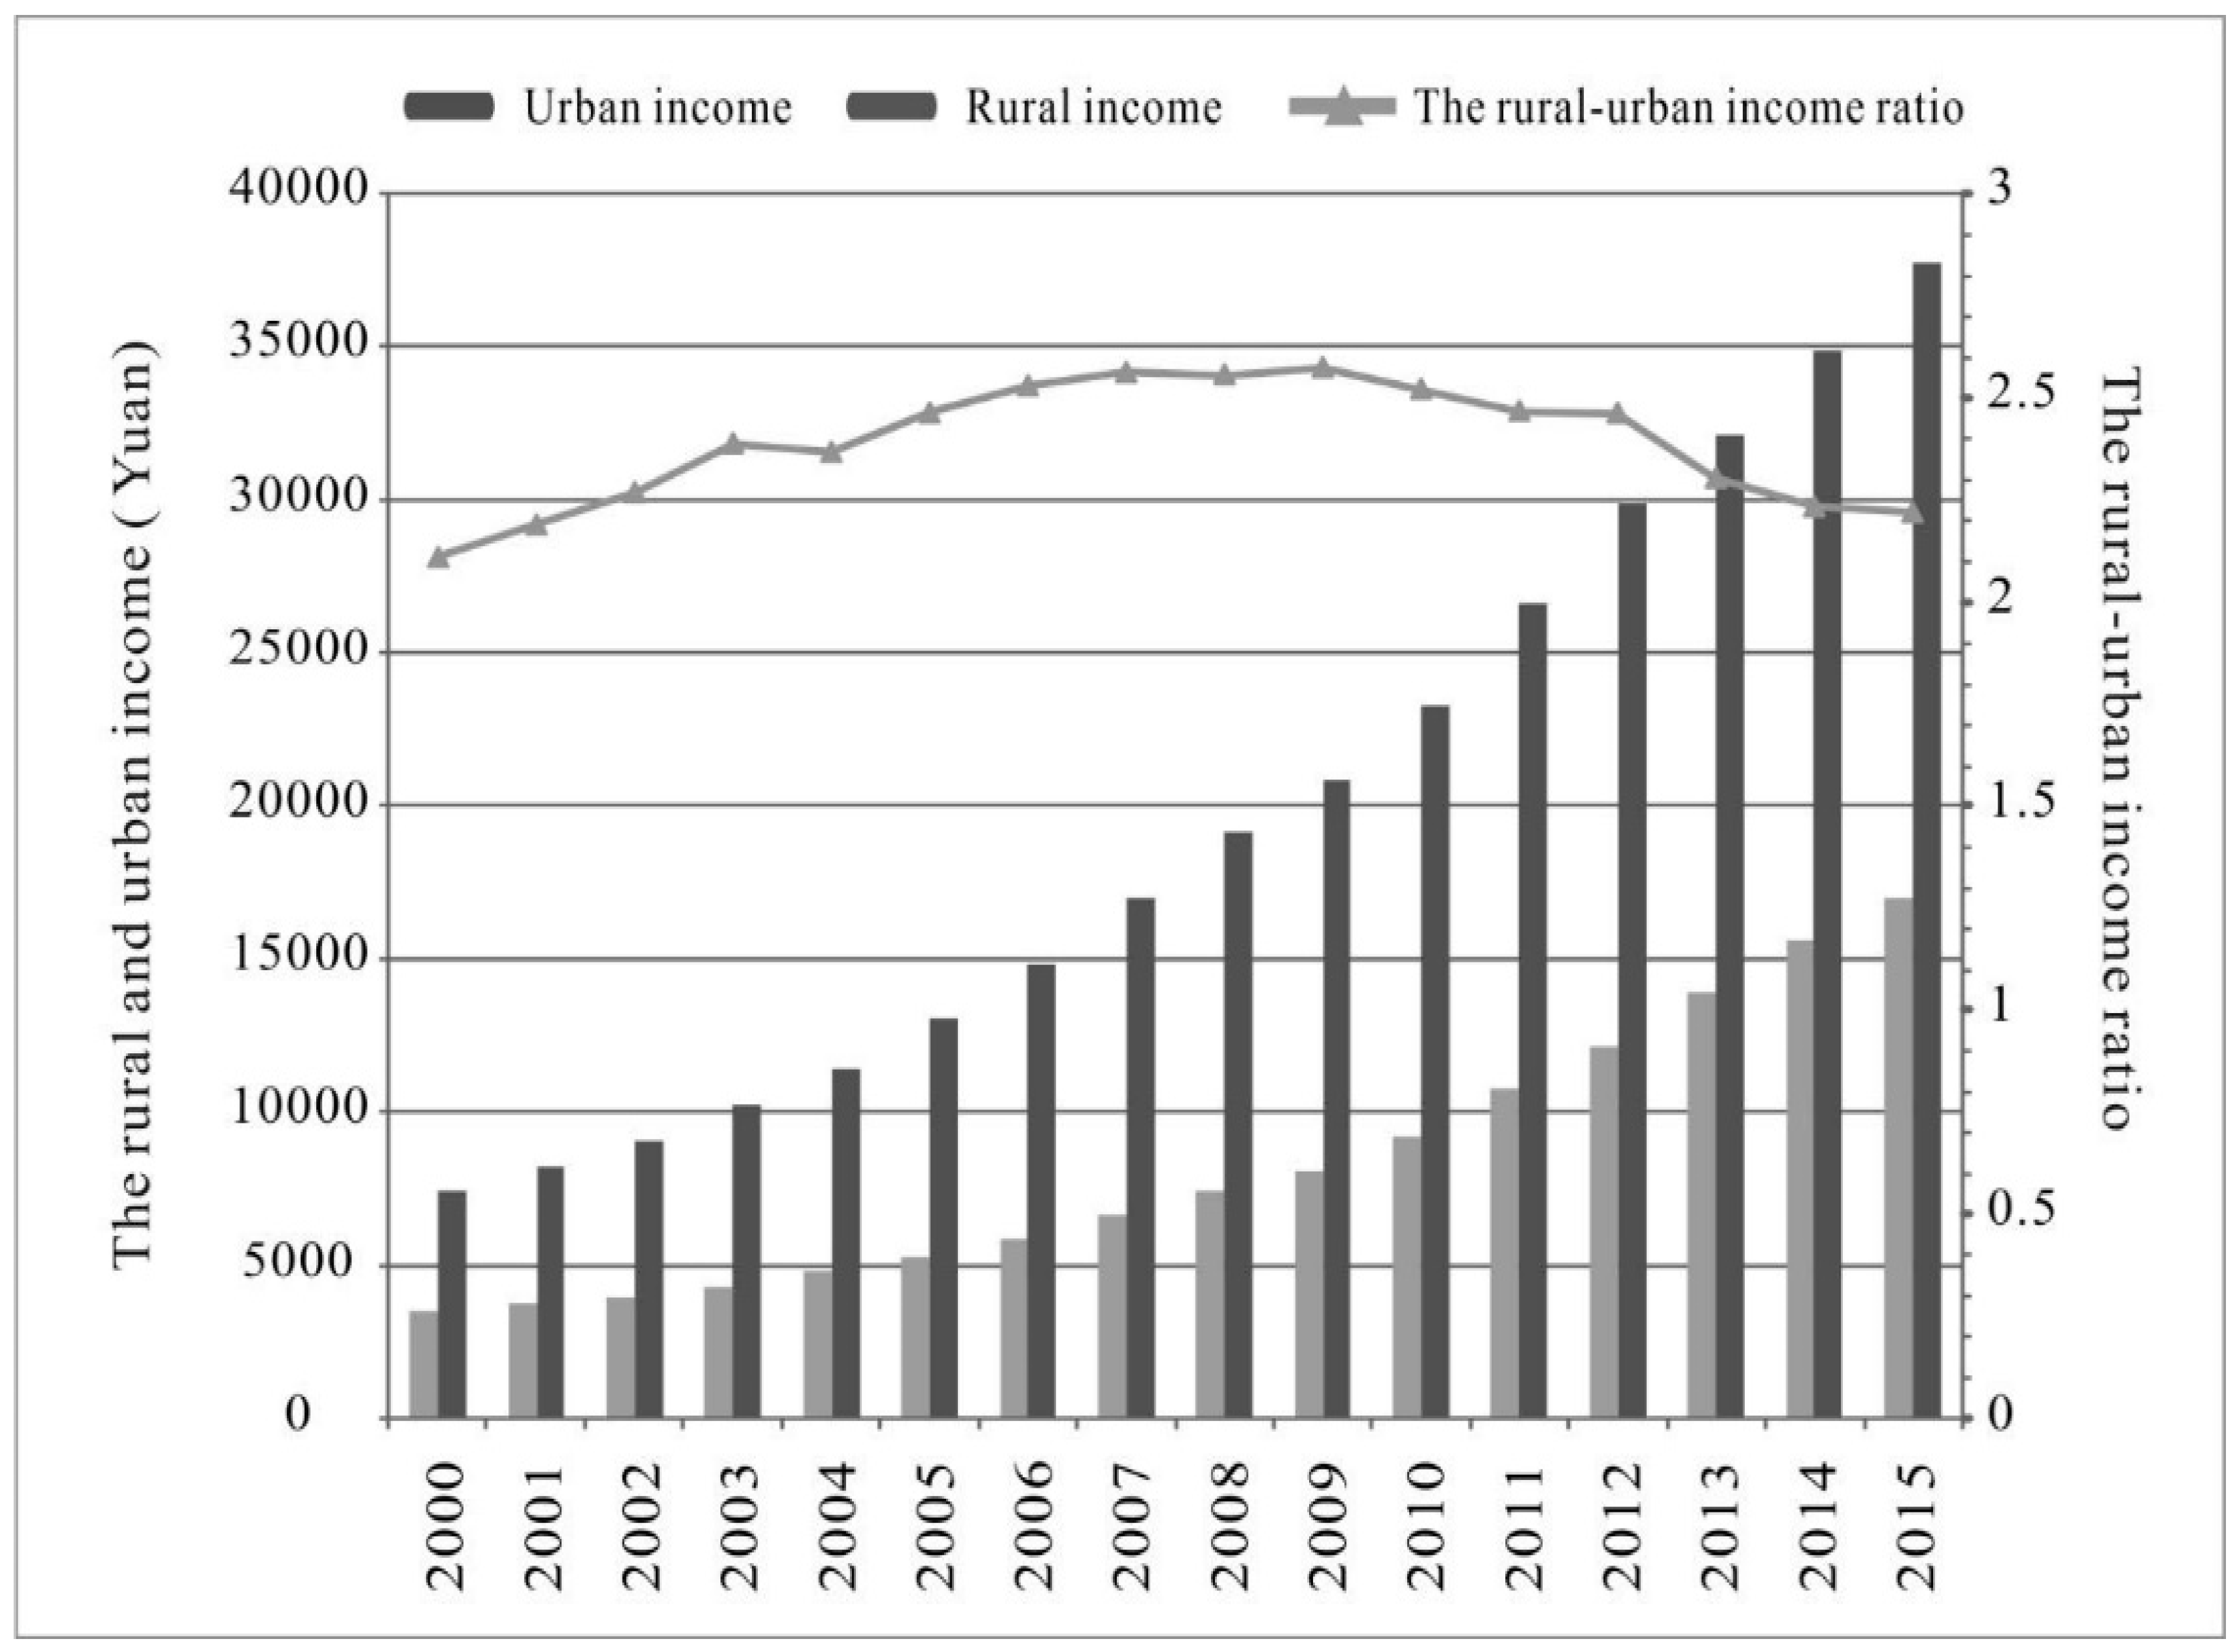
The YRDUA is one of the regions that primarily promoted urbanization in China, and the income gap between the urban and the rural is far less than the national average level. The URIR in China reached over 3, and during the year 2000 to 2015, the URIR of the YRDUA was between 2.1 and 2.6, while internationally, the highest value was only about 2. Furthermore, a clear differentiation or alienation between the rural and the urban in the YRDUA existed mainly because of uneven geographical development in which resources and the welfare system were distributed in an unbalanced manner between rural and urban areas, as shown in Figure 5. The coastal cities and counties often received more foreign and domestic investment while the rural areas were always overlooked. It is difficult for rural areas to absorb the investment and capital because it is marginalized by the policymakers and developers. As a result, with the rapid development of urbanization, the urban-rural gap enlarges stage by stage.
With rapid urbanization in the YRD, the index of URIR reached the maximum in 2009. The change of URIR can be divided into two parts, and the year 2009 is the turning point. In the first stage, the URIR continuously increased from 2.11 in 2000 to 2.57 in 2009. During this time period, the URIR decreased from 2.39 in 2003 to 2.37 in 2004 and it was relatively low because there were a large number of low-income people in urban and the rural areas. With the acceleration of urbanization, the income level of urban residents was higher than that of rural residents, which caused a wider income gap between urban and rural areas. In the second stage from 2009 to 2015, the URIR continuously decreased even though the index of URIR was over 2.5 from 2006 to 2010 and it had reached the maximum in 2009. The national related departments have intensively issued a series of policies and guiding opinions for the development of the YRDUA between 2006 and 2010, see Table 1 Moreover, during this period, the evolution of the index including FAI, FDI, and REI showed an increasing trend, which means that power and capital push the rapid urbanization and also enlarge the income gap between urban and rural areas. The difference range of the URIR between the years 2015 and 2000 was only 0.1, which shows that it basically remained the same. It illustrates that the living standards of urban and rural residents have increased since 2009.

3.3. Growing Regional and Social Inequality: Urbanization, Capital, and Urban-Rural Disparities

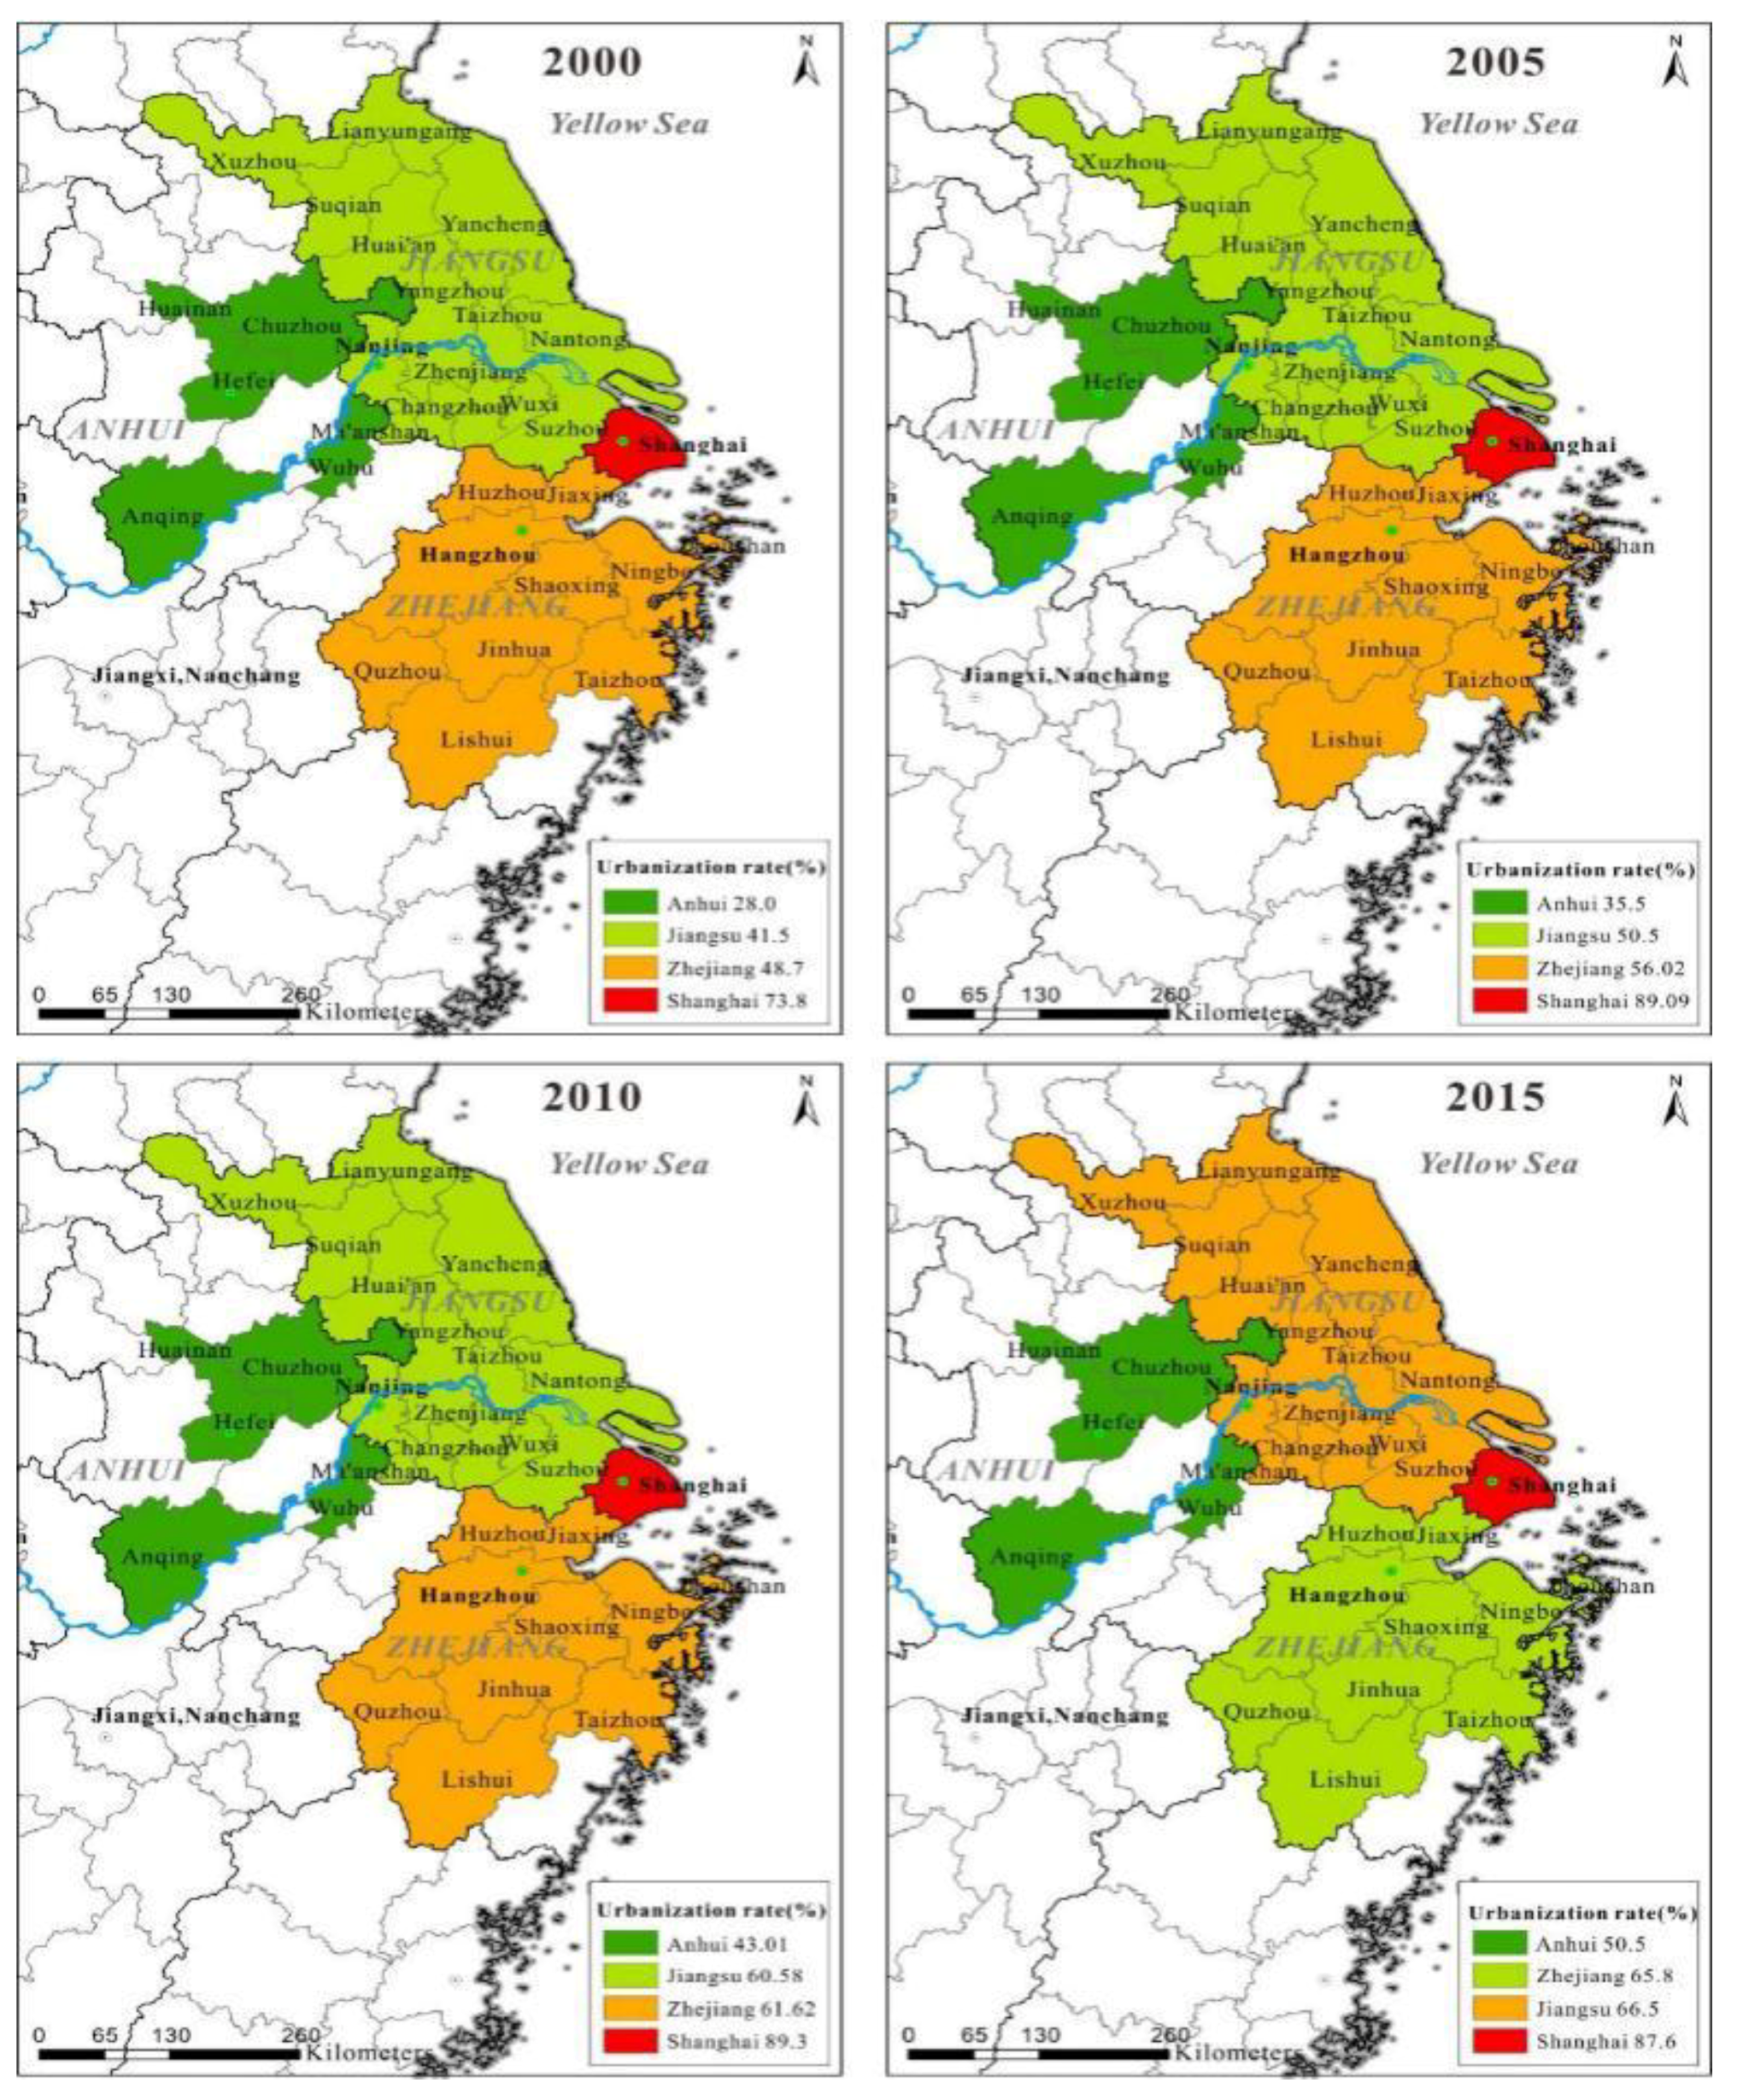
The urbanization ration of all provinces in the YRDUA has increased significantly since 2000, see Figure 6. Shanghai has been the top city while Anhui province has been at the lowest level according to their urbanization ratio. The gap between provinces has gradually narrowed. The difference range narrowed by approximately 1.2 times, from 0.458 in 2000 (Shanghai as the maximum 0.738, Anhui as the minimum 0.280) to 0.371 in 2015 (Shanghai as the maximum 0.876, Anhui as the minimum 0.505). The spatial pattern shows evident regional differences between Shanghai, Zhejiang, Jiangsu, and Anhui. Shanghai always has the highest urbanization ratio, followed by Zhejiang and Jiangsu, while Anhui has the lowest urbanization ratio. In 2015, the urbanization ratio of Jiangsu surpassed that of Zhejiang for the first time and became the province with the second highest urbanization ratio in the YRDUA. At the provincial scale, the urbanization ratios of Hangzhou, Ningbo, Nanjing, Suzhou, and Hefei were much higher than those of other cities in the province, and the urbanization of them has been increasing at a faster but still relatively low speed [22].
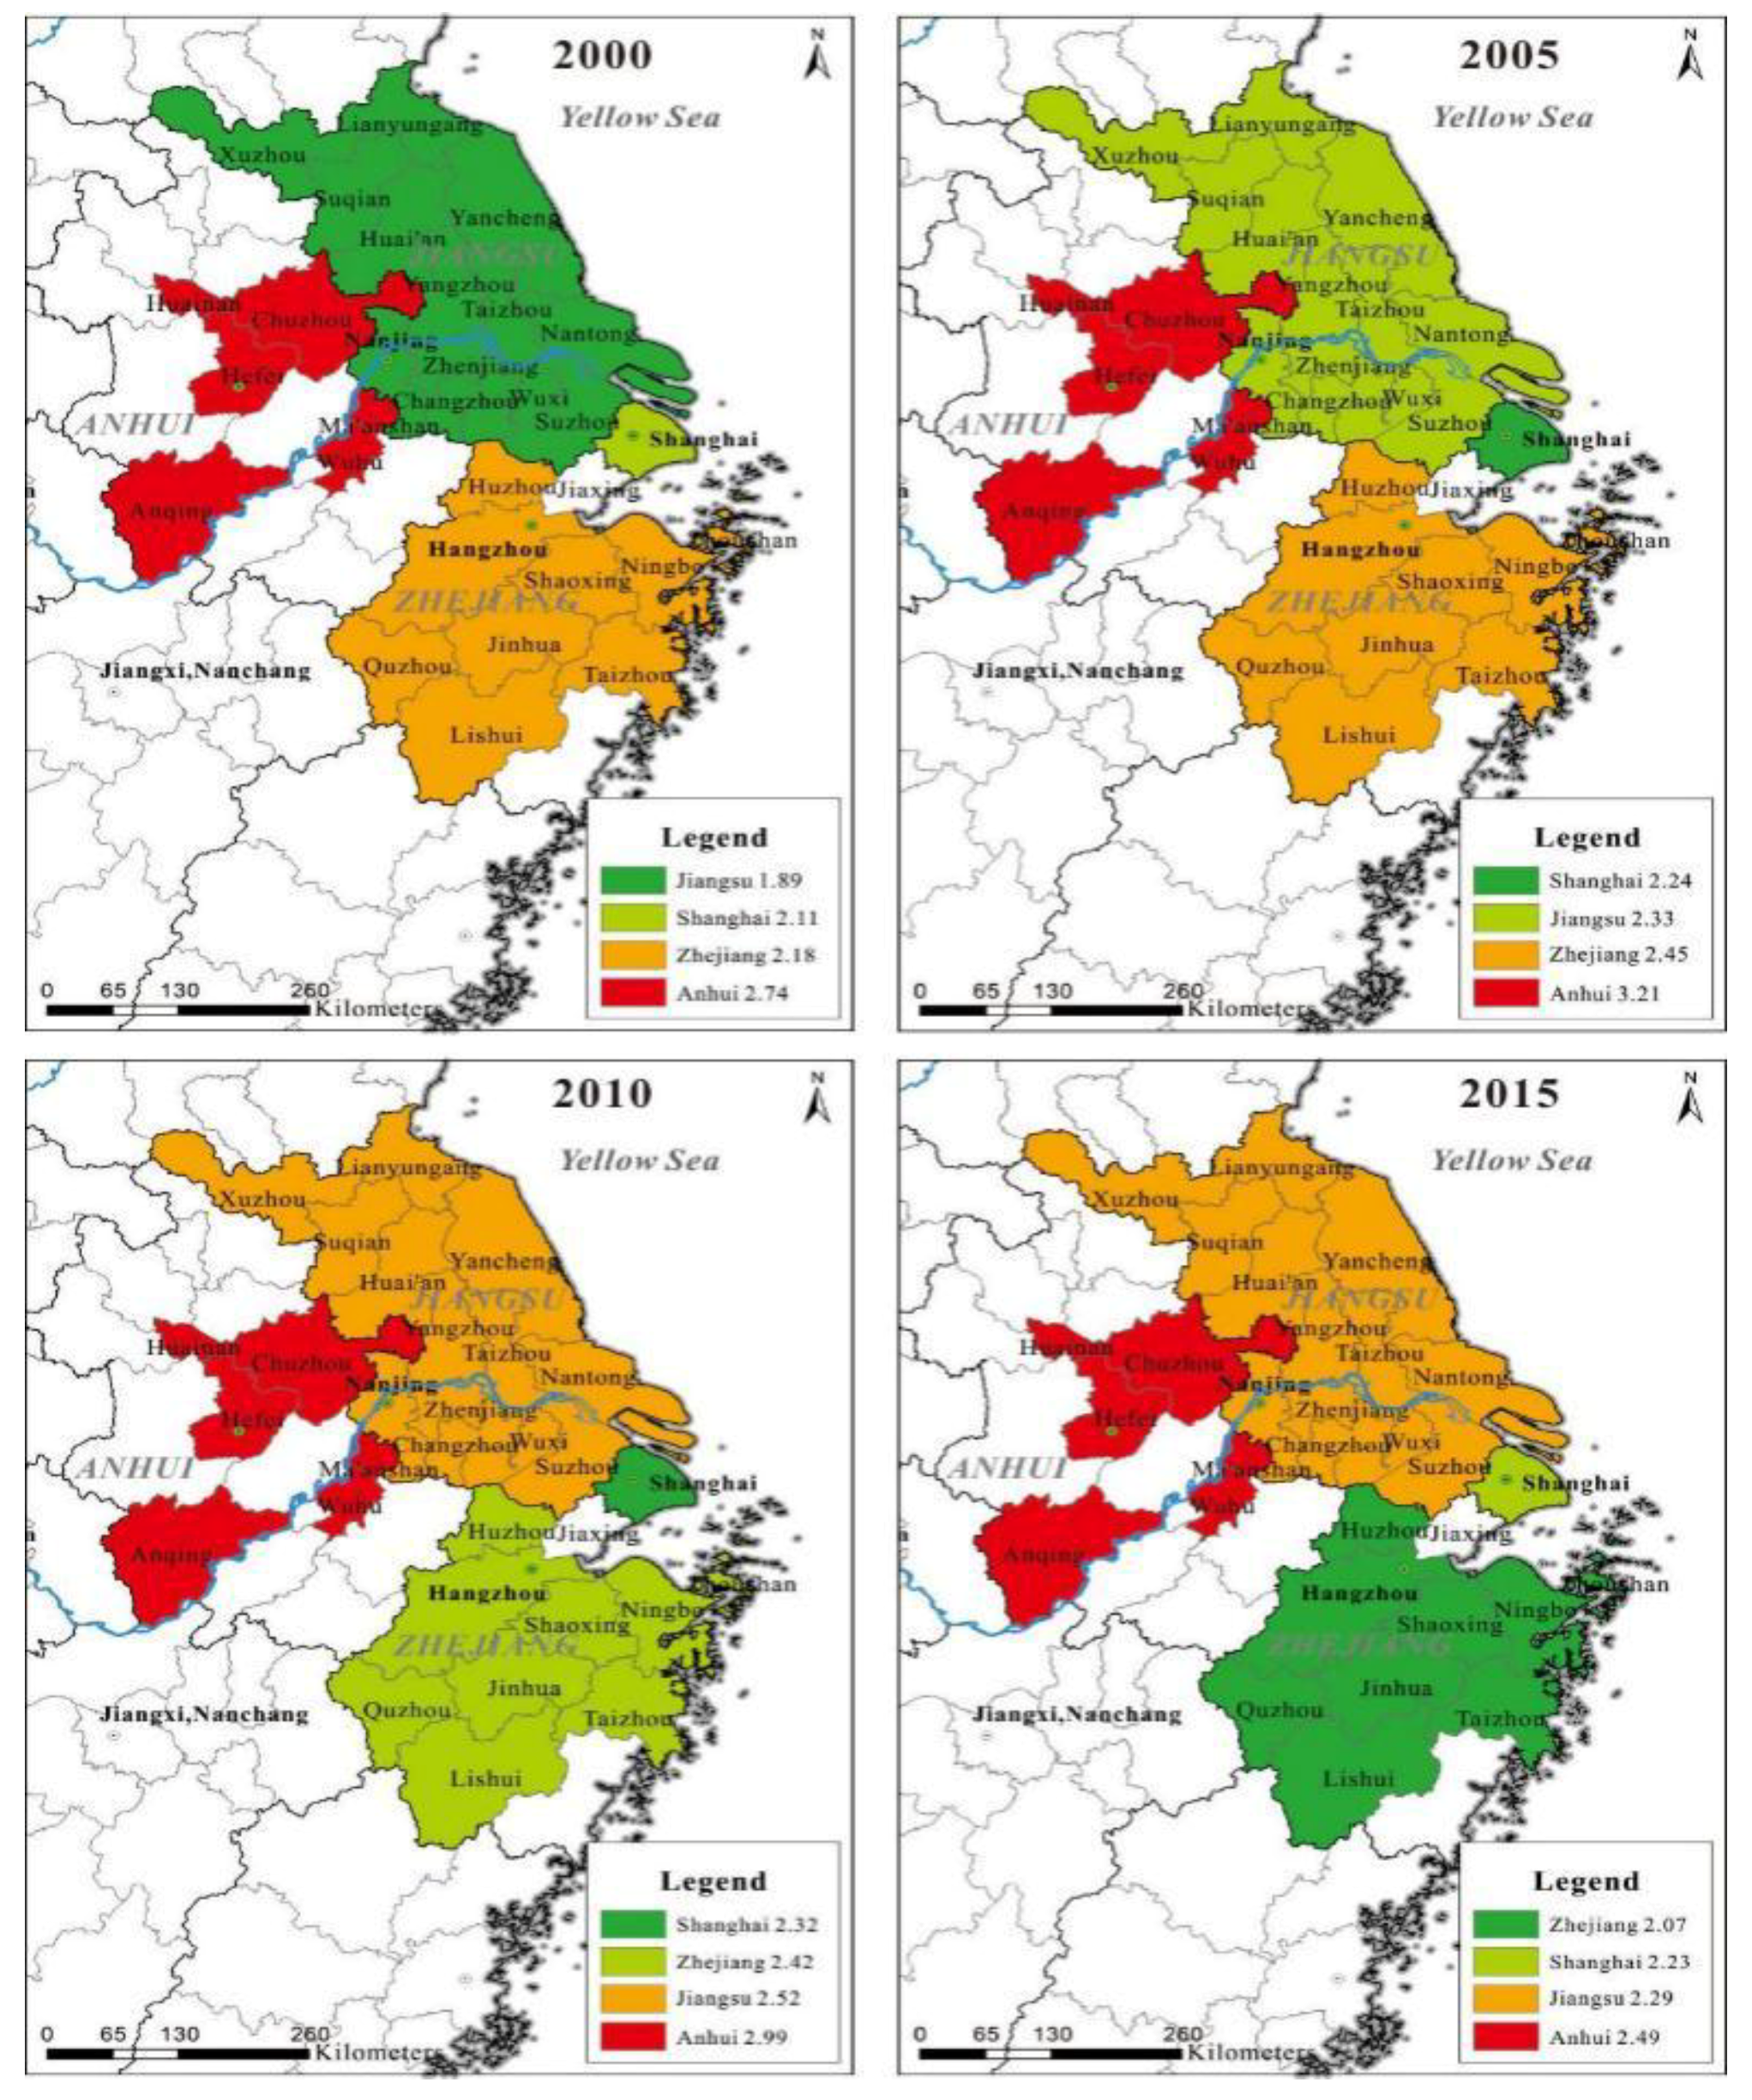
The increasing URIR will further aggravate social and regional inequality. In China, the rural and urban areas are not only two kinds of space but also two main social classes, and the residents of these two classes have a deep gap in terms of infrastructure, welfare, medical services, and income, etc. The index of URIR is mainly used to illustrate the influence of class in the process of urbanization in the YRDUA. For the YRD as a whole, the average URIR is becoming smaller which means that the income gap between urban and the rural areas has widened. However, there has been an evident difference between all provinces in the YRD, see Figure 7. Because of the high urban-rural coordination based on economic development, the difference of URIR between Shanghai, Zhejiang, and Jiangsu were smaller compared to that of capital and power, and the index of URIR was relatively low. However, the URIR of Anhui has been at a relatively high level constantly, as the highest among the provinces, though it narrowed from 2.74 in 2000 to 2.49 in 2015. Due to the level of natural conditions, economic and social development, and other factors, China’s urbanization showed obvious regional differences. The gap was gradually widening, and indicated the uneven development inside each urban agglomeration and provincial regions.
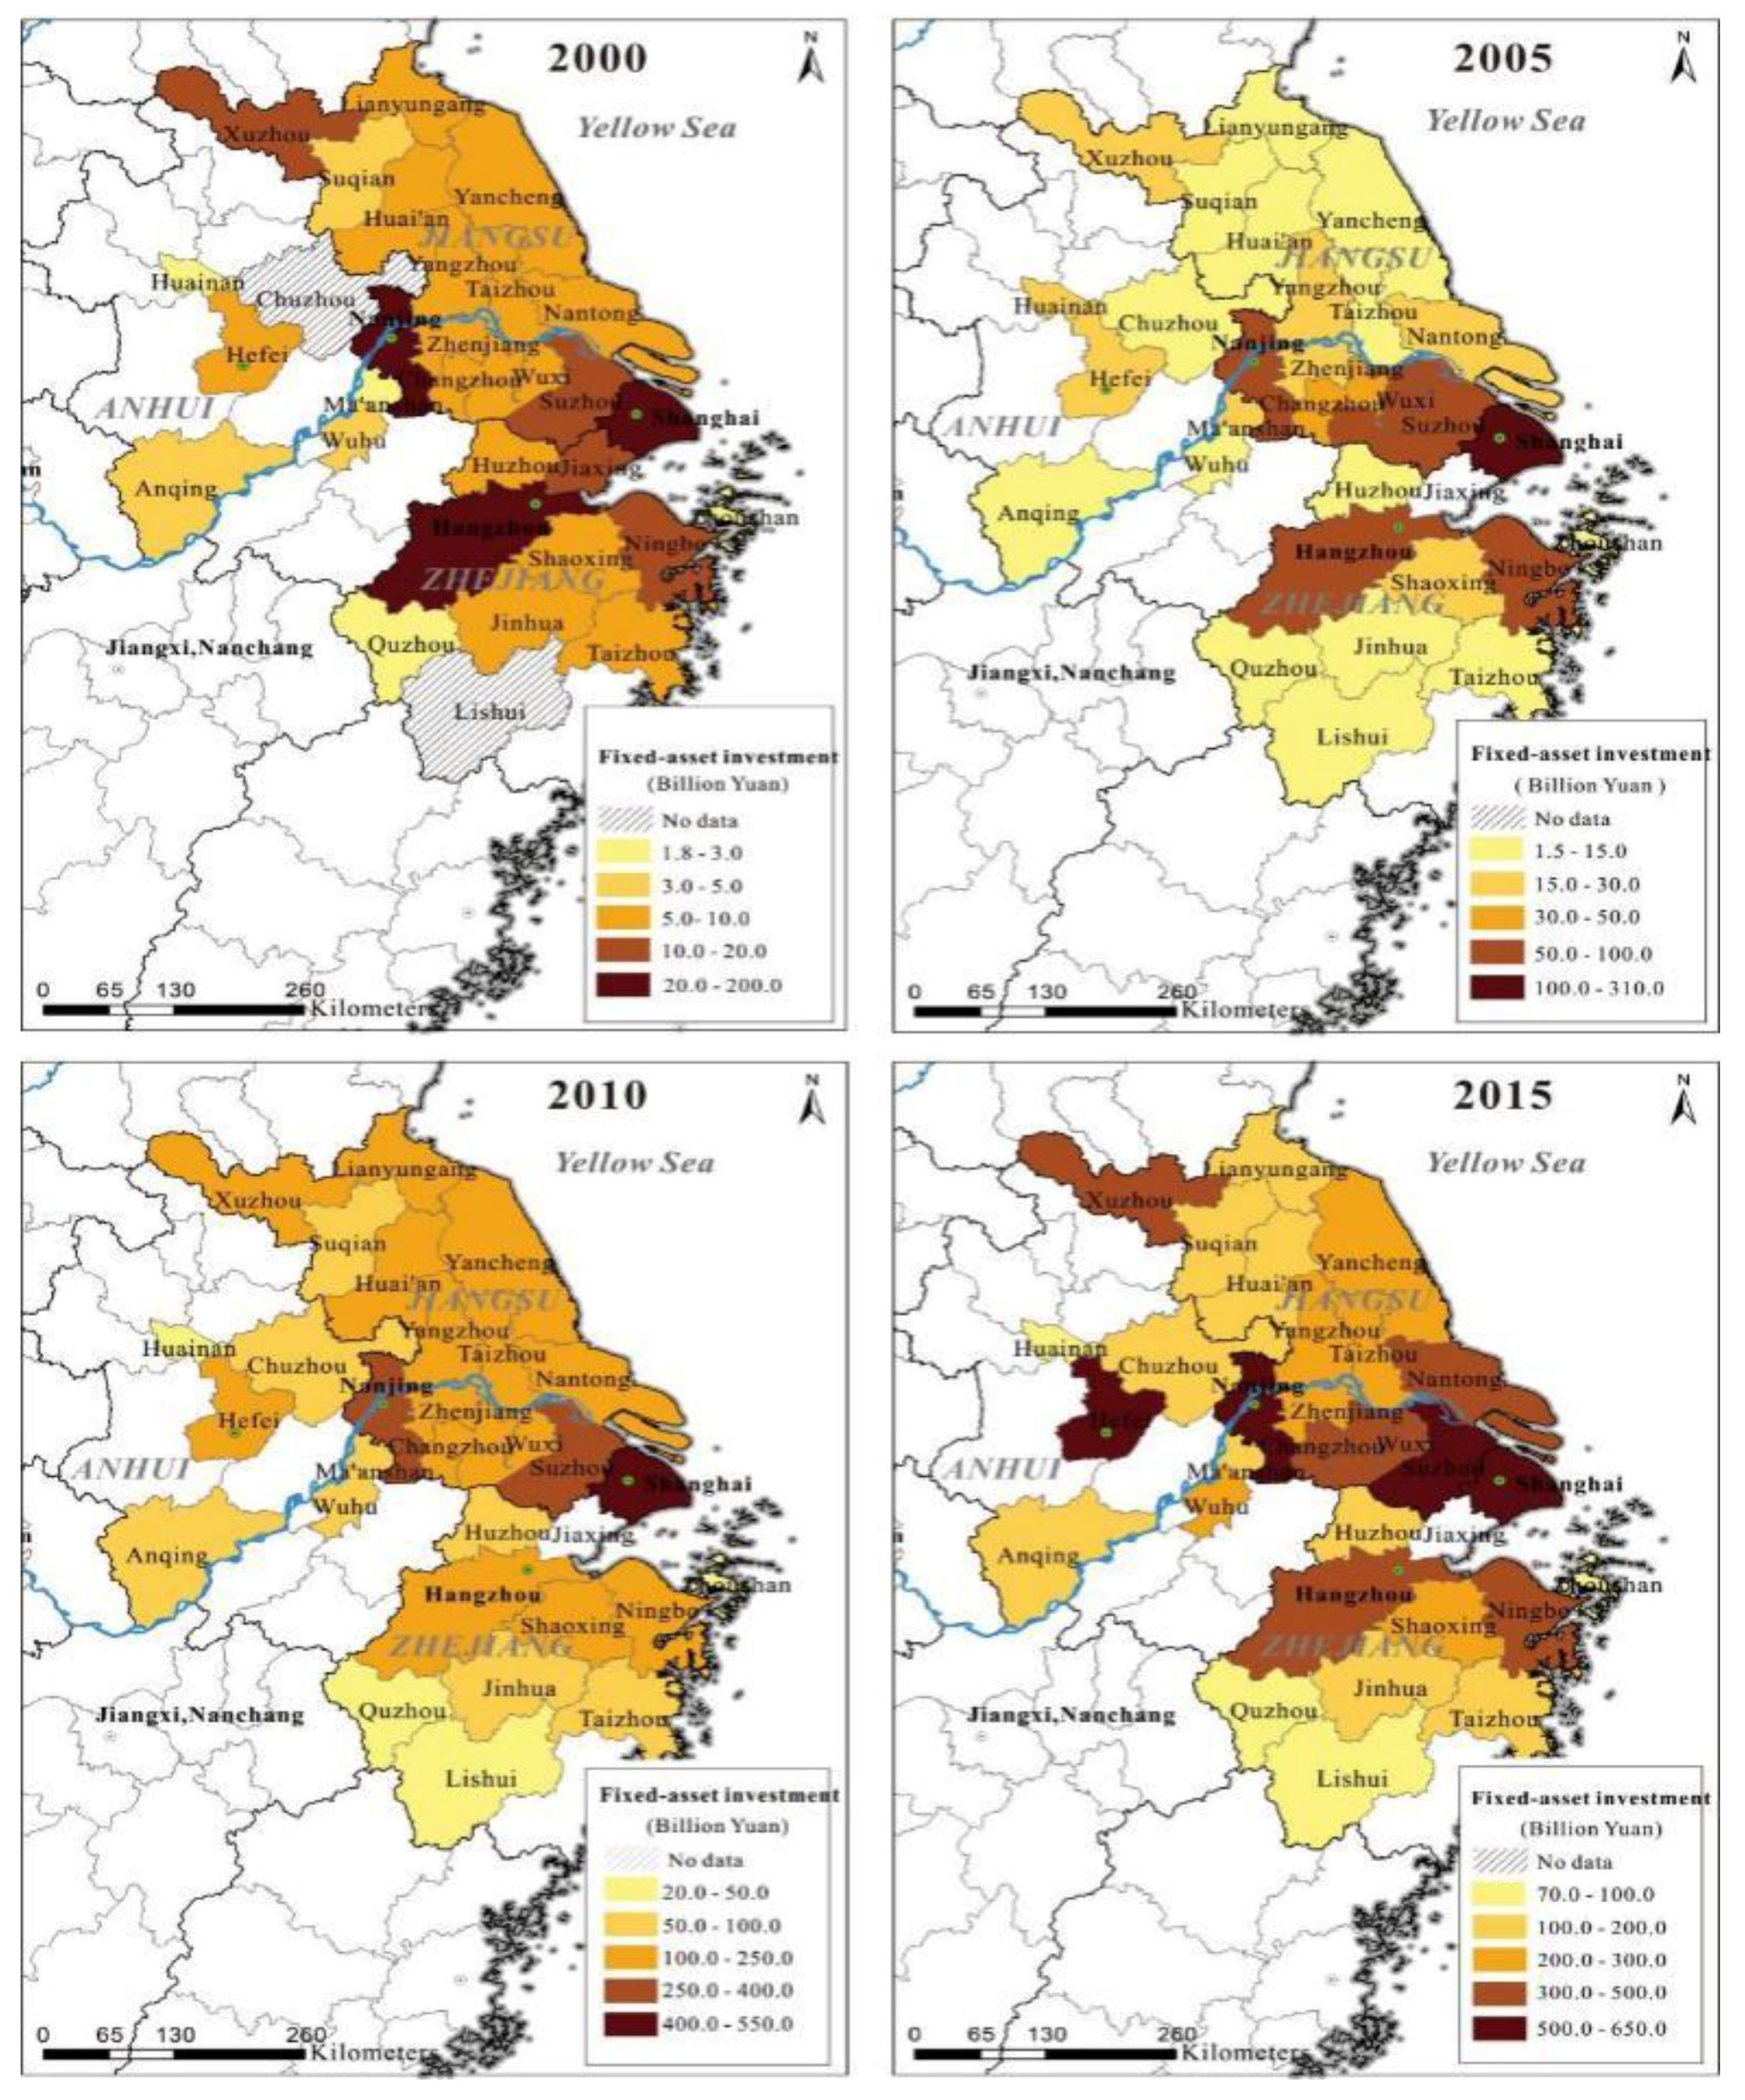
The index of FAI is used to show the influence of capital on the urbanization process of the YRDUA. From 2000 to 2015, the amount of FAI in almost every city has been growing gradually, see Figure 8. However, there were evident differences between different parts of the YRD. Cities around the Yangtze River basin have the highest FAI followed by Jiangsu, Zhejiang, and Anhui province. During this stage, Shanghai was the leading city in the amount of FAI while Tongling in Zhejiang province was essentially at the bottom. Moreover, the gap of FAI between cities rose by almost 20 times, from 394,678 billion Yuan in 2000 (Shanghai as the maximum 185,671, Zhoushan as the minimum 1807) to 8081.367 billion Yuan in 2015 (Shanghai as the maximum 60.297, Tongling as the minimum 66.508). The FAI of 13 cities in Jiangsu province was relatively high, which ranged from 106.927 billion Yuan in 2000 to 4155.275 billion Yuan in 2015, while the FAI of six cities in Anhui province ranged from 20,569 billion Yuan to 1276.82 billion Yuan. This fact indicates that cities in different provinces or in the same province have huge differences in their capital investment which lead to their urbanization ratio difference, see Figure 6.
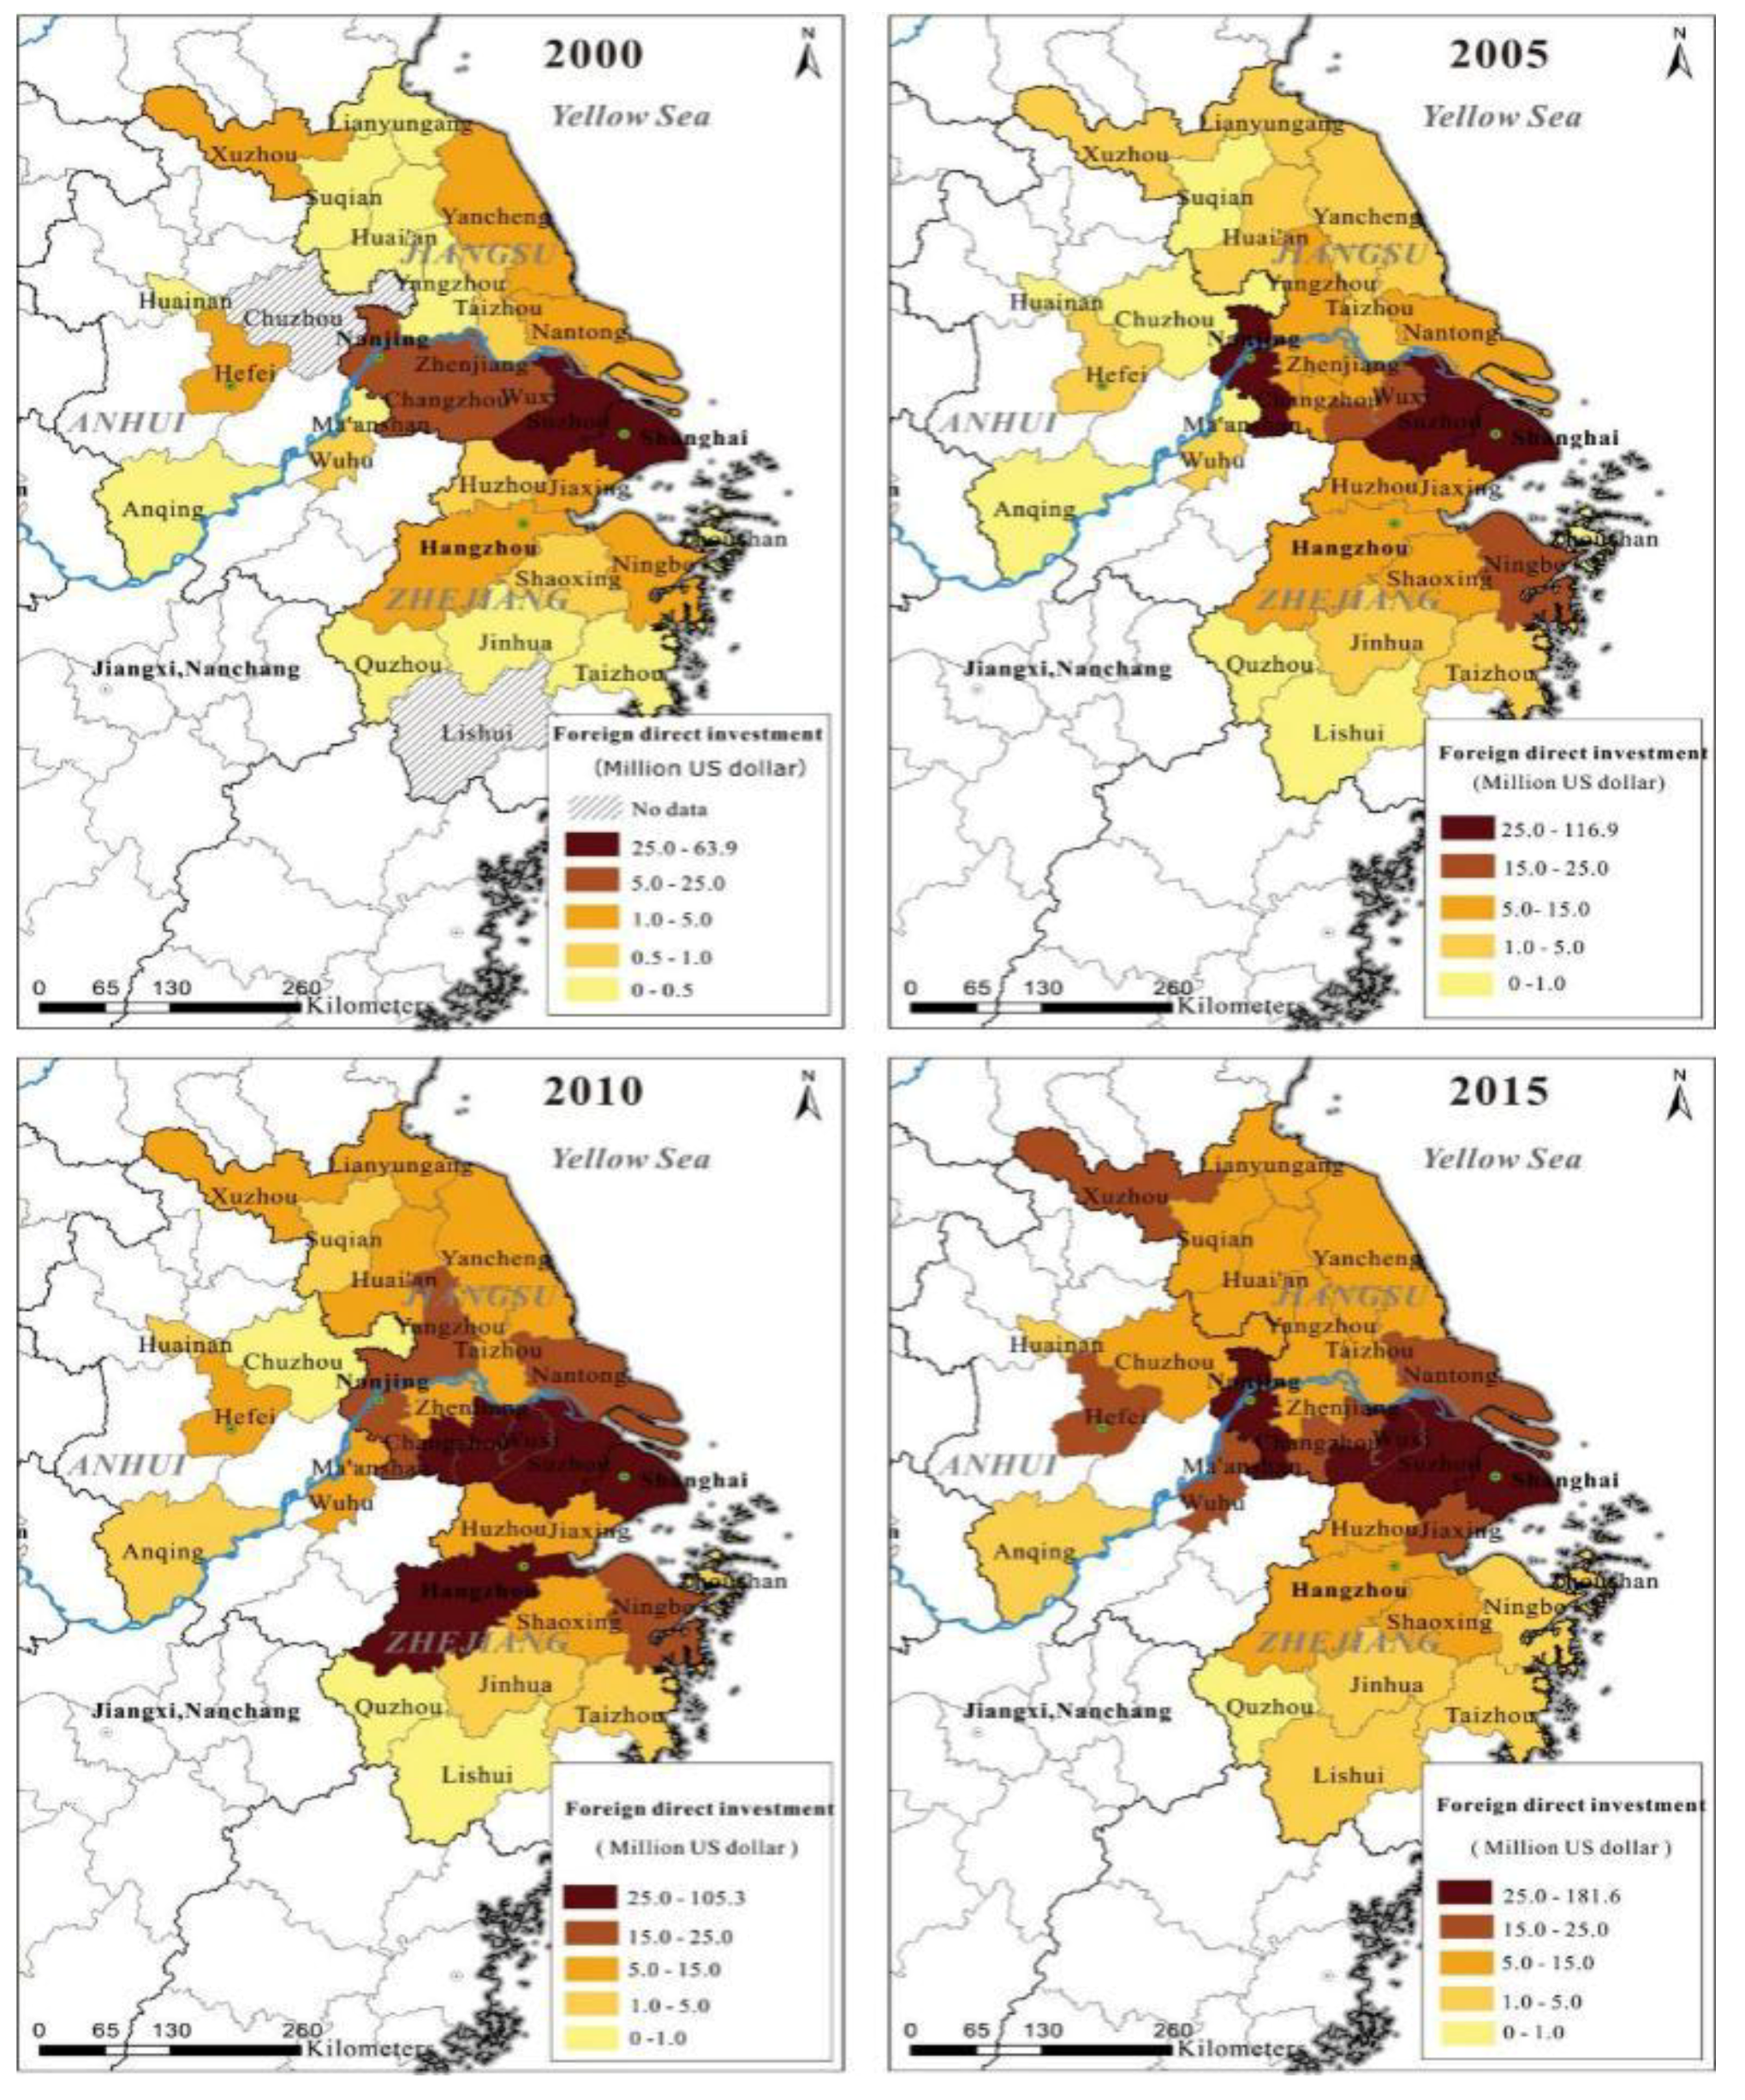
The FDI can directly indicate the influences of foreign capital in the process of urbanization in the YRDUA. According to the spatial evolvement of the FDI in the YRDUA from 2000 to 2015, see Figure 9, there is a large and obvious gap in FDI between cities around the Yangtze River basin and other cities in the Anhui, Zhejiang, and Jiangsu provinces; however, the FDI of all cities in the entire YRD region constantly increased in this stage. Shanghai and Suzhou have played a leading role since 2000. Taking cities around the Yangtze River Basin as the center, the cities of Zhejiang and Jiangsu province, close to Shanghai, have gradually expanded the scale of FDI since 2005, mainly because of a superior geographical location and convenient traffic. In 2000, the FDI of Shanghai was 6390 billion dollars, soaring to 18.166 billion dollars in 2015. In 2000, the city with the lowest FDI of only 8.69 million dollars was Zhoushan in Zhejiang province, and its FDI reached 200 million dollars in 2015. The difference in FDI between Shanghai and Zhoushan narrowed from 735 times to 90 times. In 2015, Nanjing and Wuxi also ranked among those with the largest amount of FDI after Shanghai and Suzhou.
The spatial distribution and evolvement of FDI have generally aligned with the changing trends of urbanization and have basically remained unchanged since 2000. Since China joined WTO in 2001, developed countries such as the USA have also increased their investment in the YRD. More and more industries and factories have been investing, and the foreign investment has been infiltrating with increasing speed into the service industry such as commerce, securities, insurance banks, and other industries. The uneven distribution and growth of FDI in the inner urban agglomeration is one of the main causes of the increasing gap in regional economic development. From the distribution map of FDI in 2015, when capital cannot accumulate and grow in one region, it will find another region to absorb and digest surplus capital using a variety of mechanisms. This will further expand the uneven development in the urban agglomeration.
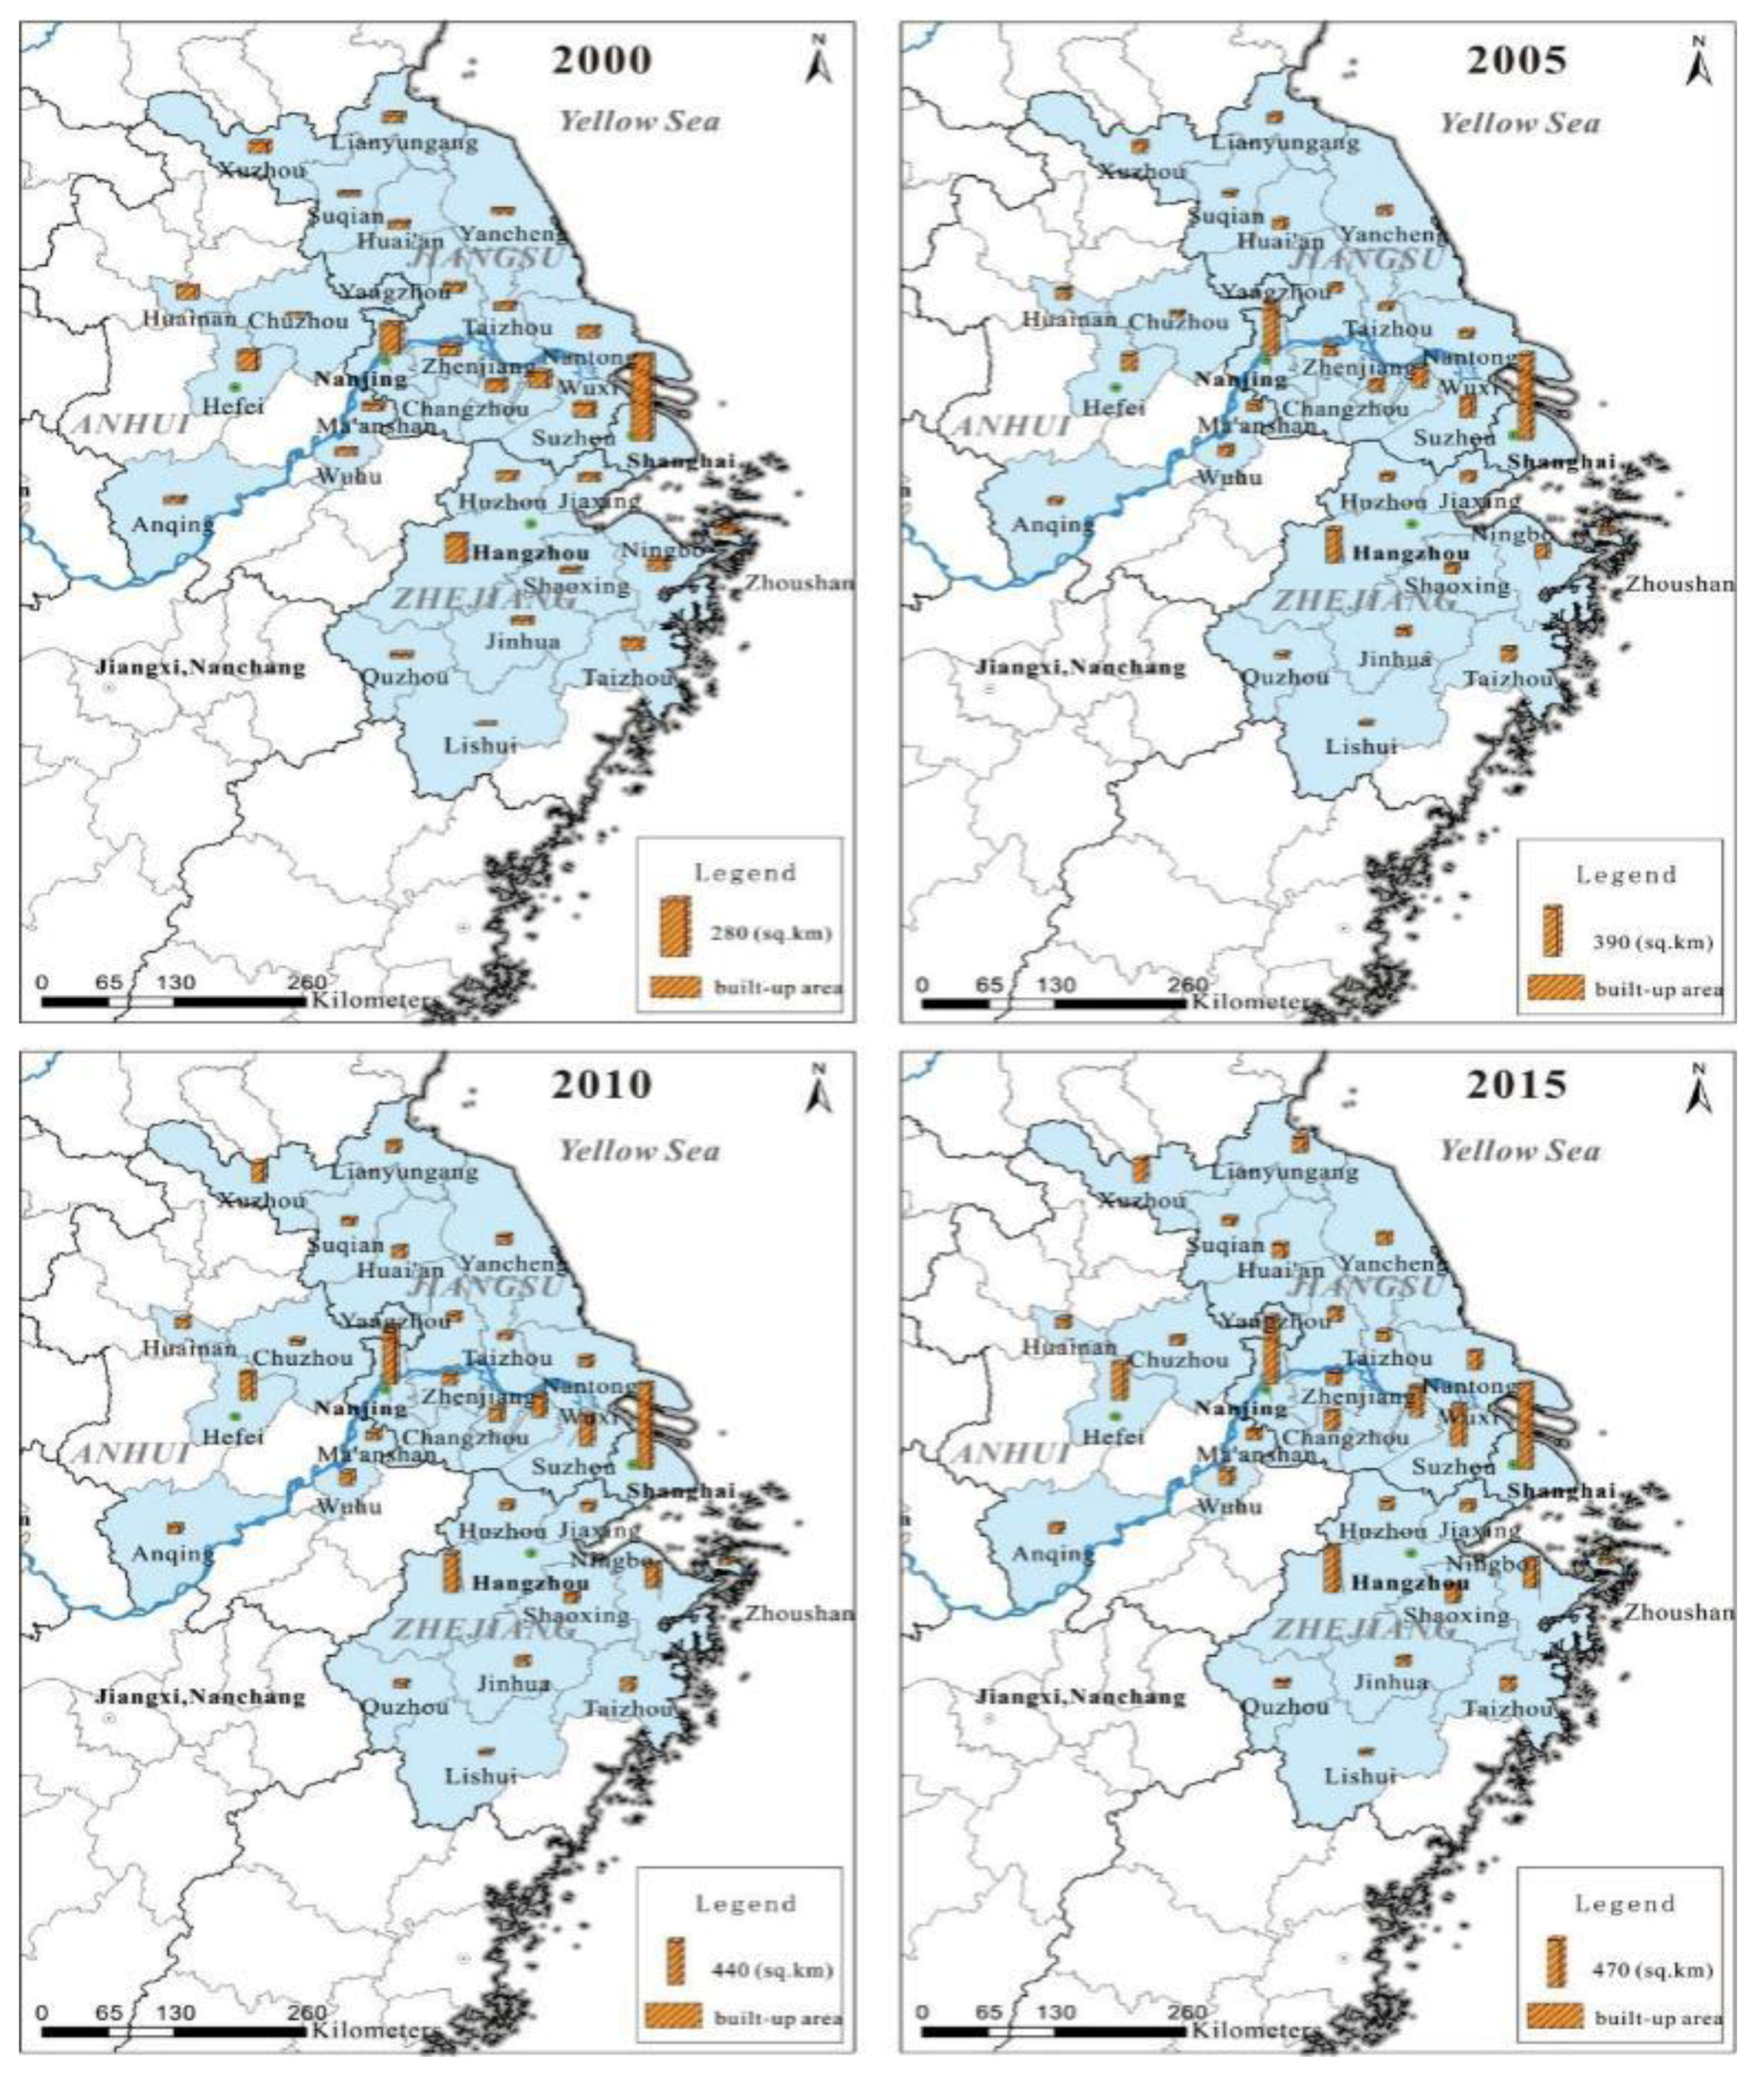
The index of built-up areas demonstrates the influence of power in the YRDUA. The built-up area has been rapidly expanding at a large scale in almost every city of the urban agglomeration every year. The regional and spatial differences are mainly shown in two aspects, see Figure 10. Firstly, the built-up area of four cities including Shanghai, Hefei, Nanjing, and Hangzhou has expanded sharply. Secondly, the differences between cities in different provinces or in the same province increased during the years 2000 to 2015. The difference range increased from 3690 km2 in 2000 (Shanghai as the maximum 550 km2, which is almost 32 times that of the minimum, Tongling at 17 km2) to 6452 km2 in 2015 (Shanghai with the maximum 935 km2, which is over 27.5 times that of Tongling with the minimum of 34 km2).
In some cities, such as Shanghai, Hefei, Nanjing, and Hangzhou, the changing trends in their built-up areas are similar to that of the YRD overall. Shanghai has the built-up area which has expanded the most; the built-up area increased by 385 km2, from 550 km2 in 2000 to 935 km2 in 2015. The built-up areas of Hefei, Nanjing, and Hangzhou have increased by 283 km2, 540 km2, and 324 km2, respectively. The development of the YRDUA and the acceleration of urbanization are in the form of scale expansion. At first, it is influenced by capital investment including domestic investment and foreign investment. The curve of foreign investment has been continuously rising, although the growth rate of REI has been less than that of FDI and has fluctuated in some years. Moreover, it is affected by spatial expansion, which is reflected in the increasing built-up area. As the central cities of the YRD, Shanghai, Hefei, Nanjing, and Hangzhou are more powerful than other cities, which helps ensure the priority of expanding their built-up areas.

4. Conclusions and Discussions

Space, society, and time are interactively based on socio-spatial dialectic which focuses on the interactions and relations between time, space, and society at different scales [21,22,28]. In general, spatial production is a critical theory that should be applied to multi-scalar urbanization issues including urban agglomeration. The YRDUA has the free marketing history and base as shown by Jiangnan culture in Chinese history, but nowadays it needs to be intervened and designed by the national planning policies in the new period. The YRDUA has become a mixture dominated by governments at different levels together with its own geographical conditions and marketing force and as a result of spatial production driven by capital and power.
The evolution of indexes including domestic and foreign investment, built-up area, and the urbanization ratio of cities in the YRD generally have shown an increasingly upward trend, although some indexes have fluctuated. Observed from the indexes of capital and land use, the development of the YRD is roughly in the form of two axes. The main axis is the line from Shanghai, Suzhou-Wuxi-Changzhou, and Nanjing to Hefei, and the second axis is the link between Shanghai and Hangzhou. It shows a trend that is more toward centralization. Therefore, the development of the YRDUA strengthens the areas with advantages while the weak regions are still relatively weak and even weaker than before. From this view, the YRDUA has not yet played the role of a world-class urban agglomeration. The radiation of a central city is not enough, and the ties between areas are deficient. Furthermore, the functional division of cities in the YRDUA is often limited within the boundary of provinces.
While analyzing from spatial production, power (represented by built-up area and national policies), and capital (represented by domestic and foreign investment) has a great effect on the development of the YRDUA. The developmental orientation has undergone two transformations, and the years 2005 and 2010 are the turning points. Some important national plans from “the 10th Five-Year plan” to “the 13th Five-Year plan” have expressed the government’s will toward the development of the YRD. It will be hard to change in the future. Although we analyze one urban agglomeration, it is probably similar to other regions or urban agglomerations in China.
This kind of traditional urbanization pattern, mainly driven by governmental power and characterized by large-scale spatial and capital extension, is almost contradicted with the aim of people-orientation. In “the 13th Five-Year plan”, people-oriented urbanization as the core idea of a new type of urbanization is emphasized many times. In fact, individual or community development is really the core of people-oriented urbanization; however, the pattern of spatial production often overlooks and destroys it. Regional and social uneven development is reshaping and expanding with spatial production, and it seems to be hard to avoid the process and result. Urban agglomeration is always regarded as a tool or means for improving China’s urbanization, which means spatial need is given priority over the right to city. Consequently, individual or local development will be inevitably ignored or even forgotten. In fact, the plans and policies on the large-scale region such as urban agglomeration focus on more spatial and capital extension rather than place-based development. On one hand, the strong logic of capital and power provides the driving force for rapid urbanization and helps achieve great economic development; on the other hand, spatial production dominated by this logic inevitably has a passive effect on people-oriented and place-based urbanization because the nature of the logic is pursuing more space and profit. If China’s new-type urbanization in the future cannot change the pattern and the logic fundamentally and place more emphasis on individual or local development in the process of urbanization, it is impossible to achieve the aim of people-oriented urbanization.
Urbanization or urban agglomeration is a cross-disciplinary issue, which needs to introduce and integrate the different new theories, methodologies, and methods. We have indicated what the new social theory, production of space, is and how it can be applied in urban agglomeration research. The brief framework we design could help approach and transform the difficult theory into research, and the integration of qualitative and quantitative analysis could be helpful to represent the developmental process and dynamics of urban agglomeration. According to the profound theory and clear framework of spatial production, urban agglomerations, especially in China, are reinterpreted. Because of the complexity of the theory and urban issues, we simplify them and carry out some indicators and policy analysis, aiming to call for more attention to be given to the interactions and tensions between space and society in the process of rapid urbanization in China, which are becoming more and more important and serious. Some problems, such as the detailed role of capital and power, and accuracy of indicators, are still unsolvable, which are worth studying further. Anyway, rethinking society and reordering urbanization will be two main missions in the future, not only for the researchers but also for practitioners.

Author Contributions

Conceptualization, C.Y.; Investigation, W.C. and Y.C.; Resources, W.C. and L.L.; Writing―Original Draft Preparation, C.Y., Z.L. and L.L.; Writing―Review & Editing, C.Y., R.C. and Z.L.

Funding

This work is supported jointly by Peak Discipline Construction Project of Education at East China Normal University, National Natural Science Foundation of China (Grant No. 41571138, 41871143, 41771171), and the National Key Research Program of China (2016YFC0502701).

Conflicts of Interest

The authors declare no conflict of interest.

References

  1. Geddes, P.S. Cities in evolution: An introduction to the town planning movement and to the study of civics. Soc. Theor. City 1915, 4, 236–237. [Google Scholar]
  2. Batten, D. Network cities: Creative urban agglomerations for the 21st century. Urban Stud. 1995, 32, 313–327. [Google Scholar] [CrossRef]
  3. Duranton, G.; Puga, D. Micro-foundations of urban agglomeration economies. Soc. Sci. Electron. Publ. 2004, 44, 2063–2117. [Google Scholar]
  4. Gottmann, J. Megalopolis or the Urbanization of the Northeastern Seaboard. Econ. Geogr. 1957, 33, 189–200. [Google Scholar] [CrossRef]
  5. Baigent, E.; Patrick, G.; Lewis, M.; Jean, G. Divisions over ‘Megalopolis’. Prog. Hum. Geogr. 2004, 28, 687–700. [Google Scholar] [CrossRef]
  6. Tomita, K. Geographical studies on structural changes in major metropolitan areas in Japan. Jpn. J. Hum. Geogr. 1988, 40, 40–63. [Google Scholar] [CrossRef]
  7. Scott, A.J. Global City-Regions: Trend, Theory, Policy; Oxford University Press: Oxford, UK, 2001. [Google Scholar]
  8. Hall, P.; Pain, K. The Polycentric Metropolis: Learning from Mega-City Regions in Europe; Earthscan: London, UK, 2006. [Google Scholar]
  9. Wu, F.L. China’s emergent city-region governance: A new form of state spatial selectivity through state-orchestrated rescaling. Int. J. Urban Reg. Res. 2017, 40, 1134–1151. [Google Scholar] [CrossRef]
  10. Li, Z.; Xu, J.; Yeh, A.G.O. State rescaling and the making of city-regions in the Pearl River Delta, China. Environ. Plan. C Govern. Policy 2014, 32, 129–143. [Google Scholar] [CrossRef]
  11. Li, Y.; Wu, F.L.; Hay, I. City-region integration policies and their incongruous outcomes: The case of Shantou-Chaozhou-Jieyang city-region in east Guangdong province, China. Habitat Int. 2015, 4, 214–222. [Google Scholar] [CrossRef]
  12. Zhang, J.; Wu, F.L. China’s changing economic governance: Administrative annexation and the reorganization of local governments in the Yangtze River Delta. Reg. Stud. 2006, 40, 3–21. [Google Scholar] [CrossRef]
  13. Luo, X.L.; Shen, J.F. A study on inter-city cooperation in the Yangtze River Delta region, China. Habitat Int. 2009, 33, 52–62. [Google Scholar] [CrossRef]
  14. Li, Y.; Wu, F.L. The emergence of centrally initiated regional plan in China: A case study of Yangtze River Delta regional plan. Habitat Int. 2013, 39, 137–147. [Google Scholar] [CrossRef]
  15. Chen, M.X.; Lu, D.D.; Zha, L.S. The comprehensive evaluation of China’s urbanization and effects on resources and environment. Jour. Geo. Sci. 2010, 20, 17–30. [Google Scholar] [CrossRef]
  16. Brenner, N. Globalization as reterritorialization: The re-scaling of urban governance in the European Union. Urban Stud. 1999, 36, 431–451. [Google Scholar] [CrossRef]
  17. Brenner, N. Urban governance and the production of new state spaces in Western Europe, 1960–2000. Rev. Int. Polit. Economy 2004, 13, 447–488. [Google Scholar] [CrossRef]
  18. Li, Y.; Wu, F.L. The transformation of regional governance in China: The rescaling of statehood. Prog. Plan. 2012, 78, 55–99. [Google Scholar] [CrossRef]
  19. Li, Y.; Wu, F.L. Towards new regionalism? Case study of changing regional governance in the Yangtze River Delta. Asia Pac. Viewpoint 2012, 53, 178–195. [Google Scholar] [CrossRef]
  20. Lin, Y. State-led metropolitan governance in China: Making integrated city regions. Cities 2014, 4, 200–208. [Google Scholar]
  21. Ye, C.; Chen, M.X.; Chen, R.S.; Guo, Z.W. Multi-scalar separations: Land use and production of space of Xianlin, a university town in Nanjing, China. Habitat Int. 2014, 4, 264–272. [Google Scholar] [CrossRef]
  22. Ye, C.; Chen, M.; Duan, J.; Yang, D.Y. Uneven development, urbanization and production of space in the middle-scale region based on the case of Jiangsu province, China. Habitat Int. 2017, 6, 106–116. [Google Scholar] [CrossRef]
  23. Cresswell, T. Geographic Thought: A Critical Introduction; Blackwell: Oxford, UK, 2013. [Google Scholar]
  24. Lefebvre, H. The Production of Space; Blackwell: Oxford, UK, 1991. [Google Scholar]
  25. Lefebvre, H. Writings on Cities; Blackwell: Oxford, UK, 1996. [Google Scholar]
  26. Harvey, D. Justice, Nature and the Geography of Difference; Blackwell: Oxford, UK, 1996. [Google Scholar]
  27. Harvey, D. Space of Hope; Edinburgh University Press: Edinburgh, UK, 2000. [Google Scholar]
  28. Soja, E. Postmodern Geographies: The Reassertion of Space in Critical Social Theory; Verso: London, UK, 1989. [Google Scholar]
  29. Harvey, D. The Urbanization of Capital; Blackwell: Oxford, UK, 1985. [Google Scholar]
  30. Harvey, D. Paris, Capital of Modernity; Routledge: New York, NY, USA, 2003. [Google Scholar]
  31. Harvey, D. Rebel Cities: From the Right to the City to the Urban Revolution; Verso: London, UK, 2012. [Google Scholar]
  32. Soja, E. Third Space: Journeys to Los Angeles and Other Real-And-Imagined Places; Blackwell: Oxford, UK, 1996. [Google Scholar]
  33. Lefebvre, H. The Urban Revolution; University of Minnesota Press: Minneapolis, MN, USA, 2003. [Google Scholar]
  34. Soja, E. The socio-spatial dialectic. Ann. Assoc. Am. Geogr. 1980, 70, 207–225. [Google Scholar] [CrossRef]
  35. Harvey, D. Social Justice and the City; Blackwell: Oxford, UK, 1973. [Google Scholar]
  36. Harvey, D. The Limits to Capital; Blackwell: Oxford, UK, 1982. [Google Scholar]
  37. Christophers, B. Revisiting the Urbanization of Capital. Ann. Assoc. Am. Geogr. 2011, 101, 1347–1364. [Google Scholar] [CrossRef]
  38. Yue, W.Z.; Chen, Y.; Zhang, Q.; Liu, Y. Spatial Explicit Assessment of Urban Vitality Using Multi-Source Data: A Case of Shanghai, China. Sustainability 2019, 11, 638. [Google Scholar] [CrossRef]
  39. Yang, D.Y.; Ye, C.; Wang, X.M.; Lu, D.B.; Xu, J.H.; Yang, H.Q. Global distribution and evolvement of urbanization and PM2.5 (1998–2015). Atmos. Environ. 2018, 182, 172–178. [Google Scholar] [CrossRef]
  40. Smith, N. Uneven Development: Nature, Capital, and the Production of Space; Blackwell: Oxford, UK, 1991. [Google Scholar]
  41. Ye, C.; Zhu, J.J.; Li, S.M.; Yang, S.; Chen, M.X. Assessment and analysis of regional economic collaborative development within an urban agglomeration: Yangtze River Delta as a case. Habitat Int. 2019, 83, 20–29. [Google Scholar] [CrossRef]
  42. National Bureau of Statistics of China. China City Statistical Yearbook; China Statistics Press: Beijing, China, 2016.
  43. Statistical Bureau of Jiangsu. Jiangsu Statistical Yearbook; China Statistics Press: Beijing, China, 2016.
  44. Statistical Bureau of Zhejiang. Zhejiang Statistical Yearbook; China Statistics Press: Beijing, China, 2016.
  45. Statistical Bureau of Anhui. Anhui Statistical Yearbook; China Statistics Press: Beijing, China, 2016.
  46. Statistical Bureau of Shanghai. Shanghai Statistical Yearbook; China Statistics Press: Beijing, China, 2016.
Figure 1. The framework of spatial production and urbanization.
Sustainability 11 01343 g001
Figure 2. YRDUA (a) and its location in China (b).
Sustainability 11 01343 g002
Figure 3. Built-up area, FAI and the evolution of urbanization rate of the YRDUA. Data source: [42,43,44,45,46].
Sustainability 11 01343 g003
Figure 4. The variation of REI in the YRDUA and the evolution of FDI. Data source: [42,43,44,45,46].
Sustainability 11 01343 g004
Figure 5. The evolvement of urban residents’ income in the YRD. Data source: [42,43,44,45,46].
Sustainability 11 01343 g005
Figure 6. The evolution of urbanization rate of the YRDUA. Data source: [42,43,44,45,46].
Sustainability 11 01343 g006
Figure 7. The evolution of URIR of the YRDUA. Data source: [42,43,44,45,46].
Sustainability 11 01343 g007
Figure 8. The evolution of FAI in the YRDUA. Data source: [42,43,44,45,46].
Sustainability 11 01343 g008
Figure 9. The evolution of FDI in the YRDUA. Data source: [42,43,44,45,46].
Sustainability 11 01343 g009
Figure 10. The evolution of the urban area of the YRD. Data source: [42,43,44,45,46].
Sustainability 11 01343 g010
Table 1. Main national policies and points in the evolution of the YRDUA (2001–2017).
YearDocumentsDepartmentOrientation and Key Points
2001The 10th 5-Year PlanCPCCC
  • Economic region
  • Economy-facilitated effects
2006The 11th 5-Year PlanCPCCC
  • Urban agglomeration
  • Exert the leading and radiation actions
  • Reinforce the overall competitive power
2010The 12th 5-Year PlanCPCCC
  • Promote economic integration
  • Perfect the layout
  • Plan scientifically
  • International competitiveness
2015The 13th 5-Year PlanCPCCC
  • World-class urban agglomeration
  • Global competitiveness
2008Further promoting reform and development in YRDState Council
  • International gateway to the Asia-Pacific Region
  • Global advanced manufacturing base
  • World-class urban agglomeration
  • International competitiveness
2014Promoting YREB’s development base on golden waterwayState Council
  • Promote integrated development
  • World-class urban agglomeration
  • International competitiveness
2017The outline of the national land plan (2016—2030)State Council
  • World-class urban agglomeration
  • International influence
Table 2. Main provincial policies and points in the evolution of the YRDUA (2001–2016).
YearDocumentsDepartmentOrientation and Key Points
2007National urban system plan (2005–2020)MOHURD
  • International competitiveness
  • Highland of international industry
  • Economic radiation actions
2009Jiangsu coastal area development plan (2009–2020)NDRC
  • Economic growth pole
  • Oriental Bridgehead
2010Regional planning of YRD (2010–2015)NDRC
  • International gateway to the Asia Pacific Region
  • International modern service industries
  • Advanced manufacturing center
  • World-class urban agglomeration
  • International competitiveness
  • Service-dominant industry
2015National new urbanization plan (2014–2020)NDRC
  • World-class urban agglomeration
  • New international competition edge
  • Higher-level international cooperation and competition
  • Economic support and leading role
2016Developmental planning of YRD (2015–2030)NDRC MOHURD
  • World-class urban agglomeration
  • World-class quality
Note: National Development and Reform Commission (NDRC); Ministry of Housing and Urban-Rural Development (MOHURD). Date Source: National urban system plan (2005-2020), Beijing: Commercial Publishing House, 2010; 2017.6.20 search by: http://www.js.gov.cn/jsgov/sx/shengxs/wuxis/201206/t2012061228458.html; http://www.ndrc.gov.cn/zcfb/zcfbghwb/201006/t20100622_585472.html; http://www.ndrc.gov.cn/gzdt/201404/t20140418_607923.html; http://www.ndrc.gov.cn/zcfb/zcfbghwb/201606/t20160603_806390.html.

