Article

Measuring Technical Efficiency and Returns to Scale in Taiwan’s Baking Industry―A Case Study of the 85 °C Company

1
Department of Management Sciences, Tamkang University, Taipei 25137, Taiwan
2
Executive Director of Gourmet Master Co., Ltd., Taichung 40850, Taiwan
3
Department of Business Administration, Tamkang University, Taipei 25137, Taiwan
4
Department of Accounting, Tamkang University, Taipei 25137, Taiwan
5
Department of Management Sciences, Tamkang University, Taipei 25137, Taiwan
*
Author to whom correspondence should be addressed.
Sustainability 2019, 11(5), 1268; https://doi.org/10.3390/su11051268
Submission received: 14 February 2019 / Revised: 23 February 2019 / Accepted: 24 February 2019 / Published: 27 February 2019

Abstract

:
Under an intense internationally competitive business environment, it is important to understand the production efficiency of the baking industry, where efficient management is becoming increasingly important to ensure the sustainable development of the company. Thus, this study uses data envelopment analysis (DEA) to appraise the performance of a well-known baking company (85 °C) and uses input and output constructs to measure its technical efficiency and scale efficiency scores to understand the major reasons for efficiency losses from 2011 to 2016. The empirical results indicate that low technical efficiency is the major reason for lower pure technical efficiency, since the scale efficiency is higher than pure technical efficiency. This means 85 °C is still improving overall operating efficiency and space efficiency. Moreover, the results also show that the III-generation operations style is more technically efficient and pure-technically efficient compared to those of I-generation and II-generation. Furthermore, the company’s financial performance is dependent upon the producer’s ability to stay on the production frontier due to the result of a positive relationship between return on assets (ROA) and technical efficiency. Last but not least, this study shows that 85 °C can gain higher performance and efficiency by enhancing technical efficiency and reinforcing strategic alignments with business goals.

1. Introduction

One of the most basic needs for human life is food, which makes the food sector more important than other economic sectors. The food industry is an important industry and reflects the key indicators of the national level of development and quality of life of the people. The Taiwan food industry makes significant contributions to the Taiwanese economy. According to the Ministry of Economic Affairs (MOEA) in Taiwan, the annual output value of Taiwan’s food industry was 602.2 billion NTD in 2017, accounting for 4.6% of the total manufacturing output value and for 135,000 employers in 2017 [1].
As a sector of the food industry, the baking industry comprises companies that produce bread, biscuits, cake, pastries, and other baking products. According to the research from Mordor Intelligence [2], it is expected that the baking products’ overall market size can reach USD 530 billion by 2023, so the market potential is substantial. As a result of the influence of Western culture and its level of convenience, since 2012, 25% of a household income in Taiwan has been spent on food and beverages [3]. In addition, according to BMO research, food and beverage consumption in 2017 was approximately 955.4 billion NTD, and per capita food and beverage consumption was about RMB 40,436 [4]. There are about 615 baking companies in Taiwan, and the overall annual output value reached 31.3 billion NTD in 2017, accounting for nearly 5.2% of the total food industry output value [1]. This industry plays a significant role in the Taiwanese market, wherein Gourmet Master (85 °C) dominates the baking sector.
As baking business plays an important role in the Taiwanese economy, its operational efficiency can significantly affect the profitability of Taiwanese companies and the welfare of consumers. Efficiency measurement is now important. Identifying vulnerabilities has become a key issue in various industries. This issue forces companies to learn to use their sources effectively, to assess their performance in competitive industries, and to identify companies they should use as a reference.
Despite extensive research on the tourism of Taiwan [5,6,7,8], we discovered that none of the research has examined the efficiency of the Taiwan baking industry. Hence, the aim of this study is to fill this gap. This study’s main objective is to appraise the performance appraisal of 85 °C, a well-known baking company listed on the Taiwan Stock Exchange (TSE), from 2011 to 2016 and then evaluate its technical and scale efficiency by adopting data envelopment analysis (DEA). Moreover, the study aimed to identify the determinants of the company’s technical efficiency.

2. Literature Review

Examining the literature, studies of the efficiency of the baking industry or firms are rare, while studies concerning the measurement of efficiency in the food manufacturing industry or firms are plentiful. In recent decades, there have been many studies using DEA and related approaches to measure the efficiency and productivity of the food manufacturing industry in different contexts.
Some scholars have investigated and studied the productivity of the food manufacturing industry in China (e.g., [9,10,11]). The growth of technical efficiency in the food manufacturing industry is slow, and technological progress has become a major factor driving the growth of TFP (total factor productivity), while the growth of technical efficiency mainly depends on scale efficiency. Qiang and Fang [12] used the DEA-based Malmquist index to measure changes in productivity in the food manufacturing industry in China during 2010–2014. This was related to a decline in efficiency change. The deterioration of pure efficiency changes was the main reason for the decrease in TFP.
In the context of Greek food manufacturing enterprises, the DEA approach has been used by Dimara, Skuras, Tsekouras, and Tzelepis [13] to calculate technical and efficiency scores of Greek food companies and observed that both technical and scale efficiency have important effects on the lifespan of food companies. Giokas, Eriotis, and Dokas [14] used DEA to examine, from 2006 to 2012, the liquidity and sales efficiency of the food and beverage companies listed in the Athens Exchange. An empirical study revealed that pure technical inefficiencies, rather than scale inefficiencies, primarily cause overall technical inefficiencies. Rezitis and Kalantz [15] used the DEA model and bootstrapped truncated regressions and OLS regressions to evaluate technical efficiency and its determinants in the Greek food and beverages manufacturing industry during 1984–2007. It was found that the technical efficiency of the whole food and beverage industry tended to decrease during 1984–2007.
Some studies have analyzed the Indian food manufacturing industry. Kumar and Basu [16] used the Malmquist efficiency index to determine the efficiency of Indian food businesses and proved that the technological insufficiency of firms has effects on their efficiency. Ali, Singh, and Ekanem [17] explored DEA efficiency and productivity changes in the Indian food industry for the period between pre- and post-liberalization and identified causes of inefficiency across various sectors. Kaur and Kaur [18] evaluated the performance of various companies in the food processing industry and efficiency changes between 1988 and 2011 in India. During the whole study period, the average technical efficiency scores for the food processing industry as a whole experienced declining trends. Mathur and Raju Ramnath [19] applied DEA and Stochastic Frontier Analysis (SFA) to measure the efficiency of food-grain production in India. They found high average efficiency in farming operations using both frontier methods. However, the range of efficiency obtained with these methods varies considerably.
Gregg and Rolfe [20] analyzed the broad-acre beef production firms in Australia and found a strong growth in productivity due to the improvements in technological progress and in technical and scale efficiency. Setiawan and Oude Lansink [21] used a dynamic performance measure (dynamic technical inefficiency) to evaluate the relationship between industrial concentration and technical inefficiency in the Indonesian food and beverage industry. The results revealed that there is a high dynamic technical inefficiency in the Indonesian food and beverage industry. Holyk [22] investigated the Finnish food manufacturing industry and determined the sectors with the lowest level of technical and scale efficiency. The findings of a US dairy product industry survey showed that productivity growth was negative, and both scale and technical changes had a negative impact [23]. In 2011, the efficiency of 23 food and beverage companies in Thailand was evaluated by Rodmanee and Huang [24] by adopting a relational two-stage DEA model. It was shown that a low overall efficiency score of companies is caused by a low efficiency score in the profit generation process.
Some articles have investigated the Spanish food manufacturing industry’s dynamic productivity growth, including such contexts as the meat processing industry [25], meat processing and the oil and fat industries [26], and meat and dairy processing and the oil and fat industries [27]; all of this research shows that average productivity is not only very close to zero, but its components also have a negative technical change, a positive technical inefficiency change, and a positive scale inefficiency change [28]. Kapelko [28] analyzed the dynamic productivity growth of European food companies. He found that the overall trend of dynamic technical regress and positive dynamic technical inefficiency change across almost all regions and sectors. In addition, in the Spanish dairy processing industry, Kapelko et al. [29] obtained the same results regarding the static productivity growth.
Based on this review, most of the research has been devoted to food manufacturing in different countries or regions, but studies rarely focus on efficiency modeling of the baking industry. Many products of the baking industry are considered necessities, so it is important for the public to know its production efficiency.

3. Materials and Methods

3.1. Study Enterprise: 85 °C

85 °C is one of the leading brands in the coffee–baking compound chain industry in Greater China. The main products are beverages, freshly baked bread, and pastry, offering products and a variety of consumer choices. Since its inception, 85 °C has adopted a marketing strategy based on “five-star products, affordable prices.” Since opening its first store in Yonghe City, Taipei County, Taiwan, in 2004, 85 °C has rapidly expanded to Taiwan with a two-pronged exhibition model of direct sales and franchise, successfully establishing a brand image of affordable luxury restaurants. As of 2013, Taiwan had more than 300 exhibition shops known as “Gourmet Master Co., Ltd.” In 2006, 85 °C opened its first overseas store in Sydney, Australia, opened another store in Mainland China at the end of 2007, and opened another in Irvine, California, USA, in September 2008. They then accelerated the speed of store openings in recent years. It has entered Northern California, San Diego, and Texas and has continued to expand activity. It entered the Washington State market and opened a store in the Greater Seattle area. In addition, 85 °C strengthened its group holding and equity restructuring at the end of 2008 and then established a holding company in the Cayman region. It was listed on the Taiwan Stock Exchange Market in November 2010.
Until 2017, a total number of 1074 85 °C chain stores had been established around the world, spanning Taiwan (430 stores-31 self-owned stores+ 399 franchise stores), China (580), the United States (40), Australia (15), and Hong Kong (9). 2017 Taiwan’s regional pre-tax net profit accounted for 24.3% of the company’s profit (85 °C internal information).
The course of the 85 °C company’s development, after their stock listing in November 2010, can be divided into three periods:
I. 2011 Q1–2013 Q3 (I-generation): The development mature period.
After the successful listing, a large number of funds were obtained. 85 °C expanded more rapidly, and the number of stores increased so that the distance of competitors could be increased, the market share could be increased, and industry leadership could be ensured.
II. 2013 Q4~2015 Q2 (II-generation): The business model transformation period.
85 °C, with abundant funds, opened 300 direct stores in Mainland China in one fell swoop. However, due to the soaring real estate prices in Mainland China, rising rents, rising basic wages leading to rising personnel costs, and the constant emergence of food safety across the Taiwan Strait, the profitability of 85 °C eroded. Likewise, the company also faced a decline in both new store development and per store sales. Like all entrepreneurs after growth, management also entered a plateau of growth—“[you can] immediately fight the world, but [you] cannot rule the world immediately.” After a period of deliberation, the chairman Wu Cheng-Xue decided to hire Mr. Xie Jiannan, who had just retired from the unified super-business, to be the general manager. The general manager of Xie Jiannan was responsible for 85 °C and carried out the business model transformation.
During the two years of business model transformation of 85 °C, there were two major key transformations: the franchise model and the store style.
1. Franchise model.
The original voluntary chain (VC) and regular chain (RC) attributes were converted to the franchise chain (FC1) and contract management (FC2) modes. FC1 is the concept of joining the headquarters and joining the main partnership. The 85 °C company invested in equipment (such as coffee machines and cake cabinets) and signs. FC2 (contract management) is a special case in the sense that the company invests in the principle of the business. Compared with FC1, the profit distribution is also lower because the main investment projects are less.
2. Store style.
In I-generation stores, 85 °C was a place where food was ordered to go, so as to increase the “cup-turning rate” of the store, so most stores did not provide or have many indoor seats. Many stores had a few tables and chairs under the arcade, which triggered protests from passersby. Since the beginning of 2013, 85 °C has been developing II-generation stores in line with Starbucks’ continuing growth and expansion. The difference between the II-generation store and the I-generation store is mainly the store style, from the efficiency of delivery outside the store to a coffee shop, with the exception of coffee, cake, and bread. Additional simple meals were added to meet consumer demand and increase customer unit prices.
Although the II-generation store had a brand-new decoration and a large number of seats, the product was novel and the product price was increased, but the following problems also arose:
(1)
The signboard was the same, but the product and price were not, causing confusion among consumers.
(2)
Consumers were willing to accept the newer decor and comfortable seating area, but not at a higher price.
(3)
Consumers stayed longer at the store, but the number of customers dropped significantly. The original take-away model disappeared greatly because the internal consumption model in addition to the increase in product unit price not only caused consumers more burden but also caused inconvenience to consumers.
(4)
The baking pattern was drastically changed: The cake production mode was changed from frozen to refrigerated, significantly increasing freshness and taste, but at the same time causing high loss. Afterwards, 85 °C reduced the display of items in order to avoid depletion, negatively affecting purchases and thus creating a dilemma.
The cost of the process of transforming the business model was too high, as it resulted in only 4.07 and 3.74 NT dollars per share after-tax net profit of 85 °C for two consecutive years. It was the worst performance since the 85 °C listing.
III. 2015 Q3–present (III-generation): The reconstruction period.
After the great recession of the corporate net profit, 85 °C reexamined the cost structure and overall situation of the II-generation stores in Taiwan and made the following adjustments.
  • Since consumers liked the new decor but did not like the new price, they changed the new decor and sold old products and at the original price in order to retain old consumers and attract new consumers.
  • Due to poor operation in the metropolitan market, 85 °C decided to focus on the township market, opening up large township stores and entering other small- and medium-sized towns. Low rents were characteristic of these new stores.
  • The old products had a high preserving life, operation was convenient, attrition rate was low, and consumers were habitually willing to purchase. Therefore, product items and prices were restored, so that consumers could become more selective.
  • In 2014, 85 °C had 51 direct-owned stores in Taiwan, compared with 39 in 2013 and 37 in 2012. There had been a significant increase in new stores, and it is also true that the II-generation stores incurred substantial losses, resulting in more than 5 million NTD losses in a single month in September 2014 alone. After adjusting the price model of the II-generation store, the number of customers and the turnover could not be increased. It was better to close such stores to reduce losses while focusing on the more promising stores.
After quickly adjusting the model, II-generation stores had transformed into new ones. Consumers enjoyed the new decor. Annual net sales were 22.046 billion NTD, with an increase of 1.589 billion NTD, or 7.8%, over the 20.457 billion NTD in 2015, which was a new record. The annual profit in 2016 was 1.741 billion NTD, up 52.85%. In 2016, the profit was 1.741 billion NTD, a profit of 0.6 billion from the profit of 1.139 billion NTD in 2015, with a growth rate of 52.85%. Among them, the net profit of Taiwan increased sharply from 0.391 billion NTD in 2015 to 0.736 billion NTD, a growth rate of 89%.

3.2. The DEA Model

DEA, which was developed by Charnes et al. [30] (CCR model) and extended by Banker et al. [31] (BCC model), is a non-parametric programming method that can be used to estimate the production frontier and to evaluate the relative efficiency of decision-making units (DMUs) with multiple inputs and multiple outputs [32].
There are two terms that can be divided from the CCR and BCC models: the input-oriented model and the output-oriented model. The output orientation maximizes the level of output for a given level of inputs whereas the input orientation seeks to minimize the usage of inputs given a fixed level of output. The model of CCR assumes constant returns to scale (CRS), which means a one-unit input can be a fixed value of output. The model of BCC assumes variable returns to scale (VRS). In this study, the output-oriented model is chosen and a dual problem model is used to solve the problems. The CCR dual model is as follows:
Min θ , λ θ
s . t . θ y j + Y λ 0
x i X λ 0
λ 0
where θ is a scalar, and λ is an N × 1 vector of constants.
The CCR dual model is known as the BCC model if the constraint below is adjoined.
i = 1 s λ i = 1 .
Equation (2) frees the CRS and makes the BCC model a VRS. For the measurement of efficiency, the CCR model measures the technical efficiency (TE) of a DMU and the BCC model can measure both the pure technical efficiency (PTE) and scale efficiency (SE) of the DMU. The relationships between TE, PTE, and SE are shown in Equation (3) below.
SE = TE/PTE.

3.3. Data

Many fields, such as the manufacturing sector, pharmaceutical companies, banks, hospitals, transportation and education, have applied the DEA technique as a performance measurement tool. In this paper, we employed 3 inputs and 3 outputs: the outputs are the total revenue of bread (y1), the total revenue of beverage (y2), and the total revenue of pastry (y3), whereas the inputs are the total staff salaries (x1), the total dispatch employee salaries (x2), and other expenses (x3). Table 1 below shows the inputs’ and outputs’ descriptive statistics.
The self-owned stores information contained herein were obtained from the 85 °C database. Of all of the self-owned stores in the initial sample taken, only the self-owned stores without complete information were eliminated. The sample includes self-owned 85 °C stores in all Taiwanese regions over the years 2011 to 2016 that were offering similar services to customers and using similar inputs.

3.4. Input–Output

When applying DEA to measuring efficiency, inputs and outputs need to be appropriately selected so as to effectively evaluate the efficiency of the baking company. This study’s data consisted of several input/output variables related to the operational characteristics of the baking (coffee) chain stores operations according to the Taiwan Stock Exchange and the 85 °C company. Three outputs and three inputs in the performance model are included in the study. The definitions of these variables are as follows.
Output variables:
  • Total revenue of bread (y1), measured in units of thousand New Taiwan dollars (NT$).
  • Total revenue of beverage (y2), measured in units of thousand New Taiwan dollars (NT$).
  • Total revenue of pastry (y3), including incomes other than the two items mentioned above. They include cake sales, souvenir sales, snacking sales, and others, measured in units of thousand NT$.
Input variables:
  • Total staff salaries (x1), including full-time employee salaries, pensions, labor premiums, healthcare expenses, and year-end bonuses, measured in units of New Taiwan dollars (NT$).
  • Total dispatch employee salaries (x2), including part-time employee salaries, pensions, meals, labor premiums, healthcare expenses, and year-end bonuses, measured in units of New Taiwan dollars (NT$).
  • Other expenses (x3), including rent expenses and others, measured in units of NT$.

3.5. Descriptive Statistics

The statistics for all variables in the model are given in Table 1. The average value of total revenue of bread (y1) is about NT$11.1 million, total beverage revenue about NT$8.5 million, and total pastry revenue (y3) about NT$6.5 million during the six-year period of 2011–2016. Overall, the company’s main products are divided as follows: 42.42% bread, 32.55% beverages, and 25.03% pastry; the main expenses are as follows 43.06% staff salaries, 24.8% dispatch employee salaries, and 32.14% other expenses in the period 2011–2016. In addition, in terms of operational type and in terms of average overall revenue, the largest in III-generation, the smallest in II-generation, and the largest in II-generation in terms of cost proportionally are provided. The empirical data show that the average revenue of bread was higher than those of beverages and pastries during 2011–2016. The large-sized standard deviations of outputs may be caused by the significantly different sizes of self-owned stores.
The correlation matrix of inputs (xi) and outputs (yi) are shown in Table 2. It can be seen that all correlation coefficients between input and output are significant positive correlations with 5% significance, not violating the isotonic property in this study [33]. This demonstrates that these variables are appropriate for DEA modeling.

4. Empirical Results

4.1. Efficiency Results

We estimate DEA technical efficiency scores by using output-orientation with the assumption that aims to maximize outputs given the inputs and using the DEA-solver software package to carry out the relevant efficiency computations. The technical, pure technical, and scale efficiency scores for each store are shown in Table 3. Table 3 presents the results of average mean technical efficiency, pure technical efficiency, and scale efficiency scores of the 85 °C self-owned stores in Taiwan during the period of the first quarter of the year 2011 to the fourth quarter of the year 2016. The results suggest that the stores exhibited an average technical efficiency score of 87.9%, 91.0%, 90.1%, 84.0%, and 86.2% in 2011, 2012, 2013, 2014, and 2015, respectively, before reaching the highest technical efficiency score of 93.7% in 2016. During the six-year study period, the mean technical efficiency score for all stores in the sample was 88.8%, which suggested a minimal input waste of 11.2%. Table 3 also shows that the stores’ efficiency level progressively improved during the period under study, particularly after the operation styles changed periods of the third quarter of 2015.
Similarly, during the six-year study period, the mean pure technical efficiency score for all stores in the sample was 92.9%. In addition, the mean scale efficiency score of the stores in the sample was 95.5%.
It can be seen that the average value of overall technical efficiency was 0.888, and the average pure technical efficiency and average scale efficiency were 0.929 and 0.955, respectively. Hence, 85 °C still has room to improve operational efficiency. The higher scale efficiency compared with the pure technical efficiency indicates that low technical efficiency is the main reason for a lower pure technical efficiency.
On the one hand, Figure 1 shows the trends in the mean constant returns to scale, the variable returns to scale, and the scale efficiency score of 85 °C in our sample over the six-year study period. Generally, over the six-year study period, the lowest mean constant returns to scale occurred in the first quarter of 2015, the lowest mean variable returns to scale occurred in the fourth quarter of 2014, and the lowest mean scale efficiency score occurred in the first quarter of 2015. In addition, Figure 1 also shows that the 85 °C company’s efficiency level progressively improved during the period under study, particularly after the III-generation operations style period of 2015 Q3.

4.2. Efficiency of Different Operation Styles

Table 4 shows the results by considering the average technical efficiency, pure technical efficiency, and scale efficiency scores of the different operation management structures. The mean efficiency levels for the three operation styles of 85 °C self-owned stores over the six-year study period and the results of the Kruskal–Wallis test are shown in Table 4. In general, in average, the III-generation operations style (during the period 2015 Q3–2016 Q4) recorded higher efficiency scores than I-generation (during the period 2011 Q1–2013 Q3) and II-generation (during the period 2013 Q4–2015 Q2). It is also clear that in Table 4 that the III-generation operations style, compared with I-generation and II-generation, is more technically efficient (TE = 0.932) and pure-technically efficient (PTE = 0.955).
In addition, by employing a non-parametric Kruskal–Wallis test (see Table 4), we may say that there is, at a significance level of 5%, a difference between efficiency levels (TE, PTE, and SE) for the three operation styles of 85 °C self-owned stores. Furthermore, after performing the Dunn post-hoc test, it appears that the II-generation operations style has the worst mean efficiency score of constant returns to scale, variable returns to scale, and scale efficiency scores over this six-year study period.
The summary results of the CCR-DEA model are presented in Table 5. It shows that inefficiency under a CRS assumption is about 62.5% in 2011, 55.6% in 2012, 57.6% in 2013, 51.4% in 2014, 51.6% in 2015, and 43.5% in 2016, which means that it is required for a reduction in input. The proportion of the decrease in the 2016 input is relatively low, which indicates that the operational strategy of III-generation is successful. Nevertheless, the returns to scale analysis shows that almost the same number of self-own stores exhibits constant returns to scale. Decreasing returns to scale (DRS) show a decreasing count in the six-year period, which means the scale of operation of each store is approaching its optimal point.
Table 6 represents the number of self-owned stores in different categories of returns to scale estimated under the operating approach (Panel A) over the analyzed period and displays the returns to scale of stores classified by operations style (Panel B). As the data in this table indicates, the majority of self-owned stores (56.9%) are not in optimal operating scale (IRS or DRS); 33.9% (= 19.3/(19.3 + 37.6)) of them are experiencing IRS and the rest are operating at DRS. It is worth noting that the number of DRS stores has dropped significantly after the second quarter of 2015.

4.3. Further Analysis

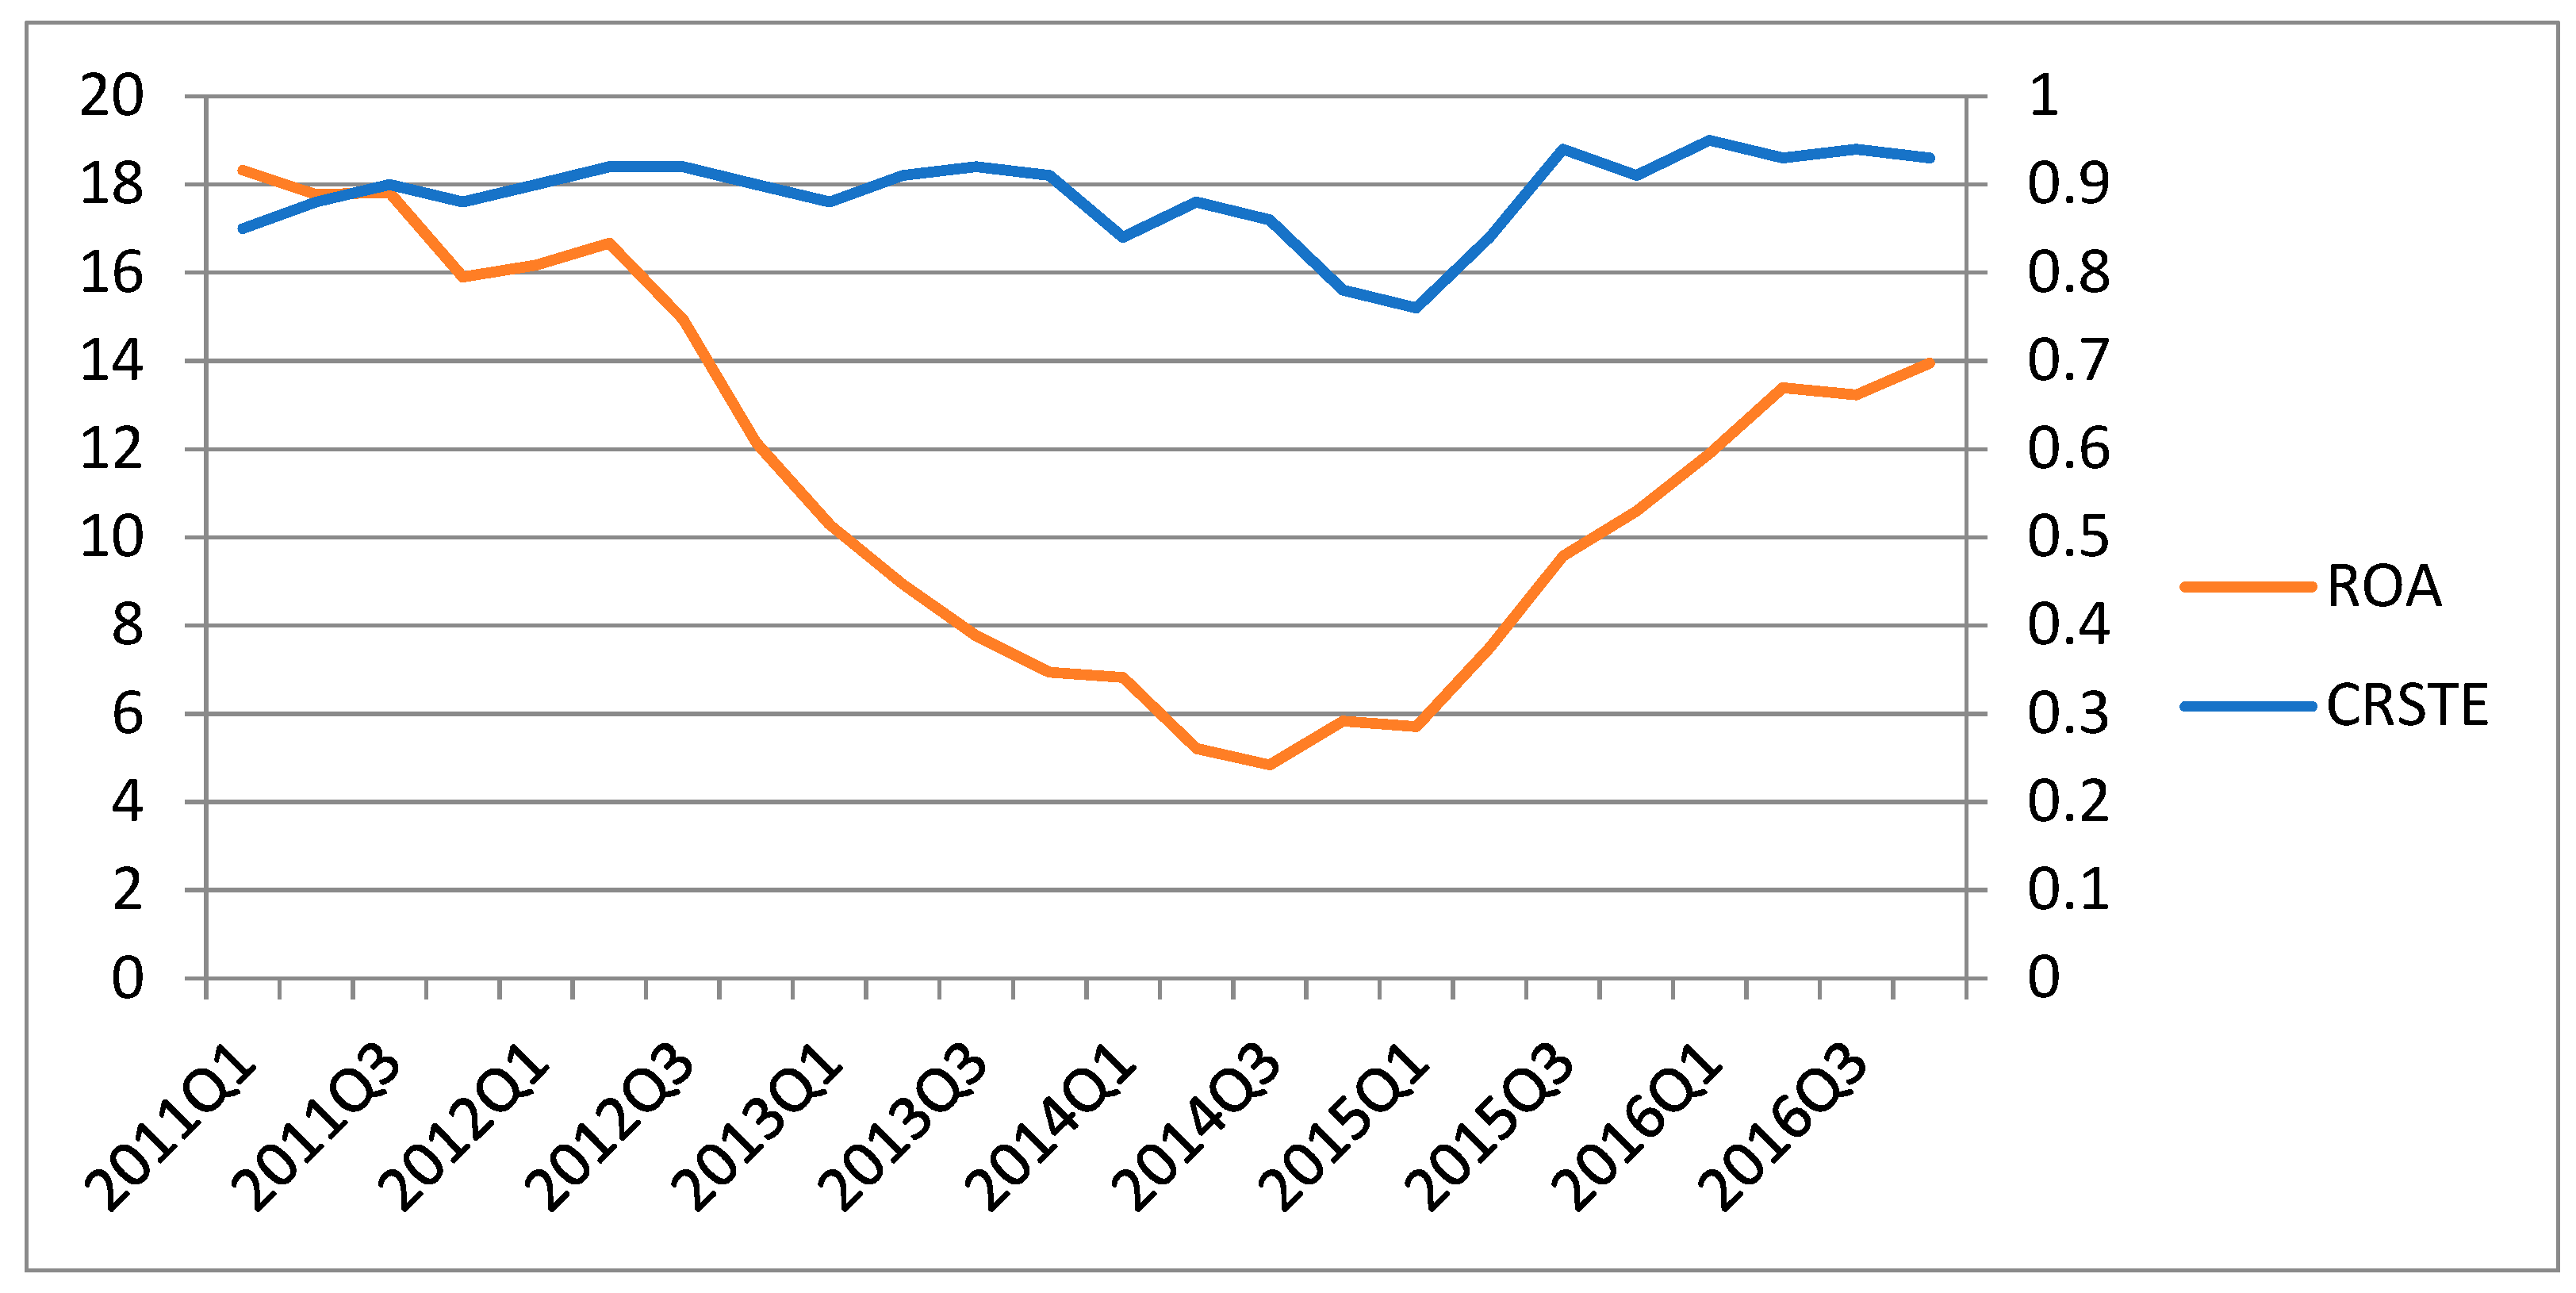
  • Return on assets (ROA) is a widely used measure for profitability and is frequently used as a measure for corporate performance [34]. ROA represents the short-term financial performance of a firm by measuring how a firm efficiently creates profits by using its assets during a fiscal year. It reflects the ability of the company’s management to produce profit from the company’s assets [35].
  • Figure 2 below shows the trend of ROA and technical efficiency over the study period. The figure illustrates that ROA decreased from 2011 Q1 to 2014 Q3 and subsequently increased from 2014 Q4 to 2016 Q4. It also shows that, after 2013 Q4, there was a clear downward trend in technical efficiency, although there was a recent recovery in technical efficiency from 2015 Q2 onwards.
In addition, ROA shows a significance positive correlation (r = 0.423, p < 0.05) with technical efficiency in Table 7. This finding indicates that the company’s financial performance is dependent upon a producer’s ability to stay on the production frontier.

5. Conclusions, Limitations, and Future Research

This study used DEA to measure the technical efficiency, pure technical efficiency, and scale efficiency scores of 85 °C from 2011 to 2016. The empirical results reveal that the average value of overall technical efficiency is 0.888, and the average pure technical efficiency and average scale efficiency are 0.929 and 0.955, respectively. This implies that 85 °C still has room to improve its overall operational efficiency. In additional, over the 2011–2016 period, the lowest mean constant returns to scale occurred in the first quarter of 2015, the lowest mean variable returns to scale occurred in the fourth quarter of 2014, and the lowest mean scale efficiency score occurred in the first quarter of 2015. Moreover, the results show that the 85 °C company’s efficiency level has progressively improved during the period under study, particularly after the III-generation operations style period of 2015 Q3. Furthermore, after performing the Kruskal–Wallis test and the Dunn post-hoc test, it appears that the III-generation operations style, compared with I-generation and II-generation, is more technically efficient and more pure-technically efficient. The findings give that the timely change of operational strategy has a major impact on improving operational efficiency. In addition, it was found that ROA was positively related to technical efficiency. This implies that the 85 °C company’s financial performance is dependent upon a producer’s ability to stay on the production frontier. Finally, we are pleased to verify that the current operating strategy is correct, and the timely change from II-generation operations to III-generation operations allowed the company’s financial performance to grow steadily and will greatly ensure the company’s future operation.
This paper introduces a practical framework to support academics and practitioners. Academically, the contribution of this study is to provide the first application of using the DEA technique to analyze efficiency in the baking industry; case studies applying DEA to measure efficiency in the baking industry had not been found. Thus, this study provides a pioneer reference for similar studies in the future. From a practical implications point of view, the results of this study can enable the management level of baking companies to understand the operation of self-owned stores and how to change their business model in a timely and strategic manner when the business is in a downturn or being mismanaged. Before and after the change, in addition to the financial indicators, indicators of operational efficiency can be considered as well.
This study has several limitations. Firstly, this paper is mainly based on case studies. Generalization of the results is limited. In the future, if sufficient company data can be obtained, empirical results that can be generalized can be obtained, for example by taking a large sample survey method or by a market basis demonstration method. In addition, since the DEA method adopted in this paper does not take into account the uncertainty factors of the DMU operating environment when calculating the operating efficiency scores of each DMU, researchers can attempt to use other analytical methods that capture the environmental uncertainty (for example, stochastic frontier analysis) and the sensitivity to outliers (if there are any).

Author Contributions

C.-W.C. and K.-S.W. designed the study and wrote the article. C.-W.C., K.-S.W., and B.-G.C. analyzed the data. C.-W.C. and K.-R.L. collected and processed the data. All authors have read and approved the final manuscript.

Funding

There has been no external funding the research.

Conflicts of Interest

The authors declare no conflicts of interest.

References

  1. ITIS Project of the Ministry of Economic Affairs. Food Industry. 2018. Available online: http://www.itis.org.tw/ (accessed on 30 September 2018).
  2. Mordor Intelligence Online. Bakery Products Market Analysis, Size—Segmented by Product Type (Cake, Biscuits, Bread, Pastries, Morning Goods), by Distribution Channel (Specialist Retailers, Retail Channel, Foodservice)—Growth, Trends and Forecasts (2018–2023). Available online: https://www.mordorintelligence.com/industry-reports/bakery-products-market (accessed on 12 October 2018).
  3. Directorate-General of Budget, Accounting and Statistics. 2018. Available online: https://www.dgbas.gov.tw/ct.asp?xItem=33338&ctNode=3099&mp=1 (accessed on 5 October 2018).
  4. Business Monitor Online (BMO). Available online: https://bmo.bmiresearch.com/search/results?all_words_kw=taiwan&kw=1 (accessed on 4 July 2018).
  5. Huang, S.W.; Kuo, H.F.; Hsieh, H.I.; Chen, T.H. Environmental efficiency evaluation of coastal tourism development in Taiwan. Int. J. Environ. Sci. Dev. 2016, 7, 145–150. [Google Scholar] [CrossRef]
  6. Su, C.S. An importance-performance analysis of dining attributes: A comparison of individual and packaged tourists in Taiwan. Asia Pac. J. Tour. Res. 2013, 18, 573–597. [Google Scholar] [CrossRef]
  7. Yin, P.; Tsai, H.; Wu, J. A hotel life cycle model based on bootstrap DEA efficiency: The case of international tourist hotels in Taipei. Int. J. Contemp. Hosp. Manag. 2015, 27, 918–937. [Google Scholar] [CrossRef]
  8. Chen, H.S.; Tsai, B.K.; Liou, G.B.; Hsieh, C.M. Efficiency assessment of inbound tourist service using data envelopment analysis. Sustainability 2018, 10, 1866. [Google Scholar] [CrossRef]
  9. Yang, X.L.; Zhang, Y.J.; Wang, L. An Empirical analysis of total factor productivity of the food processing industry in Jilin Province. J. Agrotech. Econ. 2012, 12, 61–67. [Google Scholar]
  10. Zhang, Z. Analysis of regional differences in the growth of TFP of China’s food industry. Spec. Zone Econ. 2014, 8, 102–104. [Google Scholar]
  11. Zhang, Z.; Wang, K. Scale competitiveness of food enterprises and TFP growth. Sci. Technol. Ind. 2014, 14, 83–88. [Google Scholar]
  12. Qiang, F.U.; Fang, J.I. Total factor productivity of food manufacturing industry in China: A DEA-Malmquist index measurement. Revista Facultad Ingeniería U.C.V. 2017, 32, 1–8. [Google Scholar]
  13. Dimara, E.; Skuras, D.; Tsekouras, K.; Tzelepis, D. Productive efficiency and firm exit in the food sector. Food Policy 2008, 33, 185–196. [Google Scholar] [CrossRef]
  14. Giokas, D.; Eriotis, N.; Dokas, I. Efficiency and productivity of the food and beverage listed firms in the pre-recession and recessionary periods in Greece. Appl. Econ. 2015, 47, 1927–1941. [Google Scholar] [CrossRef]
  15. Rezitis, A.N.; Kalantz, M.A. Investigating technical efficiency and its determinants by data envelopment analysis: An application in the Greek food and beverages manufacturing industry. Agribusiness 2016, 32, 254–271. [Google Scholar] [CrossRef]
  16. Kumar, M.; Basu, P. Perspectives of productivity growth in Indian food industry: A data envelopment analysis. Int. J. Product. Perform. Manag. 2008, 57, 503–522. [Google Scholar] [CrossRef]
  17. Ali, J.; Singh, S.P.; Ekanem, E. Efficiency and productivity changes in the Indian food processing industry: Determinants and policy implications. Int. Food Agribus. Manag. 2009, 12, 43–66. [Google Scholar]
  18. Kaur, N.; Kaur, K. Efficiency, productivity and profitability changes in the Indian food processing industry: A firm level analysis. Pac. Bus. Rev. Int. 2016, 1, 264–272. [Google Scholar]
  19. Mathur, R.; RAJU RAMNATH, S. Efficiency in food grains production in India using DEA and SFA. Cent. Eur. Rev. Econ. Manag. 2018, 2, 79–101. [Google Scholar] [CrossRef]
  20. Gregg, D.; Rolfe, J. Identifying sources and trends for productivity growth in a sample of Queensland broad-acre beef enterprises. Anim. Prod. Sci. 2011, 51, 443–453. [Google Scholar] [CrossRef]
  21. Setiawan, M.; Oude Lansink, A.G.J.M. Dynamic technical inefficiency and industrial concentration in the Indonesian food and beverages industry. Brit. Food J. 2018, 120, 108–119. [Google Scholar] [CrossRef]
  22. Holyk, S. Measuring technical efficiency and returns to scale in Finnish food processing industry. Int. J. Sci. Basic Appl. Res. 2016, 27, 226–238. [Google Scholar]
  23. Geylani, P.C.; Stefanou, S.E. Productivity growth patterns in U.S. dairy products manufacturing. Appl. Econ. 2011, 43, 3415–3432. [Google Scholar] [CrossRef]
  24. Rodmanee, S.; Huang, W. Efficiency evaluation of food and beverage companies in Thailand: An application of relational two-stage data envelopment analysis. Int. J. Soc. Sci. Humanit. 2013, 3, 202–205. [Google Scholar] [CrossRef]
  25. Kapelko, M.; Oude Lansink, A.; Stefanou, S.E. Analyzing the impact of investment spikes on dynamic productivity growth. Omega 2015, 54, 116–124. [Google Scholar] [CrossRef]
  26. Kapelko, M.; Oude Lansink, A.; Stefanou, S.E. Investment age and dynamic productivity growth in the Spanish food processing industry. Am. J. Agric. Econ. 2016, 98, 946–961. [Google Scholar] [CrossRef]
  27. Kapelko, M.; Oude Lansink, A.; Stefanou, S.E. The impact of 2008 financial crisis on dynamic productivity growth of the Spanish food manufacturing industry. Agric. Econ. 2017, 48, 561–571. [Google Scholar] [CrossRef]
  28. Kapelko, M. Measuring Productivity Change Accounting for Adjustment Costs: Evidence from the Food Industry in the European Union. 2018. Available online: https://link.springer.com/content/pdf/10.1007%2Fs10479-017-2497-0.pdf (accessed on 10 October 2018).
  29. Kapelko, M.; Oude Lansink, A.; Stefanou, S.E. Assessing the impact of changing economic environment on productivity growth: The case of the Spanish dairy processing industry. J. Food Prod. Mark. 2017, 23, 384–397. [Google Scholar] [CrossRef]
  30. Charnes, A.; Cooper, W.W.; Rhodes, E. Measuring the efficiency of decision making units. Eur. J. Oper. Res. 1978, 2, 429–444. [Google Scholar] [CrossRef]
  31. Banker, R.D.; Charnes, R.F.; Cooper, W.W. Some models for estimating technical and scale inefficiencies in data envelopment analysis. Manag. Sci. 1984, 30, 1078–1092. [Google Scholar] [CrossRef]
  32. Lin, W.B.; Chen, M.J.; Chen, I.C.; Lee, M.S. Applications of Multiple Criteria Decision Making to Sport Industry in Taiwan. 2007. Available online: http://www.shl.tpcu.edu.tw/ezfiles/24/1024/img/326/TSINT_J0109.pdf (accessed on 25 July 2018).
  33. Hu, J.L.; Shieh, H.S.; Huang, C.H.; Chiu, C.N. Cost efficiency of international tourist hotels in Taiwan: A data envelopment analysis application. Asia Pac. J. Tour. Res. 2009, 371–384. [Google Scholar] [CrossRef]
  34. Gonzalez-Hermosillo, B.; Pazarbasioglu, C.; Billings, R. Determinants of banking system fragility: A case study of Mexico. Int. Fund Staff Papers 1997, 44, 295–314. [Google Scholar] [CrossRef]
  35. Athanasoglou, P.P.; Brissimis, S.N.; Delis, M.D. Bank-specific, industry specific and macroeconomic determinants of bank profitability. J. Int. Financ. Mark. I. 2008, 18, 121–136. [Google Scholar] [CrossRef]
Figure 1. Trends in mean efficiency scores. Note: CRSTE: constant returns to scale technical efficiency; VRSTE: variable returns to scale technical efficiency; SCALE: scale efficiency.
Sustainability 11 01268 g001
Figure 2. Relationship between return on assets (ROA) and technical efficiency between 2011 and 2016.
Sustainability 11 01268 g002
Table 1. Summary statistics of all variables in the data envelopment analysis (DEA) model (New Taiwan dollars, NT$).
Operations StyleVariablesMaximumMinimumMeanS.D.
IOutput variables—revenue
Bread (y1)9,806,53202,829,384.7352,201,254.160
Beverage (y2)3,365,94101,899,884.379736,262.707
Pastry (y3)3,176,99696,1161,580,692.555643,703.704
Input variables—expense
Staff salaries (x1)2,012,65327,498871,838.460393,104.394
Dispatch worker salaries (x2)1,157,09738,689510,256.900212,175.683
Other (x3)2,112,191107,800622,851.179297,344.485
IIOutput variables—revenue
Bread (y1)8,618,33302,226,680.3392,026,621.835
Beverage (y2)4,007,73701,964,168.175905,142.190
Pastry (y3)3,389,18211,4471,483,051.802643,151.385
Input variables—expense
Staff salaries (x1)1,139,9290429,153.530236,176.381
Dispatch worker salaries (x2)1,579,306236,080648,520.262287,154.476
Other (x3)8,618,33302,226,680.3392,026,621.835
IIIOutput variables—revenue
Bread (y1)8,2362,55002,681,863.9282,029,316.981
Beverage (y2)47,649,690101,3502,584,906.344953,350.434
Pastry (y3)51,179,8702,792,4701,762,731.636739,134.595
Input variables—expense
Staff salaries (x1)14,011,5700516,816.980274,308.442
Dispatch worker salaries (x2)15,532,0601,609,560693,131.949329,249.647
Other (x3)82,362,55002,681,863.9282,029,316.981
AllOutput variables—revenue
Bread (y1)36,006,569011,106,338.108,421,408.766
Beverage (y2)18,142,27908,522,733.433,473,095.698
Pastry (y3)13,032,914229,5066,555,242.442,504,370.179
Input variables—expense
Staff salaries (x1)6,960,295812,9283,496,687.971,293,128.429
Dispatch worker salaries (x2)4,279,34302,013,625.28826,985.607
Other (x3)6,489,285466,3912,609,337.451,188,422.361
Table 2. Correlation coefficients among inputs and outputs.
y1y2y3x1x2x3
y1, total bread revenue 0.151 *0.501 **0.565 **0.697 **0.760 **
y2, total beverage revenue0.473 ** 0.644 **0.337 **0.428 **0.381 **
y3, total others revenue0.622 **0.182 ** 0.461 **0.665 **0.680 **
x1, total staff salary0.628 **0.698 **0.357 ** 0.407 **0.478 **
x2, total dispatch worker salary0.480 **0.608 **0.387 **0.512 ** 0.636 **
x3, total other expenses0.629 **0.701 **0.392 **0.643 **0.407 **
Note: (1) * p-value <0.05; ** p-value <0.01; (2) upper-triangle number denotes the Person correlation coefficient; (3) lower-triangle number denotes the Spearman correlation coefficient.
Table 3. Efficiency scores from the Banker et al. (BCC) DEA model.
YearOperations StyleTechnical Efficiency
(CCR index)
Pure Technical Efficiency
(BCC index)
Scale Efficiency
2011Q1I 0.8540.9390.910
2011Q2I0.8840.9360.944
2011Q3I0.8950.9280.964
2011Q4I0.8820.9340.945
2012Q1I0.9000.9380.959
2012Q2I0.9170.9440.972
2012Q3I0.9200.9540.964
2012Q4I0.9020.9430.956
2013Q1I0.8770.9290.943
2013Q2I0.9060.9370.967
2013Q3I0.9160.9390.976
2013Q4II0.9060.9350.969
2014Q1II0.8370.9180.915
2014Q2II0.8830.9070.973
2014Q3II0.8620.8860.973
2014Q4II0.7780.8420.918
2015Q1II0.7600.8450.892
2015Q2II0.8390.9050.926
2015Q3III0.9380.9590.978
2015Q4III0.9100.9440.964
2016Q1III0.9470.9620.983
2016Q2III0.9280.9500.977
2016Q3III0.9410.9590.981
2016Q4III0.9300.9540.974
All period Mean0.8880.9290.955
Standard deviation0.0470.0320.026
Table 4. Average efficiency measures for different stores size (2011–2016) and results of the Kruskal–Wallis test.
Operations StyleTechnical Efficiency (TE)Pure Technical Efficiency (PE)Scale Efficiency (SE)Sample Number
AverageR-meanAverageR-meanAverageR-mean
I0.89612.230.938130.95510.5511
II0.8385.640.8914.430.9389.7
III0.932210.955210.97620.176
Kruskal–Wallis test (Z)15.27617.8779.630
Prob. > Z< 0.001< 0.0010.008
Dunn post-hoc test (Q)III > I, IIII < I, IIIIII > I, II
Note: R-mean denotes the mean of rank; Q = ( R A ¯ R B ¯ ) / N ( N + 1 ) 12 ( 1 n A + 1 n B ) , where R A ¯ denotes the mean of rank in group A, R B ¯ denotes the mean of rank in group B, n A denotes the sample number of group A, n B denotes the sample number of group B, and N denotes the all sample number.
Table 5. Summary of overall efficiency and returns to scale.
201120122013
CountPercentCountPercentCountPercent
Efficient1537.51644.41442.4
Inefficient2562.52055.61957.6
CRS1537.51644.41442.4
IRS820.01027.8618.2
DRS1742.51027.81339.4
201420152016
CountPercentCountPercentCountPercent
Efficient1748.61548.41856.25
Inefficient1851.41651.61443.75
CRS1748.61548.41856.25
IRS925.7619.4618.75
DRS925.71032.2825.00
Note: CRS: constant returns to scale; IRS: increasing returns to scale; DRS: decreasing returns to scale.
Table 6. Summary of CRS, IRS, and DRA of different panels.
YearsCRSIRSDRSTotal of Self-Owned Stores
CountPercentCountPercentCountPercent
Panel A: by year
2011Q11230.0615.02255.040
2011Q21741.5922.01536.541
2011Q31842.9921.41535.742
2011Q41842.937.12150.042
2012Q11742.5512.51845.040
2012Q21951.4821.61027.037
2012Q31848.61232.5718.937
2012Q41641.01128.21230.839
2013Q11539.5615.81744.738
2013Q21744.7923.71231.638
2013Q32261.1513.9925.036
2013Q42055.6513.91130.436
2014Q1924.312.72773.037
2014Q22256.4820.5923.139
2014Q32248.91533.3817.845
2014Q41326.51122.52551.049
2015Q11223.5917.73058.851
2015Q21126.849.82663.441
2015Q31856.2415.61031.232
2015Q41546.9515.61237.532
2016Q11648.51339.4412.133
2016Q21957.6824.2618.233
2016Q31751.5721.2927.333
2016Q41546.9515.61237.532
Total 39843.117819.334737.6923
Panel B: by operations style
I18944.08319.315836.7430
II10936.65317.813645.6298
III10051.34221.55327.2195
Table 7. Correlation coefficients among ROA and technical efficiency.
ROATechnical Efficiency
ROA19.423 *
Technical efficiency9.423 *1
Note: * denote p-value < 0.05.

