1. Introduction
Sustainable development consists in the harmonization of economic processes with the state of the natural environment. To achieve its objectives, investors are required to consider solutions which support economic development and reduce pressures on the natural environment. This issue is particularly important in the field of sustainability and water resources [
1]. Due to rapid urbanization and the development of floodplains, technical investments are being made to increase flood safety in these areas, for example, by regulating the riverbed, embanking it, or regularly cutting down water plants [
2]. These actions are not always consistent with sustainable development principles. River regulation, as one example, consists of the application of various technical measures aimed at protecting against floods and increasing the efficiency of water courses in terms of water use in the economy [
3,
4,
5]. However, most experts agree that any technical interference to a riverbed will have a negative effect on its ecosystem. They point out that riverbeds are sensitive and susceptible to anthropogenic activities. The regulation of the watercourse results, among others, in changes in the hydraulic characteristics of the river, changes in habitat conditions, biological depletion, changes in thermal conditions, as well as changes in water chemistry [
6,
7,
8]. Therefore, reference to sustainable development principles for watercourses where regulatory works are planned requires the designers to adopt technical solutions that will be adapted to the economic requirements and simultaneously minimize the adverse impact on the natural environment.
Activities performed as part of regulatory works usually concern the changes in the bottom width, depth of the bed, longitudinal slope of the bottom, slope of the embankments, and the method of their reinforcement as well as bed shading. Numerous studies have been carried out on the effect of these riverbed elements, considered individually, on the watercourse ecosystem [
9,
10,
11,
12]. However, this problem has not been sufficiently recognized so far [
3]. Moreover, field conditions often make it necessary to transform several elements of a watercourse at the same time. Therefore, the designer’s objective should be to select elements in such a way as to protect the interests of water and river valley users on the one hand, and not to lead to significant natural changes on the other hand.
At present, a number of natural indicators characterizing the ecosystem of a riverbed transformed as a result of anthropogenic activities are used [
13,
14,
15,
16]. One of them is the change in the species composition of aquatic plants. Many have pointed out that aquatic plants are a significant element of the riverbed ecosystem, as they perform important ecological functions, such as providing organic matter to the aquatic ecosystem, shaping environmental conditions (i.e., temperature, lighting, flow rates, water chemistry), creating habitat conditions for aquatic organisms, feeding aquatic and waterborne invertebrates and vertebrates, improving the self-purification capacity of watercourses, reducing the intensity of water erosion, and stabilizing the riverbed substrate [
12,
17,
18,
19,
20,
21].
Designers and contractors can interfere with riverbeds, which are highly diversified, unique and time-varying in terms of shape, morphological and hydrological features, environmental structure, and biocenosis. Because of this, their decisions in terms of environmental protection are made under conditions of uncertainty. This means that they can be unclear about how their work impacts issues related to environmental protection during the decision-making process. Therefore, the decision-making process requires them to take into account conditions about which they feel subjectively and over which they have no influence regarding their shaping. There is therefore a real need to develop a Decision Support System (DSS) for problems under consideration [
22]. The structure and the construction of the DSS vary depending on the issue. Traditional DSSs, developed for river basin management [
23], are not sufficient to address the impact of a given work on aquatic ecosystems. They should therefore be extended to include additional elements that would increase the effectiveness of the decision-making process in relation to the principle of sustainable development. Such an element could be the application of game theory.
The aim of this study is to determine the suitability of game theory as a tool supporting decision-making in the design of regulatory works including ecological aspects, as well as an indication of a regulatory works model that would meet the expectations of water users while corresponding to environmentally friendly watercourse regulation. Game theory is a branch of mathematics which in essence determines the optimal behavior of individuals, organizations, or social groups in the event of a conflict of interest or uncertainty [
24,
25]. The outcome of a problem (game) is determined by the moves (strategy) made by participants in the game (players) [
26]. Even though game theory is a relatively young branch of mathematics, it has been widely used in many other disciplines. Today, it finds applications in biology (sociobiology), sociology itself [
27], economics [
28], computer science [
29], and land management [
25]. It has been also used as the means to understand many environmental issues, including water management problems. Water management is based on levels of uncertainty. These are changing as a consequence of climate change and also changes in demography, consumption patterns, and also political aspects [
30]. Game theory has been used in the following types of water management problems:
water quantity and quality management, for example, determining the amount of contaminant removal and contaminant discharge such that the polluters have the least loss [
31], developing an approach for surface water quality management considering the complicated regulations [
32];
water allocation, for example, analyzing the stability of agreements on river water allocation between riparian countries under climate change [
33], righteous and efficient water allocation among users at the basin level [
34];
water conflicts, for example, identifying the most likely outcome of the Caspian Sea conflict and proposing some possible allocations [
35], modelling of Israeli-Palestinian aquifer sharing [
36];
use of water in agriculture, for example, identifying determinants of cooperation in a farmer-managed irrigation system [
37], a water-sharing project (drip irrigation) in the Tarim River Basin [
38];
groundwater management, for example, analysis of the roles of cooperation and non-cooperation on sustainability of groundwater extraction [
39].
Game theory applications in water resource literature cover a range of water resource problems. The literature mentioned above shows that game theory can provide insights for improving water resource management which requires a multi-criteria analysis, even without detailed quantitative information [
31,
32,
33,
34,
35,
36,
37,
38,
39]. Game theory can predict if the optimal resolutions are reachable and explain the decision makers’ attitude. The disadvantage of the method is that decision makers could have an imperfect foresight and an unclear understanding of the game’s conditions and other players’ characteristics (e.g., risk attitude) [
40]. However, providing information about the evolving structure of the problem and the risk may help change behavior and decisions to reduce overall losses. Moreover, decision makers could endeavor to maximize their own objectives. A weakness is also the fact that water resource problems change over time. Therefore, game theory methods should also evolve. This process is noticeable. Earlier research gives less emphasis to the environmental effects of water management, whereas contemporary researchers are incorporating more environmental parameters into their models [
26].
In the case of water management problems, different models of game theory have been applied. However, it is difficult to find studies that focus on the applications of a model of “game with nature” in water management, especially in river regulation. “Game with nature” is a game involving two players, A and B, and the second player is called “Nature”. Nature is understood as an “unreasoning opponent”, which—unlike other players—represents nature’s behavior, namely, accidental and devoid of optimization activities. Nature does not care about the outcome of the game. In this case, nature is represented by aquatic plants observed in the watercourses.
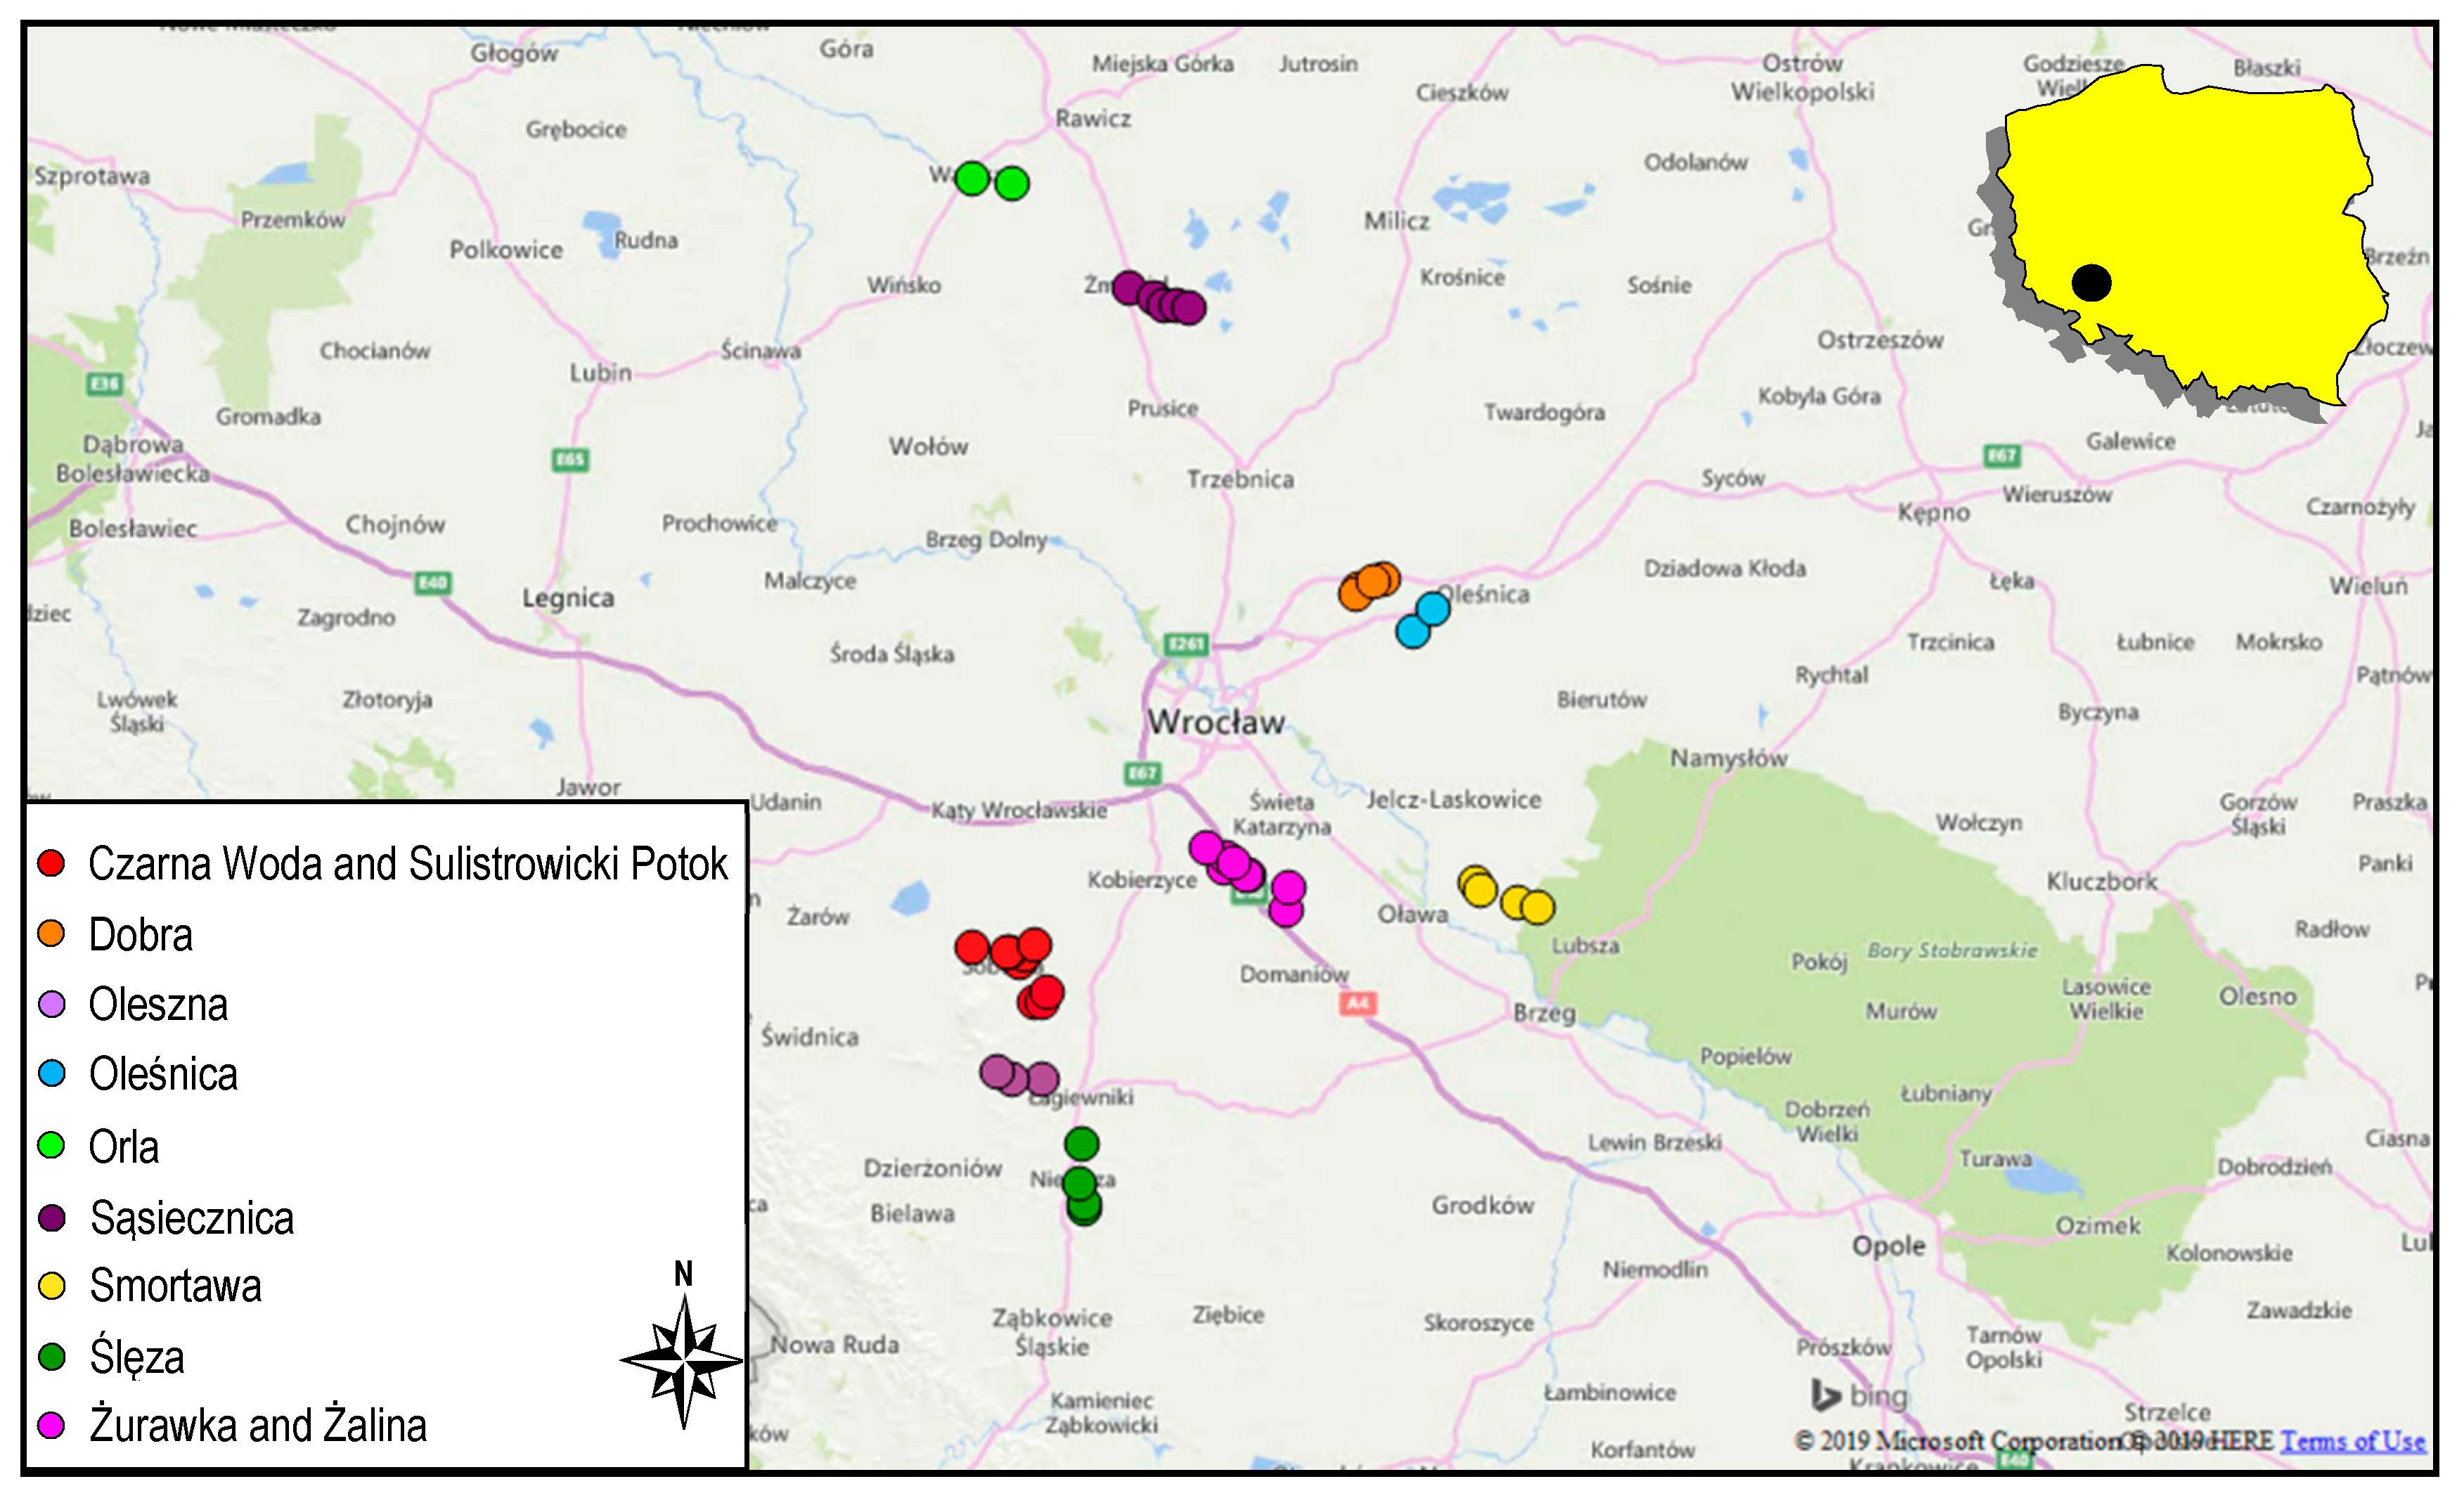
2. Area of Study
Field studies were carried out in the 2008–2014 growing seasons on 11 small (catchment area of 100–1000 km
2) and medium (catchment area of 1000–10000 km
2) lowland (altitudes below 200 m above sea level) watercourses of Lower Silesia (
Figure 1) that comprise a part of the Odra river basin. These watercourses were selected for study in accordance with the “System A” river typology as derived from the EU Water Framework Directive [
41].
For this work, 41 study sections were designated on these watercourses. The length of each section was 100 m. They were all located in areas used for agriculture, with similar climate (moderate, transition zone between maritime and continental), geology (Foresudetic Monocline, Permian Rocks, and Trias), and soil (Luvisols formed from loess and brown soil) conditions. Due to the geological, hydromorphological, and climate characteristics, the examined watercourses are representative of the lowland ecoregions found in central European highlands and plains [
42]. These were largely shaped by the huge ice cap of the last glacial period and consist mainly of glaciofluvial deposits, with most of the remaining sediment consisting of sand. Central European river basins are rarely underlain by solid bedrock. Hence, there is a high infiltration capacity following precipitation and typically little seasonal variation in river discharge [
42]. These streams are characterized by low average flow velocities and low hydrological variability. Therefore, the obtained results of the following research may be related to other small- and medium-sized central European rivers.
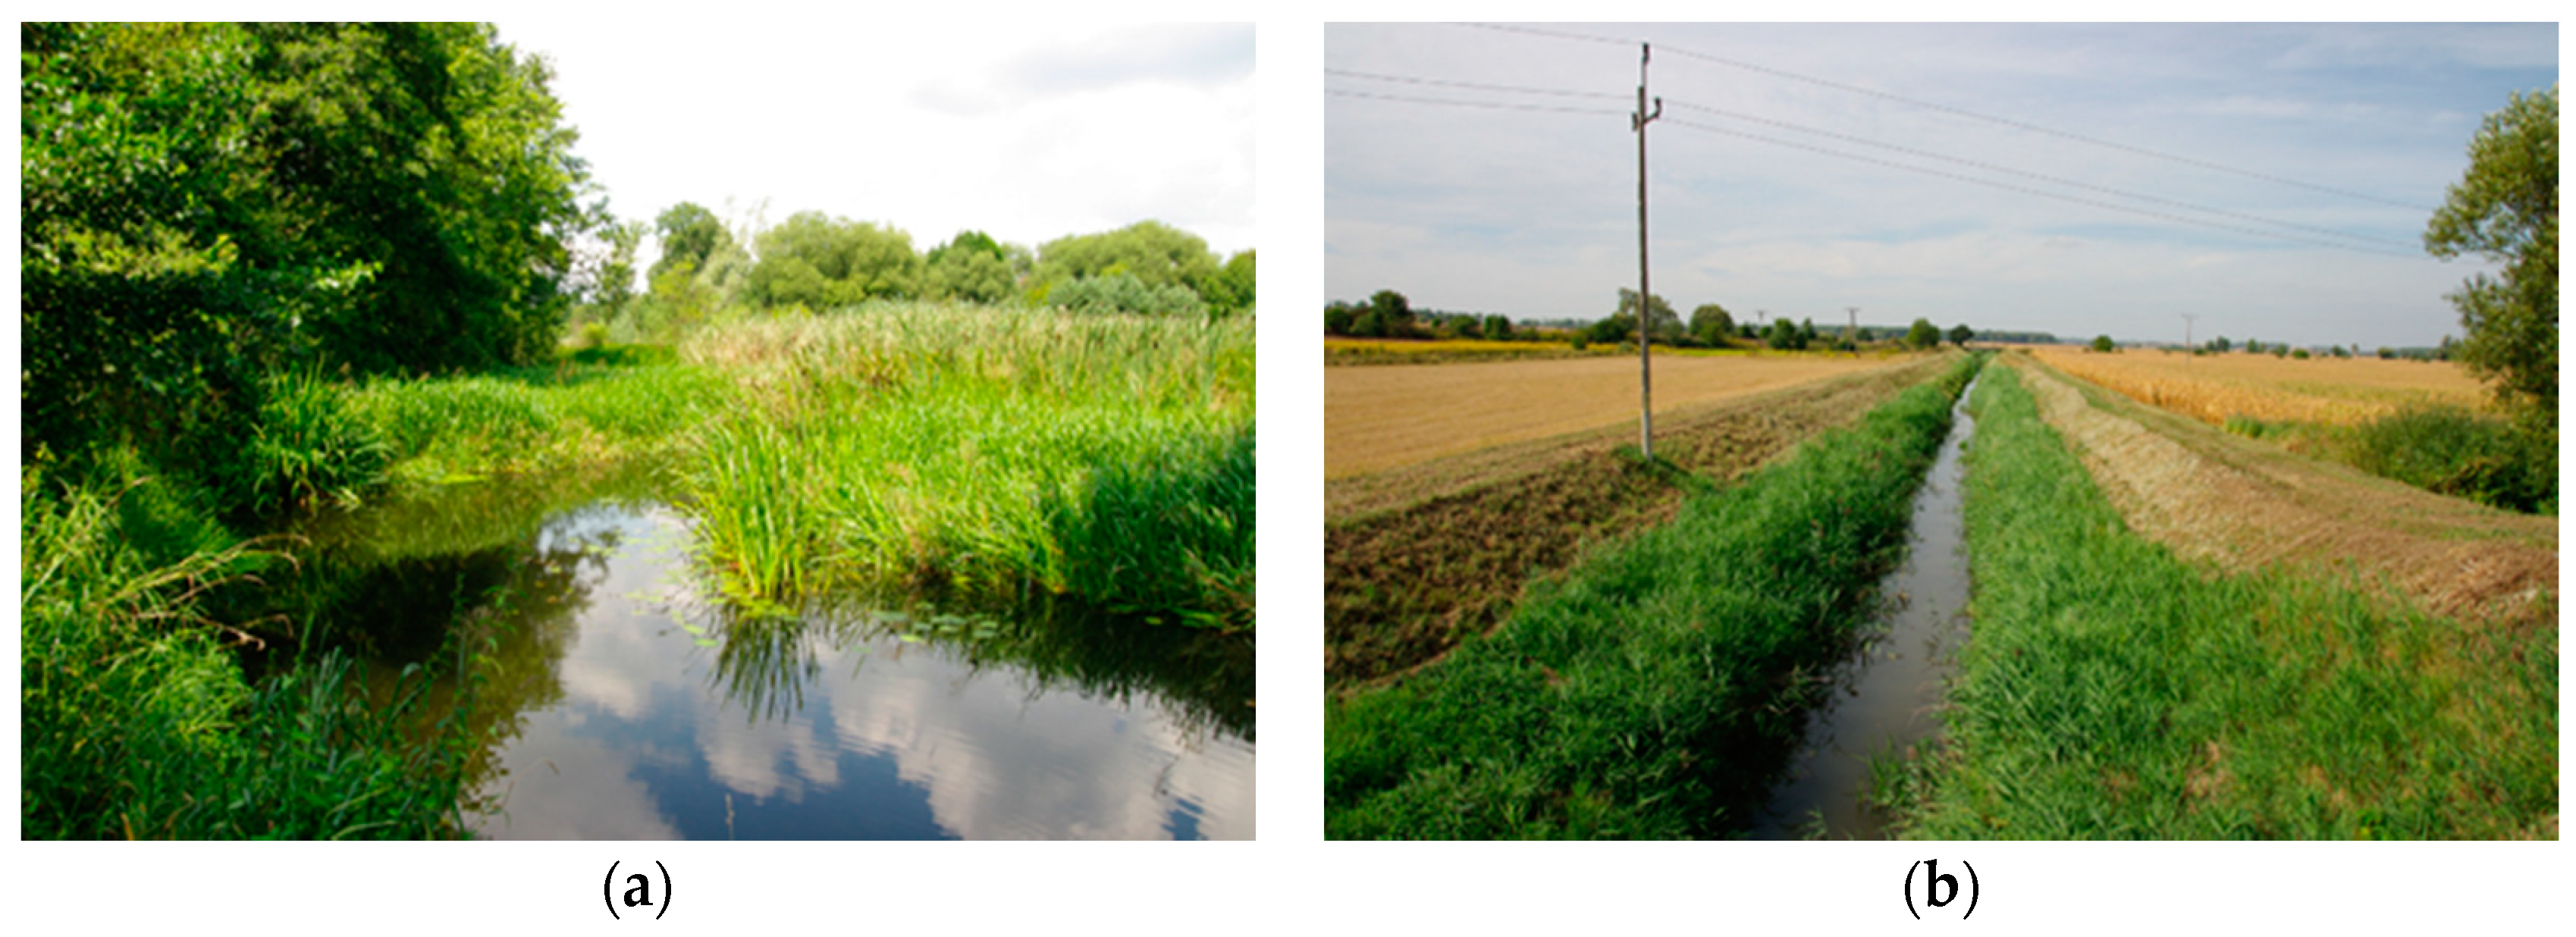
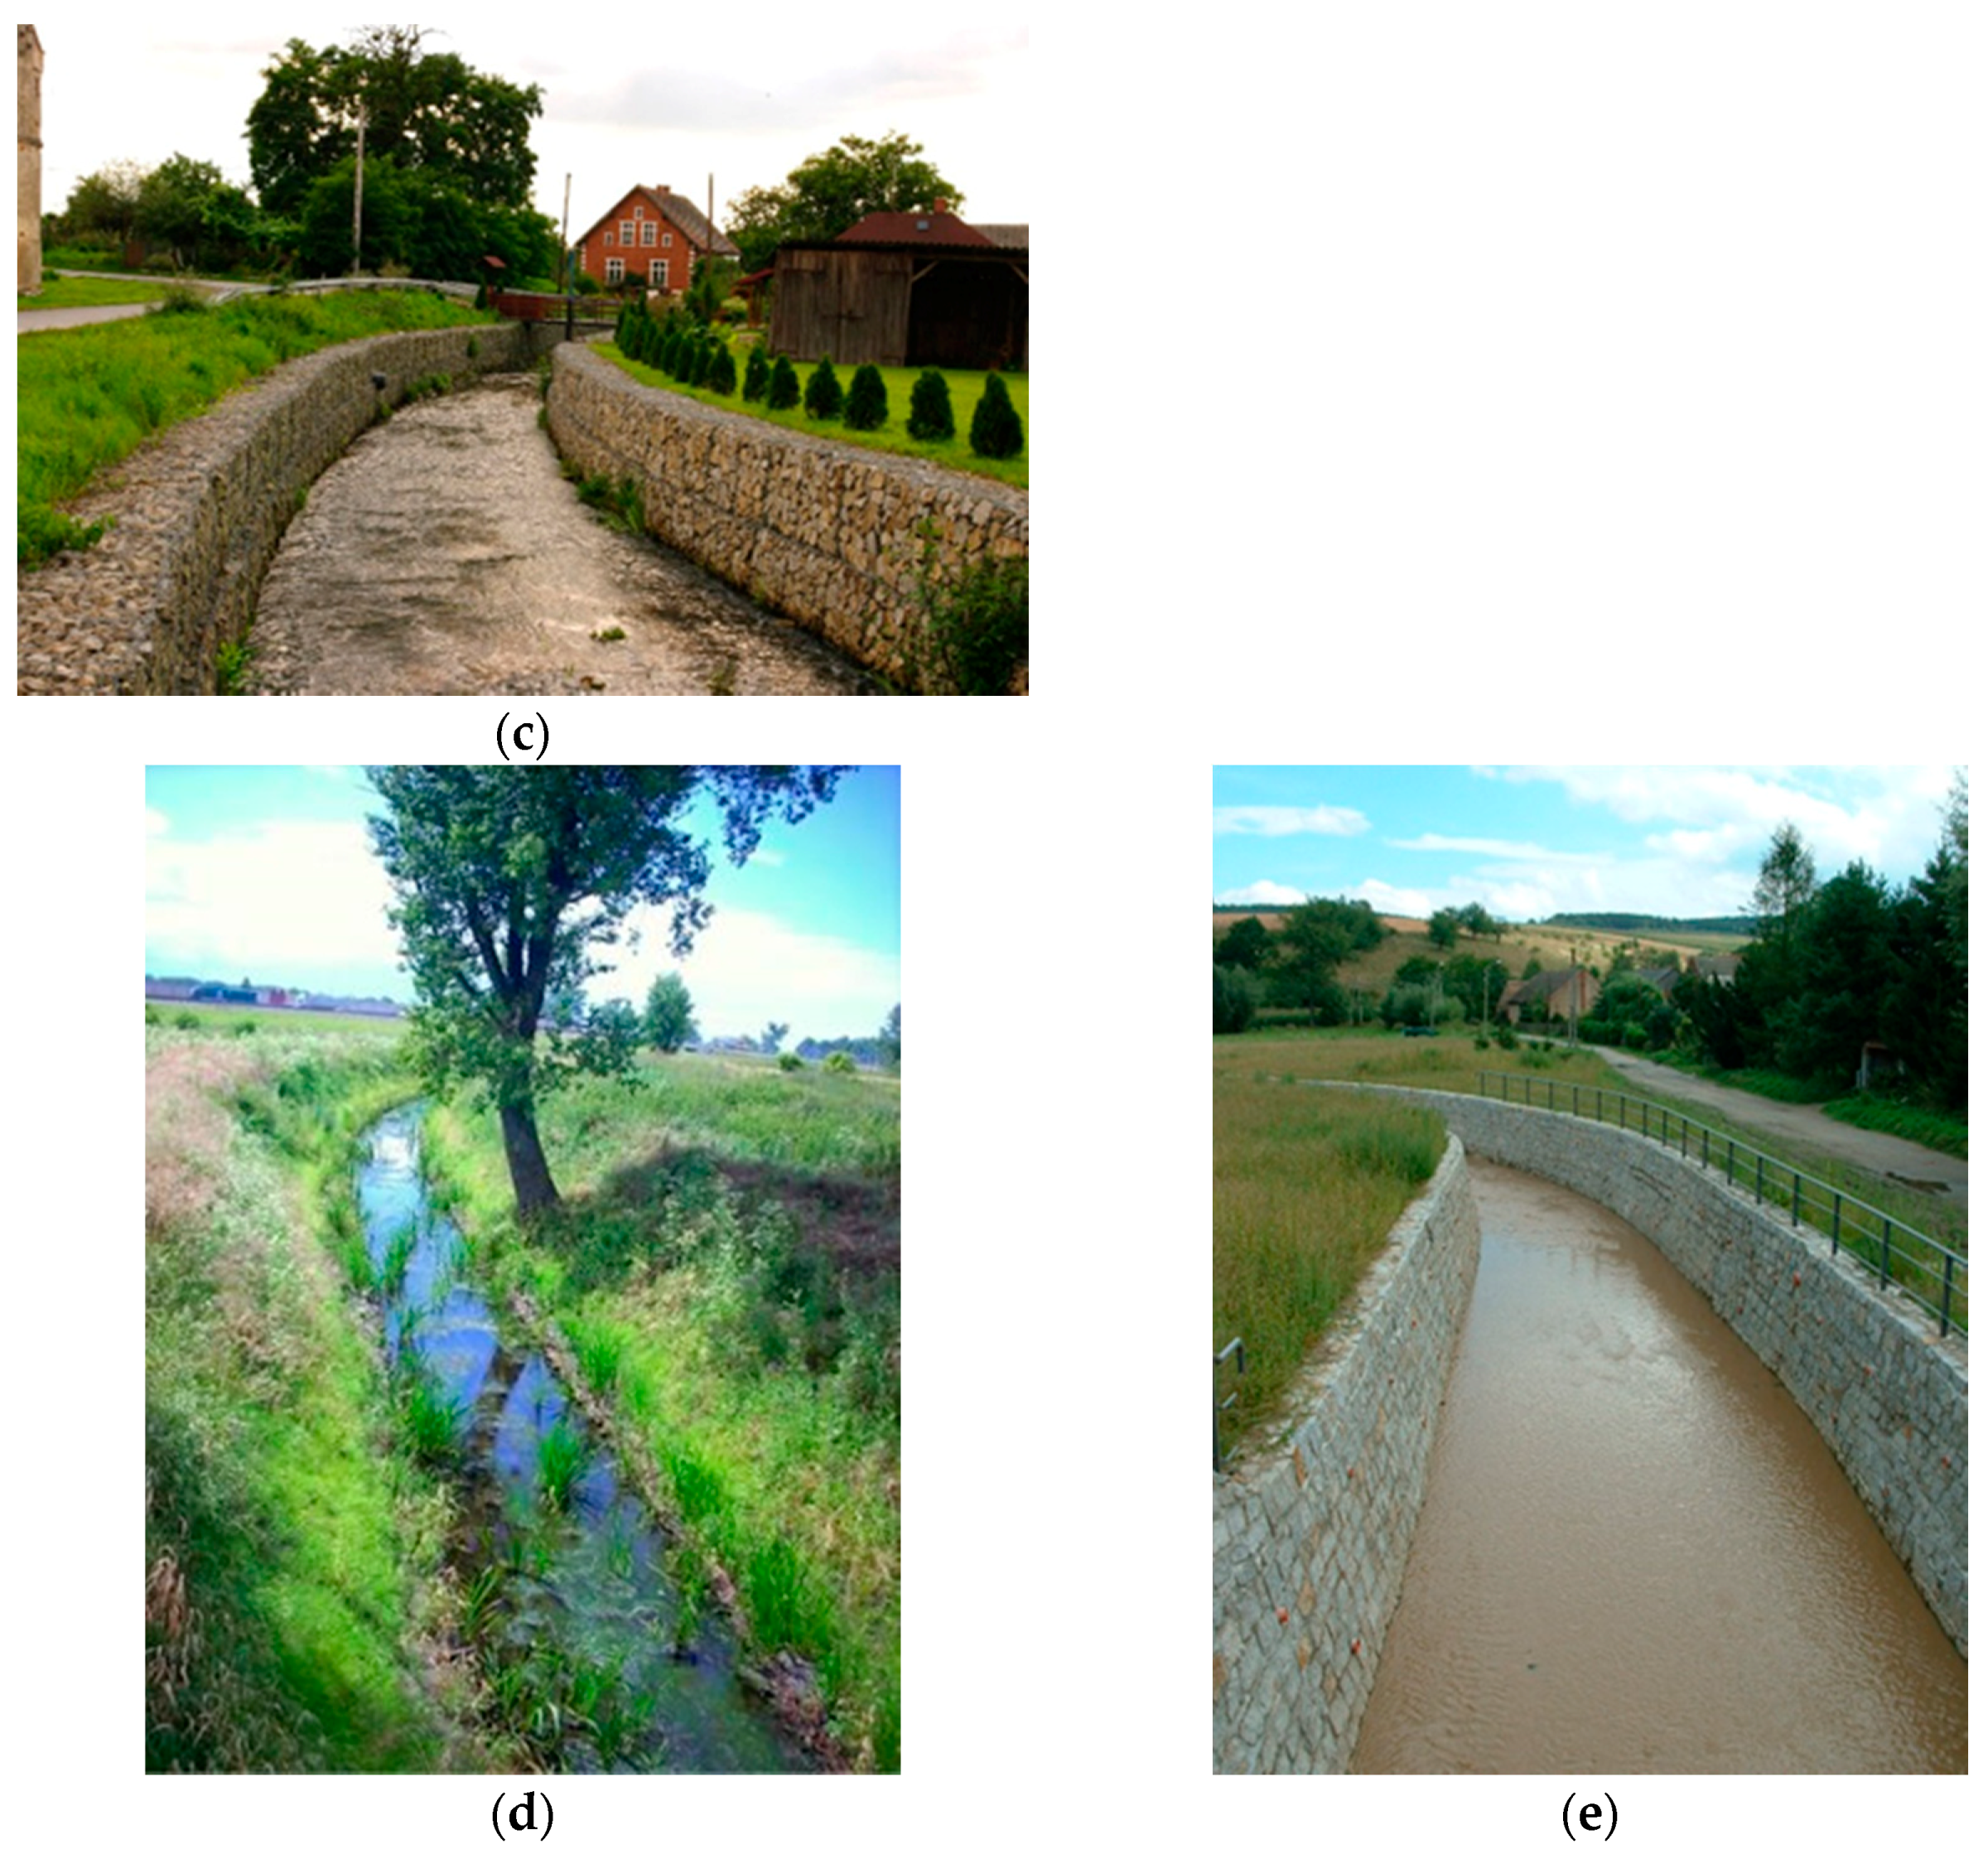
The sections of watercourses selected for the study are characterized by varying degrees of anthropogenic transformation. Eleven sections, one in each watercourse, were in a state close to being natural. There were no traces of technical interference in them. In the analysis, they were used as reference sections. In turn, the remaining sections, located in the immediate vicinity of comparative ones or at a small distance from them, were characterized by regulatory works performed 3–5 years prior to the beginning of the research. Selected study sections are presented in
Figure 2.
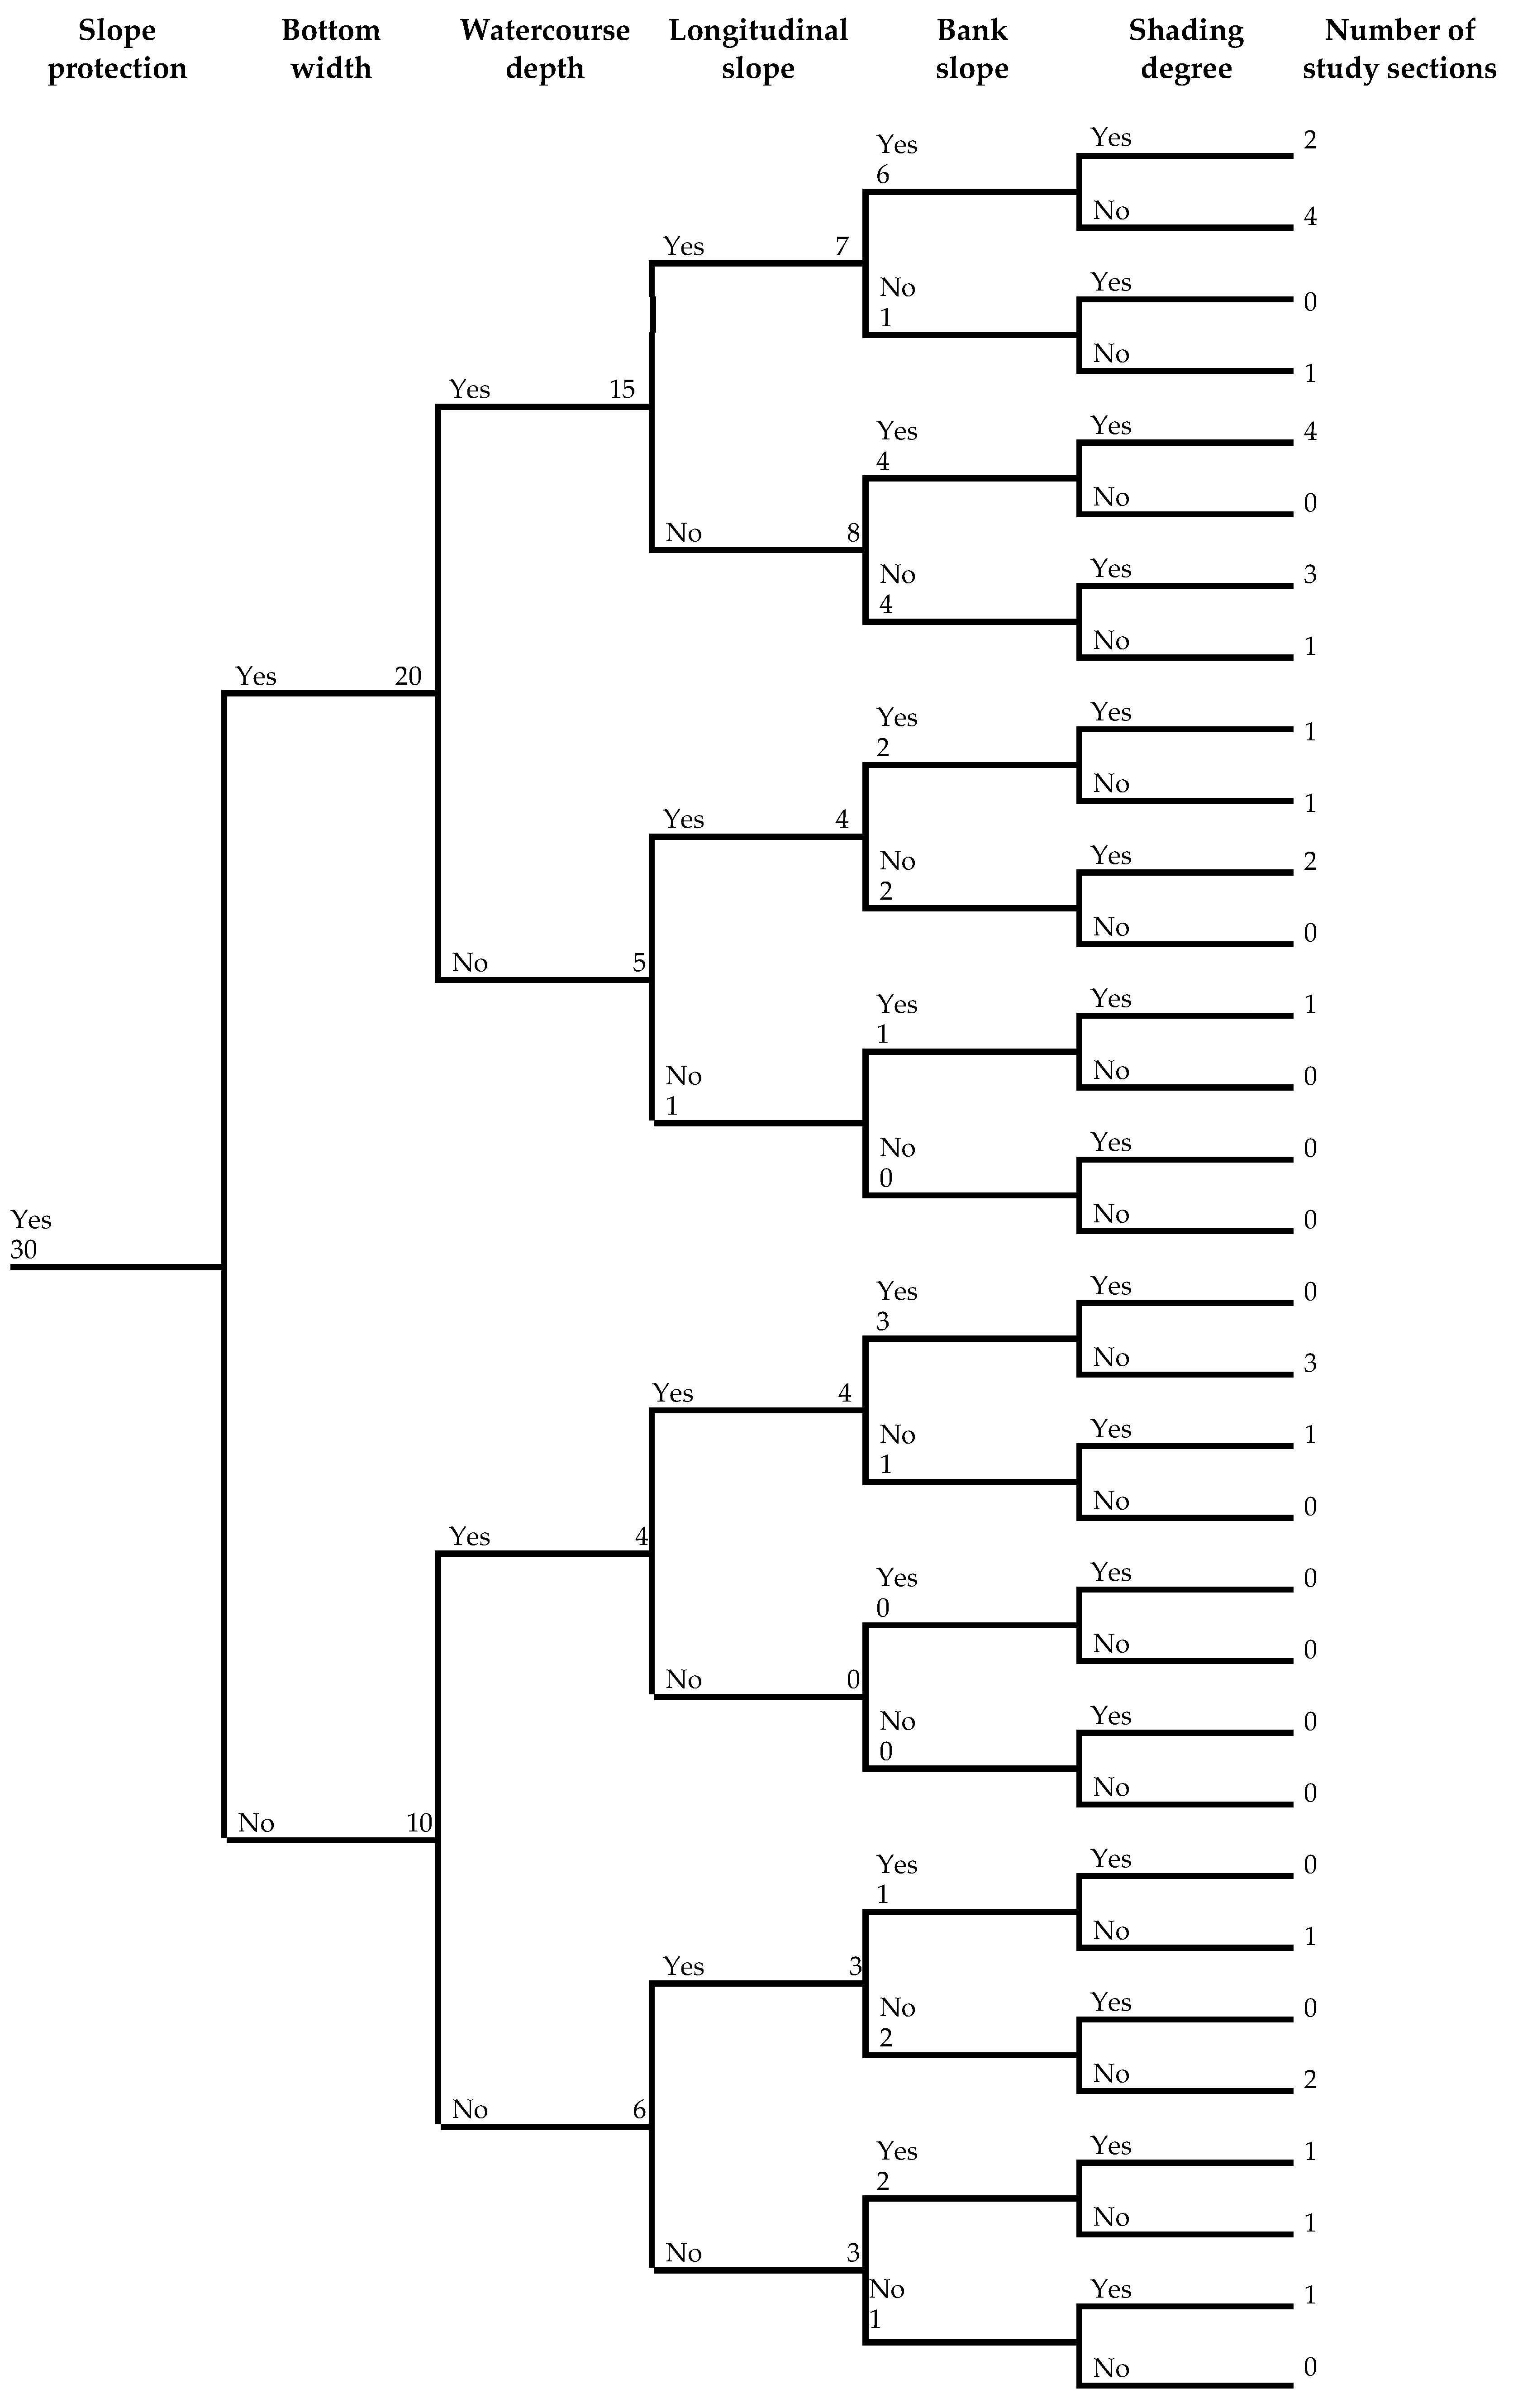
The regulatory works performed in the study sections included changing the parameters of the cross-section of the bed, longitudinal slope, shading the water surface, and type of slope protection. Changes in the cross-section dimensions concerned the width of the bottom, the depth of the bed, and the inclination of the slopes. The changes in the protection of the slopes consisted of the replacement of a naturally formed shore with biotechnical or technical reinforcement. The scope of works performed on individual sections was determined on the basis of technical documentation. It is presented in
Figure 3 in the form of a decision tree. A decision tree is a decision-making device which assigns a probability to each of the possible choices based on the context of the decision. It is composed of three basic elements: decision nodes corresponding to attributes, edges or branches which correspond to the different possible attribute values, and leaves including objects that typically belong to the same class or that are very similar. A decision tree gives a measure of the relative likelihood that each choice is the one which should be selected [
43]. However, in this paper the decision tree has been used to show the number of study sections in which the analyzed parameters have been changed as a result of regulatory works. “Yes” above each edge denotes that the parameter has been transformed, whereas “No” denotes that it has not been transformed. The numbers indicate the number of study sections.
4. Results and Discussion
The minimum, maximum, and average values of the analyzed parameters are presented in
Table 1.
The width of the watercourses’ bottoms in the study sections ranged from 1.5 to 8.0 meters in the unmodified and from 1.5 to 10.0 m in the regulated watercourses. The depth ranged from 1.2 to 3.5 m in the unmodified study sections. In the regulated sections, the values were similar—the minimum depth was 1.36 m and the maximum was 3.5 m. The bottom slope was between 0.2–2.4‰ in unmodified and 0.2–3.5‰ in regulated watercourses. All the study sections showed a wide range of values for the bank slope. There were both vertical slopes and sections with flat and irregular slopes. However, the concrete elements were only in regulated watercourses. All shading stages were registered, from complete lack of shading to total shading.
The scope of changes in the parameters of the considered riverbed elements, made as a result of the regulatory works, varied widely (
Table 1). In relation to non-transformed sections, their value was subject to both increase and decrease.
Figure 3 shows that embankment reinforcement was carried out on each of the regulated sections of the watercourses. The change in the width of the bottom occurred in 20 sections, the depth of the bed—in 19, the longitudinal slope of the bottom—in 18, the slope of the embankments—in 19, and the shading of the bed changed in 16 sections. These changes occurred in 17 element configurations. Such a significant variation in the selection of elements to be transformed is determined by the specificity of the regulatory works. It requires taking into account, during the design process, the conditions that are unique and concurrently are shaped in a wide range. They are of technical, physiographic, naturals and social character [
3]. This argues in favor of the fact that the design of regulatory works as well as the assessment of their effects should be considered as decisions under conditions of uncertainty.
The detailed results of the fieldwork are presented in
Table 2.
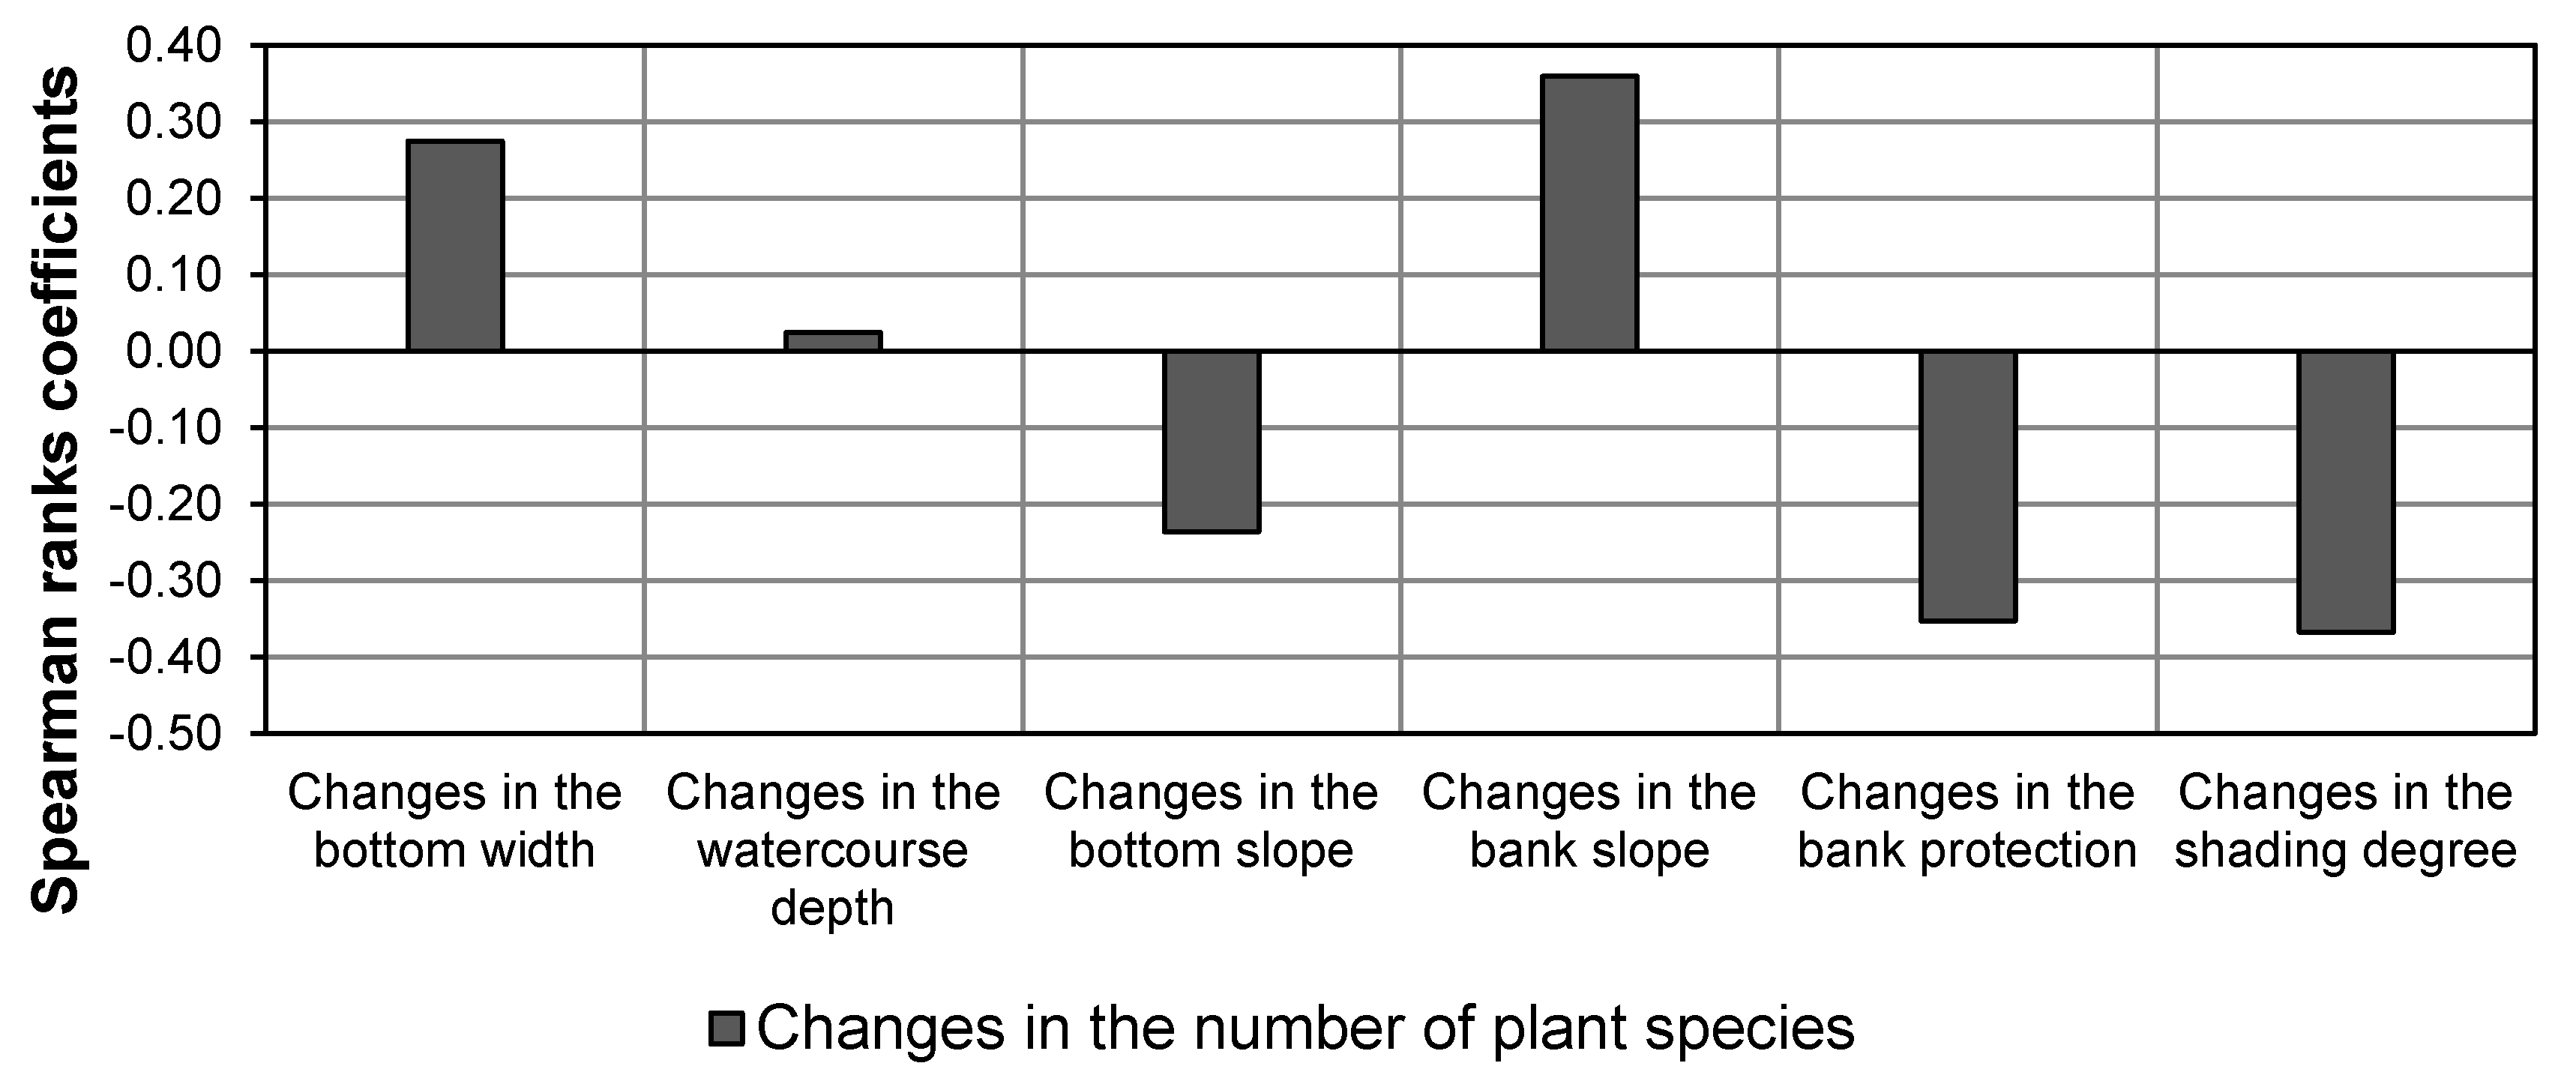
Figure 3 and
Table 2 show that four or five elements of the watercourse were most often transformed in the analyzed watercourses. The changes in the parameters of these elements showed different effects on aquatic plants. In some cases, the number of species decreased, whereas in others it remained unchanged or increased. The analysis of correlation did not show a significant relationship between the range of changes in the analyzed parameters of the riverbed and the change in the number of aquatic plant communities (
Figure 4).
Only elements such as shading of the bed, inclination of the slopes, and method of their protection are noteworthy. The availability of light as an important factor in shaping the composition of aquatic plant communities in watercourses is indicated by Middelboe and Markager [
53] and Herb and Stefan [
54]. However, many authors justified that the impact of this factor on the development of aquatic plants is marked primarily in the zone of the watercourse to a depth of 1 m [
55]. Schindler et al. [
56] pointed to the negative impact of technical reinforcement of embankments and their vertical shape on the riverbed ecosystem. However, in the analyzed river sections, the changes in the dimensions of the bottom width, depth of the riverbed, and longitudinal slope did not show any influence on the change in the number of aquatic plant species. This result differs from the expected one, since such a relationship was noted in similar studies [
9,
11,
55,
57,
58]. However, most authors are of the opinion that it is practically impossible to attribute the changes in aquatic plant communities to the effect of particular habitat factors, just as it is difficult, under field conditions, to artificially isolate a single factor effect [
59,
60]. Moreover, the results of the analyzed studies indicate that when performing regulatory works, within the framework of which several elements of the riverbed are transformed, one should take into account their collective effect on aquatic plants. This is due to the fact that factors affecting aquatic plant communities often act synergistically and that single correlations between environmental elements, anthropogenic interactions, and aquatic plants are rare [
61,
62,
63].
In addition, any disturbance of the aquatic environment caused by the transformation of the riverbed is followed by the regeneration of the ecosystem. Field observations [
64] showed that the regeneration of vegetation took place even as early as the first vegetation season after the completion of works. This indicates secondary succession in watercourses subjected to technical works. Similar results were obtained by Caffrey et al. [
62], who explained this mechanism by the fact that most aquatic plants have very effective mechanisms of vegetative propagation and proliferation [
55,
65,
66]. As a result of secondary succession, it is possible to rebuild an aquatic plant community, but it is rarely identical to the one that existed before the technical intervention of the riverbed.
Thus, in studies on the impact of regulatory work on water ecosystems, watercourses should be treated as complex and dynamic ecological systems in which it is impossible to predict the actual impact of regulation on aquatic plants. For this reason, methods that will make the impact of regulatory decisions less unclear in terms of the environmental impact should be sought. Therefore, the possibility of using Wald’s rule, the optimistic rule, and Hurwicz’s rule for this purpose was analyzed.
A matrix was developed on the basis of the field research results, in which the changes in the number of aquatic plant species were determined, depending on the scope of the regulatory works carried out. These changes were related to the number of species occurring in the non-transformed section of the riverbed. Due to the fact that the changes observed were within wide limits, the analysis was carried out taking into account the pessimistic and optimistic criteria. The matrices corresponding to these criteria are presented in
Table 3 and
Table 4.
The matrix lines show the possible decisions made by the designer regarding the number of elements of the watercourse in which the parameters should be changed. They were grouped according to the preferences of the designers, determined on the basis of the research material. The columns show the changes in the number of species in the transformed sections of watercourses. The data in the pessimistic variant correspond to the values observed during the field research on the sections where the losses were the greatest. The optimistic variant is based on the values found in the sections where the losses were smaller or the number of species increased.
Following Wald’s rule, it was assumed that in each of the applied variants of river regulation, the losses in the number of aquatic plant species would be maximum (
Table 5 and
Table 6).
The presented results of the analysis indicate that following Wald’s rule, the designer should apply the variant in which four elements of the watercourse will be transformed.
When adopting an optimistic rule in the decision-making process concerning the scope of regulatory works, identical matrices should be used as in Wald’s rule. The difference between the methods is that the optimistic rule assigns the lowest possible losses to the designer’s decisions. The choice of the final decision, according to this rule, should be determined by the variant with the smallest changes in the number of aquatic plant vascular species in the regulated section. The matrices are presented in
Table 7 and
Table 8.
The analysis presented shows that if the pessimistic variant is adopted, the strategy of transforming 2–4 technical elements of the watercourse as part of regulatory works will be beneficial. In the case of the optimistic variant, on the other hand, a more intrusive control model with the simultaneous transformation of 4–6 elements should be selected.
The presented results indicate that, in the case of the optimistic approach, it should be assumed that regulatory works are beneficial for plants in the riverbed. Since this is usually not the case, it seems too risky to proceed according to this model. However, using Wald’s rule in a pessimistic version would be justified if aquatic plants in most cases reacted in a biased manner unfavorable for the decision-maker. The research carried out shows that this is nevertheless not the case. This is also confirmed by research carried out by others [
55]. It is therefore advisable to find an indirect solution, justifying the application of Hurwicz’s rule.
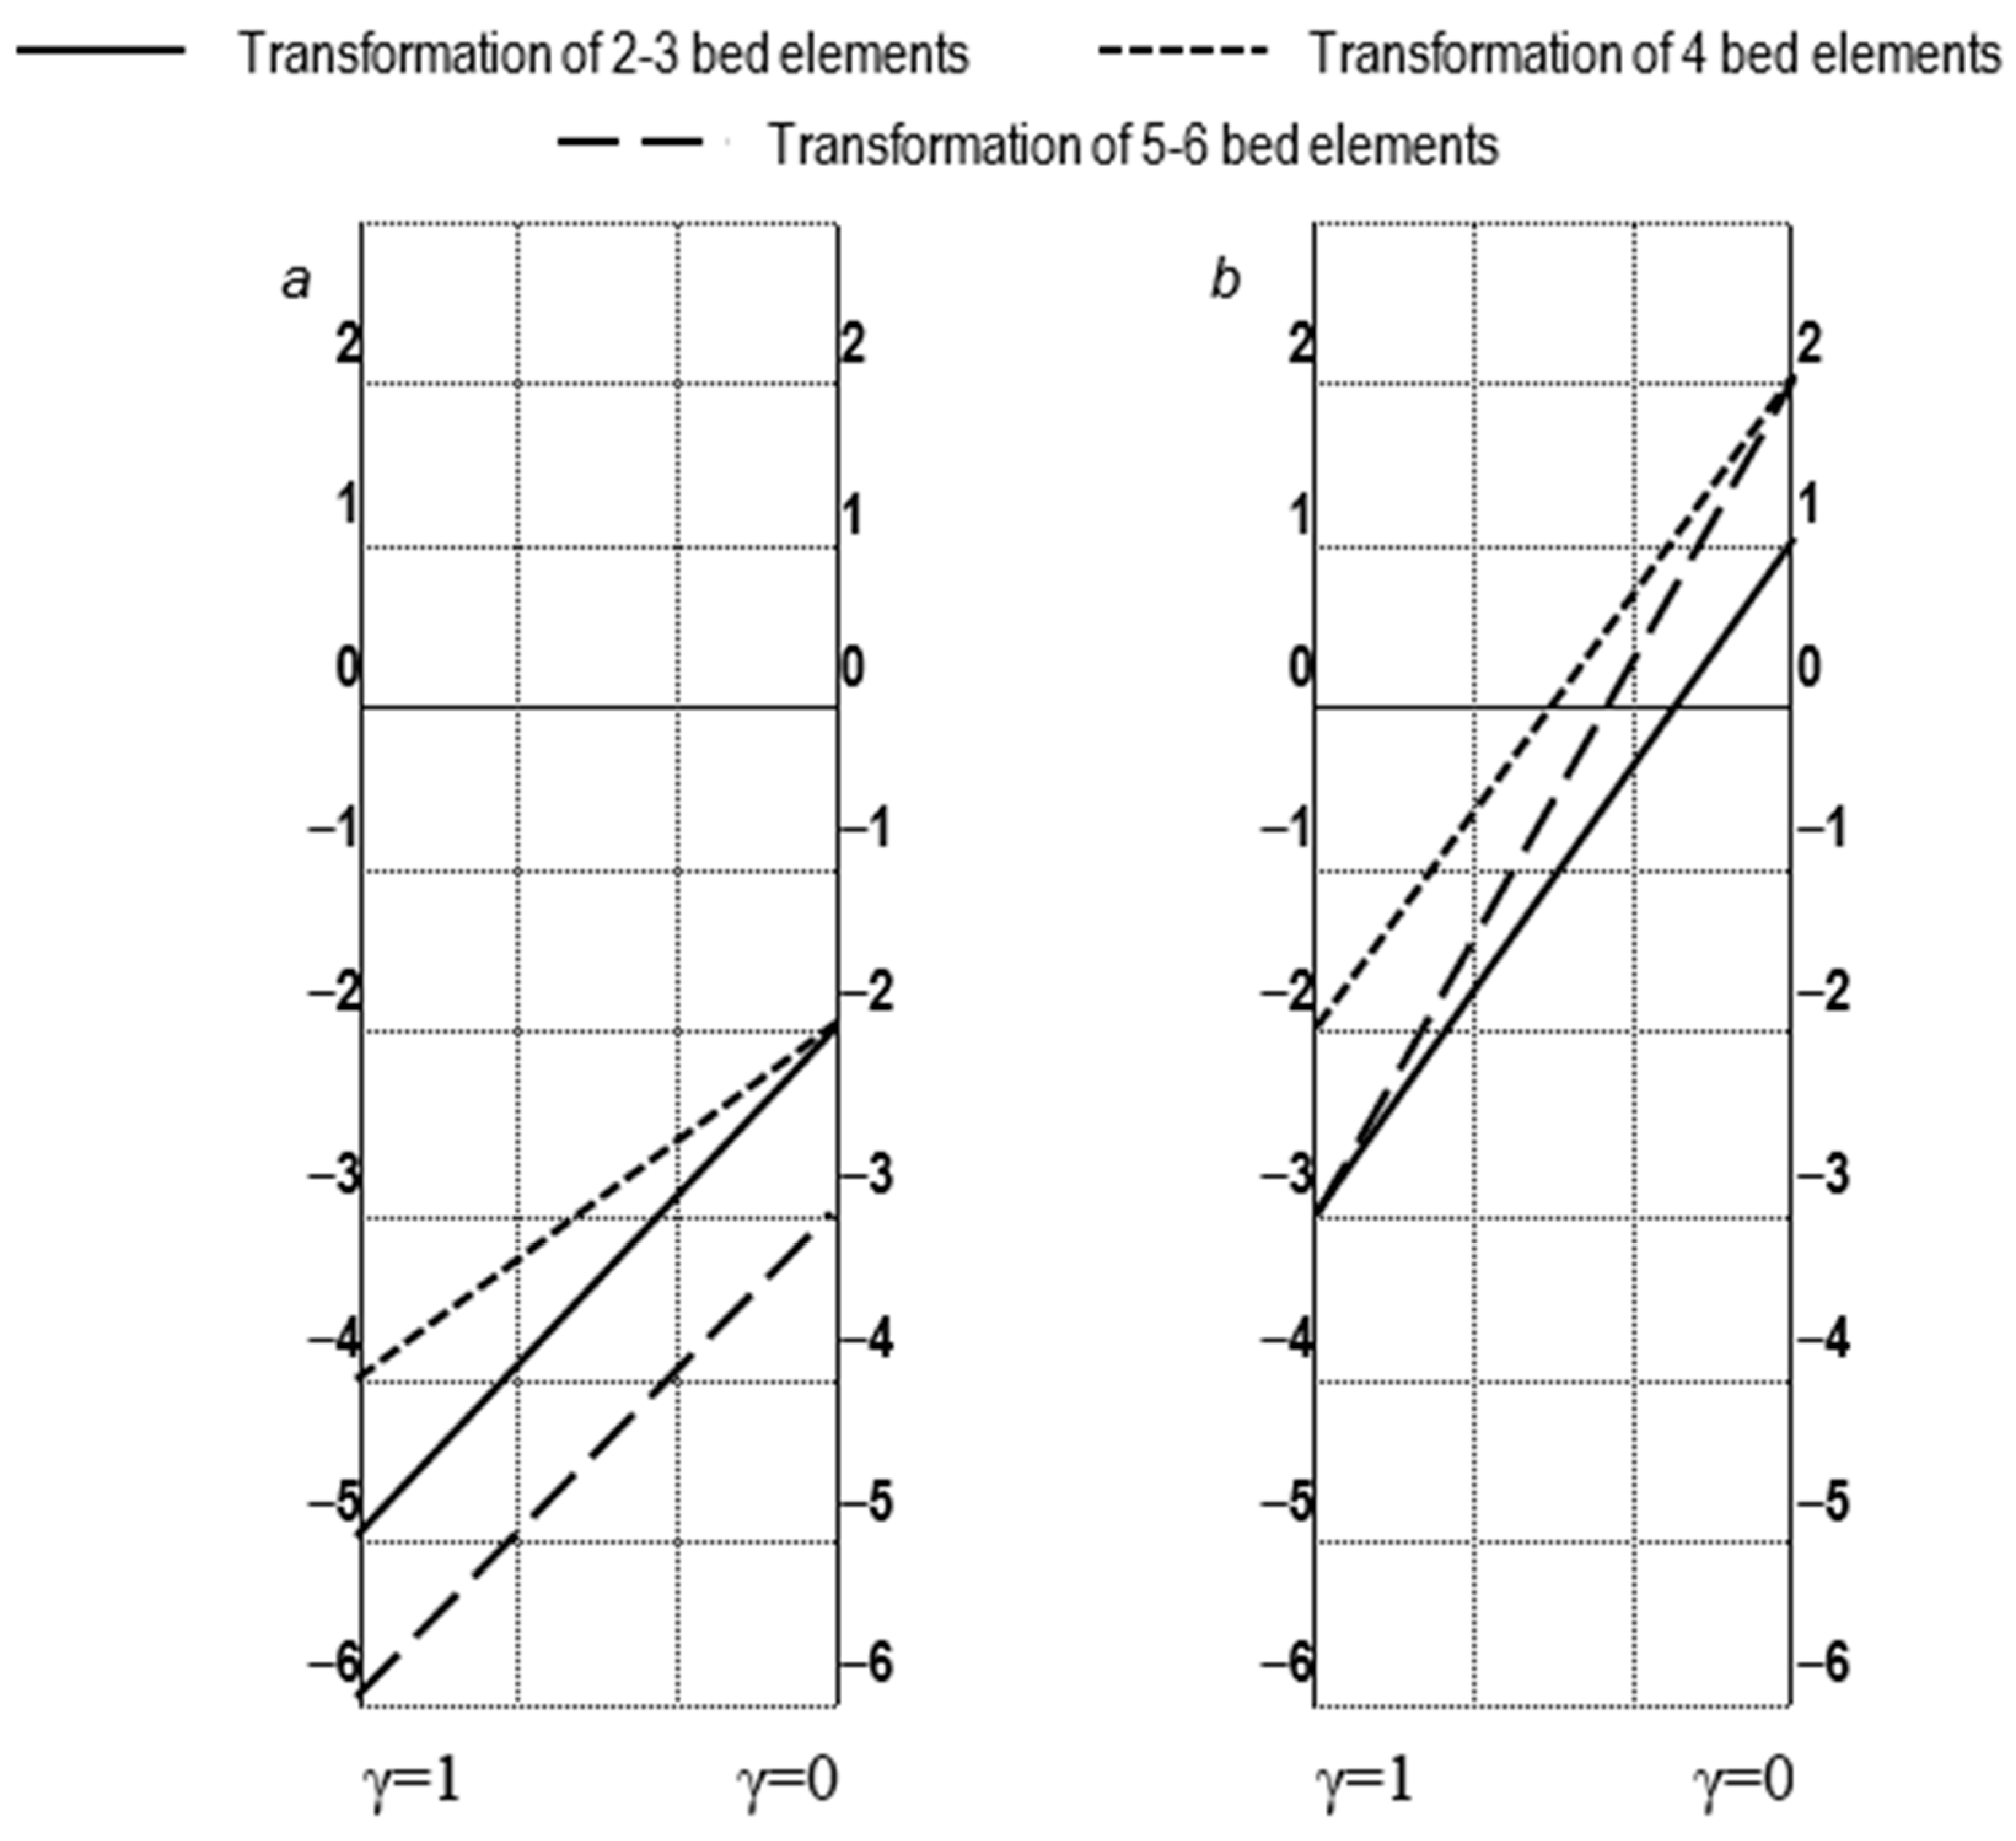
Therefore, a precautionary factor γ was determined, in the range of 0 to 1.
Table 9 shows the observed changes in the number of species corresponding to a precautionary factor of 1 and 0 for both variants of the matrix under consideration.
Figure 5 shows the range of variation for the precautionary factor γ. The figure consists of two parts. Part (a) is the pessimistic approach, assuming that the effects of technical actions will be extremely unfavorable, and part (b) represents the approach that they will be acceptable. The line representing the transformation of four bed elements runs no lower than the other two lines, both for both variants and for the whole range of variation of the precautionary factor. Therefore, using Hurwicz’s rule, it should be stated that the most advantageous strategy, both in the pessimistic and optimistic approach, is the transformation of four elements of the bed.
Table 10 summarizes the results obtained using the considered decision-making rules. They indicate that individual rules may lead to the selection of different decisions, but the one that is indicated most often, both according to the pessimistic and optimistic approaches, assumes the transformation of four elements of the riverbed. This is a rather non-intuitive result, as it is usually assumed that less technical intervention in the riverbed results in smaller changes in aquatic plant communities.
In order to validate the results of the analyses, they were compared with the results of previous studies carried out by the authors. For this, 45 transformed study sections described in [
67], excluding the sections being the basis of this paper, were analyzed.
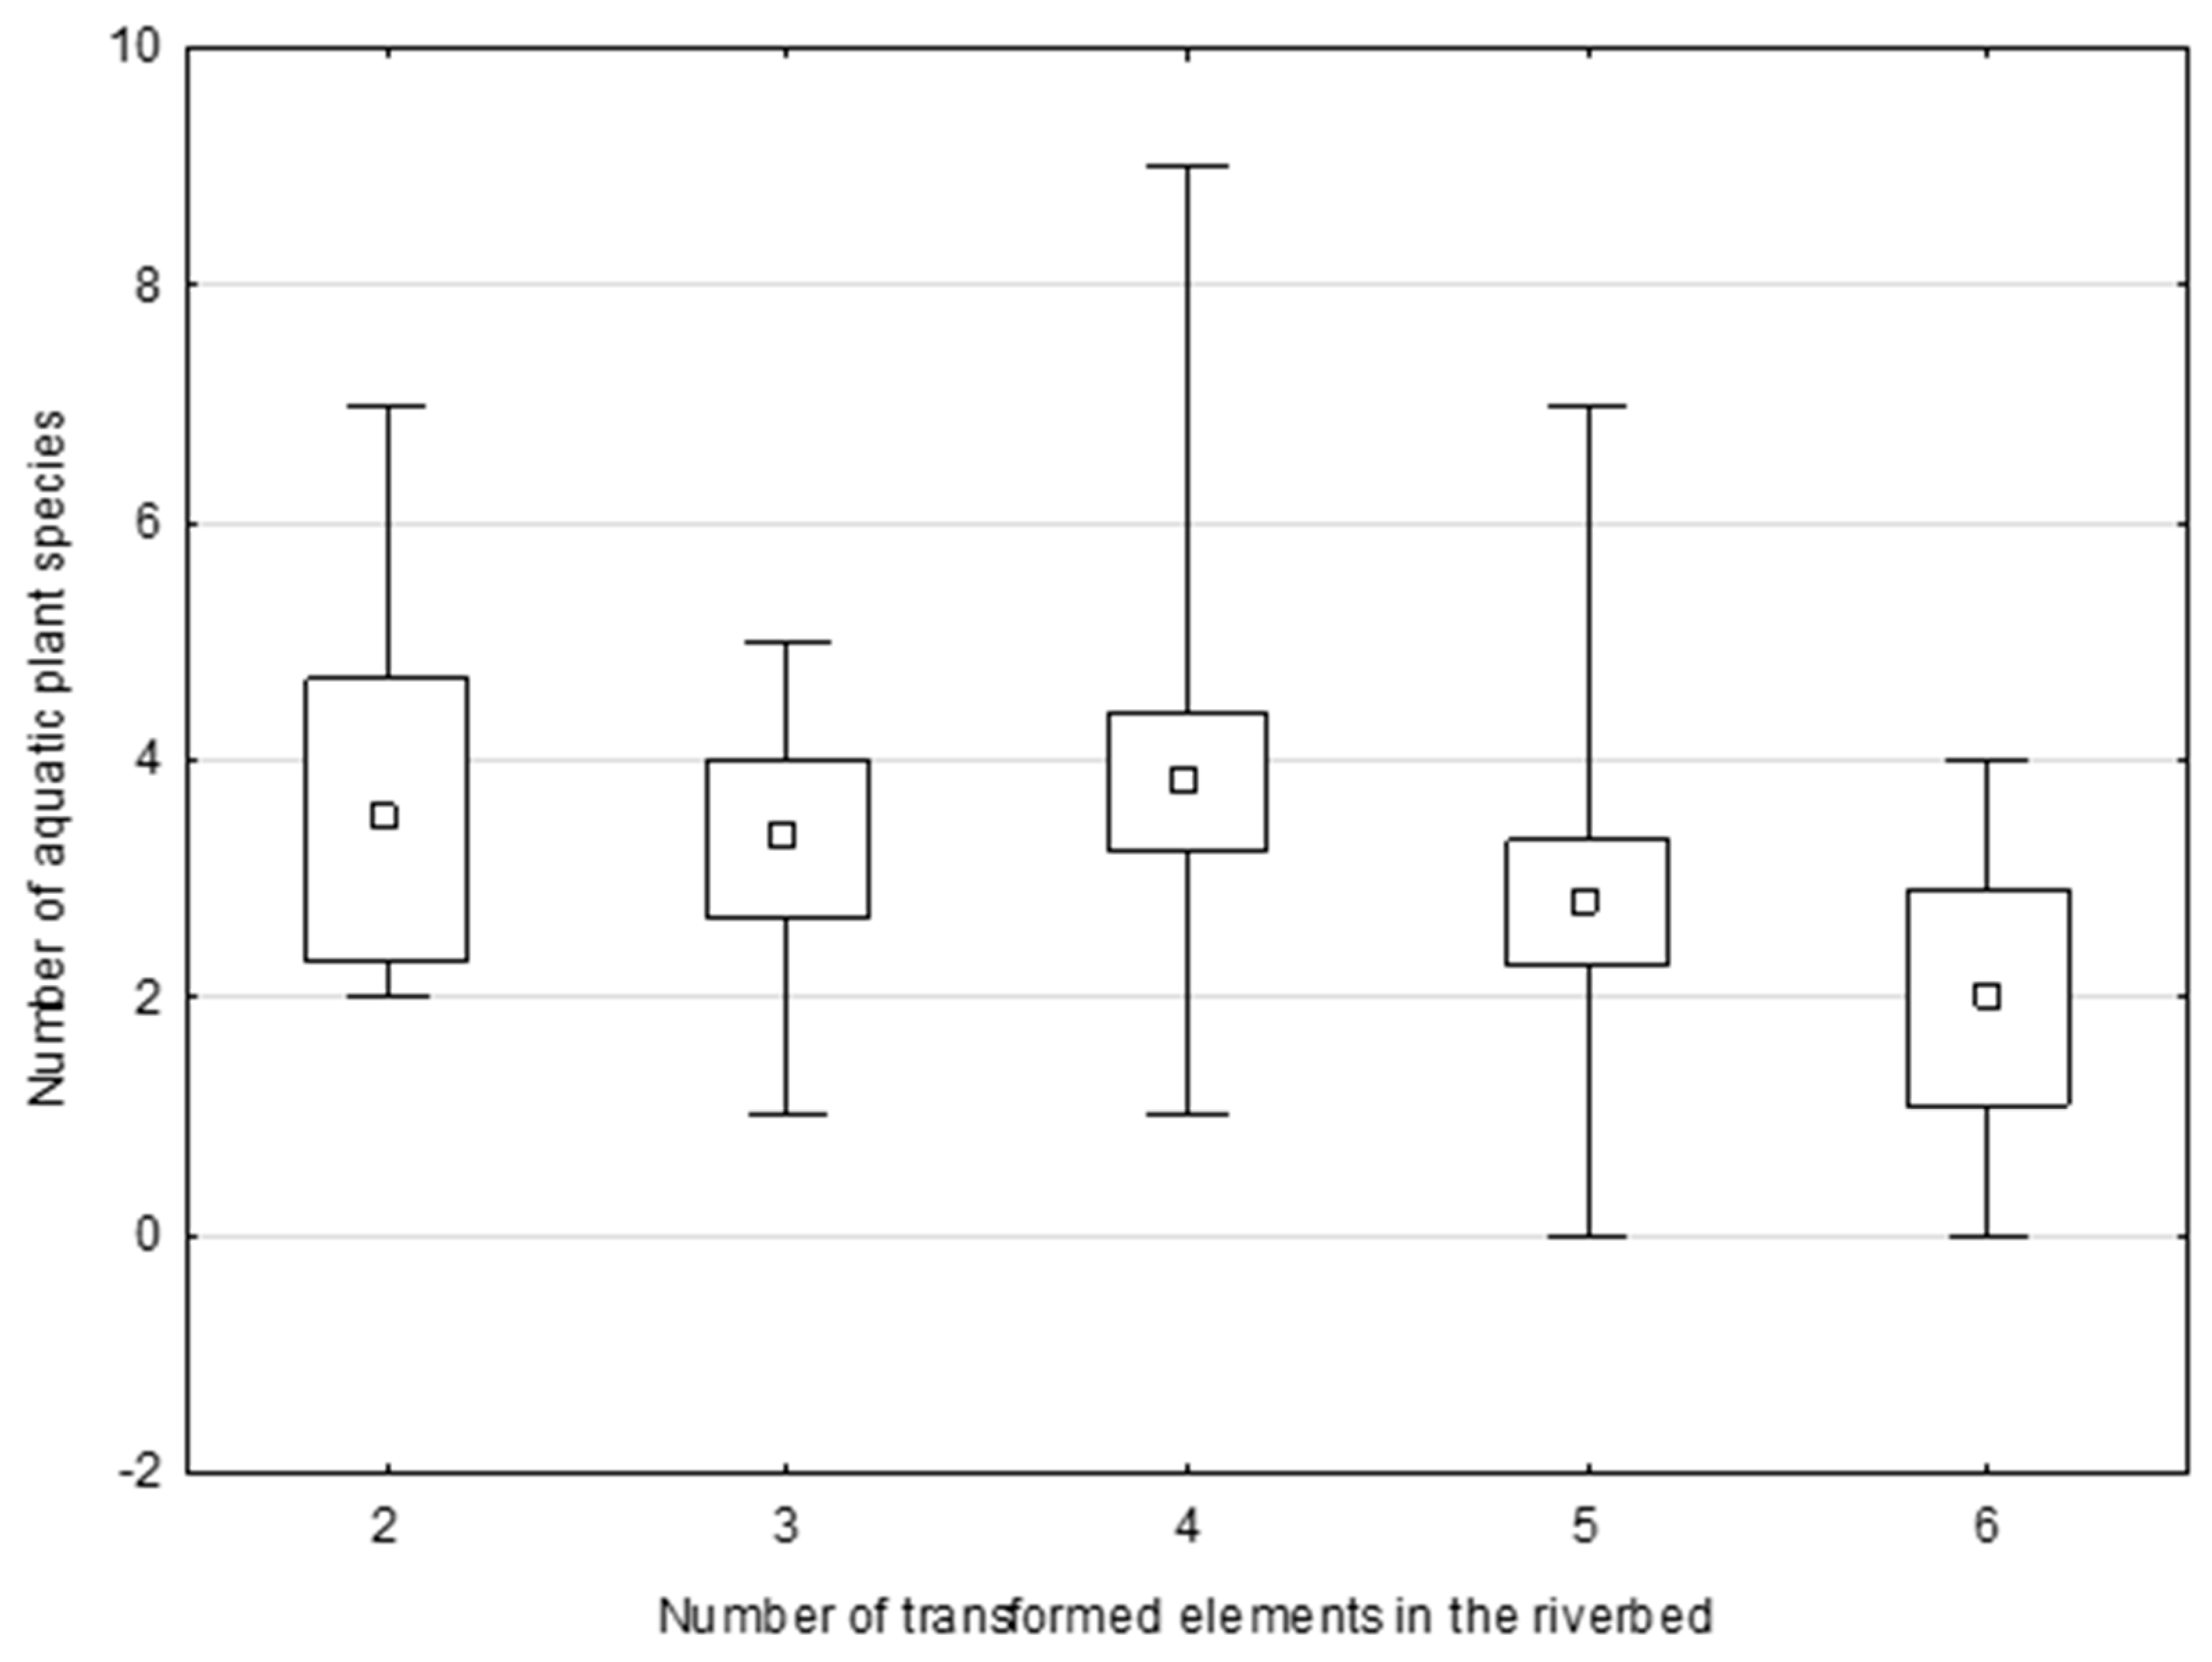
Figure 6 shows the average, minimum, and maximum values of the number of aquatic plant species in sections where two to six elements in the riverbed were transformed.
The research indicated that the number of aquatic plant species observed in the particular study sites was quite diversified, with values ranging from 0 to 9 (
Figure 6). The highest average number of species (3,8) as well as the maximum value of the number of species (9,0) were found in sections where four elements of the riverbed were transformed. This confirms the results obtained based on game theory against nature. The most often transformed elements were the following: longitudinal slope, bottom width, bank protection, and shading of the riverbed. The fewest species of aquatic plants occurred in those sections where the range of regulatory works was the largest (six transformed elements of riverbed). However, no significant correlation between the number of transformed elements and the number of aquatic plant species (
r = −0,19) was found. This may have been caused by the fact that aquatic biocenosis is only party influenced by the group of the riverbed elements that were examined. The rest comes from factors which were not taken into consideration in this study.
It is necessary to determine which elements of the riverbed should be transformed, as well as in which combination and to what extent, in order to minimize losses in aquatic plant communities. The research conducted so far shows that the most important element in regulation focused on flood protection in river areas is the decrease in the bed bottom, affecting the flow velocity, among other aspects [
68]. This is followed by riverbed width and depth, as well as embankment reinforcement [
56,
69] and bed embankment [
56]. A model was also developed to predict changes in aquatic plant communities resulting from technical intervention in the riverbed [
4]. In reality, however, the choice of the watercourse element depends on both the specific conditions and the designer’s attitude to environmental risk. Therefore, those involved in carrying out regulatory works should have the tools that will allow them to find optimal solutions, both technically and ecologically, which is a requirement of sustainable development. At present, there are no proven methods that could be used for this purpose.
This paper attempts to apply game theory to improve the decision-making process in planning regulatory works in riverbeds, where it is necessary to take into account the principles of sustainable development. Based on reviews of existing studies, it was found that the concept of games with nature had not yet been used in decision support systems for regulatory work planning. However, it had been used in decision-making processes in other water management issues [
31,
32,
33,
34,
35,
36,
37,
38,
39] and also in mining [
70,
71], in agriculture [
72], in problems of devising optimal policies for renewable resource allocation [
73], and in the assessment of the profitability of investment projects [
74]. Therefore, its usefulness can also be expected in the design of regulatory works. The obtained results indicate the possible usefulness of game against nature in decision support systems used in local-scale watercourse management that incorporate environmental considerations in assisting with river regulation planning. Moreover, the indicated set of solutions should also make it possible to assess the risk of the actions taken. The analysis conducted allowed the authors to determine a certain range of potential results, which should allow designers to determine the degree of legitimacy of their actions and to distinguish between better and worse solutions. Based on the presented method, and taking into account the current status of aquatic plant communities, the designer could choose the best river regulation variant that fully meets technical standards and concurrently ensures the protection of the watercourse ecosystem. To make the decision-making process more effective, the vulnerability of water plant communities to changes resulting from regulatory works should be taken into account. A vast knowledge about the functioning of a complex system such as a river ecosystem is also required. However, it is difficult to meet all the requirements because rivers represent a natural system created by nature and shaped by technical and natural elements, having a range of relationships between them that cause a high level of uncertainty.
This paper also presents a methodology for collecting information needed to develop a matrix, which is the basis for all the rules considered. It is the most labor-intensive stage in the whole process, time consuming and requiring appropriate substantive preparation. A simplification of this stage would be possible if designers and contractors of regulatory works were obliged to keep a register of ecological changes for the regulated sections of watercourses.


